\addauthorMeida Chenmechen@ict.usc.edu1
\addauthorQingyong Huqingyong.hu@cs.ox.ac.uk2
\addauthorZifan Yuzifanyu@asu.edu3
\addauthorHugues Thomashugues.thomas@utoronto.ca4
\addauthorAndrew Fengfeng@ict.usc.edu1
\addauthorYu Houyhou2@andrew.cmu.edu5
\addauthorKyle McCulloughmccullough@ict.usc.edu1
\addauthorFengbo Renrenfengbo@asu.edu3
\addauthorLucio SoibelmanSoibelman@usc.edu6
\addinstitution
University of Southern California
Institute for Creative Technologies
Los Angeles, CA, USA
\addinstitution
University of Oxford
Oxfordshire, UK
\addinstitution
Arizona State University
Tempe, AZ, USA
\addinstitution
University of Toronto
Institute for Aerospace Studies
Toronto, Ontario, Canada
\addinstitution
Carnegie Mellon University
Pittsburgh, PA, USA
\addinstitution
University of Southern California
Los Angeles, CA, USA
\STPLSHomePage
STPLS3D: A Large-Scale Synthetic and Real Aerial Photogrammetry 3D Point Cloud Dataset
Abstract
Although various 3D datasets with different functions and scales have been proposed recently, it remains challenging for individuals to complete the whole pipeline of large-scale data collection, sanitization, and annotation. Moreover, the created datasets usually face the challenge of extremely imbalanced class distribution or partial low-quality data samples. Motivated by this, we explore the procedurally synthetic 3D data generation paradigm to equip individuals with the full capability of creating large-scale annotated photogrammetry point clouds. Specifically, we introduce a synthetic aerial photogrammetry point clouds generation pipeline that takes full advantage of open geospatial data sources and off-the-shelf commercial packages. Unlike generating synthetic data in virtual games, where the simulated data usually have limited gaming environments created by artists, the proposed pipeline simulates the reconstruction process of the real environment by following the same UAV flight pattern on different synthetic terrain shapes and building densities, which ensure similar quality, noise pattern, and diversity with real data. In addition, the precise semantic and instance annotations can be generated fully automatically, avoiding the expensive and time-consuming manual annotation. Based on the proposed pipeline, we present a richly-annotated synthetic 3D aerial photogrammetry point cloud dataset, termed STPLS3D, with more than 16 of landscapes and up to 18 fine-grained semantic categories. For verification purposes, we also provide datasets collected from four areas in the real environment. Extensive experiments conducted on our datasets demonstrate the effectiveness and quality of the proposed synthetic dataset.
1 Introduction
Small Unmanned Aerial Vehicle (sUAV) and photogrammetry technologies have witnessed dramatic development over the past few years, enabling rapid reconstruction of large terrain with several square kilometers. Compared with the airborne LiDAR mapping [Zolanvari et al.(2019)Zolanvari, Ruano, Rana, Cummins, da Silva, Rahbar, and Smolic, Varney et al.(2020)Varney, Asari, and Graehling, Ye et al.(2020)Ye, Xu, Huang, Tong, Li, Liu, Luan, Hoegner, and Stilla], aerial photogrammetry offers an affordable solution for 3D mapping, hence attracting widespread attention from both researchers and industry practitioners for various applications [Hou et al.(2021b)Hou, Chen, Volk, and Soibelman, Chen et al.(2020d)Chen, Feng, McCullough, Prasad, McAlinden, and Soibelman, Hou et al.(2021a)Hou, Chen, Volk, and Soibelman, Shi et al.(2021)Shi, Kang, Xia, Tyagi, Mehta, and Du]. Recently, a handful of works [Hu et al.(2021a)Hu, Yang, Khalid, Xiao, Trigoni, and Markham, Thomas et al.(2019)Thomas, Qi, Deschaud, Marcotegui, Goulette, and Guibas, Hu et al.(2020)Hu, Yang, Xie, Rosa, Guo, Wang, Trigoni, and Markham, Fan et al.(2021)Fan, Dong, Zhu, Lv, Ye, and Wang, Landrieu and Simonovsky(2018), Qiu et al.(2021)Qiu, Anwar, and Barnes, Hu et al.(2021b)Hu, Yang, Xie, Rosa, Guo, Wang, Trigoni, and Markham, Hu et al.(2022a)Hu, Yang, Fang, Guo, Leonardis, Trigoni, and Markham, Chen et al.(2021a)Chen, Feng, Hou, McCullough, Prasad, and Soibelman, Chen et al.(2020a)Chen, Feng, McAlinden, and Soibelman, Chen et al.(2020e)Chen, Feng, McCullough, Prasad, McAlinden, Soibelman, and Enloe] have started to explore the semantic understanding of large-scale 3D point clouds, with promising results and insightful conclusions achieved.
Although a number of 3D datasets [Richter et al.(2016)Richter, Vineet, Roth, and Koltun, Hackel et al.(2017)Hackel, Savinov, Ladicky, Wegner, Schindler, and Pollefeys, De Deuge et al.(2013)De Deuge, Quadros, Hung, and Douillard, Munoz et al.(2009a)Munoz, Bagnell, Vandapel, and Hebert, Vallet et al.(2015)Vallet, Brédif, Serna, Marcotegui, and Paparoditis, Roynard et al.(2018)Roynard, Deschaud, and Goulette, Behley et al.(2019)Behley, Garbade, Milioto, Quenzel, Behnke, Stachniss, and Gall, Tan et al.(2020)Tan, Qin, Ma, Li, Du, Cai, Yang, and Li, Rottensteiner et al.(2012)Rottensteiner, Sohn, Jung, Gerke, Baillard, Benitez, and Breitkopf, Zolanvari et al.(2019)Zolanvari, Ruano, Rana, Cummins, da Silva, Rahbar, and Smolic, Varney et al.(2020)Varney, Asari, and Graehling, Ye et al.(2020)Ye, Xu, Huang, Tong, Li, Liu, Luan, Hoegner, and Stilla, Scharwächter et al.(2013)Scharwächter, Enzweiler, Franke, and Roth, Geyer et al.(2020)Geyer, Kassahun, Mahmudi, Ricou, Durgesh, Chung, Hauswald, Pham, Mühlegg, Dorn, et al., Hu et al.(2021a)Hu, Yang, Khalid, Xiao, Trigoni, and Markham, Li et al.(2020)Li, Li, Tong, Lim, Yuan, Wu, Tang, and Huang, Can et al.(2021)Can, Mantegazza, Abbate, Chappuis, and Giusti, Griffiths and Boehm(2019), Hu et al.(2022b)Hu, Yang, Khalid, Xiao, Trigoni, and Markham] have been proposed in the last decades, it remains highly challenging for individuals to complete the whole pipeline of the customized dataset production independently for three reasons. 1) The annotation of large-scale 3D data is labor-intensive and time-consuming. In contrast to 2D data annotation, annotating 3D data such as point clouds requires extensive training to navigate and operate in the 3D environment [Hackel et al.(2017)Hackel, Savinov, Ladicky, Wegner, Schindler, and Pollefeys]. 2) Due to the limitations of hardware configurations (e.g., availability of gimbal) and survey constraints (e.g., flight altitudes and overlaps between images), the reconstructed point clouds are usually relatively small in size or have low-quality data samples (non-uniform density, holes, outliers, etc.), which may have a negative impact on the execution of subsequent tasks. 3) Considering the long-tail distribution of objects in the real world, the created datasets are likely to suffer from extremely imbalanced class distribution, which poses extra challenges for downstream tasks such as semantic understanding [Hu et al.(2021a)Hu, Yang, Khalid, Xiao, Trigoni, and Markham].
Motivated by this, we develop a fully automatic pipeline for controllable, high-quality, and photorealistic synthetic aerial photogrammetry 3D data generation. In particular, the rich annotations, including semantic and instance labels, can be generated effortlessly as byproducts of our pipeline. Specifically, the proposed data generation pipeline has the following appealing advantages: 1) Unlike other virtual gaming engine-based generation approaches [Richter et al.(2016)Richter, Vineet, Roth, and Koltun, Gaidon et al.(2016)Gaidon, Wang, Cabon, and Vig], where only limited gaming environments created by artists are used, our pipeline fully exploits existing open geospatial data sources to set up the 3D environment, with a large variety of authentic terrain shapes and building densities. 2) Considering the homogeneous architectural styles and construction materials in real-world environments, we leverage procedural modeling tools to create building models with variations and adapted different material databases to enrich the diversity of building appearances. 3) We explicitly balance the class distribution in the real world by heuristically placing 3D models of underrepresented objects in virtual environments. 4) Lastly, instead of random points sampling or ray casting [Gaidon et al.(2016)Gaidon, Wang, Cabon, and Vig, Ros et al.(2016)Ros, Sellart, Materzynska, Vazquez, and Lopez, Yue et al.(2018)Yue, Wu, Seshia, Keutzer, and Sangiovanni-Vincentelli] on the 3D surfaces, we simulate similar UAV paths over the virtual terrain as the real-world survey, followed by the photogrammetry steps to reconstruct the 3D point clouds. This ensures that the generated 3D point clouds from our pipeline have similar quality and even comparable noise as real-world aerial photogrammetry data since the exact same data collection and reconstruction processes are executed.
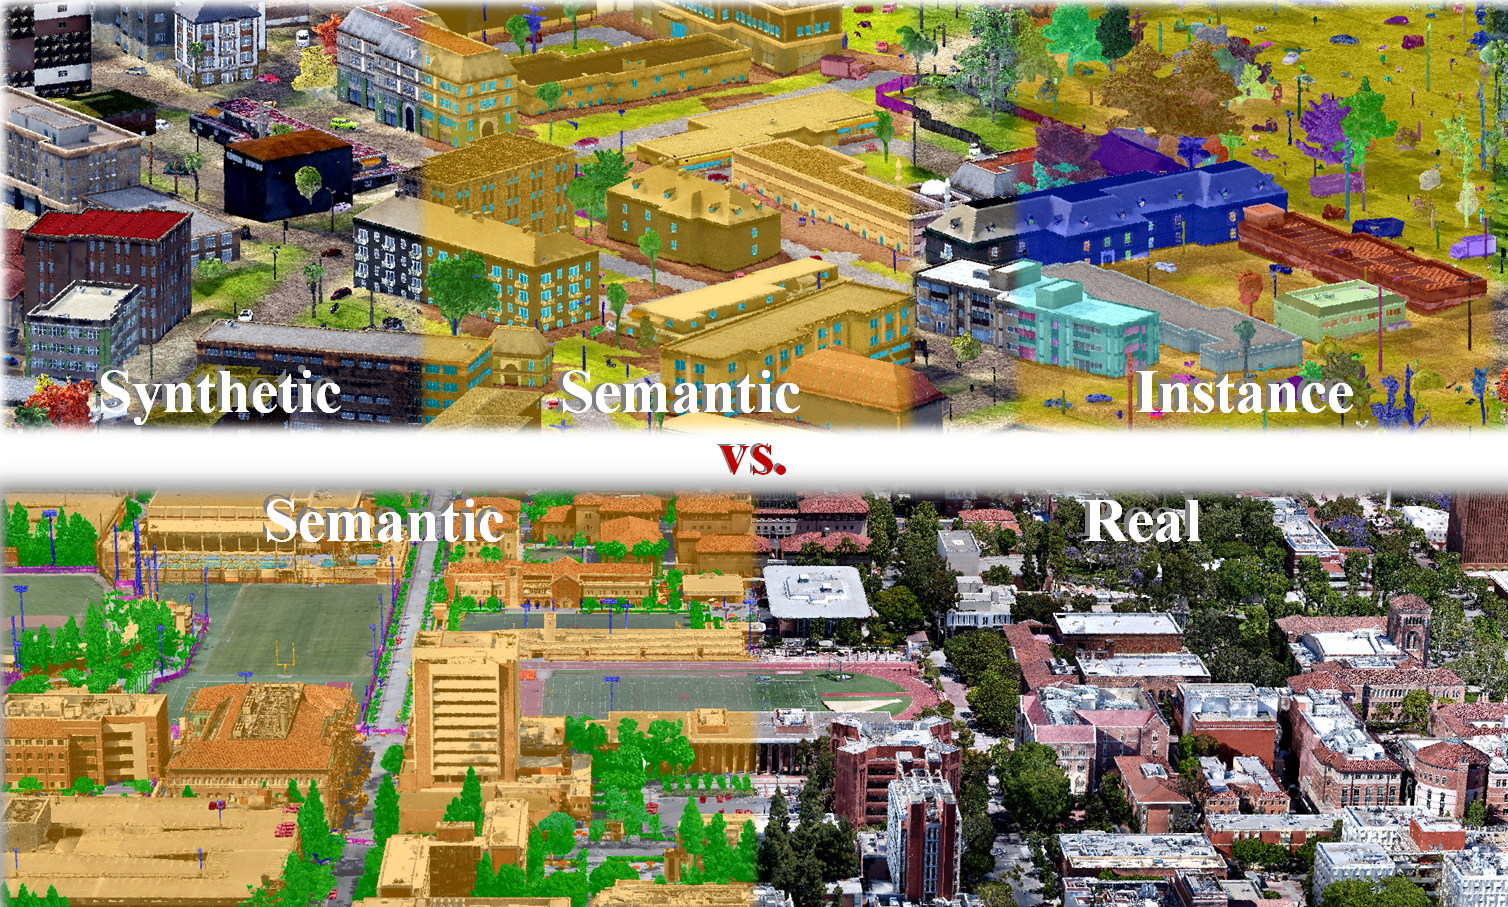
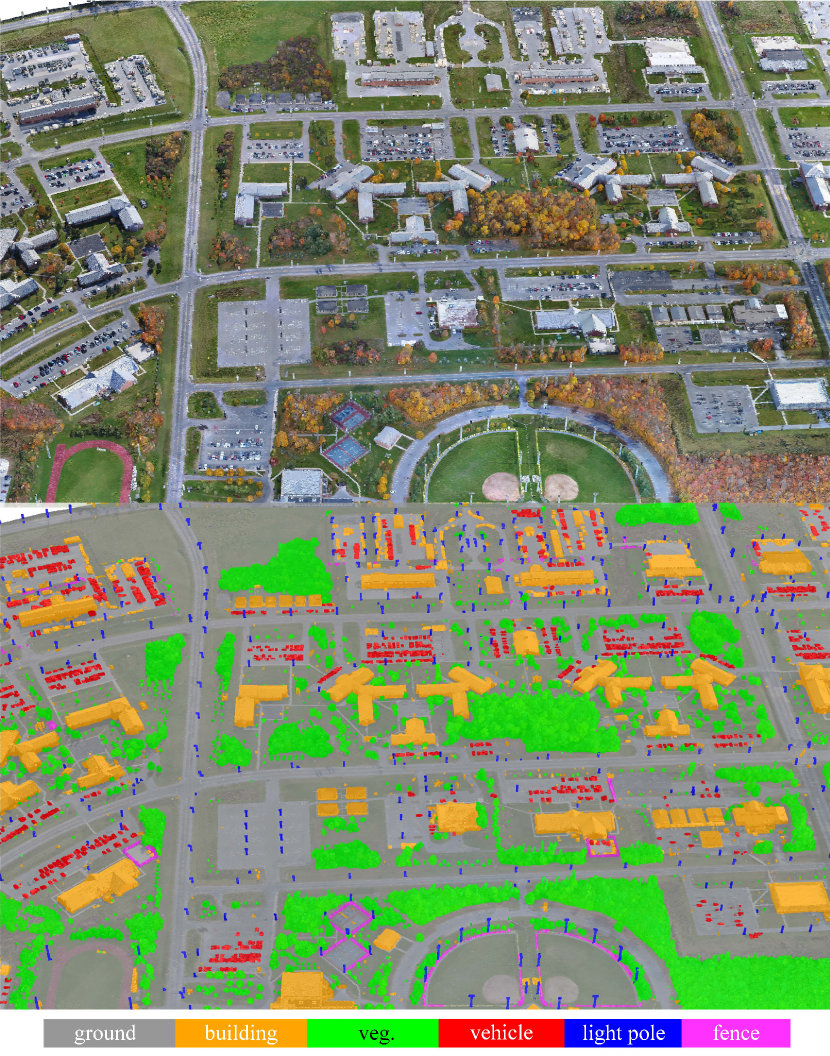
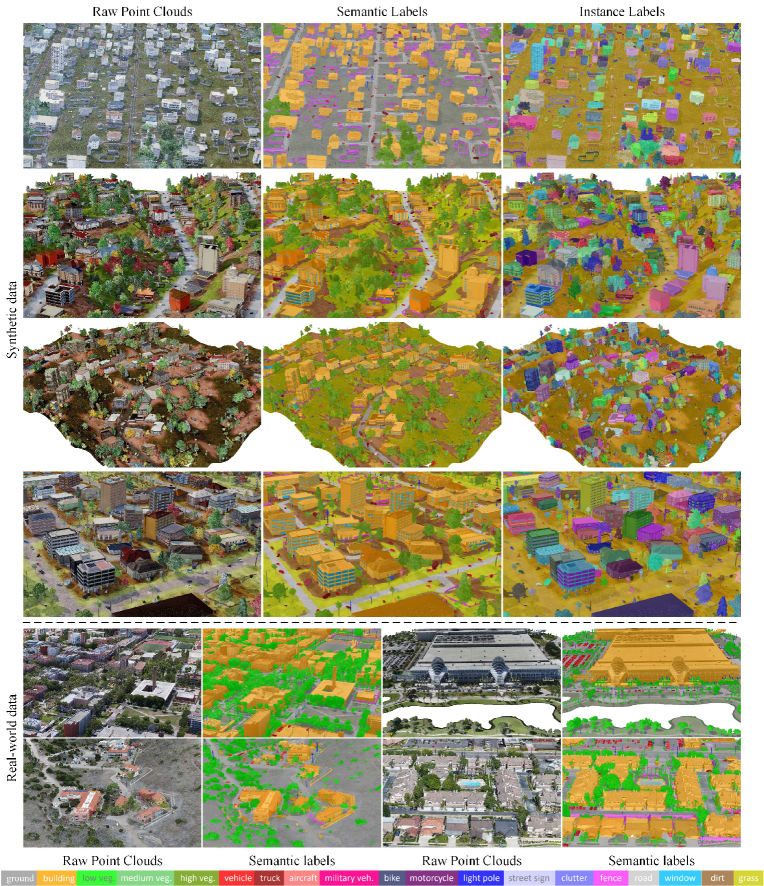
With the proposed synthetic data generation pipeline, we have further built a large-scale photogrammetry 3D point cloud dataset, termed Semantic Terrain Points Labeling - Synthetic 3D (STPLS3D), which is composed of high-quality, rich-annotated point clouds from real and synthetic environments, as shown in Figure 1. Specifically, we first collect real-world aerial images using photogrammetry best practices with quadcopter drone flight at a low altitude with significant overlaps between adjacent photos. We then reconstructed point clouds with a 1.27 landscape following the standard photogrammetry pipeline. Next, we follow the same UAV path and flying pattern to generate 62 synthetic point clouds with different architectural styles, vegetation types, and terrain shapes. The synthetic dataset covers about 16 of the city landscape, with up to 18 fine-grained semantic classes and 14 instance classes. Extensive experiments were conducted on our STPLS3D dataset to validate the quality and function of the synthetic dataset. In particular, by incorporating our synthetic dataset into the training pipeline, existing deep neural architectures can achieve visible improvement on the real data, even without adopting any domain adaptation techniques. To summarize, the main contributions of our paper are listed as follows:
-
•
We built a unique, richly-annotated large-scale photogrammetry point clouds dataset with synthetic and real subsets, covering more than 17 of the city landscape.
-
•
We introduce a fully automatic pipeline for controllable, high-quality, and photorealistic synthetic aerial photogrammetry 3D data generation.
-
•
Extensive experiments demonstrate the quality and function of the generated synthetic data.
2 Related works
Here, we provide a brief overview of existing 3D datasets; for comprehensive surveys, please refer to [Gao et al.(2021)Gao, Pan, Li, Geng, and Zhao, Varney et al.(2020)Varney, Asari, and Graehling, Ye et al.(2020)Ye, Xu, Huang, Tong, Li, Liu, Luan, Hoegner, and Stilla, Hu et al.(2021a)Hu, Yang, Khalid, Xiao, Trigoni, and Markham, Li et al.(2020)Li, Li, Tong, Lim, Yuan, Wu, Tang, and Huang, Guo et al.(2020)Guo, Wang, Hu, Liu, Liu, and Bennamoun]. 3D Real-World Datasets. Thanks to the development of remote sensing technologies, considerable efforts have been devoted to building 3D datasets and benchmarks for semantic understanding. To capture 3D rich geometry of the real environments, previous works usually adopted RGB-D sensors [Silberman et al.(2012)Silberman, Hoiem, Kohli, and Fergus, Chang et al.(2017)Chang, Dai, Funkhouser, Halber, Niessner, Savva, Song, Zeng, and Zhang, Armeni et al.(2017)Armeni, Sax, Zamir, and Savarese, Dai et al.(2017)Dai, Chang, Savva, Halber, Funkhouser, and Nießner, Uy et al.(2019)Uy, Pham, Hua, Nguyen, and Yeung, Song et al.(2015)Song, Lichtenberg, and Xiao] for indoor 3D scenes and utilized terrestrial scanners [Hackel et al.(2017)Hackel, Savinov, Ladicky, Wegner, Schindler, and Pollefeys, Munoz et al.(2009a)Munoz, Bagnell, Vandapel, and Hebert, Munoz et al.(2009b)Munoz, Bagnell, Vandapel, and Hebert], mobile scanners [De Deuge et al.(2013)De Deuge, Quadros, Hung, and Douillard, Serna et al.(2014)Serna, Marcotegui, Goulette, and Deschaud, Vallet et al.(2015)Vallet, Brédif, Serna, Marcotegui, and Paparoditis, Roynard et al.(2018)Roynard, Deschaud, and Goulette, Behley et al.(2019)Behley, Garbade, Milioto, Quenzel, Behnke, Stachniss, and Gall, Tan et al.(2020)Tan, Qin, Ma, Li, Du, Cai, Yang, and Li, Geyer et al.(2020)Geyer, Kassahun, Mahmudi, Ricou, Durgesh, Chung, Hauswald, Pham, Mühlegg, Dorn, et al., Chang et al.(2019)Chang, Lambert, Sangkloy, Singh, Bak, Hartnett, Wang, Carr, Lucey, Ramanan, et al., Pan et al.(2020)Pan, Gao, Mei, Geng, Li, and Zhao, Caesar et al.(2020)Caesar, Bankiti, Lang, Vora, Liong, Xu, Krishnan, Pan, Baldan, and Beijbom, Tong et al.(2020)Tong, Li, Chen, Sun, Cao, and Xiang, Sun et al.(2020)Sun, Kretzschmar, Dotiwalla, Chouard, Patnaik, Tsui, Guo, Zhou, Chai, Caine, Vasudevan, Han, Ngiam, Zhao, Timofeev, Ettinger, Krivokon, Gao, Joshi, Zhang, Shlens, Chen, and Anguelov], and aerial laser scanners[Rottensteiner et al.(2012)Rottensteiner, Sohn, Jung, Gerke, Baillard, Benitez, and Breitkopf, Zolanvari et al.(2019)Zolanvari, Ruano, Rana, Cummins, da Silva, Rahbar, and Smolic, Varney et al.(2020)Varney, Asari, and Graehling, Ye et al.(2020)Ye, Xu, Huang, Tong, Li, Liu, Luan, Hoegner, and Stilla, Kölle et al.(2021)Kölle, Laupheimer, Schmohl, Haala, Rottensteiner, Wegner, and Ledoux] for outdoor environments. Additionally, researchers from remote sensing communities also collected large-scale 3D scene-based datasets (e.g., construction sites) [Yang et al.(2015)Yang, Park, Vela, and Golparvar-Fard, Ham et al.(2016)Ham, Han, Lin, and Golparvar-Fard] through photogrammetry techniques with quadcopter drones and fixed-wing UAVs as the main platform. In particular, a handful of recent works have started to mount multiple sensors together on UAVs for efficient data collection in a large district [Hou et al.(2021a)Hou, Chen, Volk, and Soibelman, López et al.(2021)López, Jurado, Ogayar, and Feito, Benz et al.(2021)Benz, Taraben, Debus, Habte, Oppermann, Hallermann, Voelker, Rodehorst, and Morgenthal]. Overall, the scale of recent datasets has become increasingly large, and the content covers sufficient information for multiple purposes. However, due to the survey configuration and the specific photogrammetry software [Hu et al.(2021a)Hu, Yang, Khalid, Xiao, Trigoni, and Markham, Li et al.(2020)Li, Li, Tong, Lim, Yuan, Wu, Tang, and Huang] used, noticeable drawbacks could be found in the existing released datasets, such as missing points on the vertical surfaces, large holes, and non-uniform point density, etc. In addition, insufficient and incorrect annotations are another common issue that could deteriorate the quality of the dataset, further leading to the inability to fairly and comprehensively evaluate the performance of deep neural models for subsequent tasks.
| Name and Reference | # Semantic | # Instance1 | # Views / scenes | 2D Annotations | Area2 () | Sensor |
| DublinCity [Zolanvari et al.(2019)Zolanvari, Ruano, Rana, Cummins, da Silva, Rahbar, and Smolic] | 13 | No | 8,504 / 2 | No | 2 | Aerial LiDAR |
| DALES [Varney et al.(2020)Varney, Asari, and Graehling] | 8 | No | 1 large scene | - | 10 | |
| LASDU [Ye et al.(2020)Ye, Xu, Huang, Tong, Li, Liu, Luan, Hoegner, and Stilla] | 5 | No | 1 scene | - | 1.02 | |
| Swiss3DCities [Can et al.(2021)Can, Mantegazza, Abbate, Chappuis, and Giusti] | 5 | No | 3 scenes | No | 2.7 | quadcopter + photogrammetry |
| Campus3D [Li et al.(2020)Li, Li, Tong, Lim, Yuan, Wu, Tang, and Huang] | 14 | 4 classes | 6 scenes | No | 1.58 | quadcopter + photogrammetry |
| SensatUrban [Hu et al.(2021a)Hu, Yang, Khalid, Xiao, Trigoni, and Markham] | 13 | No | 3 scenes | No | 4.4 | fixed wing + photogrammetry |
| \cdashline1-7 STPLS3D - Real | 6 | No | 16,376 / 4 | Yes | 1.27 | quadcopter + photogrammetry |
| STPLS3D - SyntheticV1 | 5 | No | 17,164 / 14 | Yes | 4.22 | Synthetic Aerial photogrammetry |
| STPLS3D - SyntheticV2 | 17 | 14 classes | 13,229 / 24 | Yes | 5.76 | Synthetic Aerial photogrammetry |
| STPLS3D - SyntheticV3 | 18 | 14 classes | 15,888 / 25 | Yes | 6 | Synthetic Aerial photogrammetry |
3D Synthetic Datasets. Due to the expensive data collection and annotation costs, several works have explored the possibility of creating replaceable 3D synthetic data. Specifically, earlier works typically focused on creating synthetic point clouds for individual objects [Chang et al.(2015)Chang, Funkhouser, Guibas, Hanrahan, Huang, Li, Savarese, Savva, Song, Su, Xiao, Yi, and Yu, Mo et al.(2019)Mo, Zhu, Chang, Yi, Tripathi, Guibas, and Su, Peng et al.(2020)Peng, Usman, Saito, Kaushik, Hoffman, and Saenko, Wu et al.(2015)Wu, Song, Khosla, Yu, Zhang, Tang, and Xiao, Yi et al.(2016)Yi, Kim, Ceylan, Shen, Yan, Su, Lu, Huang, Sheffer, and Guibas], while recent works have started to investigate the synthetic generation of the outdoor 3D point clouds in virtual gaming environments [Richter et al.(2016)Richter, Vineet, Roth, and Koltun, Griffiths and Boehm(2019), Gaidon et al.(2016)Gaidon, Wang, Cabon, and Vig, Ros et al.(2016)Ros, Sellart, Materzynska, Vazquez, and Lopez, Dosovitskiy et al.(2017)Dosovitskiy, Ros, Codevilla, Lopez, and Koltun, Johnson-Roberson et al.(2017)Johnson-Roberson, Barto, Mehta, Sridhar, Rosaen, and Vasudevan, Yue et al.(2018)Yue, Wu, Seshia, Keutzer, and Sangiovanni-Vincentelli, Chen et al.(2020c)Chen, Feng, McCullough, Prasad, McAlinden, and Soibelman, Xiao et al.(2021)Xiao, Huang, Guan, Zhan, and Lu, Le et al.(2021)Le, Das, Mensink, Karaoglu, and Gevers]. However, the geometrical structure, noise pattern, and sampling scheme of these datasets are still different from the real environment, leading to visible domain gaps. Additionally, since the gaming environments were manually created by artists and designers, the spatial scale of existing synthetic datasets is also limited. By contrast, we explore the outdoor large-scale 3D scene synthesis from aerial views and photogrammetry techniques with procedurally generated virtual environments. Table 1 compares the statistics of the proposed STPLS3D with a number of existing aerial 3D datasets.
3 Synthetic Data Generation Pipeline
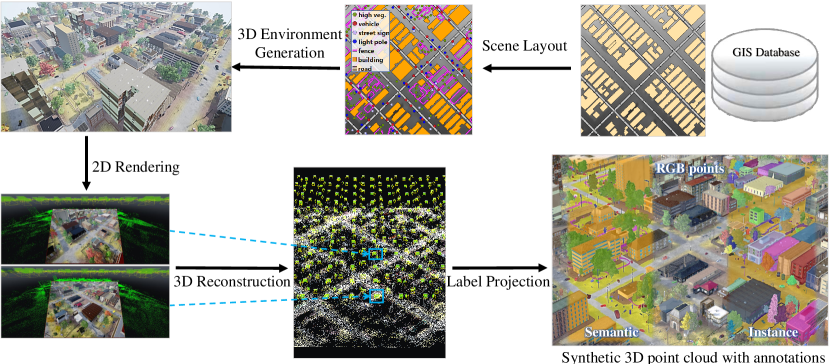
The synthetic data generation pipeline is illustrated in Figure 2. Overall, the main idea is to replicate the steps one would take when creating aerial photogrammetry point clouds in the real world. In particular, we focused on bringing 3D virtual assets in the simulation that is close to reality and reconstructing point clouds with similar quality as the real ones to minimize the domain gap between synthetic and real data as much as possible.
3.1 Procedural 3D Environment Generation
To ensure the placements of objects in the virtual environments roughly follow the form of a real city block, we built 3D virtual environments based on the Geographic Information System (GIS) data sources [Gesch et al.(2009)Gesch, Evans, Mauck, Hutchinson, Carswell Jr, et al.] (i.e., building footprints, road networks, and digital surface models) that are publicly available. Specifically, 3D road segments are placed and extended along the road vectors obtained from the Open Street Map (OSM) [Haklay and Weber(2008)]. 3D trees, vehicles, and other city furniture are placed in the scene using predefined strategies to increase its realism and diversity. Distance constraints are also heuristically introduced during object placements to avoid unrealistic situations such as the intersection between objects. Additionally, such constraints are also used to ensure the locations of each object are contextually reasonable, i.e., the vehicles, street signs, and light poles will be on or near the roads. Besides, placing the trees pure randomly throughout the environment may produce unnatural results. Therefore, trees are placed in clusters within polygonal areas procedurally generated as boundaries to simulate forests. In addition, individual trees are also placed around the buildings within a buffer to simulate the residential blocks. Please refer to Appendix D for more details on our designed object placement principles.
This study used Computer Generated Architectural (CGA) shape grammar of CityEngine-based tools to create 3D building models based on the OSM building footprints. The procedural tool automatically extruded the footprints and added architectural elements. The overall façades generation and architectural element placements allow various types of 3D buildings to be generated from the same building footprint with different predefined CGA rules. Both the building types and heights were randomly assigned during the building generation process to ensure the synthetic environments cover a large spectrum of building variations.
3.2 2D Image Rendering and 3D Reconstructions
The naive solution to generating a point cloud with the created 3D environments would be either directly sampling points on the 3D model surface or using a ray casting approach with predefined camera parameters. However, it produces point clouds that perfectly match the 3D virtual environment, which does not have the same quality and noise level as the data that was collected from the real world. To reduce the domain gap that exists between the sampled or ray-casted points and the real-world aerial photogrammetry point clouds, we propose to first render the 2D images in Unreal Engine 4 (UE4) using the AirSim simulator [Shah et al.(2018)Shah, Dey, Lovett, and Kapoor]. In particular, we utilized weather effects to simulate fog, wind and changing sunlight directions, so as to generate more realistic 2D images from the virtual environment. With the rendered 2D images, we then reconstructed the 3D point clouds using the off-the-shelf commercial photogrammetry software (i.e., Bentley ContextCapture). In particular, we keep the software consistent with that of reconstructing point clouds from real-world photos. Please refer to Appendix C for the intuitive quality comparison between the ray-casting 3D points, the synthetic photogrammetric points, and the real-world photogrammetric point clouds.
3.3 Semantic and Instance Annotation
Finally, the generated synthetic point clouds are enriched with semantic and instance annotations that are automatically generated while rendering the 2D images. Note that, due to the noises introduced from the photogrammetry reconstruction process, directly casting the 2D labels to the photogrammetry point cloud will create misaligned annotations. To this end, we transfer the rendered 2D annotations to the photogrammetry point clouds with the following two steps. First, we create a proxy 3D point cloud using the ray casting method with the known intrinsic and extrinsic camera parameters and depth maps. Next, we transfer the labels from the proxy 3D point cloud to the photogrammetry points through a nearest-neighbor search algorithm, with the constraint that ground points are connected to form a large connected component and reduce the inconsistent projections due to the simulated wind effects. Though a small amount of mislabeled points may still occur at the boundaries between different objects, they did not have a significant impact while training the segmentation models in our experiments.
As shown in Figure 2, the proposed pipeline can generate synthetic point clouds with semantic and instance annotations. It is worth mentioning that the instance annotations are very useful for tasks such as vegetation identification (e.g., tree segmentation [Erikson(2003)]) and forest management (e.g., automatic tree counting [Li et al.(2017)Li, Fu, Yu, and Cracknell]) since it is highly challenging or even infeasible to obtain precise instance labels in the real data (e.g., hundreds of thousands of overlapped trees need to be manually segmented from forest areas).
4 Datasets
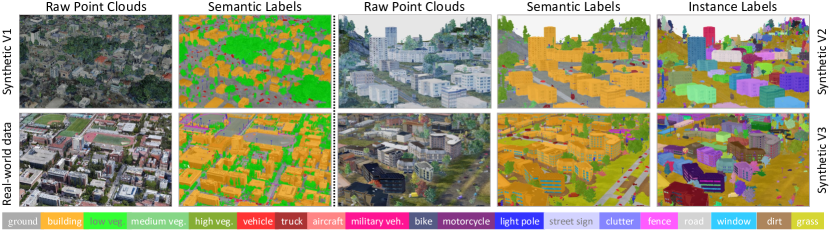
We first conducted surveys on four real-world sites, including the University of Southern California Park Campus (USC), Wrigley Marine Science Center (WMSC) located on Catalina Island, Orange County Convention Center (OCCC), and a residential area (RA). The aerial images were collected using a crosshatch-type flight pattern with predefined overlaps ranging from 75%85% and flight altitudes ranging from 25m70m. The 3D data were reconstructed using a standard photogrammetric process and manually annotated with one of the six semantic class labels. Following that, we used our designed synthetic data generation pipeline with the same UAV flight pattern to generate an extra 62 synthetic point clouds in a wide variety of synthetic environments. In particular, three versions of the synthetic datasets were generated with different focuses. Examples of different versions of the synthetic data and real data are shown in Figure 3. Please refer to Appendix B and I for detailed discussions of our released datasets and the available semantic labels.
4.1 Comparison
We provide an empirical comparison of the cost to collect the 3D data in real-world and virtual environments. Specifically, the real-world data (1.27 ) was collected with over four months of team efforts for data collection (including getting flight permits, planning and repeatedly executing the data collection process), processing, and annotation. By contrast, the synthetic data (16 ) was generated by a single person using one desktop PC within a month (with an Intel Core™ i9-10900X CPU and an NVIDIA RTX 3090 with 24G memory). In particular, the time cost for synthetic data generation is not constrained by available workforce talent and can be parallel accelerated with additional computing resources.
5 Experiments
5.1 Evaluation of 3D Semantic segmentation
We selected five representative approaches, including PointTransformer [Zhao et al.(2021)Zhao, Jiang, Jia, Torr, and Koltun], RandLA-Net [Hu et al.(2020)Hu, Yang, Xie, Rosa, Guo, Wang, Trigoni, and Markham], SCF-Net [Fan et al.(2021)Fan, Dong, Zhu, Lv, Ye, and Wang], MinkowskiNet [Choy et al.(2019)Choy, Gwak, and Savarese], and KPConv [Thomas et al.(2019)Thomas, Qi, Deschaud, Marcotegui, Goulette, and Guibas], as the baselines to build a semantic segmentation benchmark in our STPLS3D. Specifically, we used the original architectures of these approaches and only adapted the data-related hyperparameters to our dataset (see Appendix H). The mean Intersection-over-Union (mIoU) and Overall Accuracy (oAcc) are used as the evaluation metrics. Note that the semantic categories of the synthetic datasets are inconsistent with the real-world dataset (18 vs. 6); see Appendix J for details of the class mapping.
Three groups of experiments were conducted to investigate whether and how synthetic data impact the semantic segmentation performance of real-world data. Note that all three groups of experiments are tested on the test set of the real-world dataset (i.e., WMSC split), but trained with different settings: 1) Train in the real-world training set. 2) Train in synthetic datasets (V1-V3) only. 3) Train in both real and synthetic datasets.
| Training sets | Methods | mIoU (%) | oAcc (%) | Per Class IoU (%) | |||||
| Ground | Building | Tree | Car | Light pole | Fence | ||||
| Real subsets | PointTransformer [Zhao et al.(2021)Zhao, Jiang, Jia, Torr, and Koltun] | 36.27 | 54.31 | 39.95 | 20.88 | 62.57 | 36.13 | 49.32 | 8.76 |
| RandLA-Net [Hu et al.(2020)Hu, Yang, Xie, Rosa, Guo, Wang, Trigoni, and Markham] | 42.33 | 60.19 | 46.13 | 24.23 | 72.46 | 53.37 | 44.82 | 12.95 | |
| SCF-Net [Fan et al.(2021)Fan, Dong, Zhu, Lv, Ye, and Wang] | 45.93 | 75.75 | 68.77 | 37.27 | 65.49 | 51.50 | 31.22 | 21.34 | |
| MinkowskiNet [Choy et al.(2019)Choy, Gwak, and Savarese] | 46.52 | 70.44 | 64.22 | 29.95 | 61.33 | 45.96 | 65.25 | 12.43 | |
| KPConv [Thomas et al.(2019)Thomas, Qi, Deschaud, Marcotegui, Goulette, and Guibas] | 45.22 | 70.67 | 60.87 | 32.13 | 69.05 | 53.80 | 52.08 | 3.40 | |
| \hdashlineSynthetic subsets | PointTransformer [Zhao et al.(2021)Zhao, Jiang, Jia, Torr, and Koltun] | 45.73 | 86.76 | 84.12 | 73.37 | 60.60 | 16.96 | 27.23 | 12.10 |
| RandLA-Net [Hu et al.(2020)Hu, Yang, Xie, Rosa, Guo, Wang, Trigoni, and Markham] | 45.03 | 81.30 | 76.78 | 57.74 | 56.08 | 28.44 | 40.36 | 10.78 | |
| SCF-Net [Fan et al.(2021)Fan, Dong, Zhu, Lv, Ye, and Wang] | 47.82 | 82.69 | 77.51 | 68.68 | 56.81 | 29.87 | 42.53 | 11.52 | |
| MinkowskiNet [Choy et al.(2019)Choy, Gwak, and Savarese] | 50.78 | 87.64 | 85.23 | 72.66 | 64.80 | 31.31 | 36.85 | 13.83 | |
| KPConv [Thomas et al.(2019)Thomas, Qi, Deschaud, Marcotegui, Goulette, and Guibas] | 49.16 | 88.08 | 85.50 | 70.65 | 63.84 | 28.75 | 32.97 | 13.22 | |
| \hdashlineReal+Synthetic | PointTransformer [Zhao et al.(2021)Zhao, Jiang, Jia, Torr, and Koltun] | 47.64 | 84.37 | 80.19 | 76.35 | 57.13 | 36.35 | 23.72 | 12.10 |
| RandLA-Net [Hu et al.(2020)Hu, Yang, Xie, Rosa, Guo, Wang, Trigoni, and Markham] | 50.53 | 86.25 | 82.90 | 66.59 | 63.77 | 33.91 | 41.84 | 14.19 | |
| SCF-Net [Fan et al.(2021)Fan, Dong, Zhu, Lv, Ye, and Wang] | 50.65 | 83.32 | 77.80 | 58.98 | 64.86 | 46.37 | 40.50 | 15.41 | |
| MinkowskiNet [Choy et al.(2019)Choy, Gwak, and Savarese] | 51.35 | 84.90 | 80.86 | 74.03 | 59.21 | 31.72 | 45.51 | 16.79 | |
| KPConv [Thomas et al.(2019)Thomas, Qi, Deschaud, Marcotegui, Goulette, and Guibas] | 53.73 | 89.87 | 87.40 | 78.51 | 66.18 | 39.63 | 41.30 | 9.34 | |
The quantitative performance of baselines is reported in Table 2. It can be seen that: 1) MinkowskiNet achieves the best overall performance with a mIoU score of 46.52% when only trained on the real-world dataset. 2) All baselines achieved better mIoU when trained on the synthetic dataset compared with training on the real-world dataset, despite the fact that there is inevitably a domain gap that exists. This is likely because the synthetic dataset is much larger than real data in spatial scale and contains more variations of terrain shapes and building styles. 3) All baselines achieved the best mIoU when trained on real and synthetic datasets. In particular, KPConv achieved an improvement of nearly 8% in mIoU score by training on the synthetic + real-world data. These results clearly validate that the synthetic datasets could have a positive impact on the performance of real-world 3D understanding. On the other hand, we also noticed that the addition of synthetic subsets into training sets leads to significant performance improvement for categories such as ground and building but with limited improvement or even worse results for small objects. This is likely due to the domain discrepancy between the real data and synthetic data. In particular, two issues need to be further addressed in future work: 1) Although we randomly assigned various materials to different objects, limited geometrical variations of 3D game objects were adopted when creating the synthetic subsets. 2) There is a lack of enforcing comprehensive contextual relationships between specific objects. For instance, cars placed off the road have random orientations in synthetic datasets, but vehicles in a parking lot are usually heading in the same direction in rows in real-world environments.
| Training sets | Methods | mIoU (%) | oAcc (%) | Per Class IoU (%) | |||||
| Ground | Building | Tree | Car | Light pole | Fence | ||||
| Real subsets | PointTransformer [Zhao et al.(2021)Zhao, Jiang, Jia, Torr, and Koltun] | 49.40 | 85.85 | 85.23 | 47.77 | 76.72 | 39.51 | 28.61 | 18.56 |
| RandLA-Net [Hu et al.(2020)Hu, Yang, Xie, Rosa, Guo, Wang, Trigoni, and Markham] | 51.84 | 84.79 | 88.14 | 46.88 | 61.40 | 48.72 | 46.04 | 19.83 | |
| SCF-Net [Fan et al.(2021)Fan, Dong, Zhu, Lv, Ye, and Wang] | 53.79 | 86.66 | 89.19 | 53.12 | 65.28 | 48.91 | 46.59 | 19.63 | |
| MinkowskiNet [Choy et al.(2019)Choy, Gwak, and Savarese] | 52.85 | 83.28 | 82.76 | 40.30 | 71.68 | 47.00 | 49.33 | 26.04 | |
| KPConv [Thomas et al.(2019)Thomas, Qi, Deschaud, Marcotegui, Goulette, and Guibas] | 57.80 | 87.20 | 86.69 | 63.41 | 66.32 | 46.36 | 56.08 | 27.95 | |
| \hdashlineSynthetic subsets | PointTransformer [Zhao et al.(2021)Zhao, Jiang, Jia, Torr, and Koltun] | 58.65 | 92.01 | 90.42 | 74.54 | 85.18 | 31.76 | 42.36 | 27.67 |
| RandLA-Net [Hu et al.(2020)Hu, Yang, Xie, Rosa, Guo, Wang, Trigoni, and Markham] | 59.38 | 91.33 | 90.15 | 69.20 | 82.21 | 50.13 | 40.36 | 24.20 | |
| SCF-Net [Fan et al.(2021)Fan, Dong, Zhu, Lv, Ye, and Wang] | 58.82 | 90.49 | 89.53 | 62.39 | 81.55 | 52.99 | 44.10 | 22.36 | |
| MinkowskiNet [Choy et al.(2019)Choy, Gwak, and Savarese] | 56.17 | 90.55 | 90.74 | 66.11 | 78.63 | 36.86 | 36.41 | 28.26 | |
| KPConv [Thomas et al.(2019)Thomas, Qi, Deschaud, Marcotegui, Goulette, and Guibas] | 61.92 | 92.35 | 91.41 | 68.31 | 86.00 | 48.97 | 51.99 | 24.82 | |
| \hdashlineReal+Synthetic | PointTransformer [Zhao et al.(2021)Zhao, Jiang, Jia, Torr, and Koltun] | 62.14 | 91.96 | 89.74 | 74.79 | 84.73 | 45.10 | 46.75 | 31.72 |
| RandLA-Net [Hu et al.(2020)Hu, Yang, Xie, Rosa, Guo, Wang, Trigoni, and Markham] | 61.38 | 92.31 | 91.25 | 68.71 | 84.35 | 55.04 | 43.30 | 23.83 | |
| SCF-Net [Fan et al.(2021)Fan, Dong, Zhu, Lv, Ye, and Wang] | 61.89 | 92.10 | 90.99 | 68.69 | 84.99 | 55.58 | 45.36 | 25.71 | |
| MinkowskiNet [Choy et al.(2019)Choy, Gwak, and Savarese] | 62.59 | 93.16 | 91.66 | 74.70 | 87.97 | 48.80 | 43.95 | 28.49 | |
| KPConv [Thomas et al.(2019)Thomas, Qi, Deschaud, Marcotegui, Goulette, and Guibas] | 65.01 | 93.03 | 91.86 | 71.44 | 87.12 | 54.77 | 55.39 | 29.48 | |
Cross Datasets Generalization. We further verified the generalization ability of the trained model on the photogrammetry Fort Drum cantonment (FDc) dataset (i.e., dataset #7 in [Chen et al.(2020b)Chen, Feng, McCullough, Prasad, McAlinden, and Soibelman]). Note that the main differences between the FDc and our STPLS3D real data are that the cold weather tree dominates the vegetation types, the aerial images were collected with smaller overlaps (50% to 60%), resulting in lower quality 3D data, and FDc contains various vehicle types including military vehicles that do not exist in the STPLS3D real data. Please refer to the Appendix K for data visualization.
As shown in the quantitative results reported in Table 3, we can see that 1) KPConv consistently achieved the best generalization performance on the FDc dataset, regardless of the variation of training sets. 2) Similarly, all baselines achieved better generalization performance when trained on the synthetic dataset and achieved the best performance when trained on real and synthetic datasets. In particular, the generalization performance (i.e., mIoU score) of PointTransformer achieved an improvement of nearly 13% when augmented with synthetic datasets during training. This clearly shows that the proposed synthetic dataset is helpful for improving the generalization capacity of the trained deep learning model.
5.2 Evaluation of 3D Instance Segmentation
For instance segmentation, we selected two representative voxel-based approaches, including PointGroup [Jiang et al.(2020)Jiang, Zhao, Shi, Liu, Fu, and Jia] and HAIS [Chen et al.(2021b)Chen, Fang, Zhang, Liu, and Wang], as the baselines to build an instance segmentation benchmark in our STPLS3D. Considering the large spatial size of our dataset, we first tuned the data-related hyperparameters (i.e., voxel size and cluster radius) to adapt to our dataset and then utilized the weighted loss to mitigate the class imbalance issue. We followed the common practice of using the mAP, mAP50, and mAP25 as the main evaluation metrics. The SyntheticV3 dataset was selected again for evaluation, and the quantitative results achieved by different baselines are shown in Table 4.
| Metric |
mean (%) |
Build. |
LowVeg. |
MediumVeg. |
HighVeg. |
Vehicle |
Truck |
Aircraft |
MilitaryVeh. |
Bike |
Motorcycle |
LightPole |
StreetSign |
Clutter |
Fence |
|
| HAIS[Chen et al.(2021b)Chen, Fang, Zhang, Liu, and Wang] | AP | 35.1 | 66.8 | 20.9 | 17.6 | 23.2 | 75.7 | 51.9 | 42.6 | 31.1 | 7.4 | 50.8 | 47.0 | 8.3 | 22.6 | 25.7 |
| AP50 | 46.7 | 73.9 | 35.7 | 25.0 | 29.2 | 86.9 | 61.3 | 65.2 | 39.2 | 17.0 | 69.0 | 62.9 | 13.7 | 27.9 | 46.5 | |
| AP25 | 52.8 | 75.9 | 46.8 | 31.9 | 32.1 | 89.0 | 66.0 | 72.0 | 44.5 | 22.1 | 75.4 | 68.1 | 15.0 | 31.7 | 68.4 | |
| \hdashlinePointGroup[Jiang et al.(2020)Jiang, Zhao, Shi, Liu, Fu, and Jia] | AP | 23.3 | 60.0 | 11.6 | 10.7 | 19.2 | 58.7 | 39.8 | 27.6 | 21.2 | 2.2 | 12.0 | 23.7 | 8.1 | 13.9 | 18.1 |
| AP50 | 38.5 | 70.4 | 28.3 | 19.0 | 25.4 | 83.9 | 57.9 | 47.9 | 35.3 | 7.9 | 44.0 | 46.8 | 14.7 | 19.6 | 38.4 | |
| AP25 | 48.6 | 73.7 | 43.8 | 23.7 | 29.5 | 87.9 | 61.4 | 59.8 | 42.3 | 19.4 | 68.1 | 66.8 | 16.6 | 22.6 | 64.9 |
It can be seen that HAIS outperformed PointGroup and achieved the best mAP, mAP50, and mAP25 with 40.4, 51.9, and 57.3, respectively. We also noticed that the performance of both baselines on our dataset is still far inferior to that of existing indoor datasets (i.e., Scannet [Dai et al.(2017)Dai, Chang, Savva, Halber, Funkhouser, and Nießner] and S3DIS [Armeni et al.(2017)Armeni, Sax, Zamir, and Savarese]). We attribute this performance gap to the natural differences between the large-scale outdoor and the indoor scenes, where the size of the objects in the outdoor environments are dramatically different (i.e., buildings vs. bikes) compared to the indoor scenes. In addition, the limitation of the aerial photogrammetry technique may pose extra challenges to 3D instance segmentation, where objects that are physically close to each other may not have a clear boundary in terms of geometry and texture (i.e., 3D reconstruction of forests may result in solid blobs). With the identified challenges posed by large-scale outdoor scenes, we hope our STPLS3D will pave the way for future works on designing and developing more general and effective instance segmentation techniques that can also achieve satisfactory performance on outdoor scenes.
6 Discussions and Limitations
To facilitate the research in the community, we will release not only all of the 3D point clouds but also all byproducts and relevant data, including 2D source images, annotation masks, intrinsic and extrinsic camera parameters, depth maps, and meshes. Thus STPLS3D also holds great potential for supporting other computer vision-related tasks beyond 3D semantic and instance segmentation. Tasks such as neural rendering for large outdoor scenes [Xiangli et al.(2021)Xiangli, Xu, Pan, Zhao, Rao, Theobalt, Dai, and Lin, Martin-Brualla et al.(2021)Martin-Brualla, Radwan, Sajjadi, Barron, Dosovitskiy, and Duckworth], style transfer for both 2D and 3D aerial data [Huang et al.(2018)Huang, Liu, Belongie, and Kautz, Liu et al.(2017)Liu, Breuel, and Kautz, Lee et al.(2018)Lee, Tseng, Huang, Singh, and Yang, Park et al.(2020)Park, Efros, Zhang, and Zhu, Fu et al.(2019)Fu, Gong, Wang, Batmanghelich, Zhang, and Tao, Zhu et al.(2017)Zhu, Park, Isola, and Efros], 3D scene reconstruction, and object detection can all be supported.
Limitations. The proposed STPLS3D has been demonstrated to have good data quality and functions; it also has limitations. First, the generated synthetic 3D environments do not have sufficient high-level contextual priors between objects, such as generating realistic site plans for houses or placing vehicles, bikes, and motorcycles in parking lots, etc. Second, there is a visible domain gap between the synthetic and real-world data since the 2D appearance of the rendered images does not have the same style as the real-world images. We leave these domain adaptation issues for future exploration.
7 Conclusion
In this paper, we present STPLS3D, a large-scale aerial photogrammetry dataset with real and synthetic 3D point clouds. In particular, a fully automatic synthetic data generation pipeline is introduced to produce high-quality, richly-annotated 3D synthetic point clouds. Extensive experiments demonstrated the quality and functions of the generated synthetic datasets. Additionally, we also show that incorporating the synthetic data into the training set could be a good way of data augmentation, and the learning capacity and generalization ability of existing deep neural models could be further strengthened. Overall, synthetic data is easy to acquire and free of annotation, and potentially helpful for avoiding overfitting and generalized representation learning. We believe this is a promising research avenue for future research and hope our STPLS3D will inspire more research works on other tasks such as domain adaptation and pretraining.
Acknowledgements The authors would like to thank the two primary sponsors of this research: US Army Simulation and Training Technology Center (STTC), and the Office of Naval Research (ONR). They would also like to acknowledge the assistance provided by Army Futures Command (AFC) and Synthetic Training Environment (STE). This work is supported by University Affiliated Research Center (UARC) award W911NF-14-D-0005. Statements and opinions expressed and content included do not necessarily reflect the position or the policy of the Government, and no official endorsement should be inferred.
References
- [Armeni et al.(2017)Armeni, Sax, Zamir, and Savarese] Iro Armeni, Sasha Sax, Amir R Zamir, and Silvio Savarese. Joint 2d-3d-semantic data for indoor scene understanding. In CVPR, 2017.
- [ASPRS(2013)] ASPRS. Las specification 1.4-r14, 2013.
- [Behley et al.(2019)Behley, Garbade, Milioto, Quenzel, Behnke, Stachniss, and Gall] Jens Behley, Martin Garbade, Andres Milioto, Jan Quenzel, Sven Behnke, Cyrill Stachniss, and Jurgen Gall. Semantickitti: A dataset for semantic scene understanding of lidar sequences. In ICCV, 2019.
- [Benz et al.(2021)Benz, Taraben, Debus, Habte, Oppermann, Hallermann, Voelker, Rodehorst, and Morgenthal] Alexander Benz, Jakob Taraben, Paul Debus, Bedilu Habte, Luise Oppermann, Norman Hallermann, Conrad Voelker, Volker Rodehorst, and Guido Morgenthal. Framework for a uas-based assessment of energy performance of buildings. Energy and Buildings, 2021.
- [Caesar et al.(2020)Caesar, Bankiti, Lang, Vora, Liong, Xu, Krishnan, Pan, Baldan, and Beijbom] Holger Caesar, Varun Bankiti, Alex H Lang, Sourabh Vora, Venice Erin Liong, Qiang Xu, Anush Krishnan, Yu Pan, Giancarlo Baldan, and Oscar Beijbom. nuscenes: A multimodal dataset for autonomous driving. In CVPR, 2020.
- [Can et al.(2021)Can, Mantegazza, Abbate, Chappuis, and Giusti] Gülcan Can, Dario Mantegazza, Gabriele Abbate, Sébastien Chappuis, and Alessandro Giusti. Semantic segmentation on swiss3dcities: A benchmark study on aerial photogrammetric 3d pointcloud dataset. Pattern Recognition Letters, 2021.
- [Chang et al.(2017)Chang, Dai, Funkhouser, Halber, Niessner, Savva, Song, Zeng, and Zhang] Angel Chang, Angela Dai, Thomas Funkhouser, Maciej Halber, Matthias Niessner, Manolis Savva, Shuran Song, Andy Zeng, and Yinda Zhang. Matterport3D: Learning from RGB-D data in indoor environments. In 3DV, 2017.
- [Chang et al.(2015)Chang, Funkhouser, Guibas, Hanrahan, Huang, Li, Savarese, Savva, Song, Su, Xiao, Yi, and Yu] Angel X. Chang, Thomas Funkhouser, Leonidas Guibas, Pat Hanrahan, Qixing Huang, Zimo Li, Silvio Savarese, Manolis Savva, Shuran Song, Hao Su, Jianxiong Xiao, Li Yi, and Fisher Yu. ShapeNet: An Information-Rich 3D Model Repository. Technical Report arXiv:1512.03012 [cs.GR], 2015.
- [Chang et al.(2019)Chang, Lambert, Sangkloy, Singh, Bak, Hartnett, Wang, Carr, Lucey, Ramanan, et al.] Ming-Fang Chang, John Lambert, Patsorn Sangkloy, Jagjeet Singh, Slawomir Bak, Andrew Hartnett, De Wang, Peter Carr, Simon Lucey, Deva Ramanan, et al. Argoverse: 3d tracking and forecasting with rich maps. In CVPR, 2019.
- [Chen et al.(2020a)Chen, Feng, McAlinden, and Soibelman] Meida Chen, Andrew Feng, Ryan McAlinden, and Lucio Soibelman. Photogrammetric point cloud segmentation and object information extraction for creating virtual environments and simulations. Journal of Management in Engineering, 36(2):04019046, 2020a.
- [Chen et al.(2020b)Chen, Feng, McCullough, Prasad, McAlinden, and Soibelman] Meida Chen, Andrew Feng, Kyle McCullough, Pratusha Bhuvana Prasad, Ryan McAlinden, and Lucio Soibelman. 3d photogrammetry point cloud segmentation using a model ensembling framework. ASCE JCCE, 2020b.
- [Chen et al.(2020c)Chen, Feng, McCullough, Prasad, McAlinden, and Soibelman] Meida Chen, Andrew Feng, Kyle McCullough, Pratusha Bhuvana Prasad, Ryan McAlinden, and Lucio Soibelman. Generating synthetic photogrammetric data for training deep learning based 3d point cloud segmentation models. In I/ITSEC, 2020c.
- [Chen et al.(2020d)Chen, Feng, McCullough, Prasad, McAlinden, and Soibelman] Meida Chen, Andrew Feng, Kyle McCullough, Pratusha Bhuvana Prasad, Ryan McAlinden, and Lucio Soibelman. Semantic segmentation and data fusion of microsoft bing 3d cities and small uav-based photogrammetric data. In I/ITSEC, 2020d.
- [Chen et al.(2020e)Chen, Feng, McCullough, Prasad, McAlinden, Soibelman, and Enloe] Meida Chen, Andrew Feng, Kyle McCullough, Pratusha Bhuvana Prasad, Ryan McAlinden, Lucio Soibelman, and Mike Enloe. Fully automated photogrammetric data segmentation and object information extraction approach for creating simulation terrain. In I/ITSEC, 2020e.
- [Chen et al.(2021a)Chen, Feng, Hou, McCullough, Prasad, and Soibelman] Meida Chen, Andrew Feng, Yu Hou, Kyle McCullough, Pratusha Bhuvana Prasad, and Lucio Soibelman. Ground material classification and for uav-based photogrammetric 3d data a 2d-3d hybrid approach. In I/ITSEC, 2021a.
- [Chen et al.(2021b)Chen, Fang, Zhang, Liu, and Wang] Shaoyu Chen, Jiemin Fang, Qian Zhang, Wenyu Liu, and Xinggang Wang. Hierarchical aggregation for 3d instance segmentation. In ICCV, pages 15467–15476, 2021b.
- [Choy et al.(2019)Choy, Gwak, and Savarese] Christopher Choy, JunYoung Gwak, and Silvio Savarese. 4d spatio-temporal convnets: Minkowski convolutional neural networks. In CVPR, 2019.
- [Dai et al.(2017)Dai, Chang, Savva, Halber, Funkhouser, and Nießner] Angela Dai, Angel X Chang, Manolis Savva, Maciej Halber, Thomas Funkhouser, and Matthias Nießner. Scannet: Richly-annotated 3d reconstructions of indoor scenes. In CVPR, 2017.
- [De Deuge et al.(2013)De Deuge, Quadros, Hung, and Douillard] Mark De Deuge, Alastair Quadros, Calvin Hung, and Bertrand Douillard. Unsupervised feature learning for classification of outdoor 3d scans. In ACRA, 2013.
- [Dosovitskiy et al.(2017)Dosovitskiy, Ros, Codevilla, Lopez, and Koltun] Alexey Dosovitskiy, German Ros, Felipe Codevilla, Antonio Lopez, and Vladlen Koltun. CARLA: An open urban driving simulator. In CoRL, 2017.
- [Erikson(2003)] Mats Erikson. Segmentation of individual tree crowns in colour aerial photographs using region growing supported by fuzzy rules. Canadian Journal of Forest Research, 2003.
- [Fan et al.(2021)Fan, Dong, Zhu, Lv, Ye, and Wang] Siqi Fan, Qiulei Dong, Fenghua Zhu, Yisheng Lv, Peijun Ye, and Fei-Yue Wang. Scf-net: Learning spatial contextual features for large-scale point cloud segmentation. In CVPR, 2021.
- [Fu et al.(2019)Fu, Gong, Wang, Batmanghelich, Zhang, and Tao] Huan Fu, Mingming Gong, Chaohui Wang, Kayhan Batmanghelich, Kun Zhang, and Dacheng Tao. Geometry-consistent generative adversarial networks for one-sided unsupervised domain mapping. In CVPR, pages 2427–2436, 2019.
- [Gaidon et al.(2016)Gaidon, Wang, Cabon, and Vig] Adrien Gaidon, Qiao Wang, Yohann Cabon, and Eleonora Vig. Virtual worlds as proxy for multi-object tracking analysis. In CVPR, 2016.
- [Gao et al.(2021)Gao, Pan, Li, Geng, and Zhao] Biao Gao, Yancheng Pan, Chengkun Li, Sibo Geng, and Huijing Zhao. Are we hungry for 3d lidar data for semantic segmentation? a survey of datasets and methods. IEEE Transactions on ITS, 2021.
- [Gesch et al.(2009)Gesch, Evans, Mauck, Hutchinson, Carswell Jr, et al.] Dean Gesch, Gayla Evans, James Mauck, John Hutchinson, William J Carswell Jr, et al. The national map—elevation. US geological survey fact sheet, 2009.
- [Geyer et al.(2020)Geyer, Kassahun, Mahmudi, Ricou, Durgesh, Chung, Hauswald, Pham, Mühlegg, Dorn, et al.] Jakob Geyer, Yohannes Kassahun, Mentar Mahmudi, Xavier Ricou, Rupesh Durgesh, Andrew S Chung, Lorenz Hauswald, Viet Hoang Pham, Maximilian Mühlegg, Sebastian Dorn, et al. A2d2: Audi autonomous driving dataset. arXiv preprint arXiv:2004.06320, 2020.
- [Griffiths and Boehm(2019)] David Griffiths and Jan Boehm. Synthcity: A large scale synthetic point cloud. arXiv preprint arXiv:1907.04758, 2019.
- [Guo et al.(2020)Guo, Wang, Hu, Liu, Liu, and Bennamoun] Yulan Guo, Hanyun Wang, Qingyong Hu, Hao Liu, Li Liu, and Mohammed Bennamoun. Deep learning for 3d point clouds: A survey. IEEE transactions on pattern analysis and machine intelligence, 43(12):4338–4364, 2020.
- [Hackel et al.(2017)Hackel, Savinov, Ladicky, Wegner, Schindler, and Pollefeys] Timo Hackel, Nikolay Savinov, Lubor Ladicky, Jan D. Wegner, Konrad Schindler, and Marc Pollefeys. SEMANTIC3D.NET: A new large-scale point cloud classification benchmark. In ISPRS Journal of Photogrammetry and Remote Sensing, 2017.
- [Haklay and Weber(2008)] Mordechai Haklay and Patrick Weber. Openstreetmap: User-generated street maps. IEEE Pervasive computing, 2008.
- [Ham et al.(2016)Ham, Han, Lin, and Golparvar-Fard] Youngjib Ham, Kevin K Han, Jacob J Lin, and Mani Golparvar-Fard. Visual monitoring of civil infrastructure systems via camera-equipped unmanned aerial vehicles (uavs): a review of related works. Visualization in Engineering, 2016.
- [Hou et al.(2021a)Hou, Chen, Volk, and Soibelman] Yu Hou, Meida Chen, Rebekka Volk, and Lucio Soibelman. Investigation on performance of rgb point cloud and thermal information data fusion for building thermal map modeling using aerial images under different experimental conditions. JOBE, 2021a.
- [Hou et al.(2021b)Hou, Chen, Volk, and Soibelman] Yu Hou, Meida Chen, Rebekka Volk, and Lucio Soibelman. An approach to semantically segmenting building components and outdoor scenes based on multichannel aerial imagery datasets. Remote Sensing, 13(21):4357, 2021b.
- [Hu et al.(2020)Hu, Yang, Xie, Rosa, Guo, Wang, Trigoni, and Markham] Qingyong Hu, Bo Yang, Linhai Xie, Stefano Rosa, Yulan Guo, Zhihua Wang, Niki Trigoni, and Andrew Markham. Randla-net: Efficient semantic segmentation of large-scale point clouds. In CVPR, 2020.
- [Hu et al.(2021a)Hu, Yang, Khalid, Xiao, Trigoni, and Markham] Qingyong Hu, Bo Yang, Sheikh Khalid, Wen Xiao, Niki Trigoni, and Andrew Markham. Towards semantic segmentation of urban-scale 3d point clouds: A dataset, benchmarks and challenges. In CVPR, 2021a.
- [Hu et al.(2021b)Hu, Yang, Xie, Rosa, Guo, Wang, Trigoni, and Markham] Qingyong Hu, Bo Yang, Linhai Xie, Stefano Rosa, Yulan Guo, Zhihua Wang, Niki Trigoni, and Andrew Markham. Learning semantic segmentation of large-scale point clouds with random sampling. IEEE Transactions on Pattern Analysis and Machine Intelligence, 2021b.
- [Hu et al.(2022a)Hu, Yang, Fang, Guo, Leonardis, Trigoni, and Markham] Qingyong Hu, Bo Yang, Guangchi Fang, Yulan Guo, Ales Leonardis, Niki Trigoni, and Andrew Markham. Sqn: Weakly-supervised semantic segmentation of large-scale 3d point clouds. In ECCV, 2022a.
- [Hu et al.(2022b)Hu, Yang, Khalid, Xiao, Trigoni, and Markham] Qingyong Hu, Bo Yang, Sheikh Khalid, Wen Xiao, Niki Trigoni, and Andrew Markham. Sensaturban: Learning semantics from urban-scale photogrammetric point clouds. International Journal of Computer Vision, pages 1–28, 2022b.
- [Huang et al.(2018)Huang, Liu, Belongie, and Kautz] Xun Huang, Ming-Yu Liu, Serge Belongie, and Jan Kautz. Multimodal unsupervised image-to-image translation. In ECCV, pages 172–189, 2018.
- [Jiang et al.(2020)Jiang, Zhao, Shi, Liu, Fu, and Jia] Li Jiang, Hengshuang Zhao, Shaoshuai Shi, Shu Liu, Chi-Wing Fu, and Jiaya Jia. Pointgroup: Dual-set point grouping for 3d instance segmentation. In CVPR, pages 4867–4876, 2020.
- [Johnson-Roberson et al.(2017)Johnson-Roberson, Barto, Mehta, Sridhar, Rosaen, and Vasudevan] Matthew Johnson-Roberson, Charles Barto, Rounak Mehta, Sharath Nittur Sridhar, Karl Rosaen, and Ram Vasudevan. Driving in the matrix: Can virtual worlds replace human-generated annotations for real world tasks? In ICRA, 2017.
- [Kölle et al.(2021)Kölle, Laupheimer, Schmohl, Haala, Rottensteiner, Wegner, and Ledoux] Michael Kölle, Dominik Laupheimer, Stefan Schmohl, Norbert Haala, Franz Rottensteiner, Jan Dirk Wegner, and Hugo Ledoux. The hessigheim 3d (h3d) benchmark on semantic segmentation of high-resolution 3d point clouds and textured meshes from uav lidar and multi-view-stereo. ISPRS Open Journal of Photogrammetry and Remote Sensing, 1:100001, 2021.
- [Landrieu and Simonovsky(2018)] Loic Landrieu and Martin Simonovsky. Large-scale point cloud semantic segmentation with superpoint graphs. In CVPR, 2018.
- [Le et al.(2021)Le, Das, Mensink, Karaoglu, and Gevers] Hoang-An Le, Partha Das, Thomas Mensink, Sezer Karaoglu, and Theo Gevers. EDEN: Multimodal Synthetic Dataset of Enclosed garDEN Scenes. In WACV, 2021.
- [Lee et al.(2018)Lee, Tseng, Huang, Singh, and Yang] Hsin-Ying Lee, Hung-Yu Tseng, Jia-Bin Huang, Maneesh Singh, and Ming-Hsuan Yang. Diverse image-to-image translation via disentangled representations. In ECCV, pages 35–51, 2018.
- [Li et al.(2017)Li, Fu, Yu, and Cracknell] Weijia Li, Haohuan Fu, Le Yu, and Arthur Cracknell. Deep learning based oil palm tree detection and counting for high-resolution remote sensing images. Remote Sensing, 2017.
- [Li et al.(2020)Li, Li, Tong, Lim, Yuan, Wu, Tang, and Huang] Xinke Li, Chongshou Li, Zekun Tong, Andrew Lim, Junsong Yuan, Yuwei Wu, Jing Tang, and Raymond Huang. Campus3d: A photogrammetry point cloud benchmark for hierarchical understanding of outdoor scene. In ACM MM, 2020.
- [Liu et al.(2017)Liu, Breuel, and Kautz] Ming-Yu Liu, Thomas Breuel, and Jan Kautz. Unsupervised image-to-image translation networks. In Advances in neural information processing systems, pages 700–708, 2017.
- [López et al.(2021)López, Jurado, Ogayar, and Feito] Alfonso López, Juan M Jurado, Carlos J Ogayar, and Francisco R Feito. An optimized approach for generating dense thermal point clouds from uav-imagery. ISPRS Journal of Photogrammetry and Remote Sensing, 2021.
- [Martin-Brualla et al.(2021)Martin-Brualla, Radwan, Sajjadi, Barron, Dosovitskiy, and Duckworth] Ricardo Martin-Brualla, Noha Radwan, Mehdi S. M. Sajjadi, Jonathan T. Barron, Alexey Dosovitskiy, and Daniel Duckworth. Nerf in the wild: Neural radiance fields for unconstrained photo collections. In CVPR, 2021.
- [Mo et al.(2019)Mo, Zhu, Chang, Yi, Tripathi, Guibas, and Su] Kaichun Mo, Shilin Zhu, Angel X Chang, Li Yi, Subarna Tripathi, Leonidas J Guibas, and Hao Su. Partnet: A large-scale benchmark for fine-grained and hierarchical part-level 3d object understanding. In CVPR, 2019.
- [Munoz et al.(2009a)Munoz, Bagnell, Vandapel, and Hebert] Daniel Munoz, J Andrew Bagnell, Nicolas Vandapel, and Martial Hebert. Contextual classification with functional max-margin markov networks. In CVPR, 2009a.
- [Munoz et al.(2009b)Munoz, Bagnell, Vandapel, and Hebert] Daniel Munoz, J Andrew Bagnell, Nicolas Vandapel, and Martial Hebert. Contextual classification with functional max-margin markov networks. In CVPR, 2009b.
- [Pan et al.(2020)Pan, Gao, Mei, Geng, Li, and Zhao] Yancheng Pan, Biao Gao, Jilin Mei, Sibo Geng, Chengkun Li, and Huijing Zhao. Semanticposs: A point cloud dataset with large quantity of dynamic instances. In IEEE IV, 2020.
- [Park et al.(2020)Park, Efros, Zhang, and Zhu] Taesung Park, Alexei A Efros, Richard Zhang, and Jun-Yan Zhu. Contrastive learning for unpaired image-to-image translation. In ECCV, pages 319–345, 2020.
- [Peng et al.(2020)Peng, Usman, Saito, Kaushik, Hoffman, and Saenko] Xingchao Peng, Ben Usman, Kuniaki Saito, Neela Kaushik, Judy Hoffman, and Kate Saenko. Syn2real: A new benchmark for synthetic-to-real visual domain adaptation. In CVPR, 2020.
- [Qiu et al.(2021)Qiu, Anwar, and Barnes] Shi Qiu, Saeed Anwar, and Nick Barnes. Semantic segmentation for real point cloud scenes via bilateral augmentation and adaptive fusion. In CVPR, 2021.
- [Richter et al.(2016)Richter, Vineet, Roth, and Koltun] Stephan R Richter, Vibhav Vineet, Stefan Roth, and Vladlen Koltun. Playing for data: Ground truth from computer games. In ECCV, 2016.
- [Ros et al.(2016)Ros, Sellart, Materzynska, Vazquez, and Lopez] German Ros, Laura Sellart, Joanna Materzynska, David Vazquez, and Antonio M Lopez. The synthia dataset: A large collection of synthetic images for semantic segmentation of urban scenes. In CVPR, 2016.
- [Rottensteiner et al.(2012)Rottensteiner, Sohn, Jung, Gerke, Baillard, Benitez, and Breitkopf] Franz Rottensteiner, Gunho Sohn, Jaewook Jung, Markus Gerke, Caroline Baillard, Sebastien Benitez, and Uwe Breitkopf. The isprs benchmark on urban object classification and 3d building reconstruction. ISPRS Journal of Photogrammetry and Remote Sensing, 2012.
- [Roynard et al.(2018)Roynard, Deschaud, and Goulette] Xavier Roynard, Jean-Emmanuel Deschaud, and François Goulette. Paris-lille-3d: A large and high-quality ground-truth urban point cloud dataset for automatic segmentation and classification. IJRR, 2018.
- [Scharwächter et al.(2013)Scharwächter, Enzweiler, Franke, and Roth] Timo Scharwächter, Markus Enzweiler, Uwe Franke, and Stefan Roth. Efficient multi-cue scene segmentation. In GCPR, 2013.
- [Serna et al.(2014)Serna, Marcotegui, Goulette, and Deschaud] Andrés Serna, Beatriz Marcotegui, François Goulette, and Jean-Emmanuel Deschaud. Paris-rue-madame database: a 3d mobile laser scanner dataset for benchmarking urban detection, segmentation and classification methods. In ICPRAM, 2014.
- [Shah et al.(2018)Shah, Dey, Lovett, and Kapoor] Shital Shah, Debadeepta Dey, Chris Lovett, and Ashish Kapoor. Airsim: High-fidelity visual and physical simulation for autonomous vehicles. In Field and service robotics, 2018.
- [Shi et al.(2021)Shi, Kang, Xia, Tyagi, Mehta, and Du] Yangming Shi, John Kang, Pengxiang Xia, Oshin Tyagi, Ranjana K Mehta, and Jing Du. Spatial knowledge and firefighters’ wayfinding performance: A virtual reality search and rescue experiment. Safety science, 139:105231, 2021.
- [Silberman et al.(2012)Silberman, Hoiem, Kohli, and Fergus] Nathan Silberman, Derek Hoiem, Pushmeet Kohli, and Rob Fergus. Indoor segmentation and support inference from rgbd images. In ECCV, 2012.
- [Song et al.(2015)Song, Lichtenberg, and Xiao] Shuran Song, Samuel P. Lichtenberg, and Jianxiong Xiao. Sun rgb-d: A rgb-d scene understanding benchmark suite. In CVPR, 2015.
- [Spicer et al.(2016)Spicer, McAlinden, Conover, and Adelphi] Ryan Spicer, Ryan McAlinden, Damon Conover, and M Adelphi. Producing usable simulation terrain data from uas-collected imagery. In I/ITSEC, 2016.
- [Sun et al.(2020)Sun, Kretzschmar, Dotiwalla, Chouard, Patnaik, Tsui, Guo, Zhou, Chai, Caine, Vasudevan, Han, Ngiam, Zhao, Timofeev, Ettinger, Krivokon, Gao, Joshi, Zhang, Shlens, Chen, and Anguelov] Pei Sun, Henrik Kretzschmar, Xerxes Dotiwalla, Aurelien Chouard, Vijaysai Patnaik, Paul Tsui, James Guo, Yin Zhou, Yuning Chai, Benjamin Caine, Vijay Vasudevan, Wei Han, Jiquan Ngiam, Hang Zhao, Aleksei Timofeev, Scott Ettinger, Maxim Krivokon, Amy Gao, Aditya Joshi, Yu Zhang, Jonathon Shlens, Zhifeng Chen, and Dragomir Anguelov. Scalability in perception for autonomous driving: Waymo open dataset. In CVPR, 2020.
- [Tan et al.(2020)Tan, Qin, Ma, Li, Du, Cai, Yang, and Li] Weikai Tan, Nannan Qin, Lingfei Ma, Ying Li, Jing Du, Guorong Cai, Ke Yang, and Jonathan Li. Toronto-3d: A large-scale mobile lidar dataset for semantic segmentation of urban roadways. In CVPR, 2020.
- [Thomas et al.(2019)Thomas, Qi, Deschaud, Marcotegui, Goulette, and Guibas] Hugues Thomas, Charles R. Qi, Jean-Emmanuel Deschaud, Beatriz Marcotegui, Francois Goulette, and Leonidas J. Guibas. Kpconv: Flexible and deformable convolution for point clouds. In ICCV, 2019.
- [Tong et al.(2020)Tong, Li, Chen, Sun, Cao, and Xiang] Guofeng Tong, Yong Li, Dong Chen, Qi Sun, Wei Cao, and Guiqiu Xiang. Cspc-dataset: new lidar point cloud dataset and benchmark for large-scale scene semantic segmentation. IEEE Access, 2020.
- [Uy et al.(2019)Uy, Pham, Hua, Nguyen, and Yeung] Mikaela Angelina Uy, Quang-Hieu Pham, Binh-Son Hua, Thanh Nguyen, and Sai-Kit Yeung. Revisiting point cloud classification: A new benchmark dataset and classification model on real-world data. In ICCV, 2019.
- [Vallet et al.(2015)Vallet, Brédif, Serna, Marcotegui, and Paparoditis] Bruno Vallet, Mathieu Brédif, Andrés Serna, Beatriz Marcotegui, and Nicolas Paparoditis. Terramobilita/iqmulus urban point cloud analysis benchmark. Computers & Graphics, 2015.
- [Varney et al.(2020)Varney, Asari, and Graehling] Nina Varney, Vijayan K Asari, and Quinn Graehling. Dales: a large-scale aerial lidar data set for semantic segmentation. In CVPRW, 2020.
- [Wu et al.(2015)Wu, Song, Khosla, Yu, Zhang, Tang, and Xiao] Zhirong Wu, Shuran Song, Aditya Khosla, Fisher Yu, Linguang Zhang, Xiaoou Tang, and Jianxiong Xiao. 3d shapenets: A deep representation for volumetric shapes. In CVPR, 2015.
- [Xiangli et al.(2021)Xiangli, Xu, Pan, Zhao, Rao, Theobalt, Dai, and Lin] Yuanbo Xiangli, Linning Xu, Xingang Pan, Nanxuan Zhao, Anyi Rao, Christian Theobalt, Bo Dai, and Dahua Lin. Citynerf: Building nerf at city scale. arXiv preprint arXiv:2112.05504, 2021.
- [Xiao et al.(2021)Xiao, Huang, Guan, Zhan, and Lu] Aoran Xiao, Jiaxing Huang, Dayan Guan, Fangneng Zhan, and Shijian Lu. Synlidar: Learning from synthetic lidar sequential point cloud for semantic segmentation. arXiv preprint arXiv:2107.05399, 2021.
- [Yang et al.(2015)Yang, Park, Vela, and Golparvar-Fard] Jun Yang, Man-Woo Park, Patricio A Vela, and Mani Golparvar-Fard. Construction performance monitoring via still images, time-lapse photos, and video streams: Now, tomorrow, and the future. Advanced Engineering Informatics, 2015.
- [Ye et al.(2020)Ye, Xu, Huang, Tong, Li, Liu, Luan, Hoegner, and Stilla] Zhen Ye, Yusheng Xu, Rong Huang, Xiaohua Tong, Xin Li, Xiangfeng Liu, Kuifeng Luan, Ludwig Hoegner, and Uwe Stilla. Lasdu: A large-scale aerial lidar dataset for semantic labeling in dense urban areas. ISPRS International Journal of Geo-Information, 2020.
- [Yi et al.(2016)Yi, Kim, Ceylan, Shen, Yan, Su, Lu, Huang, Sheffer, and Guibas] Li Yi, Vladimir G Kim, Duygu Ceylan, I-Chao Shen, Mengyan Yan, Hao Su, Cewu Lu, Qixing Huang, Alla Sheffer, and Leonidas Guibas. A scalable active framework for region annotation in 3d shape collections. ACM TOG, 2016.
- [Yue et al.(2018)Yue, Wu, Seshia, Keutzer, and Sangiovanni-Vincentelli] Xiangyu Yue, Bichen Wu, Sanjit A Seshia, Kurt Keutzer, and Alberto L Sangiovanni-Vincentelli. A lidar point cloud generator: from a virtual world to autonomous driving. In ACM ICMR, 2018.
- [Zhao et al.(2021)Zhao, Jiang, Jia, Torr, and Koltun] Hengshuang Zhao, Li Jiang, Jiaya Jia, Philip HS Torr, and Vladlen Koltun. Point transformer. In ICCV, pages 16259–16268, 2021.
- [Zhu et al.(2017)Zhu, Park, Isola, and Efros] Jun-Yan Zhu, Taesung Park, Phillip Isola, and Alexei A Efros. Unpaired image-to-image translation using cycle-consistent adversarial networks. In ICCV, pages 2223–2232, 2017.
- [Zolanvari et al.(2019)Zolanvari, Ruano, Rana, Cummins, da Silva, Rahbar, and Smolic] SM Zolanvari, Susana Ruano, Aakanksha Rana, Alan Cummins, Rogerio Eduardo da Silva, Morteza Rahbar, and Aljosa Smolic. Dublincity: Annotated lidar point cloud and its applications. In BMVC, 2019.
Appendices
Appendix A Data availability
Our STPLS3D datasets can be downloaded at: www.stpls3d.com/data
Appendix B Data collection & generation details
Video Illustrations. We provide an video demo illustrating our synthetic data generation pipeline discussed in Section 3. The video can be viewed at https://youtu.be/6wYWVo6Cmfs.
Real-World Datasets To capture the real-world 3D data, we first used DJI Phantom 4 Pro for the collection of aerial images. An autonomous UAV-path planning and imagery collection system called rapid aerial photogrammetric reconstruction system (RAPTRS) [Spicer et al.(2016)Spicer, McAlinden, Conover, and Adelphi] was adopted for the survey. Specifically, RAPTRS encodes photogrammetry best practices and allows aerial photographs collected with multiple flights to cover a large area of interest. The aerial images were collected using a crosshatch-type flight pattern with predefined overlaps ranging from 75%85% and flight altitudes ranging from 25m70m. We conducted surveys on four real-world sites, including the University of Southern California Park Campus (USC), Wrigley Marine Science Center (WMSC) located on Catalina Island, Orange County Convention Center (OCCC), and a residential area (RA).
For richer diversity, we selected the area of interest to have different building and terrain types. USC campus mainly consists of commercial buildings with the paved ground (vehicle roads, pedestrian roads, and squares). Approximately 20% of the campus is covered by grassland and tree canopy. The average height of buildings is around 56 floors. WMSC contains terrain with a valley and cliffs located on the shoreline of an island. OCCC is a large convention center located in the tourist district of Orlando. The surroundings of OCCC, including the parking lots and vegetated areas, are also included in our datasets. The residential area (RA) covers a typical American residential area that contains single and townhouses with an average height of 12 floors.
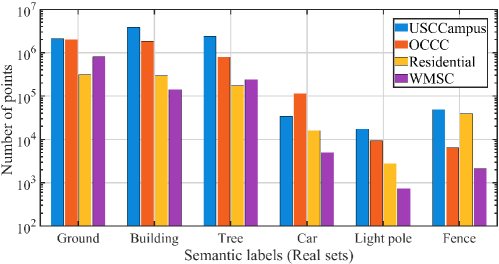
All 3D point clouds are reconstructed using the commercial software – i.e., ContextCapture. Each point is enriched with one of the six semantic class labels, including ground, man-made structures (including outdoor furniture, construction equipment, site storage trailers, etc.), trees, cars, light poles, and fences. Note that the raw point clouds are subsampled to 0.3 m point spacing for training and evaluating existing segmentation methods. The statistics of the real-world dataset are also provided in Figure 4.
Synthetic Datasets Following the proposed data generation pipeline, we further generated a large-scale synthetic dataset with various landscapes (i.e., various terrain shapes, types of vegetation, and urban density). It is composed of 62 point clouds and covers approximately 16 square kilometers of landscape. Additionally, the flight altitudes were set in the range of 60m120m. Image overlaps were set in the range of 75%85%, and sunlight directions were randomly assigned to simulate the data collection at different times in a day. In particular, three versions of the synthetic datasets were generated with different focuses.
SyntheticV1. This dataset was created using limited game objects and composed of 7 semantic categories, including ground, building, vegetation, vehicle, light pole, street sign, and clutter. In this version, we mainly focused on adding diversity for large objects. For instance, details were added to the ground by randomly sculpting the input digital surface model with simulated ditches, street gutters, speed bumps, etc. A large number of forests were also added by placing trees in random polygons with different tree spacing.
SyntheticV2. In this version, we focused on adding diversity for the terrain shapes and visual appearances, as well as the variation of the small objects. In particular, we selected DSM with large slopes, enriched the game objects repository, and expanded the fine-grained semantic categories. Low (0.5m height2.0m), medium (2.0mheight5.0m) and high (5.0mheight) vegetation class labels were adopted to separate different kinds of vegetation following ASPRS specification [ASPRS(2013)]. Vehicles were further divided into passenger cars (including sedan and hatchback cars) and trucks. Bikes, motorcycles, fences, roads, aircraft, and military vehicles were also incorporated into the 3D scene generation process. A procedural landscape material was also leveraged to automatically generate grass and rocky textures based on the ground slope. The contextual relationship between objects was also considered, where vehicles were placed on the roads and light poles, and street signs were placed alongside the roads. Finally, it is noted that the instance annotations for specific objects (e.g., cars, trees, buildings, bikes, etc.) were also introduced in this version.
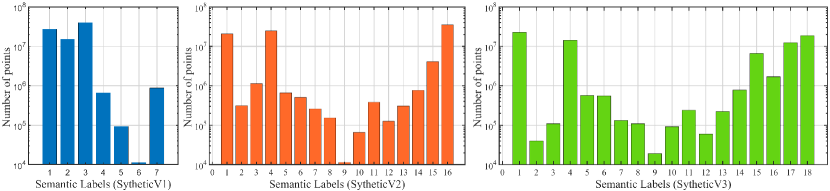
SyntheticV3. In this version, we focused on large size building footprints to simulate urban areas and increase the variation of the object materials. A database of materials (including metal, rubber, signs, car paints, etc.) for small objects (such as vehicles, light poles, street signs, bikes, motorcycles, etc.) was created. These materials were assigned to each object during generation. We also exploited the off-the-shelf library of photogrammetry-based textures – i.e., Quixel Megascans for changing materials of buildings and fences. Considering that simply assigning random materials to the facade of the building may reduce the realism of the 3D environment, we first assigned the material categories (e.g., brick, concrete, wood, etc.) to different building components (e.g., wall, roof, etc.). Next, individual material was randomly selected for each building component from the given material category. In particular, two new ground material labels (i.e., grass and dirt) were also introduced in this version. Dirt texture was painted around the building footprints with a predefined buffer, and grass texture was used to fill the blank areas that did not belong to dirt or road. The statistics of different synthetic data are shown in Figure 5. we provide additional visualization of our synthetic and real-world datasets in Figure 6.
Appendix C Comparison of Data Quality
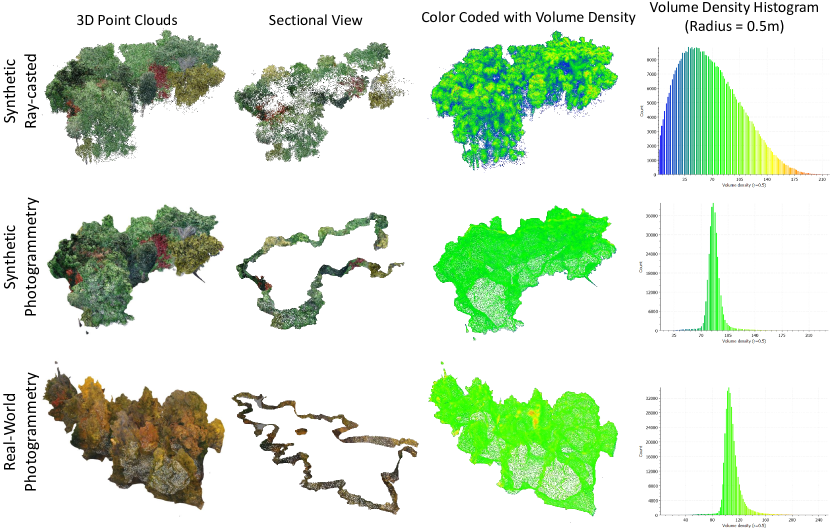
As discussed in Section 3.2, directly sampling or ray casting point clouds from the 3D virtual environment will lead to a large domain gap from the real photogrammetry data. Here, we provide an intuitive comparison by visualizing the ray casting 3D points, the synthetic photogrammetric points, and real-world photogrammetric points of tree crowns in Figure 7. Additionally, the sectional view and volume density histogram is also reported.
It can be seen that: 1) From the sectional view, it is clear that points of the synthetic ray-casted point clouds are scattered inside the tree crowns, while synthetic and real photogrammetry point clouds exhibit hollow-shaped shells. 2) The volume density histograms show that synthetic and real photogrammetry point clouds have much more similar point distributions compared with the synthetic ray-casted point clouds. Overall, the point clouds generated from our synthetic photogrammetry pipeline are closer to the real data. For comprehensive visualization, we also provide an anonymous video demo demonstrating the quality and distribution of different point clouds generated by ray casting, synthetical photogrammetry, and real photogrammetry. The video can be viewed at https://youtu.be/4AjMWTgV2Ec.
Appendix D Object placement principles for creating the synthetic environment layouts
In this study, we empirically developed several simple yet effective parameterized scene layout principles. 1) Placing vehicles, trucks, bikes, and motorcycles on the paved ground and road based on the road width length with randomized intervals. 2) Placing city furniture alongside the roads with parameterized buffer sizes. 3) Placing clusters of bikes, motorcycles, and small objects around buildings and fences. 4) Scatter polygons and rings with random shapes and sizes to cover a parameterized percentage of the empty space and place objects within the same category in each polygon and ring with the parameterized minimum allowed distance. 5) Randomize the objects’ rotations and scales. By mixing and matching these simple rules with parameters randomly sampled within reasonable ranges, unique strategies can be created to produce scene layouts with a large diversity and a certain realism.
Appendix E Evaluation of the synthetic V1, V2, and V3
. RandLA-Net [Hu et al.(2020)Hu, Yang, Xie, Rosa, Guo, Wang, Trigoni, and Markham] SCF-Net [Fan et al.(2021)Fan, Dong, Zhu, Lv, Ye, and Wang] KPConv [Thomas et al.(2019)Thomas, Qi, Deschaud, Marcotegui, Goulette, and Guibas] oAcc(%) mIoU(%) oAcc(%) mIoU(%) oAcc(%) mIoU(%) V1 78.51 44.42 76.40 43.85 76.71 44.36 V2 80.86 46.67 80.46 46.77 84.18 53.88 V3 76.95 47.97 76.43 47.38 73.42 48.41 \cdashline1-7 V12 86.25 50.41 86.31 53.37 85.75 51.43 V13 80.41 49.08 79.48 49.66 79.73 51.08 V23 84.32 51.07 85.41 52.15 85.45 55.82 \cdashline1-7 V123 86.39 55.76 87.86 56.60 88.04 58.05
In Section 5.1, we have evaluated the segmentation performance of baseline networks on our real-world dataset by training on the synthetical V1-V3 dataset. To further determine the impact of different versions of the synthetic subset on the final segmentation performance, we conducted the 7 groups of experiments as follows. Note that all groups of experiments were tested on the real-world dataset but trained with synthetic datasets with different settings.
-
•
Trained in synthetic V1 only.
-
•
Trained in synthetic V2 only.
-
•
Trained in synthetic V3 only.
-
•
Trained in synthetic V1+V2.
-
•
Trained in synthetic V1+V3.
-
•
Trained in synthetic V2+V3.
-
•
Trained in all the synthetic V1+V2+V3.
The quantitative performance evaluation of three baselines is shown in Table E. It can be seen that: 1) The overall performance of all baselines improved when training with the combinations of synthetic subsets, compared with training on the individual synthetic subset. 2) All baselines achieved the best performance when trained on all synthetic subsets, indicating the positive impact of the synthetic datasets, especially when the real-world training data is scarce or difficult to acquire.
Appendix F Evaluation on Synthetic V3 with 18 labels
|
mIoU(%) |
Build. |
LowVeg. |
MediumVeg. |
HighVeg. |
Vehicle |
Truck |
Aircraft |
MilitaryVeh. |
Bike |
Motorcycle |
LightPole |
StreetSign |
Clutter |
Fence |
Road |
Windows |
Dirt |
Grass |
|
| RandLA-Net [Hu et al.(2020)Hu, Yang, Xie, Rosa, Guo, Wang, Trigoni, and Markham] | 67.52 | 94.11 | 39.42 | 46.84 | 96.32 | 82.39 | 82.45 | 66.72 | 70.02 | 21.72 | 56.54 | 78.27 | 40.22 | 55.25 | 78.50 | 80.64 | 59.28 | 80.37 | 86.22 |
| SCF-Net [Fan et al.(2021)Fan, Dong, Zhu, Lv, Ye, and Wang] | 69.07 | 93.31 | 45.40 | 49.40 | 96.51 | 82.17 | 83.08 | 68.28 | 71.93 | 22.29 | 57.98 | 80.99 | 45.27 | 63.06 | 79.29 | 79.97 | 57.63 | 80.79 | 85.86 |
| KPConv [Thomas et al.(2019)Thomas, Qi, Deschaud, Marcotegui, Goulette, and Guibas] | 70.35 | 96.18 | 35.17 | 47.88 | 97.04 | 86.44 | 84.24 | 75.35 | 72.26 | 23.09 | 57.59 | 86.65 | 43.07 | 62.69 | 85.60 | 81.82 | 67.23 | 79.29 | 84.68 |
Here, we evaluated the segmentation performance of three baseline networks (i.e., KpConv, RandLA-Net, SCF-Net) on the synthetic subset of our dataset. In light of the data diversity and quality, we selected the SyntheticV3 dataset for evaluation. The quantitative results achieved by different baselines are shown in Table 6. It can be seen that KPConv achieved the best segmentation performance on the SyntheticV3 subset, with a mIoU score of 70.35%, followed by the SCF-Net and RandLA-Net. We also noticed that all three baselines failed to achieve satisfactory performance on small objects such as low vegetation, bikes, and street signs. This is likely because the geometry and texture details of these small objects were lost during the 3D reconstruction in the photogrammetry process. Additionally, the performance on the underrepresented categories such as medium vegetation is also far from satisfactory, indicating learning from imbalanced class distribution remains a challenging problem for existing techniques.
Appendix G Instance Segmentation with Reduced Semantic Classes
| Metric |
mean (%) |
Build. |
Vege. |
Vehicle |
Large Vehicle |
Aircraft |
Bike |
Poles & Signs |
Clutter |
Fence |
|
| HAIS[Chen et al.(2021b)Chen, Fang, Zhang, Liu, and Wang] | AP | 42.9 | 68.1 | 22.1 | 77.1 | 48.9 | 47.0 | 46.8 | 26.1 | 24.2 | 25.9 |
| AP50 | 54.6 | 74.1 | 27.2 | 87.2 | 57.8 | 67.5 | 67.0 | 34.1 | 29.5 | 47.0 | |
| AP25 | 60.1 | 75.7 | 29.9 | 89.1 | 62.5 | 71.1 | 73.9 | 35.9 | 32.5 | 70.1 | |
| \hdashlinePointGroup[Jiang et al.(2020)Jiang, Zhao, Shi, Liu, Fu, and Jia] | AP | 33.4 | 63.6 | 19.8 | 57.0 | 44.4 | 36.9 | 20.0 | 21.7 | 18.2 | 19.6 |
| AP50 | 52.0 | 71.8 | 26.1 | 83.9 | 59.7 | 66.1 | 51.5 | 41.4 | 25.0 | 42.8 | |
| AP25 | 61.0 | 75.4 | 30.5 | 87.0 | 64.2 | 71.6 | 70.5 | 54.7 | 28.5 | 66.7 |
Since the instance segmentation performance depends on the quality of the semantic segmentation results, We also provided an instance segmentation benchmark with reduced semantics by merging similar semantic classes to eliminate the cascade effect from poor semantic segmentation. Specifically, low, medium, and high vegetation were merged into the vegetation category. Bicycle and motorcycle points were labeled as bike. Trucks and military vehicles were combined as large vehicles. The street signs were joined with light poles. Thus, the semantics were reduced from 14 classes to 9 classes. PointGroup [Jiang et al.(2020)Jiang, Zhao, Shi, Liu, Fu, and Jia] and HAIS [Chen et al.(2021b)Chen, Fang, Zhang, Liu, and Wang] were used again as the baselines. The results are shown in Table 7. Both HAIS and PointGroup achieved a higher AP (nearly 9%), which shows that if the semantic segmentation capability for similar object classes could be improved in the end-to-end instance segmentation networks, the performance of instance segmentation could also be increased.
Appendix H Data-Related Hyperparameters of Benchmark Methods
To achieve a trade-off between data scale, resolution, and computing resources, we empirically set 0.3m for grid downsampling to reduce the number of total points while preserving enough details. In addition, for voxel-based approaches, including MinkowskiNet, PointGroup, and HAIS, we set the sample size of on the XY plane. We used a sample size of for PointTransformer, an 18m radius of sphere for KpConv, and 40,960 input points for SCF-Net and RandLA-Net.
Appendix I Definition of Semantic Categories
Here, we provide a detailed definition of the semantic categories in our STPLS3D dataset.
SyntheticV1:
-
1.
Ground: including grass, paved road, dirt, etc.
-
2.
Building: including commercial, residential, educational buildings.
-
3.
Vegetation: including low, medium, and high vegetation.
-
4.
Vehicle: including sedan and hatchback cars.
-
5.
Light pole: including light poles and traffic lights.
-
6.
Street sign: including road signs at the side of roads.
-
7.
Clutter: including city furniture, construction equipment, barricades, and other 3D shapes.
SyntheticV2:
-
1.
Building: Same as the definition of building in SyntheticV1.
-
2.
Low vegetation: 0.5 m vegetation height 2.0 m.
-
3.
Medium vegetation: 2.0 m vegetation height 5.0 m.
-
4.
High vegetation: 5.0 m vegetation height.
-
5.
Passenger car: including sedans and hatchback cars.
-
6.
Truck: including pickup trucks, cement trucks, flat-bed trailers, trailer trucks, etc.
-
7.
Aircraft: including helicopters and airplanes
-
8.
Military vehicle: including tanks and Humvees.
-
9.
Bike: bicycles.
-
10.
Motorcycle: motorcycles.
-
11.
Light pole: Same as the definition of light pole in SyntheticV1.
-
12.
Street sign: Same as the definition of street sign in SyntheticV1.
-
13.
Clutter: Same as the definition of clutter in SyntheticV1.
-
14.
Fence: including timber, brick, concrete, metal fences.
-
15.
Road: including asphalt and concrete roads.
-
16.
Grass: including grass lawn, wild grass, etc.
SyntheticV3:
-
16.
Window: glass windows.
-
17.
Dirt: bare earth.
-
18.
Grass: Same as the definition of grass in SyntheticV2.
Note that, the definition of classes 1 to 15 is the same as SyntheticV2.
Real-world data:
-
1.
Ground: including grass, paved roads, dirt, sidewalk, parking lots, etc.
-
2.
Tree: including low, medium, and high vegetation.
-
3.
Car: including sedans and hatchback cars, pickup trucks, flatbed trailers, trailer trucks, etc.
-
4.
Light pole: including light poles, traffic lights, and street signs.
-
5.
Fence: including timber, brick, concrete, metal fences.
-
6.
Building (man-made structure): Including buildings, city furniture, construction equipment, site storage trailers, etc. (i.e., Objects that do not belong to ground, tree, car, light pole, and fence.)
Appendix J Class mapping between synthetic and real data
Considering that the semantic categories of the synthetic datasets are inconsistent with the real-world dataset (18 vs. 6), we conducted a class mapping to unify the semantic categories for the experiments discussed in 5.1. Specifically, road, dirt, and grass points were combined as ground. Low, medium and high vegetation were merged into the vegetation category. Cars, trucks, and military vehicles were labeled as vehicles. The street sign was joined with light poles, and all other objects except fences were merged with buildings as man-made structures.
Appendix K Visualization of the FDc dataset
To have an intuitive and clear understanding of the FDc data, we visualize the 3D point cloud along with its annotations in Figure 8.