What Makes Reading Comprehension Questions Difficult?
Abstract
For a natural language understanding benchmark to be useful in research, it has to consist of examples that are diverse and difficult enough to discriminate among current and near-future state-of-the-art systems. However, we do not yet know how best to select text sources to collect a variety of challenging examples. In this study, we crowdsource multiple-choice reading comprehension questions for passages taken from seven qualitatively distinct sources, analyzing what attributes of passages contribute to the difficulty and question types of the collected examples. To our surprise, we find that passage source, length, and readability measures do not significantly affect question difficulty. Through our manual annotation of seven reasoning types, we observe several trends between passage sources and reasoning types, e.g., logical reasoning is more often required in questions written for technical passages. These results suggest that when creating a new benchmark dataset, selecting a diverse set of passages can help ensure a diverse range of question types, but that passage difficulty need not be a priority.
1 Introduction
State-of-the-art systems have shown performance comparable with humans on many recent natural language understanding (NLU) datasets Devlin et al. (2019); Sun et al. (2021), suggesting that these benchmarks will no longer be able to measure future progress. To move beyond this, we will need to find better ways of building difficult datasets, ideally without sacrificing diversity or coverage Bowman and Dahl (2021). To obtain such human-written examples at scale, there are active lines of crowdsourcing research on protocols of worker handling and feedback Nangia et al. (2021) and the design of the collection task Ning et al. (2020); Rogers et al. (2020). However, we do not have clear information on what aspects of text sources affect the difficulty and diversity of examples.
MCTest: Tony walked home from school on his birthday. He was surprised to see a lot of cars in front of his house. When he opened the door and entered the house, he heard a lot of people yell, “Surprise!” It was a surprise party for his birthday. His parents called all his friends’ parents and invited them to come to a party for Tony. […] Q: Who were invited to the party and by who? Tony’s parents invited only his friends Tony invited his friends and their parents Tony’s parents invited his friends’ parents Tony’s parents invited his friends and their parents ReClor: Humanitarian considerations aside, sheer economics dictates that country X should institute, as country Y has done, a nationwide system of air and ground transportation for conveying seriously injured persons to specialized trauma centers. Timely access to the kind of medical care that only specialized centers can provide could save the lives of many people. […] Q: What is the economic argument supporting the idea of a transportation system across the nation of Country X? Building the transportation system creates a substantial increase of jobs for the locals Increasing access to specialized medical centers can lower the chance of the workforce population dying Transportation ticket prices directly contribute to the government’s revenue Country Y was successful with their attempts to poten-tially save lives so Country X should try it as well
Crowdsourced datasets in reading comprehension use passages taken from a variety of sources, such as news articles, exams, and blogs, about which questions are written Lai et al. (2017); Trischler et al. (2017); Rogers et al. (2020). The first example in Figure 1 is from MCTest Richardson et al. (2013), the passages of which are written in grade-school-level English. The second example is from ReClor Yu et al. (2020), which consists of passages and questions written for graduate and law school admission examinations. We hypothesize that difficult passages, such as those in the second example, are more suitable for crowdsourcing challenging questions. Passages that are linguistically complex and have dense information could help facilitate the writing of questions that require understanding a wide range of linguistic and world knowledge, following intricate events, and comprehending logical arguments. In contrast, easy passages, as in children’s stories, likely talk about common situations and simple facts, which might prevent workers from writing difficult questions.
In this work, we crowdsource multiple-choice reading comprehension questions to analyze how question difficulty and type are affected by the choice of source passage. Using passages extracted from seven different sources, we ask crowdworkers to write questions about the given passages. We compute the difference between human and machine accuracy, using it as a measure of the question difficulty, to investigate whether there is a correlation between the question difficulty and linguistic aspects of the passage, such as their source, length, and readability.
In addition to a standard setting where we directly accept crowdworkers’ submissions, we use an adversarial setting in which they have to write questions that fool a strong reading comprehension model Bartolo et al. (2020); Kiela et al. (2021). Previous work finds that questions that require numerical reasoning frequently appear in the adversarial data collection of the extractive QA task on Wikipedia articles Kaushik et al. (2021), but our aim is to see whether we observe a similar trend in multiple-choice questions written for different passage sources or if the adversarial setting is useful for collecting especially diverse questions.
To our surprise, we find that the difficulty of collected questions does not depend on the differences of passages in linguistic aspects such as passage source, passage length, Flesch–Kincaid grade level Kincaid et al. (1975), syntactic and lexical surprisal, elapsed time for answering, and the average word frequency in a passage. Our main positive finding comes through our manual annotation of the types of reasoning that each question targets, where we observe that questions that require numerical reasoning and logical reasoning are relatively difficult. In addition, we find several trends between the passage sources and reasoning types. For example, logical reasoning is more often required in questions written for technical passages, whereas understanding of a given passage’s gestalt and the author’s attitude toward it are more frequently required for argumentative and subjective passages than expository passages.
These results suggest that when creating a new benchmark dataset or choosing one for evaluating NLU systems, selecting a diverse set of passages can help ensure a diverse range of question types, but that passage difficulty need not be a priority. Our collected datasets could be useful for training reading comprehension models and for further analysis of requisite knowledge and comprehension types in answering challenging multiple-choice questions.111Our datasets, annotation instructions and results, and crowdsourcing scripts are available at https://github.com/nii-cl/qa-text-source-comparison.
2 Related Work
Crowdsourcing NLU Datasets
Crowdsourcing has been widely used to collect human-written examples at scale Rajpurkar et al. (2016); Trischler et al. (2017). Crowdworkers are usually asked to write questions about a given text, sometimes with constraints imposed to obtain questions that require specific reasoning skills such as multi-hop reasoning Yang et al. (2018) or understanding of temporal order, coreference, or causality Rogers et al. (2020). In this study, to analyze naturally written examples, we do not consider specific constraints on questions or answer options.
Current benchmark datasets constructed by crowdsourcing may not be of sufficient quality to precisely evaluate human-level NLU. For example, Ribeiro et al. (2020) reveal that state-of-the-art models in traditional NLP benchmarks fail simple behavioral tests of linguistic capabilities (checklists). Chen and Durrett (2019) and Min et al. (2019) show that questions in multi-hop reasoning datasets such as HotpotQA by Yang et al. (2018) do not necessarily require multi-hop reasoning across multiple paragraphs.
To investigate how to collect high-quality, challenging questions through crowdsourcing, Nangia et al. (2021) compare different sourcing protocols and find that training workers and providing feedback about their submissions improve the difficulty and quality of their reading comprehension questions. To encourage workers to write difficult examples, Bartolo et al. (2020) propose to collect questions using a model-in-the-loop setting. Although this adversarial approach enables us to collect challenging questions efficiently, Gardner et al. (2020) point out that the collected examples might be biased towards the quirks of the adversary models. Bowman and Dahl (2021) extend this argument, and point out that adversarial methods can systematically eliminate coverage of some phenomena. This is also supported by Kaushik et al. (2021), but their findings are limited to extractive QA for Wikipedia articles. Our motivation is to see if this argument is applicable to the multiple-choice format with a wide range of passage sources for which we expect crowdworkers to write linguistically diverse questions and answer options.
Sources of NLU Datasets
Reading comprehension datasets are often constructed with a limited number of passage sources. Rajpurkar et al. (2016) sample about five hundred articles from the top 10,000 articles in PageRank of Wikipedia. Similarly, Dua et al. (2019) curate passages from Wikipedia articles containing numeric values to collect questions for mathematical and symbolic reasoning. Khashabi et al. (2018) construct a dataset in which questions are written for various passage sources such as news articles, science textbooks, and narratives. However, we cannot use their questions for our analysis of the variation of naturally written questions because they are designed to require local multi-sentence reasoning (such as coreference resolution and paraphrasing) by filtering out questions answerable only with a single sentence.
Similarly to our work, Sugawara et al. (2017) find that readability metrics and question difficulty do not correlate in reading comprehension datasets. Our study differs in the following two points, which could cause different findings: First, their observational study of existing datasets has fundamental confounding factors because the questions they examine are constructed using different sourcing methods (e.g., automatic generation, expert writing, and crowdsourcing), which could have an impact on the question difficulty. We aim to investigate uniformly crowdsourced examples across seven different sources to obtain insights for future data construction research using crowdsourcing. Second, they define question difficulty using human annotations alone, but this does not necessarily reflect the difficulty for current state-of-the-art models. In this study, we define the question difficulty as the human–machine performance gap using eight recent strong models, which enables a more fine-grained analysis of the collected questions for a better benchmark of current models.
Fisch et al. (2019) propose a shared task consisting of different in-domain and out-domain datasets. However, they combine datasets in different task formats and sourcing methods, which prevents us from comparing questions across passage sources alone. In contrast, our focus is to compare questions collected by crowdsourcing for the same task format to analyze the question difficulty for current state-of-the-art models. We adopt the multiple-choice format because, as discussed by Huang et al. (2019), it allows us to evaluate both human and machine performance easily.
3 Crowdsourcing Tasks
This study aims to analyze what kinds of passages make crowdsourced reading comprehension questions difficult. We use Amazon Mechanical Turk. To collect difficult and high-quality examples, we require crowdworkers to take a qualification test before accepting our question writing and validation tasks.
3.1 Worker Qualification
The qualification test has two parts, which we run in separate tasks: question answering and writing. To take the qualification test, workers have to meet the following minimum qualifications: based in the United States, Canada, or United Kingdom, have an approval rate of at least 98%, and have at least 1,000 approved tasks.
The question answering task is used to identify workers who answer reading comprehension questions carefully. A single question answering task has five questions that are randomly sampled from the validation set of ReClor in which most questions are taken from actual exams. Those who correctly answer at least four out of the five questions proceed to the next qualification phase.
The question writing task is used to familiarize workers with the writing of multiple-choice reading comprehension questions and select those who can carefully write examples. We ask workers to write two questions given two different passages randomly sampled from the validation set of RACE Lai et al. (2017). This dataset consists of self-contained passages written for middle- and high-school exams in various subjects, which we expect the workers to be able to write questions for easily. Following Nangia et al. (2021), we then review the workers’ submissions and grade them using a rubric with four criteria: the question (1) is answerable without ambiguity (yes or no); (2) requires reading the whole passage (five-point scale); (3) is creative and non-obvious (five-point scale); and (4) has distractor answers that could look correct to someone who has not read the passage carefully (more than one, one, or no). We rank workers using this rubric and allow approximately the top 50% of workers to proceed to the main writing task. We make sure that these workers write two unambiguous and answerable questions.
3.2 Writing Task
In the main writing task, a worker is shown a single passage and asked to write a question about it along with four answer options. We provide instructions where we describe that questions have to be challenging but still answerable and unambiguous for humans, and we include good and bad examples to illustrate what kinds of questions we aim to collect. For example, good examples require reading the whole passage and ask about characters’ motivations or consequences of described events, while bad examples only ask about a simple fact or are answerable without reading the passage (Appendix P).
Each worker who passes the qualification round is randomly assigned to either standard or adversarial data collection. In the standard collection, we accept workers’ submissions without any filtering. In the adversarial collection, a written question is sent to a reading comprehension model immediately. If the model cannot answer that question correctly, we accept it. We allow workers to submit questions (i.e., get paid) after three attempts even if they keep failing to fool the model. We use UnifiedQA 3B v2 Khashabi et al. (2020) for the adversary model, which is trained on a wide variety of question answering datasets such as MCTest, RACE, NarrativeQA Kočiský et al. (2018), and SQuAD. While the source of training data that we use in our models will inevitably influence our findings, focusing on a model with very diverse pretraining and fine-tuning will minimize this effect.
Passage Sources
We use passages from the following seven sources: (1) MCTest children’s narratives, (2) Project Gutenberg narratives, (3) Slate online magazine articles from the 1990s sourced from the Open American National Corpus Ide and Suderman (2006), (4) middle- and high-school exams from RACE, (5) graduate-level exams from ReClor, and (6) science and (7) arts articles from Wikipedia. We use the passages from the training sets of MCTest, RACE, and ReClor. For Gutenberg, Slate, and Wikipedia, we split available books and articles into passages. Details are in Appendix A. In the writing task, a passage is randomly taken from a passage pool in which there are the same number of passages extracted from each source.
3.3 Validation Task
We collect the votes of five workers for each of the collected questions. Those workers who passed the question answering task of the qualification round can accept the validation tasks. To incentivize workers, we use preexisting gold-labeled examples (from Nangia et al., 2021) as catch trials, representing about 10% of the tasks, and pay a bonus of $0.50 USD if a worker can answer those questions correctly at least 80% of the time. If a worker fails to answer them at least 60% of the time, we disqualify the worker from future rounds of data collection.
Worker Pay and Logistics
For the writing tasks, the base pay is $2.00 per question, which we estimate to be approximately $15.00 per hour based on measurements from our pilot runs. If a worker succeeds in fooling the model in adversarial data collection, they receive an additional bonus of $1.00. For validation, a single task consisting of five questions pays $2.00, which we estimate to be approximately $15.00 per hour as well.
4 Crowdsourcing Results
4.1 Dataset Construction
We collect a total of 4,340 questions, with 620 in each of the seven sources, further divided into 310 each for the standard and adversarial methods. Each passage is paired with only one question. We randomly sample two out of five validation votes to validate the collected examples and use the remaining three votes for measuring human performance. In the validation, we regard a question as valid if at least one of the two votes is the same as the writer’s gold answer. If both votes are the same as the gold answer, the question is regarded as a high-agreement example. We find that 90.3% of the collected questions are valid (92.0% for standard collection and 88.7% for adversarial collection). In addition, 65.7% of the collected questions are classified as high-agreement (68.7% and 62.7% for standard and adversarial collection, respectively). We present the dataset and worker statistics in Appendices B and C.
| All valid examples | High-agreement portion | ||||||||||
| Source Method | Human | UniQA | DeBERTa | M-Avg. | Human | UniQA | DeBERTa | M-Avg. | |||
| MCTest | Dir. | 89.1 | 68.3 | 84.5 | 78.1 | 11.0 | 95.0 | 71.5 | 88.2 | 81.5 | 13.5 |
| Adv. | 93.6 | 26.5 | 75.3 | 66.6 | 27.1 | 96.5 | 27.9 | 78.6 | 68.2 | 28.3 | |
| Total | 91.4 | 47.4 | 79.9 | 72.3 | 19.0 | 95.8 | 49.3 | 83.3 | 74.7 | 21.1 | |
| Gutenberg | Dir. | 85.2 | 70.7 | 84.5 | 79.9 | 5.3 | 92.8 | 75.0 | 88.5 | 83.4 | 9.4 |
| Adv. | 83.0 | 26.4 | 80.1 | 69.7 | 13.3 | 87.5 | 28.3 | 82.6 | 72.9 | 14.6 | |
| Total | 84.1 | 48.8 | 82.3 | 74.8 | 9.3 | 90.3 | 53.1 | 85.7 | 78.4 | 11.9 | |
| Slate | Dir. | 84.9 | 72.4 | 88.9 | 84.1 | 0.8 | 90.7 | 74.6 | 91.7 | 87.0 | 3.8 |
| Adv. | 82.6 | 26.0 | 71.7 | 69.4 | 13.2 | 92.9 | 27.9 | 76.0 | 73.8 | 19.1 | |
| Total | 83.8 | 49.8 | 80.5 | 77.0 | 6.8 | 91.8 | 52.6 | 84.3 | 80.8 | 11.0 | |
| RACE | Dir. | 91.2 | 70.4 | 85.0 | 80.8 | 10.3 | 95.4 | 74.8 | 90.4 | 84.6 | 10.8 |
| Adv. | 89.4 | 28.9 | 69.4 | 65.0 | 24.4 | 94.3 | 31.0 | 73.8 | 67.3 | 27.0 | |
| Total | 90.3 | 50.0 | 77.3 | 73.1 | 17.3 | 94.9 | 53.3 | 82.2 | 76.1 | 18.8 | |
| ReClor | Dir. | 94.1 | 72.6 | 88.5 | 80.6 | 13.5 | 96.9 | 79.6 | 91.1 | 84.4 | 12.5 |
| Adv. | 83.9 | 29.2 | 71.5 | 66.3 | 17.6 | 88.8 | 32.4 | 74.5 | 71.3 | 17.5 | |
| Total | 89.2 | 51.7 | 80.4 | 73.7 | 15.5 | 93.2 | 58.1 | 83.5 | 78.5 | 14.8 | |
| Wiki. Sci. | Dir. | 90.6 | 75.9 | 90.6 | 83.2 | 7.3 | 95.8 | 79.0 | 94.9 | 87.3 | 8.5 |
| Adv. | 84.3 | 27.4 | 75.2 | 65.6 | 18.8 | 92.8 | 29.4 | 77.2 | 68.3 | 24.5 | |
| Total | 87.5 | 52.1 | 83.0 | 74.6 | 12.9 | 94.4 | 56.3 | 86.8 | 78.6 | 15.8 | |
| Wiki. Arts | Dir. | 88.3 | 76.2 | 88.7 | 84.2 | 4.1 | 91.5 | 77.0 | 92.5 | 88.1 | 3.4 |
| Adv. | 83.3 | 25.5 | 73.8 | 69.4 | 13.9 | 91.4 | 25.8 | 75.8 | 71.7 | 19.7 | |
| Total | 85.8 | 51.2 | 81.3 | 76.9 | 8.9 | 91.5 | 52.3 | 84.5 | 80.2 | 11.2 | |
| All sources | Dir. | 89.0 | 72.4 | 87.2 | 81.6 | 7.5 | 94.0 | 75.9 | 91.0 | 85.2 | 8.8 |
| Adv. | 85.7 | 27.1 | 73.8 | 67.4 | 18.3 | 92.0 | 29.0 | 76.9 | 70.5 | 21.5 | |
| Total | 87.4 | 50.2 | 80.7 | 74.6 | 12.8 | 93.1 | 53.6 | 84.3 | 78.2 | 14.9 | |
4.2 Human Performance
Table 4.1 displays human and model performance. We use the questions that are validated using two out of five human votes in the validation step above and take the majority vote of the remaining three votes to measure human performance on them. We observe 3.3% and 2.0% gaps between the standard and adversarial collection in the valid and high-agreement questions, respectively.
4.3 Machine Performance
To establish the model performance that is not biased towards a single model, we compute the average accuracy (M-avg.) of eight different models from the following two classes: RoBERTa large (four models with different random seeds; Liu et al., 2019) and DeBERTa large and xlarge (v2; He et al., 2021) either fine-tuned on MNLI Williams et al. (2018) first or not.
The RoBERTa and DeBERTa models are all fine-tuned on RACE. Among these models, DeBERTa xlarge (MNLI-fine-tuned) performs best on RACE, achieving 86.8% accuracy. Because UnifiedQA 3B (72.3% on RACE) is used in the adversarial data collection, it shows lower accuracy on the adversarial questions (not included in the average). The performance of these two models is shown for comparison in Table 4.1. Except where noted, we do not train the models on any collected questions.
Supervised Performance
For each dataset, we evaluate the performance of DeBERTa large trained on the datasets other than the target dataset in a leave-one-out manner. Our motivation is to see whether the accuracy values significantly improve by training (i.e., the human–model gaps decrease). If there is a large gain, it would imply that the datasets have simple patterns among examples that the models can exploit. The results show no significant gains in the adversarial datasets, but the standard datasets show some small gains (Appendix D).
Partial-Input Performance
As Kaushik and Lipton (2018) point out, reading comprehension datasets might have annotation artifacts that enable models to answer questions without passages or question sentences. To investigate such artifacts in our collected examples, we evaluate the performance of two DeBERTa models (xlarge and large fine-tuned on MNLI), which are stronger than the others, with the ablation of questions (P+A), passages (Q+A), and both questions and passages (A only). We see large drops in the zero-shot performance of DeBERTa xlarge. In addition, we do not observe a significant performance improvement in the supervised performance by DeBERTa large (MNLI-fine-tuned). These results demonstrate that the collected questions and answer options do not have severe annotation artifacts for any passage source (Appendix E).
4.4 Human–Model Performance Gap
Following Nangia et al. (2021), we compute the human–model performance gap () between the human and the average model accuracies to estimate the difficulty of questions for models. We observe a small variation in the gap for different passage sources in the high-agreement questions . We find the highest human performance for MCTest questions in the high-agreement portion and the lowest for Gutenberg, whereas the model’s highest performance is for Slate and the lowest for MCTest. Surprisingly, the questions sourced from MCTest, which consists of simple narrative passages, show the largest gap out of all sources for the high-agreement questions. Although ReClor consists of passages for graduate-level exams, it produces smaller gaps than RACE, which consists of passages for middle- and high-school English exams. Gutenberg passages are written for adults, but the examples written for those passages do not show larger gaps than those for MCTest passages. We find a trend in the human performance: the questions of easy-to-read sources (e.g., MCTest and RACE) show higher accuracy and those of difficult-to-read sources (e.g., Gutenberg and Slate) show lower, but this trend is not observed either in the machine performance or human–machine performance gap. These observations are inconsistent with our initial expectations in the introduction.
5 Linguistic Analysis
We analyze how the linguistic aspects of the collected examples correlate with the human–model performance gap computed in the experiments. To get a better estimate of human performance, we use the high-agreement examples Nie et al. (2020). For ease of comparison, we split these examples into two subsets: easy () and hard (). These subsets have 1,970 and 547 examples, respectively. Appendix F provides the frequency of easy and hard examples across the passage sources and collection methods.
5.1 Readability Measures
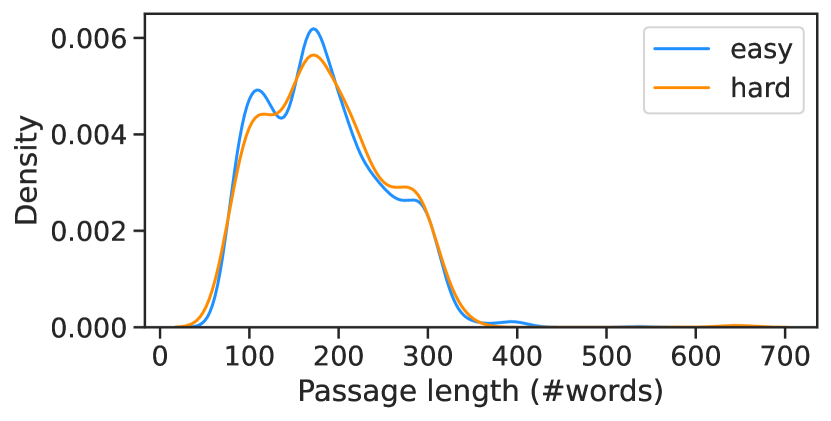
We compute the correlation between the human–model performance gap and readability measures across all valid examples (Pearson’s and -value) and independence between the distributions of the easy and hard subsets about the measures (-value in Welch’s t-test). Figure 2 shows the density distributions of the easy and hard subsets, while Appendices G to L provide the plots of all valid examples.
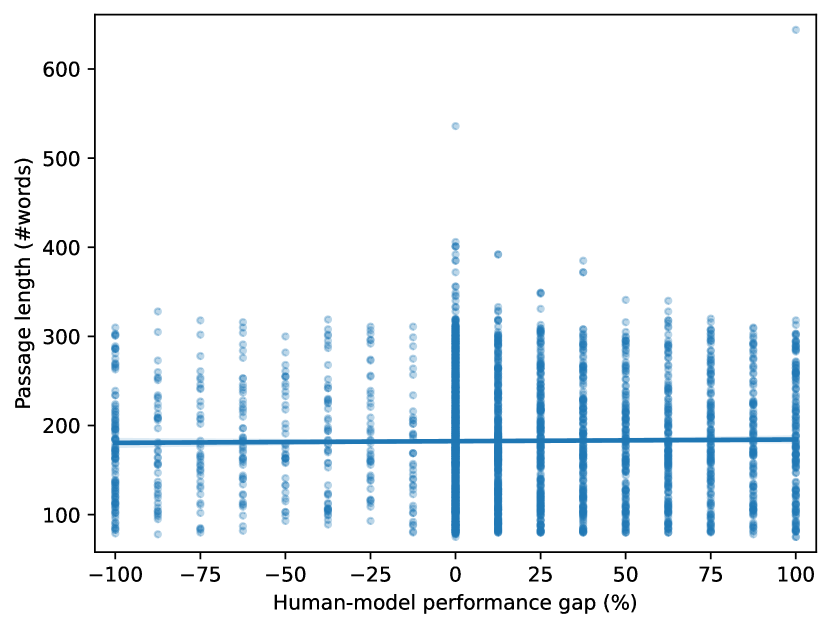
Passage Length
We use the number of words (except for punctuation) as the passage length (top left in Figure 2). Across all examples, we observe () (the full plot is in Appendix G). The t-test shows . We observe no relationship between the passage length and question difficulty. We also analyze question and option length in Appendix H.
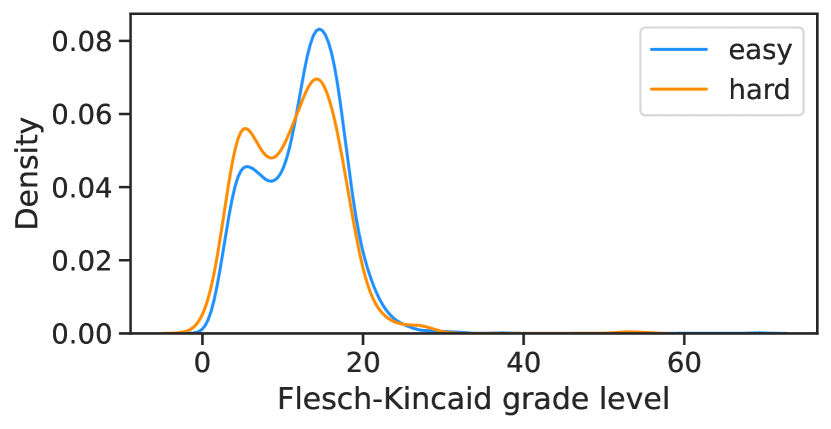
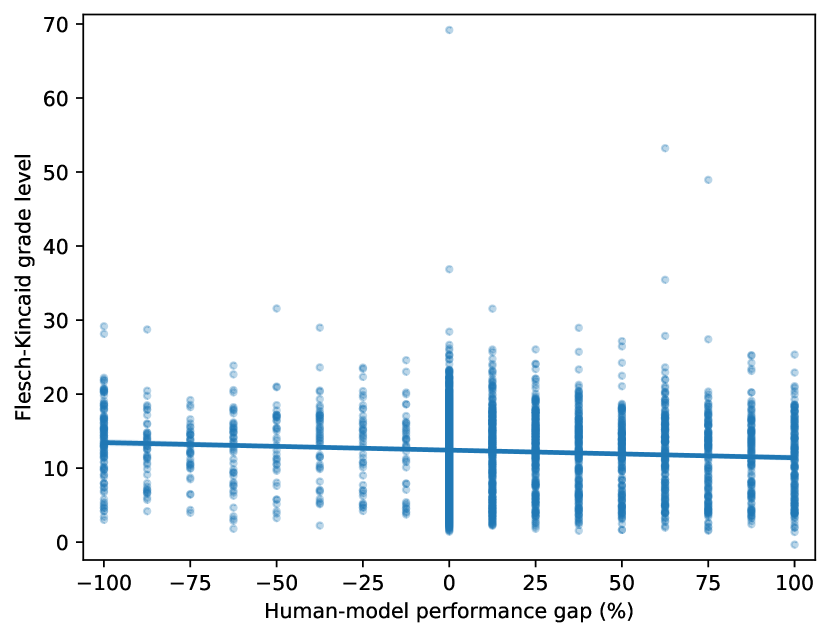
Flesch–Kincaid Grade Level
We use the Flesch–Kincaid grade level Kincaid et al. (1975) as a basic metric of text readability (top center in Figure 2). This metric defines readability based on an approximate US grade level with no upper bound (higher is more difficult to read). It is computed for a passage using the average number of words that appear in a sentence and the average number of syllables in a word (Appendix I). The correlation between the grade and human–model performance gap is () and the t-test shows . This result demonstrates that passage readability has a small negative effect on the question difficulty, perhaps pointing to an interfering effect whereby our pre-qualified human annotators are more likely to make mistakes on more complex passages.
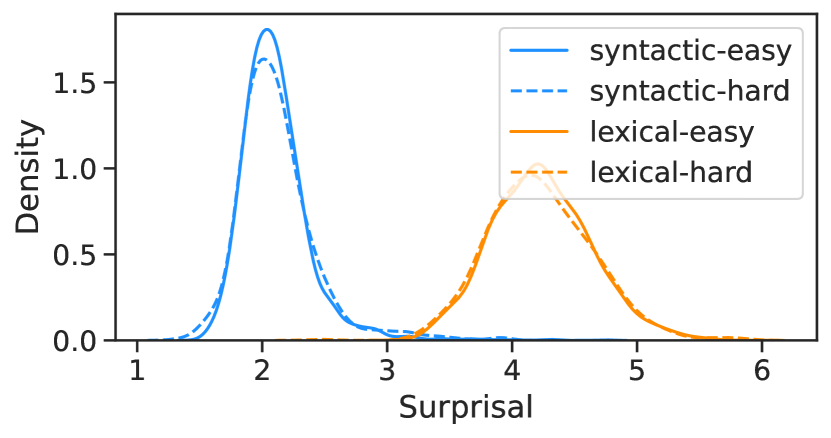
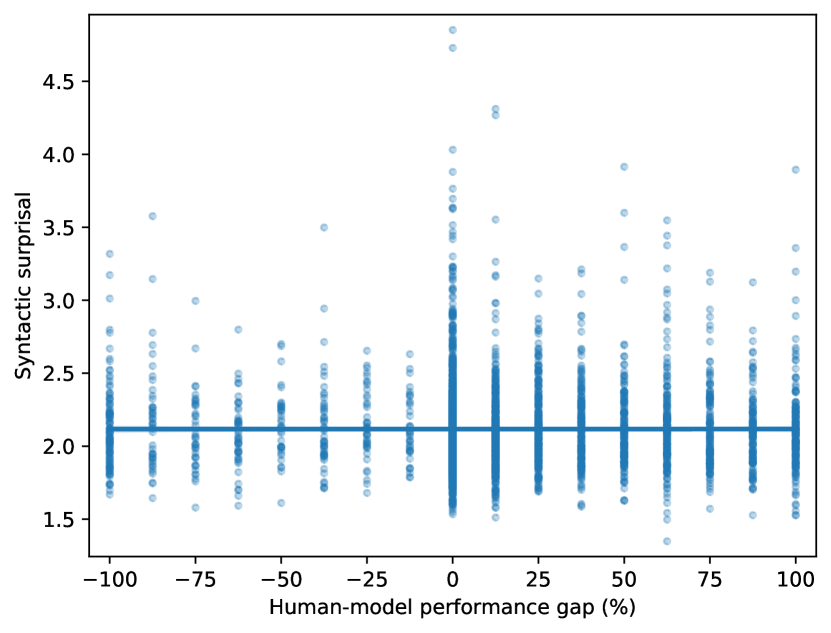
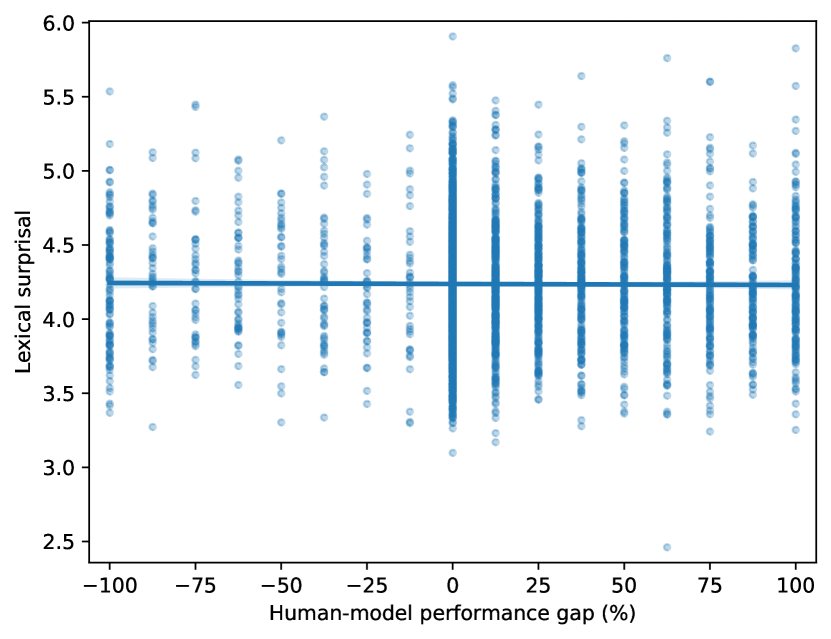
Syntactic and Lexical Surprisal
The Flesch–Kincaid grade level only considers sentence length and the number of syllables. To better estimate the passage difficulty in terms of the psycholinguistic modeling of human text processing, we use syntactic and lexical surprisal measures Roark et al. (2009). These measures are computed using incremental parsing and proved to be useful for predicting human reading time. We observe () for syntactic surprisal and () for lexical surprisal across all examples. We do not observe any statistically significant difference between the easy and hard subsets (syntactic and lexical in the t-test; see top right in Figure 2). Appendix J describes details of the calculation.
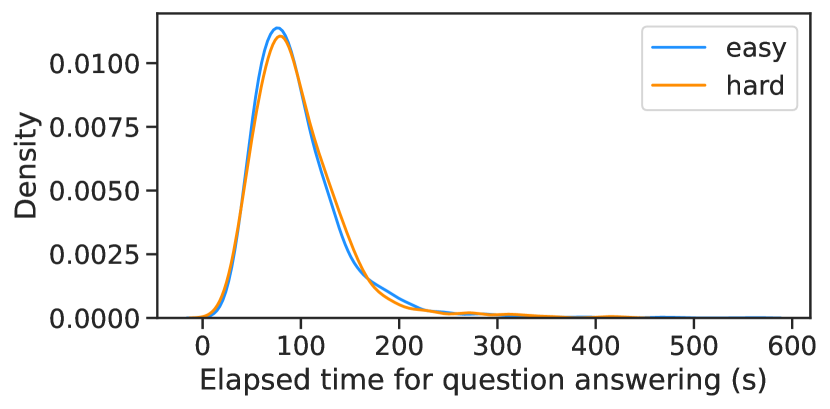
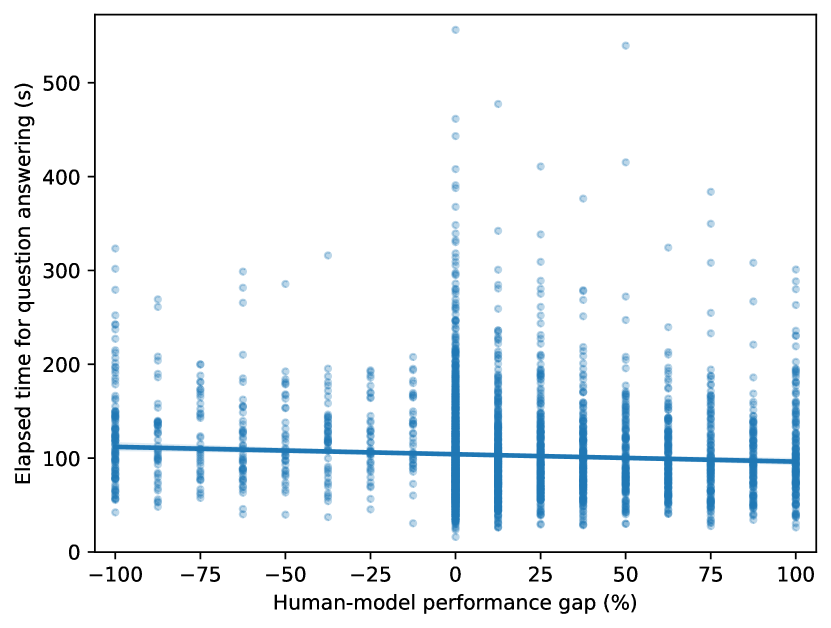
Annotation Speed
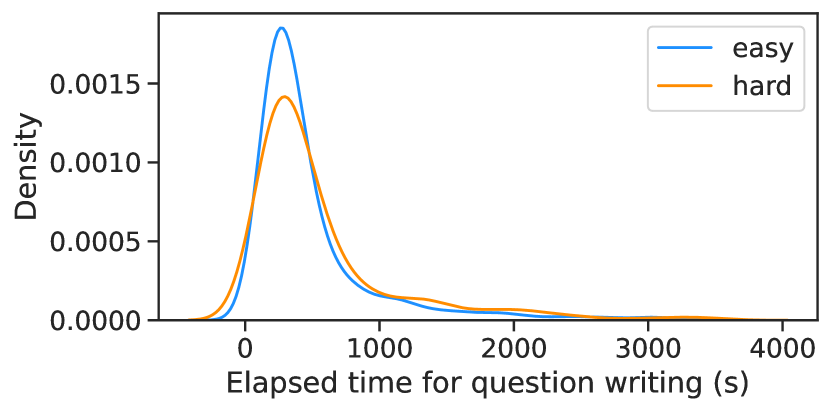
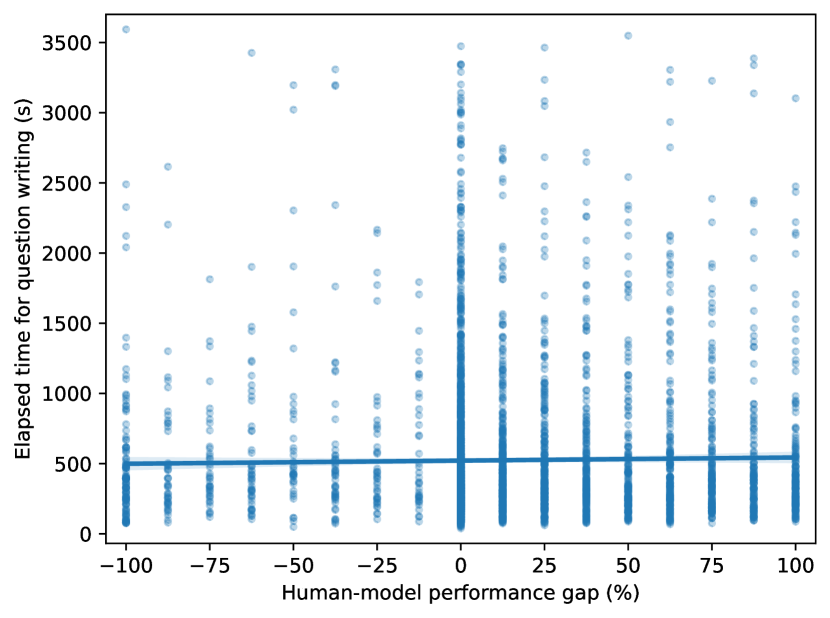
Inspired by the psycholinguistic study of text complexity Gibson (1998); Lapata (2006), we measure the average time crowdworkers spent answering questions in the validation tasks (see bottom left in Figure 2). This measures the elapsed time of both reading a given passage and thinking about its question, which is used as an approximation of reading time (as a proxy of text readability). The correlation coefficient ( with ) and t-test () show that there is only a small negative correlation with question difficulty. We also measure the elapsed time for writing questions as a reference (bottom center in Figure 2 and Appendix K), observing that there is no strong correlation ( with ).
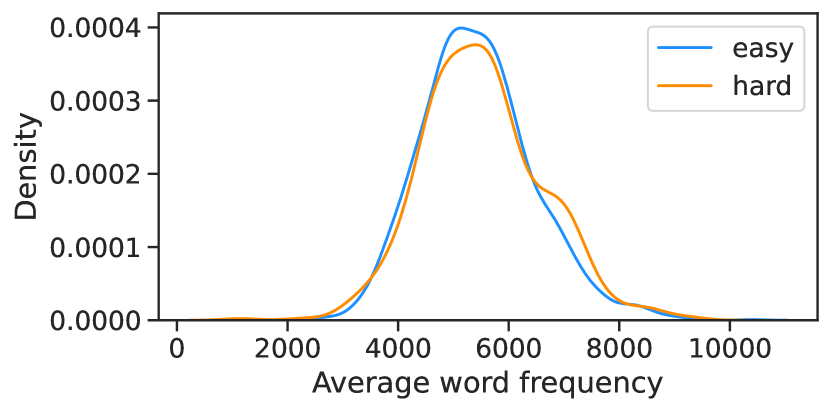
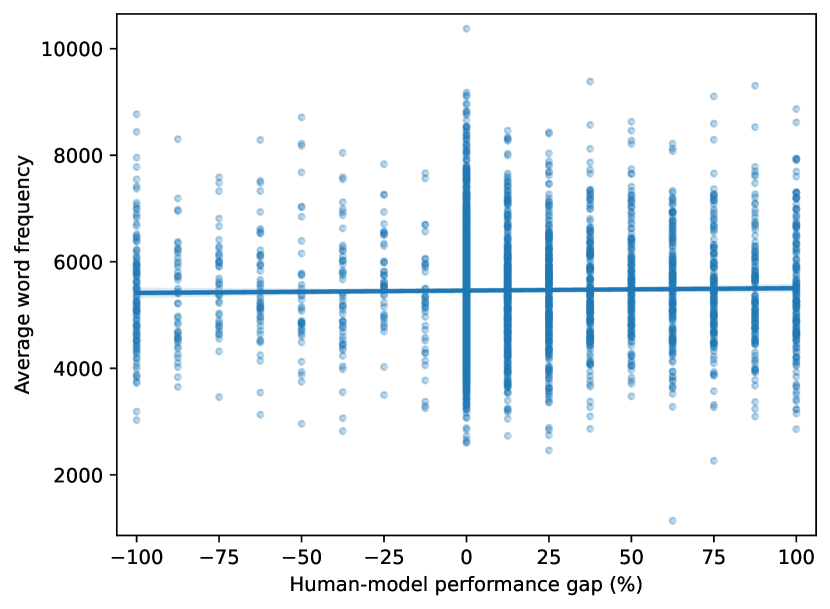
Word Frequencies
Following Chen and Meurers (2016), we analyze the effect of word frequencies on text readability. Using word frequencies per one million words in SUBTLEXus Brysbaert and New (2009), we calculate the average frequency of words appearing in a passage as a measure of passage difficulty in terms of vocabulary (a lower average frequency implies greater difficult). We do not observe any statistically significant difference by the t-test (bottom right in Figure 2) or Pearson’s with (Appendix L). We observe similar trends even when using the human performance as the difficulty measure (Appendix N).
5.2 Question Types
We analyze how passage sources and collection methods affect question types in this section.
Question Words
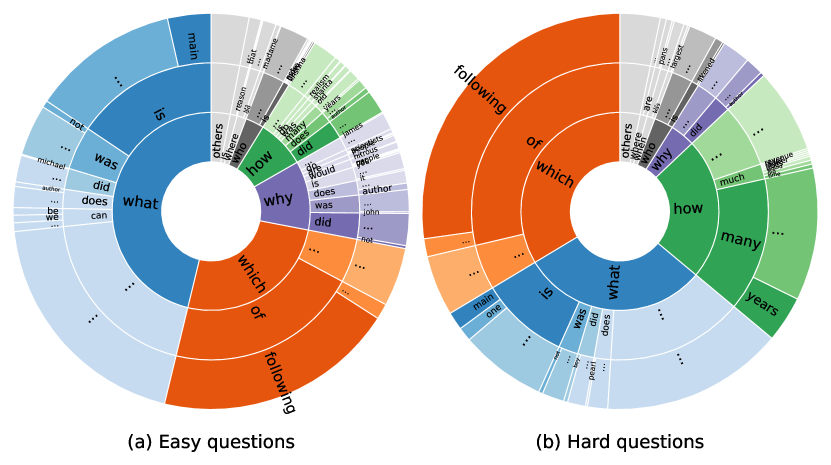
We automatically extract the first wh-words that appear in each valid question; if no wh-word is extracted, we count the question as polar. Figure 3 plots the question words and their two subsequent words (except articles) in the easy and hard questions. From this we observe that the hard questions are generic, not specific to given passages (e.g., which of the following is correct?) more often than the easy questions. This probably results from the difference between the standard and adversarial data collection. The workers in the adversarial collection tend to write generic questions, while those in the standard collection write questions that are more balanced (e.g., there are more easy why and how questions). We also notice that the hard subset has more how many questions. This is likely due to the fact that it is easy for annotators to learn that numeric questions often fool the adversary model. These observations imply that adversarial data collection tends to concentrate the distribution of questions towards a few specific question types (e.g., generic and numeric). This is consistent with the observations in Kaushik et al. (2021). See Appendix M for details.
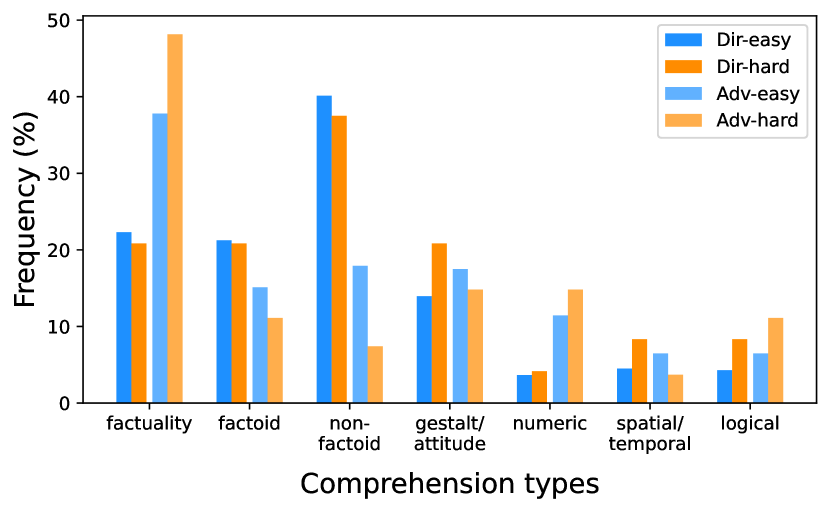
Comprehension Types
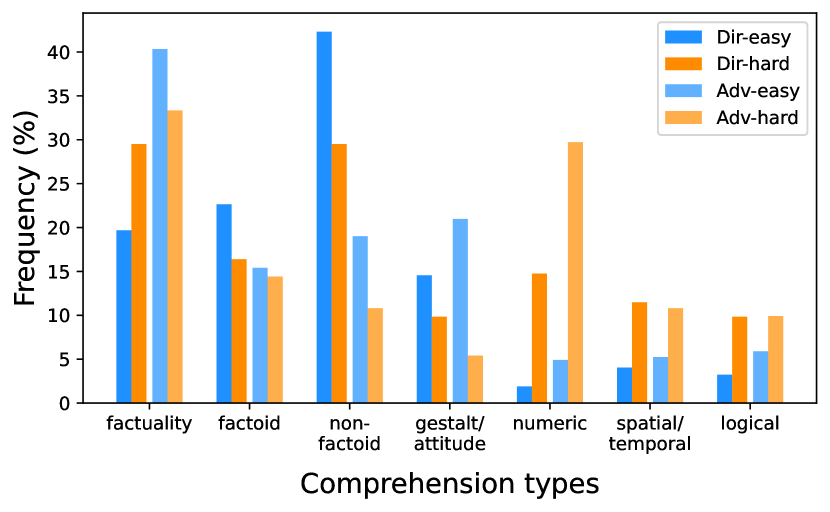
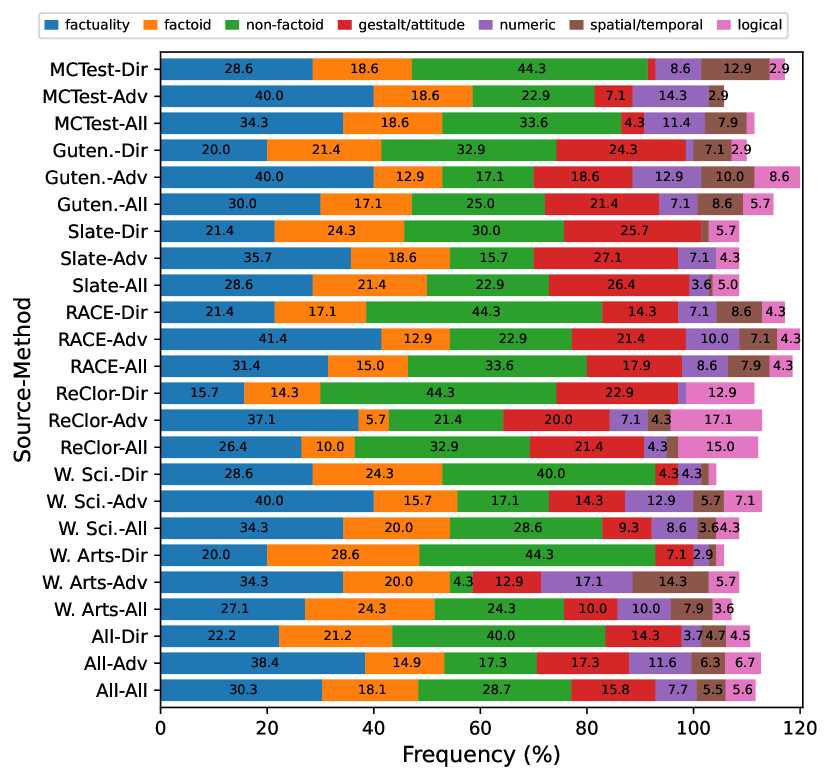
Following Bartolo et al. (2020) and Williams et al. (2020), we analyze what kind of comprehension is required to answer the collected questions. We sample a total of 980 high-agreement questions, 70 from each passage source and collection method, and then manually annotate them with one or more labels of seven comprehension types. The definitions of these types, examples, and detailed results are presented in Appendix M. Figure 4 shows the frequency of comprehension types for different question difficulties (676 easy, 172 hard) and the collection methods. We find that 868 questions have one label, 110 have two labels, and two have three labels. We can see that numeric, spatial/temporal, and logical questions appear more often in the hard subset in both collection methods.222In contrast, when we use the average human performance as the question difficulty measure, no comprehension type is significantly harder than the others (Appendix N). Looking at the frequency across the passage sources in Figure 5, we find that there are some trends between the sources and comprehension types as follows:
-
•
Technical documents, such as those used in graduate-school-level reading comprehension exams, tend to yield logical reasoning questions (e.g., ReClor and Slate).
-
•
Child-level texts tend to yield numerical reasoning questions in the standard setting (e.g., MCTest and RACE). In the adversarial setting, passages containing many numerical values tend to yield such questions (e.g., MCTest and Wikipedia arts).
-
•
To collect gestalt questions or those considering the author’s attitude in a given passage, passages covering subjective or argumentative topics (e.g., Gutenberg, Slate, and ReClor) are suitable. In contrast, expository passages such as Wikipedia articles are not.
-
•
Narratives and related texts (e.g., MCTest, Gutenberg, and part of RACE) involve events with characters, which tend to yield spatial/temporal reasoning questions.
Although the definitions of our comprehension types are coarse and these trends do not ensure that specific kinds of passages always yield the target comprehension type, considering passage sources might be an effective strategy for collecting questions of an intended comprehension type. Adversarial data collection for this purpose might not be useful because it may encourage workers to focus on writing only a few specific types of questions (e.g., numeric).
6 Conclusion
To make an NLU benchmark useful, it has to consist of examples that are linguistically diverse and difficult enough to discriminate among state-of-the-art models. We crowdsource multiple-choice reading comprehension questions for passages extracted from seven different sources and analyze the effects of passage source on question difficulty and diversity.
Although we expect that the difficulty of a passage affects the difficulty of questions about that passage, the collected questions do not show any strong correlation between the human–machine performance gap and passage source, length, or readability measures. Our manual annotation of comprehension types reveals that questions requiring numerical or logical reasoning are relatively difficult. We also find several trends between passage sources and comprehension types.
These results suggest that when creating a new benchmark dataset, we need to select passage sources carefully, so that the resulting dataset contains questions that require an understanding of the linguistic phenomena that we are interested in. This is especially important in the adversarial setting because it could concentrate the distribution of questions towards a few specific question types.
Ethics Statement
We aim to accelerate scientific progress on robust general question answering, which could translate downstream to useful tools. We are not looking at possible sources of social bias, although this issue should be highly relevant to those considering sources to use as training data for applied systems Li et al. (2020); Parrish et al. (2022). We are using Amazon Mechanical Turk despite its history of sometimes treating workers unfairly Kummerfeld (2021), especially in recourse for unfair rejections. We make sure that our own pay and rejection policies are comparable to in-person employment, but acknowledge that our study could encourage others to use Mechanical Turk, and that they might not be so careful. This work passed review or is exempt from the oversight of the internal review boards of the authors’ institutes.
Acknowledgments
We thank Saranya Venkatraman and Ethan Perez for their feedback on early drafts of this paper. For his early contributions to this project, we thank Harsh Trivedi. SS was supported by JST PRESTO Grant No. JPMJPR20C4. This project has benefited from financial support to SB by Eric and Wendy Schmidt (made by recommendation of the Schmidt Futures program), Samsung Research (under the project Improving Deep Learning using Latent Structure), and Apple. This material is based upon work supported by the National Science Foundation under Grant Nos. 1922658 and 2046556. Any opinions, findings, and conclusions or recommendations expressed in this material are those of the author(s) and do not necessarily reflect the views of the National Science Foundation.
References
- Bartlett et al. (2009) Susan Bartlett, Grzegorz Kondrak, and Colin Cherry. 2009. On the syllabification of phonemes. In Proceedings of Human Language Technologies: The 2009 Annual Conference of the North American Chapter of the Association for Computational Linguistics, pages 308–316, Boulder, Colorado. Association for Computational Linguistics.
- Bartolo et al. (2020) Max Bartolo, Alastair Roberts, Johannes Welbl, Sebastian Riedel, and Pontus Stenetorp. 2020. Beat the AI: Investigating adversarial human annotation for reading comprehension. Transactions of the Association for Computational Linguistics, 8:662–678.
- Bird et al. (2009) Steven Bird, Ewan Klein, and Edward Loper. 2009. Natural language processing with Python: analyzing text with the natural language toolkit. O’Reilly Media, Inc.
- Bowman and Dahl (2021) Samuel R. Bowman and George Dahl. 2021. What will it take to fix benchmarking in natural language understanding? In Proceedings of the 2021 Conference of the North American Chapter of the Association for Computational Linguistics: Human Language Technologies, pages 4843–4855, Online. Association for Computational Linguistics.
- Brysbaert and New (2009) Marc Brysbaert and Boris New. 2009. Moving beyond kučera and francis: A critical evaluation of current word frequency norms and the introduction of a new and improved word frequency measure for american english. Behavior research methods, 41(4):977–990.
- Chen and Durrett (2019) Jifan Chen and Greg Durrett. 2019. Understanding dataset design choices for multi-hop reasoning. In Proceedings of the 2019 Conference of the North American Chapter of the Association for Computational Linguistics: Human Language Technologies, Volume 1 (Long and Short Papers), pages 4026–4032, Minneapolis, Minnesota. Association for Computational Linguistics.
- Chen and Meurers (2016) Xiaobin Chen and Detmar Meurers. 2016. Characterizing text difficulty with word frequencies. In Proceedings of the 11th Workshop on Innovative Use of NLP for Building Educational Applications, pages 84–94, San Diego, CA. Association for Computational Linguistics.
- Devlin et al. (2019) Jacob Devlin, Ming-Wei Chang, Kenton Lee, and Kristina Toutanova. 2019. BERT: Pre-training of deep bidirectional transformers for language understanding. In Proceedings of the 2019 Conference of the North American Chapter of the Association for Computational Linguistics: Human Language Technologies, Volume 1 (Long and Short Papers), pages 4171–4186, Minneapolis, Minnesota. Association for Computational Linguistics.
- Dua et al. (2019) Dheeru Dua, Yizhong Wang, Pradeep Dasigi, Gabriel Stanovsky, Sameer Singh, and Matt Gardner. 2019. DROP: A reading comprehension benchmark requiring discrete reasoning over paragraphs. In Proceedings of the 2019 Conference of the North American Chapter of the Association for Computational Linguistics: Human Language Technologies, Volume 1 (Long and Short Papers), pages 2368–2378, Minneapolis, Minnesota. Association for Computational Linguistics.
- Fisch et al. (2019) Adam Fisch, Alon Talmor, Robin Jia, Minjoon Seo, Eunsol Choi, and Danqi Chen. 2019. MRQA 2019 shared task: Evaluating generalization in reading comprehension. In Proceedings of the 2nd Workshop on Machine Reading for Question Answering, pages 1–13, Hong Kong, China. Association for Computational Linguistics.
- Gardner et al. (2020) Matt Gardner, Yoav Artzi, Victoria Basmov, Jonathan Berant, Ben Bogin, Sihao Chen, Pradeep Dasigi, Dheeru Dua, Yanai Elazar, Ananth Gottumukkala, Nitish Gupta, Hannaneh Hajishirzi, Gabriel Ilharco, Daniel Khashabi, Kevin Lin, Jiangming Liu, Nelson F. Liu, Phoebe Mulcaire, Qiang Ning, Sameer Singh, Noah A. Smith, Sanjay Subramanian, Reut Tsarfaty, Eric Wallace, Ally Zhang, and Ben Zhou. 2020. Evaluating models’ local decision boundaries via contrast sets. In Findings of the Association for Computational Linguistics: EMNLP 2020, pages 1307–1323, Online. Association for Computational Linguistics.
- Gibson (1998) Edward Gibson. 1998. Linguistic complexity: Locality of syntactic dependencies. Cognition, 68(1):1–76.
- He et al. (2021) Pengcheng He, Xiaodong Liu, Jianfeng Gao, and Weizhu Chen. 2021. DeBERTa: Decoding-enhanced BERT with disentangled attention. In International Conference on Learning Representations.
- Huang et al. (2019) Lifu Huang, Ronan Le Bras, Chandra Bhagavatula, and Yejin Choi. 2019. Cosmos QA: Machine reading comprehension with contextual commonsense reasoning. In Proceedings of the 2019 Conference on Empirical Methods in Natural Language Processing and the 9th International Joint Conference on Natural Language Processing (EMNLP-IJCNLP), pages 2391–2401, Hong Kong, China. Association for Computational Linguistics.
- Ide and Suderman (2006) Nancy Ide and Keith Suderman. 2006. Integrating linguistic resources: The American national corpus model. In Proceedings of the Fifth International Conference on Language Resources and Evaluation (LREC’06), Genoa, Italy. European Language Resources Association (ELRA).
- Kaushik et al. (2021) Divyansh Kaushik, Douwe Kiela, Zachary C. Lipton, and Wen-tau Yih. 2021. On the efficacy of adversarial data collection for question answering: Results from a large-scale randomized study. In Proceedings of the 59th Annual Meeting of the Association for Computational Linguistics and the 11th International Joint Conference on Natural Language Processing (Volume 1: Long Papers), pages 6618–6633, Online. Association for Computational Linguistics.
- Kaushik and Lipton (2018) Divyansh Kaushik and Zachary C. Lipton. 2018. How much reading does reading comprehension require? a critical investigation of popular benchmarks. In Proceedings of the 2018 Conference on Empirical Methods in Natural Language Processing, pages 5010–5015, Brussels, Belgium. Association for Computational Linguistics.
- Khashabi et al. (2018) Daniel Khashabi, Snigdha Chaturvedi, Michael Roth, Shyam Upadhyay, and Dan Roth. 2018. Looking beyond the surface: A challenge set for reading comprehension over multiple sentences. In Proceedings of the 2018 Conference of the North American Chapter of the Association for Computational Linguistics: Human Language Technologies, Volume 1 (Long Papers), pages 252–262, New Orleans, Louisiana. Association for Computational Linguistics.
- Khashabi et al. (2020) Daniel Khashabi, Sewon Min, Tushar Khot, Ashish Sabharwal, Oyvind Tafjord, Peter Clark, and Hannaneh Hajishirzi. 2020. UNIFIEDQA: Crossing format boundaries with a single QA system. In Findings of the Association for Computational Linguistics: EMNLP 2020, pages 1896–1907, Online. Association for Computational Linguistics.
- Kiela et al. (2021) Douwe Kiela, Max Bartolo, Yixin Nie, Divyansh Kaushik, Atticus Geiger, Zhengxuan Wu, Bertie Vidgen, Grusha Prasad, Amanpreet Singh, Pratik Ringshia, Zhiyi Ma, Tristan Thrush, Sebastian Riedel, Zeerak Waseem, Pontus Stenetorp, Robin Jia, Mohit Bansal, Christopher Potts, and Adina Williams. 2021. Dynabench: Rethinking benchmarking in NLP. In Proceedings of the 2021 Conference of the North American Chapter of the Association for Computational Linguistics: Human Language Technologies, pages 4110–4124, Online. Association for Computational Linguistics.
- Kincaid et al. (1975) J Peter Kincaid, Robert P Fishburne Jr, Richard L Rogers, and Brad S Chissom. 1975. Derivation of new readability formulas (automated readability index, fog count and flesch reading ease formula) for navy enlisted personnel. Research Branch Report 8-75. Chief of Naval Technical Training.
- Kočiský et al. (2018) Tomáš Kočiský, Jonathan Schwarz, Phil Blunsom, Chris Dyer, Karl Moritz Hermann, Gábor Melis, and Edward Grefenstette. 2018. The NarrativeQA reading comprehension challenge. Transactions of the Association for Computational Linguistics, 6:317–328.
- Kummerfeld (2021) Jonathan K. Kummerfeld. 2021. Quantifying and avoiding unfair qualification labour in crowdsourcing. In Proceedings of the 59th Annual Meeting of the Association for Computational Linguistics and the 11th International Joint Conference on Natural Language Processing (Volume 2: Short Papers), pages 343–349, Online. Association for Computational Linguistics.
- Lai et al. (2017) Guokun Lai, Qizhe Xie, Hanxiao Liu, Yiming Yang, and Eduard Hovy. 2017. RACE: Large-scale ReAding comprehension dataset from examinations. In Proceedings of the 2017 Conference on Empirical Methods in Natural Language Processing, pages 785–794, Copenhagen, Denmark. Association for Computational Linguistics.
- Lapata (2006) Mirella Lapata. 2006. Automatic evaluation of information ordering: Kendall’s tau. Computational Linguistics, 32(4):471–484.
- Li et al. (2020) Tao Li, Daniel Khashabi, Tushar Khot, Ashish Sabharwal, and Vivek Srikumar. 2020. UNQOVERing stereotyping biases via underspecified questions. In Findings of the Association for Computational Linguistics: EMNLP 2020, pages 3475–3489, Online. Association for Computational Linguistics.
- Liu et al. (2019) Yinhan Liu, Myle Ott, Naman Goyal, Jingfei Du, Mandar Joshi, Danqi Chen, Omer Levy, Mike Lewis, Luke Zettlemoyer, and Veselin Stoyanov. 2019. RoBERTa: A robustly optimized BERT pretraining approach. arXiv preprint 1907.11692.
- Min et al. (2019) Sewon Min, Eric Wallace, Sameer Singh, Matt Gardner, Hannaneh Hajishirzi, and Luke Zettlemoyer. 2019. Compositional questions do not necessitate multi-hop reasoning. In Proceedings of the 57th Annual Meeting of the Association for Computational Linguistics, pages 4249–4257, Florence, Italy. Association for Computational Linguistics.
- Nangia et al. (2021) Nikita Nangia, Saku Sugawara, Harsh Trivedi, Alex Warstadt, Clara Vania, and Samuel R. Bowman. 2021. What ingredients make for an effective crowdsourcing protocol for difficult NLU data collection tasks? In Proceedings of the 59th Annual Meeting of the Association for Computational Linguistics and the 11th International Joint Conference on Natural Language Processing (Volume 1: Long Papers), pages 1221–1235, Online. Association for Computational Linguistics.
- Nie et al. (2020) Yixin Nie, Xiang Zhou, and Mohit Bansal. 2020. What can we learn from collective human opinions on natural language inference data? In Proceedings of the 2020 Conference on Empirical Methods in Natural Language Processing (EMNLP), pages 9131–9143, Online. Association for Computational Linguistics.
- Ning et al. (2020) Qiang Ning, Hao Wu, Rujun Han, Nanyun Peng, Matt Gardner, and Dan Roth. 2020. TORQUE: A reading comprehension dataset of temporal ordering questions. In Proceedings of the 2020 Conference on Empirical Methods in Natural Language Processing (EMNLP), pages 1158–1172, Online. Association for Computational Linguistics.
- Parrish et al. (2022) Alicia Parrish, Angelica Chen, Nikita Nangia, Vishakh Padmakumar, Jason Phang, Jana Thompson, Phu Mon Htut, and Samuel R. Bowman. 2022. BBQ: A hand-built bias benchmark for question answering. In Proceedings of the 60th Annual Meeting of the Association for Computational Linguistics. Association for Computational Linguistics.
- Rajpurkar et al. (2016) Pranav Rajpurkar, Jian Zhang, Konstantin Lopyrev, and Percy Liang. 2016. SQuAD: 100,000+ questions for machine comprehension of text. In Proceedings of the 2016 Conference on Empirical Methods in Natural Language Processing, pages 2383–2392, Austin, Texas. Association for Computational Linguistics.
- Ribeiro et al. (2020) Marco Tulio Ribeiro, Tongshuang Wu, Carlos Guestrin, and Sameer Singh. 2020. Beyond accuracy: Behavioral testing of NLP models with CheckList. In Proceedings of the 58th Annual Meeting of the Association for Computational Linguistics, pages 4902–4912, Online. Association for Computational Linguistics.
- Richardson et al. (2013) Matthew Richardson, Christopher J.C. Burges, and Erin Renshaw. 2013. MCTest: A challenge dataset for the open-domain machine comprehension of text. In Proceedings of the 2013 Conference on Empirical Methods in Natural Language Processing, pages 193–203, Seattle, Washington, USA. Association for Computational Linguistics.
- Roark et al. (2009) Brian Roark, Asaf Bachrach, Carlos Cardenas, and Christophe Pallier. 2009. Deriving lexical and syntactic expectation-based measures for psycholinguistic modeling via incremental top-down parsing. In Proceedings of the 2009 Conference on Empirical Methods in Natural Language Processing, pages 324–333, Singapore. Association for Computational Linguistics.
- Rogers et al. (2020) Anna Rogers, Olga Kovaleva, Matthew Downey, and Anna Rumshisky. 2020. Getting closer to AI complete question answering: A set of prerequisite real tasks. In Proceedings of The Thirty-Fourth AAAI Conference on Artificial Intelligence, pages 8722–8731. AAAI Press.
- Sugawara et al. (2017) Saku Sugawara, Yusuke Kido, Hikaru Yokono, and Akiko Aizawa. 2017. Evaluation metrics for machine reading comprehension: Prerequisite skills and readability. In Proceedings of the 55th Annual Meeting of the Association for Computational Linguistics (Volume 1: Long Papers), pages 806–817, Vancouver, Canada. Association for Computational Linguistics.
- Sun et al. (2021) Yu Sun, Shuohuan Wang, Shikun Feng, Siyu Ding, Chao Pang, Junyuan Shang, Jiaxiang Liu, Xuyi Chen, Yanbin Zhao, Yuxiang Lu, Weixin Liu, Zhihua Wu, Weibao Gong, Jianzhong Liang, Zhizhou Shang, Peng Sun, Wei Liu, Xuan Ouyang, Dianhai Yu, Hao Tian, Hua Wu, and Haifeng Wang. 2021. ERNIE 3.0: Large-scale knowledge enhanced pre-training for language understanding and generation. arXiv preprint 2107.02137.
- Trischler et al. (2017) Adam Trischler, Tong Wang, Xingdi Yuan, Justin Harris, Alessandro Sordoni, Philip Bachman, and Kaheer Suleman. 2017. NewsQA: A machine comprehension dataset. In Proceedings of the 2nd Workshop on Representation Learning for NLP, pages 191–200, Vancouver, Canada. Association for Computational Linguistics.
- Williams et al. (2018) Adina Williams, Nikita Nangia, and Samuel Bowman. 2018. A broad-coverage challenge corpus for sentence understanding through inference. In Proceedings of the 2018 Conference of the North American Chapter of the Association for Computational Linguistics: Human Language Technologies, Volume 1 (Long Papers), pages 1112–1122, New Orleans, Louisiana. Association for Computational Linguistics.
- Williams et al. (2020) Adina Williams, Tristan Thrush, and Douwe Kiela. 2020. ANLIzing the adversarial natural language inference dataset. arXiv preprint 2010.12729.
- Yang et al. (2018) Zhilin Yang, Peng Qi, Saizheng Zhang, Yoshua Bengio, William Cohen, Ruslan Salakhutdinov, and Christopher D. Manning. 2018. HotpotQA: A dataset for diverse, explainable multi-hop question answering. In Proceedings of the 2018 Conference on Empirical Methods in Natural Language Processing, pages 2369–2380, Brussels, Belgium. Association for Computational Linguistics.
- Yu et al. (2020) Weihao Yu, Zihang Jiang, Yanfei Dong, and Jiashi Feng. 2020. ReClor: A reading comprehension dataset requiring logical reasoning. In International Conference on Learning Representations.
Appendix A Passage Sources
From Project Gutenberg, we use books from the adventure, fiction, humor, novel, and story genres.333https://www.gutenberg.org/
From Wikipedia articles, we use articles listed as Level 3 vital articles.444https://en.wikipedia.org/wiki/Wikipedia:Vital_articles For science, we include health, medicine and disease, science, technology, and mathematics categories. For the arts, we include history, arts, philosophy and religion, and society and social sciences categories.
Appendix B Dataset Statistics
Table 4.1 presents the frequencies of valid and high-agreement examples across the passage sources and collection methods.
Appendix C Worker Statistics
Of the 1,050 workers who joined the question-answering phase of the qualification round, 259 workers (24.7%) passed it. From them, 157 workers submitted the question writing task, and 72 workers (36 each for the standard and adversarial collection) qualified for the main writing task, from which 49 workers joined. The workers were allowed to write up to 250 questions. A total of 167 workers participated in the validation task. No worker answered more than 730 questions. Data collection took approximately a month including the qualification round and the validation task.
Appendix D Supervised Model Performance
Table 4.1 shows the supervised performance of the DeBERTa large model.
Appendix E Partial-Input Model Performance
| Method | P+A | Q+A | A only |
|---|---|---|---|
| Dir. | 71.6 | 46.0 | 38.6 |
| Adv. | 51.9 | 41.5 | 32.7 |
Tables 4.1 and 5 report the zero-shot performance of DeBERTa xlarge and the supervised performance of DeBERTa large (MNLI).
Appendix F Easy and Hard Subsets
| Source | Method | Easy | Hard |
|---|---|---|---|
| MCTest | Dir. | 8.1 | 6.4 |
| Adv. | 6.5 | 13.2 | |
| Total | 14.7 | 19.6 | |
| Gutenberg | Dir. | 8.1 | 4.6 |
| Adv. | 6.2 | 7.3 | |
| Total | 14.3 | 11.9 | |
| Slate | Dir. | 8.4 | 2.9 |
| Adv. | 5.8 | 7.7 | |
| Total | 14.2 | 10.6 | |
| RACE | Dir. | 8.7 | 5.7 |
| Adv. | 6.2 | 12.1 | |
| Total | 14.9 | 17.7 | |
| ReClor | Dir. | 8.6 | 5.5 |
| Adv. | 5.5 | 8.0 | |
| Total | 14.2 | 13.5 | |
| Wiki. Sci. | Dir. | 8.7 | 4.4 |
| Adv. | 5.1 | 10.2 | |
| Total | 13.8 | 14.6 | |
| Wiki. Arts | Dir. | 8.3 | 3.1 |
| Adv. | 5.7 | 9.0 | |
| Total | 14.0 | 12.1 | |
| # Questions | 1,970 | 547 |
Table 6 presents the frequency of easy and hard examples across passage sources and collection methods.
Appendix G Passage Length
Figure 6 shows the relationship between the passage length and the human–model performance gap.
Appendix H Question and Option Length
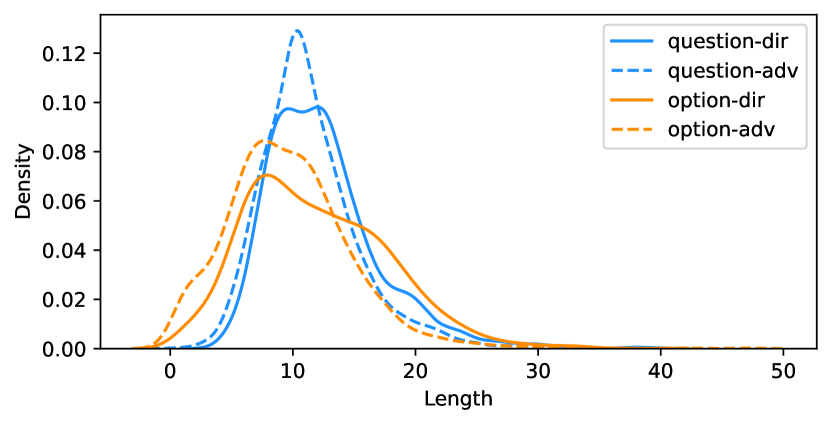
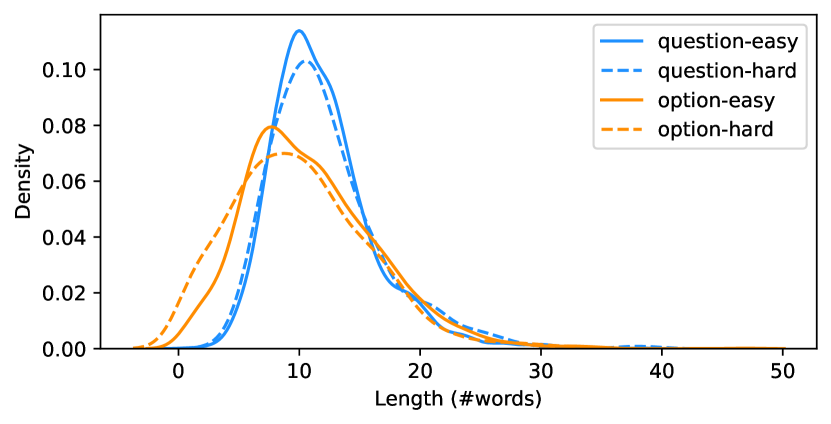
We plot the average question and option length (the number of words except for punctuation) in the high-agreement examples in Figure 7 across the collection methods and in Figure 8 across the easy and hard subsets. The distributions of question and option length have slightly higher variances in the standard data collection than in the adversarial data collection. This result is consistent with the observation in Nangia et al. (2021).
Appendix I Readability Level
Figure 9 shows the plot between Flesch–Kincaid grade level Kincaid et al. (1975) and the human–model performance gap. We compute the grade level () of a passage using the following formula:
| (1) |
where is the average length of the sentences and is the average number of syllables of the words in the passage. To estimate the number of syllables in a word, we use the implementation of the sonority sequencing principle Bartlett et al. (2009) in NLTK Bird et al. (2009).555https://www.nltk.org/_modules/nltk/tokenize/sonority_sequencing.html
Appendix J Syntactic and Lexical Surprisal
Figures 10 and 11 show syntactic and lexical surprisal measures, respectively, for all examples. Following Roark et al. (2009), we compute a surprisal value for each word, then take the average for each sentence, and finally take the average over the whole passage. We use an incremental parser with a lexicalized probabilistic context-free grammar.666https://github.com/roarkbr/incremental-top-down-parser
Appendix K Elapsed Time for Answering Questions
Figure 12 shows the plot of time elapsed by humans while answering questions in the validation task. We measure the elapsed time from when a worker opens a task to when they submit their answer. In addition, we measure the elapsed time for writing questions as a reference (Figure 13). We observe that workers take slightly longer to write hard examples than easy examples.
Appendix L Average Word Frequencies
Figure 14 plots the average word frequencies of all examples. We refer to SUBTLEXus Brysbaert and New (2009) for the word frequencies per one million words in a corpus of American English subtitles.
Appendix M Question and Comprehension Types
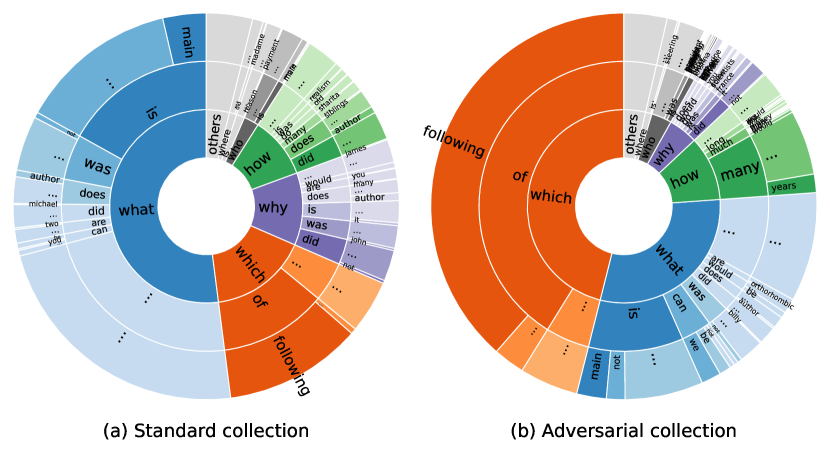
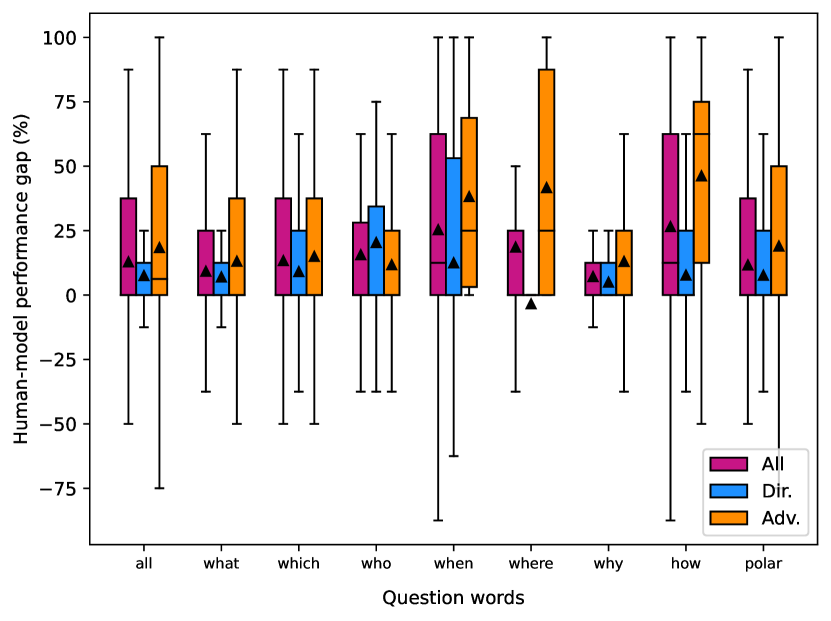
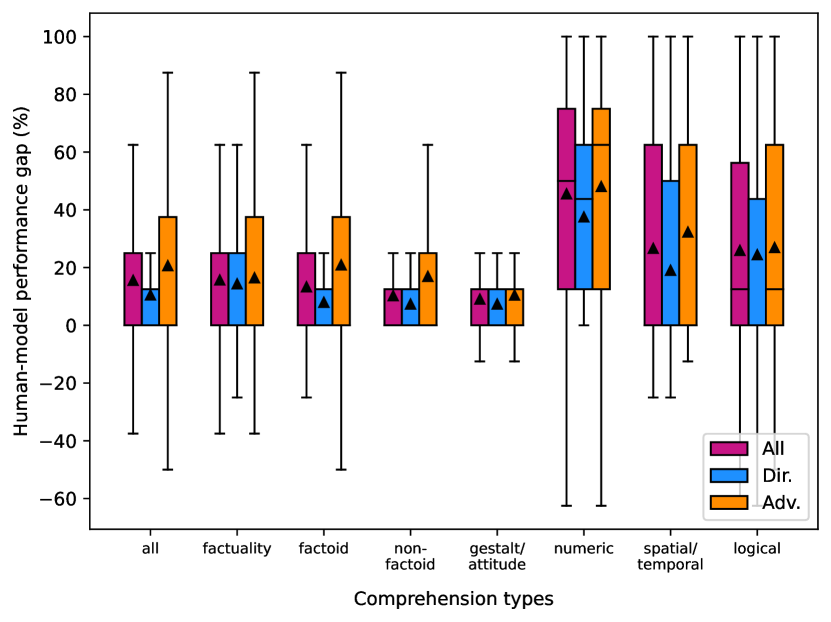
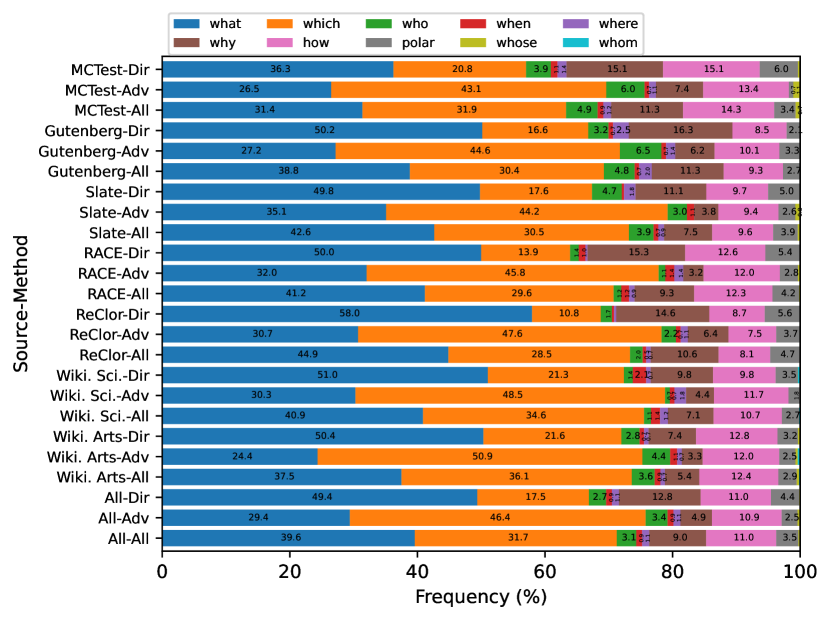
Figure 15 shows the frequency of the question words and the two subsequent words for each collection method. Figures 16 and 17 show the box plots between human–model performance gap and questions words or comprehension types, respectively. Figures 18 and 5 show the frequency of question words and comprehension types, respectively, across the passage sources and collection methods. In the comprehension types annotation, a question can have multiple labels. Therefore, the sum of the frequencies may exceed 100%.
The definitions of the comprehension types are as follows:
-
1.
Factuality (true/false/likely) is reasoning of which answer option most (or least) describes facts or events in a given passage.
-
2.
Factoid simply asks about described events or entities, typically with typical what questions.
-
3.
Non-factoid is related to why and how questions, such as ones asking about causality, a character’s attitude, or the process of described events.
-
4.
Gestalt/Attitude asks about the summary, theme, or conclusion of the content of a given passage or the author’s attitude towards it.
-
5.
Numeric indicates questions that require arithmetic reasoning.
-
6.
Spatial/Temporal is related to the understanding of places and locations (spatial) or the temporal order or duration (temporal) of described events.
-
7.
Logical is pertinent to logical reasoning and arguments described in a passage.
Appendix N Human Accuracy as Question Difficulty
| Aspects | ||
|---|---|---|
| Passage length | 0.009 | 0.59 |
| Flesch–Kincaid grade | -0.06 | 0.001 |
| Elapsed time for answering | -0.16 | 0.001 |
| Elapsed time for writing | -0.04 | 0.007 |
| Syntactic surprisal | -0.01 | 0.53 |
| Semantic surprisal | -0.001 | 0.93 |
| Average word frequency | 0.004 | 0.82 |
We compute a similar linguistic analysis using the average human accuracy as the difficulty of the questions. Table 7 shows Pearson’s correlation and its -value between the human accuracy (as the question difficulty) and textual aspects. Just as when using the human–model gap, we do not observe any strong correlations except for the elapsed time for answering that shows a weak negative correlation, which means difficult-for-human questions take slightly longer for answering. Figure 19 shows the frequency of comprehension types in easy and hard examples with regard to the question difficulty for humans.
Appendix O Examples of Collected Questions
|
Comprehension Type
(source, difficulty) |
Example |
|---|---|
|
Factuality
(Gutenberg, easy) |
Q: Which of the following is not mentioned in the passage?
A: An Earl lived in a house that had a relatively low profile. / There were some other buildings near the Manor. / Scroope is a village that is closely linked to an Earl’s home. / Scroope Manor was sold to the village by the Earl. |
|
Factoid
(Wiki. science, easy) |
Q: What helps many fish keep their buoyancy in water?
A: muscles on either side of the backbone / fins / a swim bladder / a streamlined body |
|
Non-factoid
(Wiki. arts, hard) |
Q: How did a major portion of English words enter the English language?
A: French speakers can understand many English words without having to undergo any orthographical change. / Many words in Old English are from Old Norse. / About one-third of words in English entered the language from the long contact between French and English. / Romance languages have "Latinate" roots. |
|
Gestalt/Attitude
(Slate, easy) |
Q: Which of the following is a criticism the author has about Dick Riordan?
A: He’s not transparent about his typical lunch looks like, which highlights his lack of wisdom. / He’s okay syphoning resources from elsewhere to himself for personal gain. / Much like Hillary Clinton, he lacks any sort of coherent persona. / He is responsible for the vast swaths of one-story buildings that cover the entire landscape of L.A. |
|
Numeric
(RACE, hard) |
Q: How old was Mary Shelley when she died?
A: Mary Shelley was in her thirties when she died. / Mary Shelley died when she was forty four years old. / Mary Shelley died when she was in her fifties. / Mary Shelley lived well into her eighties before she died. |
|
Spatial/Temporal
(MCTest, easy) |
Q: When did it start to rain?
A: It started to rain after Will ate his biscuit and jam. / It started to rain after Will heard the thunder. / It started to rain while Will was at the store. / It started to rain on Will’s walk home from the store. |
|
Logical
(ReClor, hard) |
Q: Which statement, if true, would weaken the conclusion of the passage?
A: Archaeologists have found remains of shipwrecks from 2000 BC between Crete and southern Greece. / The earliest bronze artifacts found in southern Greece date to 3000 BC. / The Minoans were far more accomplished in producing bronzeware than any other civilization in the area at the time. / The capacity of Minoan bronze furnaces was extraordinarily large compared to other societies in 2000 BC. |
Table 8 shows examples of questions and options for each comprehension type. After extracting the question words, we review about 100 questions to collect keywords that determine comprehension type (e.g., “reason” for non-factoid,“best summarize” for gestalt/attitude and “if” for logical). We then write simple rules that highlight these keywords, which help us manually annotate the remaining questions within approximately five hours.
Appendix P Writing Instructions and Examples