On the role of mechanosensitive binding dynamics in the pattern formation of active surfaces
Abstract
The actin cortex of an animal cell is a thin polymeric layer attached to the inner side of the plasma membrane. It plays a key role in shape regulation and pattern formation on the cellular and tissue scale and, in particular, generates the contractile ring during cell division. Experimental studies showed that the cortex is fluid-like but highly viscous on long time scales with a mechanics that is sensitively regulated by active and passive cross-linker molecules that tune active stress and shear viscosity. Here, we use an established minimal model of active surface dynamics of the cell cortex supplemented with the experimentally motivated feature of mechanosensitivity in cross-linker binding dynamics. Performing linear stability analysis and computer simulations, we show that cross-linker mechanosensitivity significantly enhances the versatility of pattern formation and enables self-organized formation of stable contractile rings.
I Introduction
The actin cortex is a thin active polymeric layer that is formed right underneath the plasma membrane of animal cells Salbreux et al. (2012); Chugh and Paluch (2018); Koenderink and Paluch (2018).
It is tethered to the plasma membrane and serves as a mechanical shield as well as an active regulator of cell and tissue shape Salbreux et al. (2012); Chugh and Paluch (2018); Koenderink and Paluch (2018). In particular, the actin cortex was shown to play an important role in cell division, cell migration and embryogenesis (e.g. during epithelial folding) Salbreux et al. (2012); Chugh and Paluch (2018); Koenderink and Paluch (2018). Therefore, force generation and pattern formation in the actin cortex are an important prerequisite for the successful accomplishment of cellular function in our body. Previous theoretical and experimental studies suggest that corresponding biological pattern formation and shape dynamics of cortical surfaces could, at least in part, be driven through self-organized dynamic processes of cortical constituents, see e.g. Mietke et al. (2019a, b); Bois et al. (2011); Kumar et al. (2014); Salbreux and Jülicher (2017); Wagner and Glotzer (2016); Salbreux et al. (2009); Berthoumieux et al. (2014); Gross et al. (2019); Reymann et al. (2016).
The actin cortex is scaffolded by a network of actin polymers decorated by a multitude of associated proteins Salbreux et al. (2012); Chugh and Paluch (2018). In particular, active motor proteins, such as myosin II, cross-link actin polymers and exert tensile forces on them Salbreux et al. (2012); Chugh and Paluch (2018). In this way, motor proteins act as active force dipoles generating active contractile prestress in the cortical layer.
Also (passive) actin cross-linker proteins such as -actinin were shown to contribute to the generation of active cortical prestress Ennomani et al. (2016); Fischer-Friedrich et al. (2016); Alvarado et al. (2013); Koenderink and Paluch (2018); Toyoda et al. (2017).
Furthermore, the degree of cross-linking of actin networks was shown to sensitively tune the network’s mechanical resistance towards shear deformations Gardel et al. (2004, 2006).
In recent years, several experimental studies have provided direct or indirect evidence that actin cross-linkers exhibit mechanosensitive binding dynamics Yao et al. (2013); Schiffhauer et al. (2016); Luo et al. (2013); Hosseini et al. (2020); Mulla et al. (2020); Guo and Guilford (2006). In particular, two scenarios have been suggested for cross-linker binding to actin Hosseini et al. (2020); Mulla et al. (2020); i) tension-induced increase of bond lifetimes - also called catch bond behavior and ii) tension-induced decrease of bond lifetimes - also called slip bond behavior. Therefore, in a cortex model that captures mechanosensitivity of stress-regulating cortical molecules, the unbinding rate of such molecules needs to depend on the local mechanical stress in the cortical surface. This relationship introduces an additional mechanochemical feedback into the system.
Cortical constituents were observed to undergo dynamic turnover on time scales of seconds to tens of seconds Salbreux et al. (2012); Chugh and Paluch (2018); Koenderink and Paluch (2018). In accordance, with that observation, cortical mechanics was shown to be time scale dependent and to be dominantly fluid-like on time scales larger than minutes Fischer-Friedrich et al. (2016); Kelkar et al. (2020). Accordingly, self-organization and pattern formation in the actin cortex has been modeled as the dynamics of an active viscous fluid, see e.g. Mietke et al. (2019a, b); Berthoumieux et al. (2014); Salbreux et al. (2009); Salbreux and Jülicher (2017); Kumar et al. (2014); Bois et al. (2011). Experimental results suggest that the two-dimensional viscosity of the cortical fluid layer is on the order of mPa s on long time scales (estimated as the product of parameters and from references Fischer-Friedrich et al. (2016); Hosseini et al. (2021)). By comparison, viscosities of the cytoplasm have been estimated in the range of Pa s Kalwarczyk et al. (2011); Daniels et al. (2006). The ratio between cortical and cytoplasmic viscosity is therefore expected to be on the order of m or larger. Hence, the hydrodynamic length scale of the coupling between the cytoplasmic bulk and the cortex is expected to be orders of magnitudes larger than typical diameters of animal cells.
In previous research, Mietke et al. suggested a minimal model of active spherical cortex surfaces Mietke et al. (2019b). There, the authors reported the ability of the active model cortex to spontaneously polarize and form patterns. However, spontaneous formation of contractile ring conformations were only reported for the case of small hydrodynamic length scale , where is the surface bulk viscosity of the active surface and is the viscosity of the enclosed passive bulk fluid. Here, we reconsider pattern formation of this minimal model of active spherical fluid surfaces for the case of large hydrodynamic length scale taking mechanosensitive binding of cortical molecules into consideration as a new feature.
II Constitutive equations for an active gel on a curved surface with mechanosensitive molecular regulators
In the following, we will write down the hydrodynamic equations that govern surface deformation and material flow for a closed active fluid surface in a regime of overdamped dynamics as previously introduced in Mietke et al. (2019b). The two-dimensional domain of the active surface is denoted as . Let be local coordinates of the manifold . Correspondingly, can be locally parameterized as surface position vectors . An induced basis of the tangent space is given by the vectors . The surface normal is . The tangential velocity of a surface element in can then be written as . The normal surface velocity will be denoted as . The curvature and metric tensor are defined as and , respectively. The strain rate tensor of the active surface is and the in-plane stress tensor reads
| (1) |
where and are the area shear viscosity and area bulk viscosity of the active fluid and is an active stress contribution that is tuned by the contractility parameter and a function that grows monotonically as a function of the local concentration of molecular regulators.
We have assumed that surface bending makes negligible in-plane stress contributions using the established membrane approximation of thin closed shells Landau and Lifshitz (1986).
Furthermore, we did not take into consideration contributions of curvature to active in-plane surface stress. This choice was motivated by experimental findings showing that cell surface tension is largely independent of the degree of cell squishing in a cell confinement assay in spite of increasing curvature of the unsupported cell surface Fischer-Friedrich et al. (2014).
The force balance equations in tangential and normal direction are given by
| (2) |
External forces in the above Eq. (2) are assumed to stem from stresses in the inner bulk fluid occupying the space enclosed by the active surface . Therefore, , where is the stress tensor, is the viscosity and is the velocity field in the bulk fluid. The Stokes Equation demands
| (3) |
Furthermore, we impose bulk fluid incompressibility, i.e. and no slip boundary conditions at the interface with the active surface, i.e. .
The surface concentration field of the molecular regulator species is anticipated to undergo a dynamic evolution due to binding and unbinding events that give rise to an exchange with a pool of free molecules in the inner (cytoplasmic) bulk volume . We anticipate that this inner molecular pool is well-stirred due to fast bulk diffusion. By imposing particle conservation, the concentration in the inner bulk is therefore given by , where is the overall number of molecules in the system. The time evolution of the concentration field is modeled as
| (4) |
where is the diffusion constant in the active surface, is a binding rate of free molecules and is an unbinding rate of surface-associated molecules. Furthermore, the term accounts for concentration changes due to tangential advective flux on the surface and the term captures concentration changes by dilution/condensation through normal surface movement in the presence of curvature. Motivated by experimental observations, see e.g. Schiffhauer et al. (2016); Hosseini et al. (2020); Mulla et al. (2020); Luo et al. (2013), we anticipate that the unbinding rate of molecular regulators of active stress depends on the local trace of the in-plane stress . In particular, we make the choice of a Bell model dependence
| (5) |
where is the trace of the stress in the steady state () and is a characteristic stress that characterizes the nature of the load dependence of the molecular regulator. A decrease of the unbinding rate with stress, i.e. , is known as catch bond behavior while the increase of in dependence of stress, i.e. , is known as slip bond behavior Thomas et al. (2008); Marshall et al. (2003).
In the case of the presence of more than one molecular regulator species, the above description of active hydrodynamics can be generalized in a straightforward manner using an active stress contribution , where is a function of a vector of concentration fields with one vector component for each molecular regulator. Furthermore, time evolution equations in the form of Eq. (4) must be defined for the concentration fields of all molecular regulator species.
III Pattern formation of an active spherical surface with mechanosensitive molecular regulators
In the following, we will discuss self-organized pattern formation and surface deformation for the active hydrodynamics as described by Eqn. (2) and (4) emerging from a spatially uniform steady state of a spherical shape with radius . Therefore, initially, the uniform surface concentration is and velocities vanish on the surface and in the bulk.
To identify the stability of this steady state, we perturb the concentration field and the radius of the active surface. As spherical harmonics
are an orthonormal basis of the function space on the sphere, we can write
and
where and denote the polar and azimuthal angle of the sphere, respectively.
Correspondingly, we expand the emerging tangential velocity field in the form
where and are the tangential vector spherical harmonic functions.
Eqn. (2), (3) and (4) are then expanded in the perturbations and to linear order and the growth rates of each harmonic mode are determined as previously described by Mietke et al. Mietke et al. (2019b) (see Supplementary Section 1). In the linear regime, mode amplitudes and change in time proportional to , i.e. if , the perturbation mode grows and if the perturbation mode shrinks over time. (Note that the growth rate is independent of mode parameter Mietke et al. (2019b).) For the limit case of vanishing bulk viscosity (i.e. diverging hydrodynamic length scale ), an analytical expression for the growth rate is given in Supplementary Section 2.
Furthermore, in this limit case, we find that the induced change of the trace of the stress tensor is to first order
| (6) | |||||
for harmonic perturbations with mode degree . Here, is the corresponding growth rate. Accordingly, the trace of the stress tensor does not change through the dynamics for modes with (up to linear order). This behavior results from the lack of area shear contributions for perturbations for vanishing bulk viscosity (see Supplementary Section 3). We conclude that the unbinding rate stays constant for these modes (in space and time) and the associated mechanosensitivity of the molecular regulator does not affect the binding dynamics (up to linear order). Correspondingly, the stress-amplified binding as mediated by a catch-bond mechanosensitivity of a molecular regulator can be used to specifically amplify modes with .
III.1 One mechanosensitive regulator species
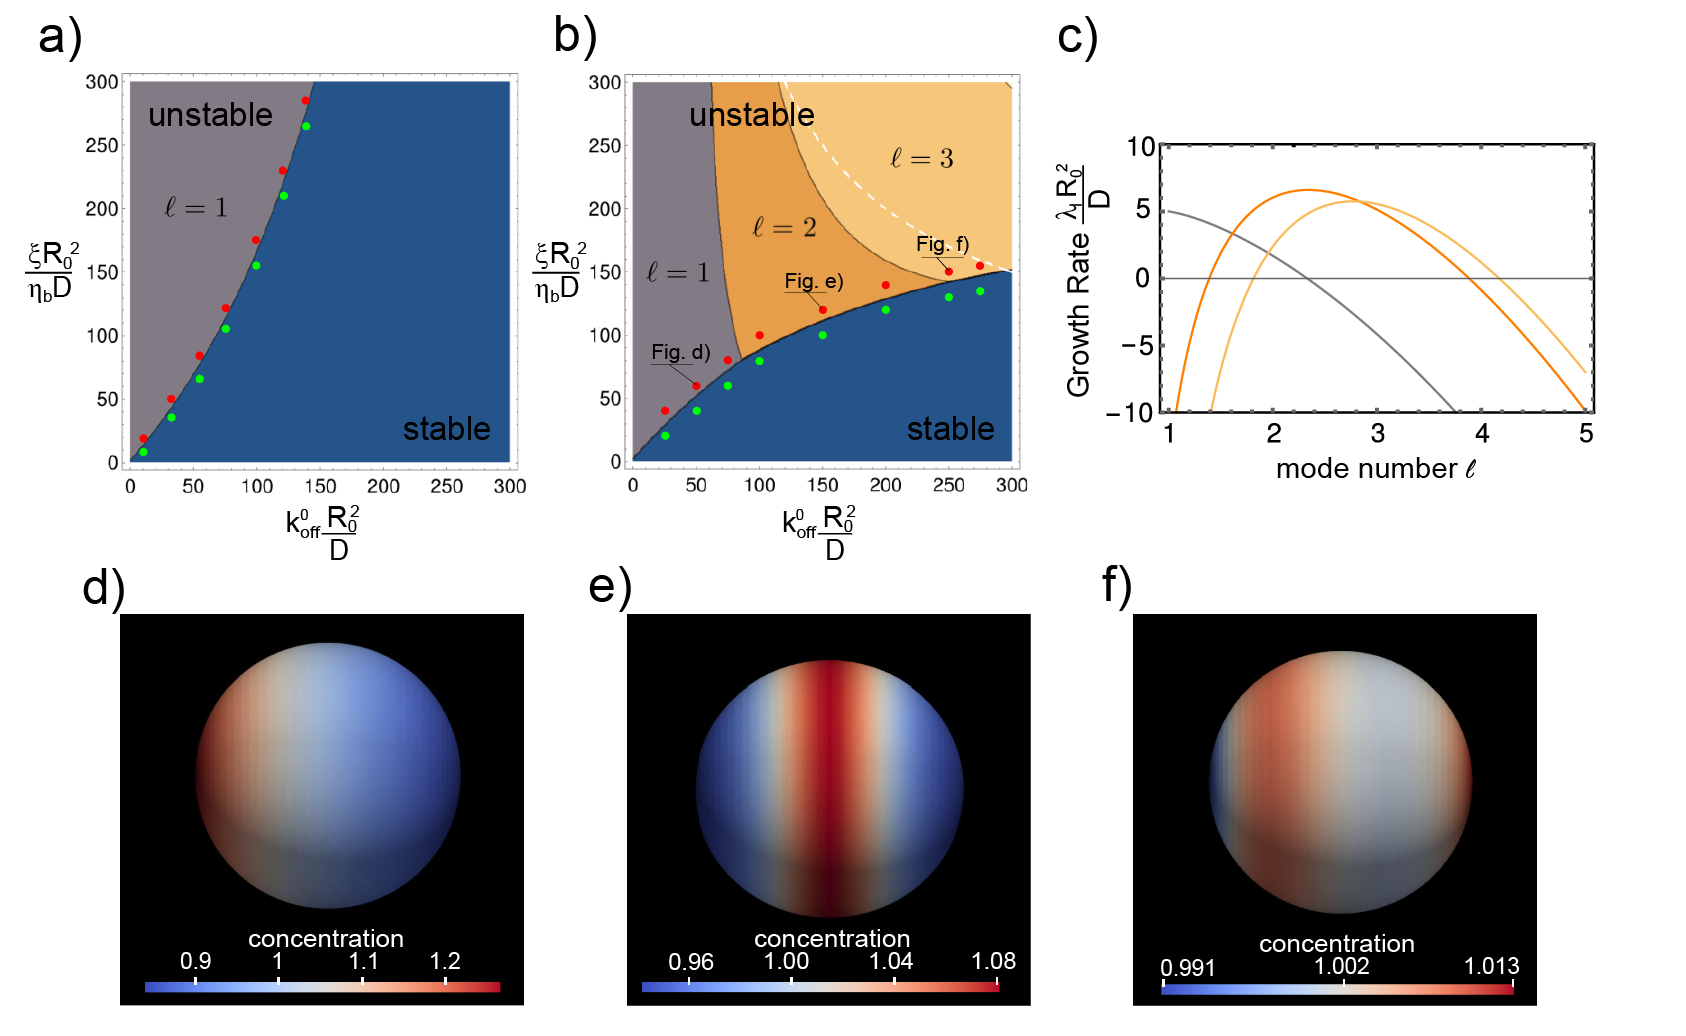
Using linear stability analysis, we first considered the stability of harmonic modes with for one molecular regulator species in the limit of large hydrodynamic length scale with the specific choice . For both, catch and slip bond mechanosensitivity, we find that the steady state becomes unstable if the contractility parameter is sufficiently large (see Fig. 1a,b). For slip bond mechanosensitivity (), the mode with is predicted to be always dominant, i.e. its growth rate is always the largest (see Fig. 1a). This behavior is analogous to the situation of no mechanosensitivity Mietke et al. (2019b). For catch bond mechanosensitivity (), we find that the versatility of predicted patterns is greatly enriched in that parameter regimes with different dominant modes exist. In particular, parameters can be chosen such that arbitrary -modes can become dominant (see Fig. 1b,c). A mode is denoted as dominant if the real part of the growth rate is maximal at its corresponding degree .
To examine the behaviour of the system away from the linear stability region, we solved the Eqn. (2),(3) and (4) numerically in an axisymmetric scheme using a finite-element framework and the Arbitrary-Lagrangian-Eulerian (ALE) method (see Supplementary Section 5) Wittwer and Aland (2022); Vey and Voigt (2007); Witkowski et al. (2015). We find that numerical simulations agree with predictions of the linear stability analysis with regards to stability of the uniform state (see green and red dots in Fig. 1a,b). Furthermore, numerical simulations reproduce the amplification of different harmonic modes from random initial perturbations of the steady state as predicted by the linear stability analysis for catch bond molecular regulators (see Fig. 1b,d,e,f).
III.2 Two molecular regulator species with opposite mechanosensitivity
Some actin cross-linkers such as -actinin-4 and myosin have been shown to exhibit a catch-bond behavior Schiffhauer et al. (2016); Hosseini et al. (2020); Veigel et al. (2003). For other actin cross-linkers such as fascin, previous data indicate a slip bond behavior Lieleg et al. (2008). Therefore, it is a plausible scenario that molecular regulators of cortical activity may exhibit both kinds of mechanosensitivity.
In fact, admitting for at least two molecular regulator species with equal but opposite mechanosensitivity, the richness of pattern forming behaviors can be further extended; in particular, it is possible to find parameter regimes, where growth rates exhibit a positive real-valued part and a non-vanishing imaginary part indicating oscillatory behavior.
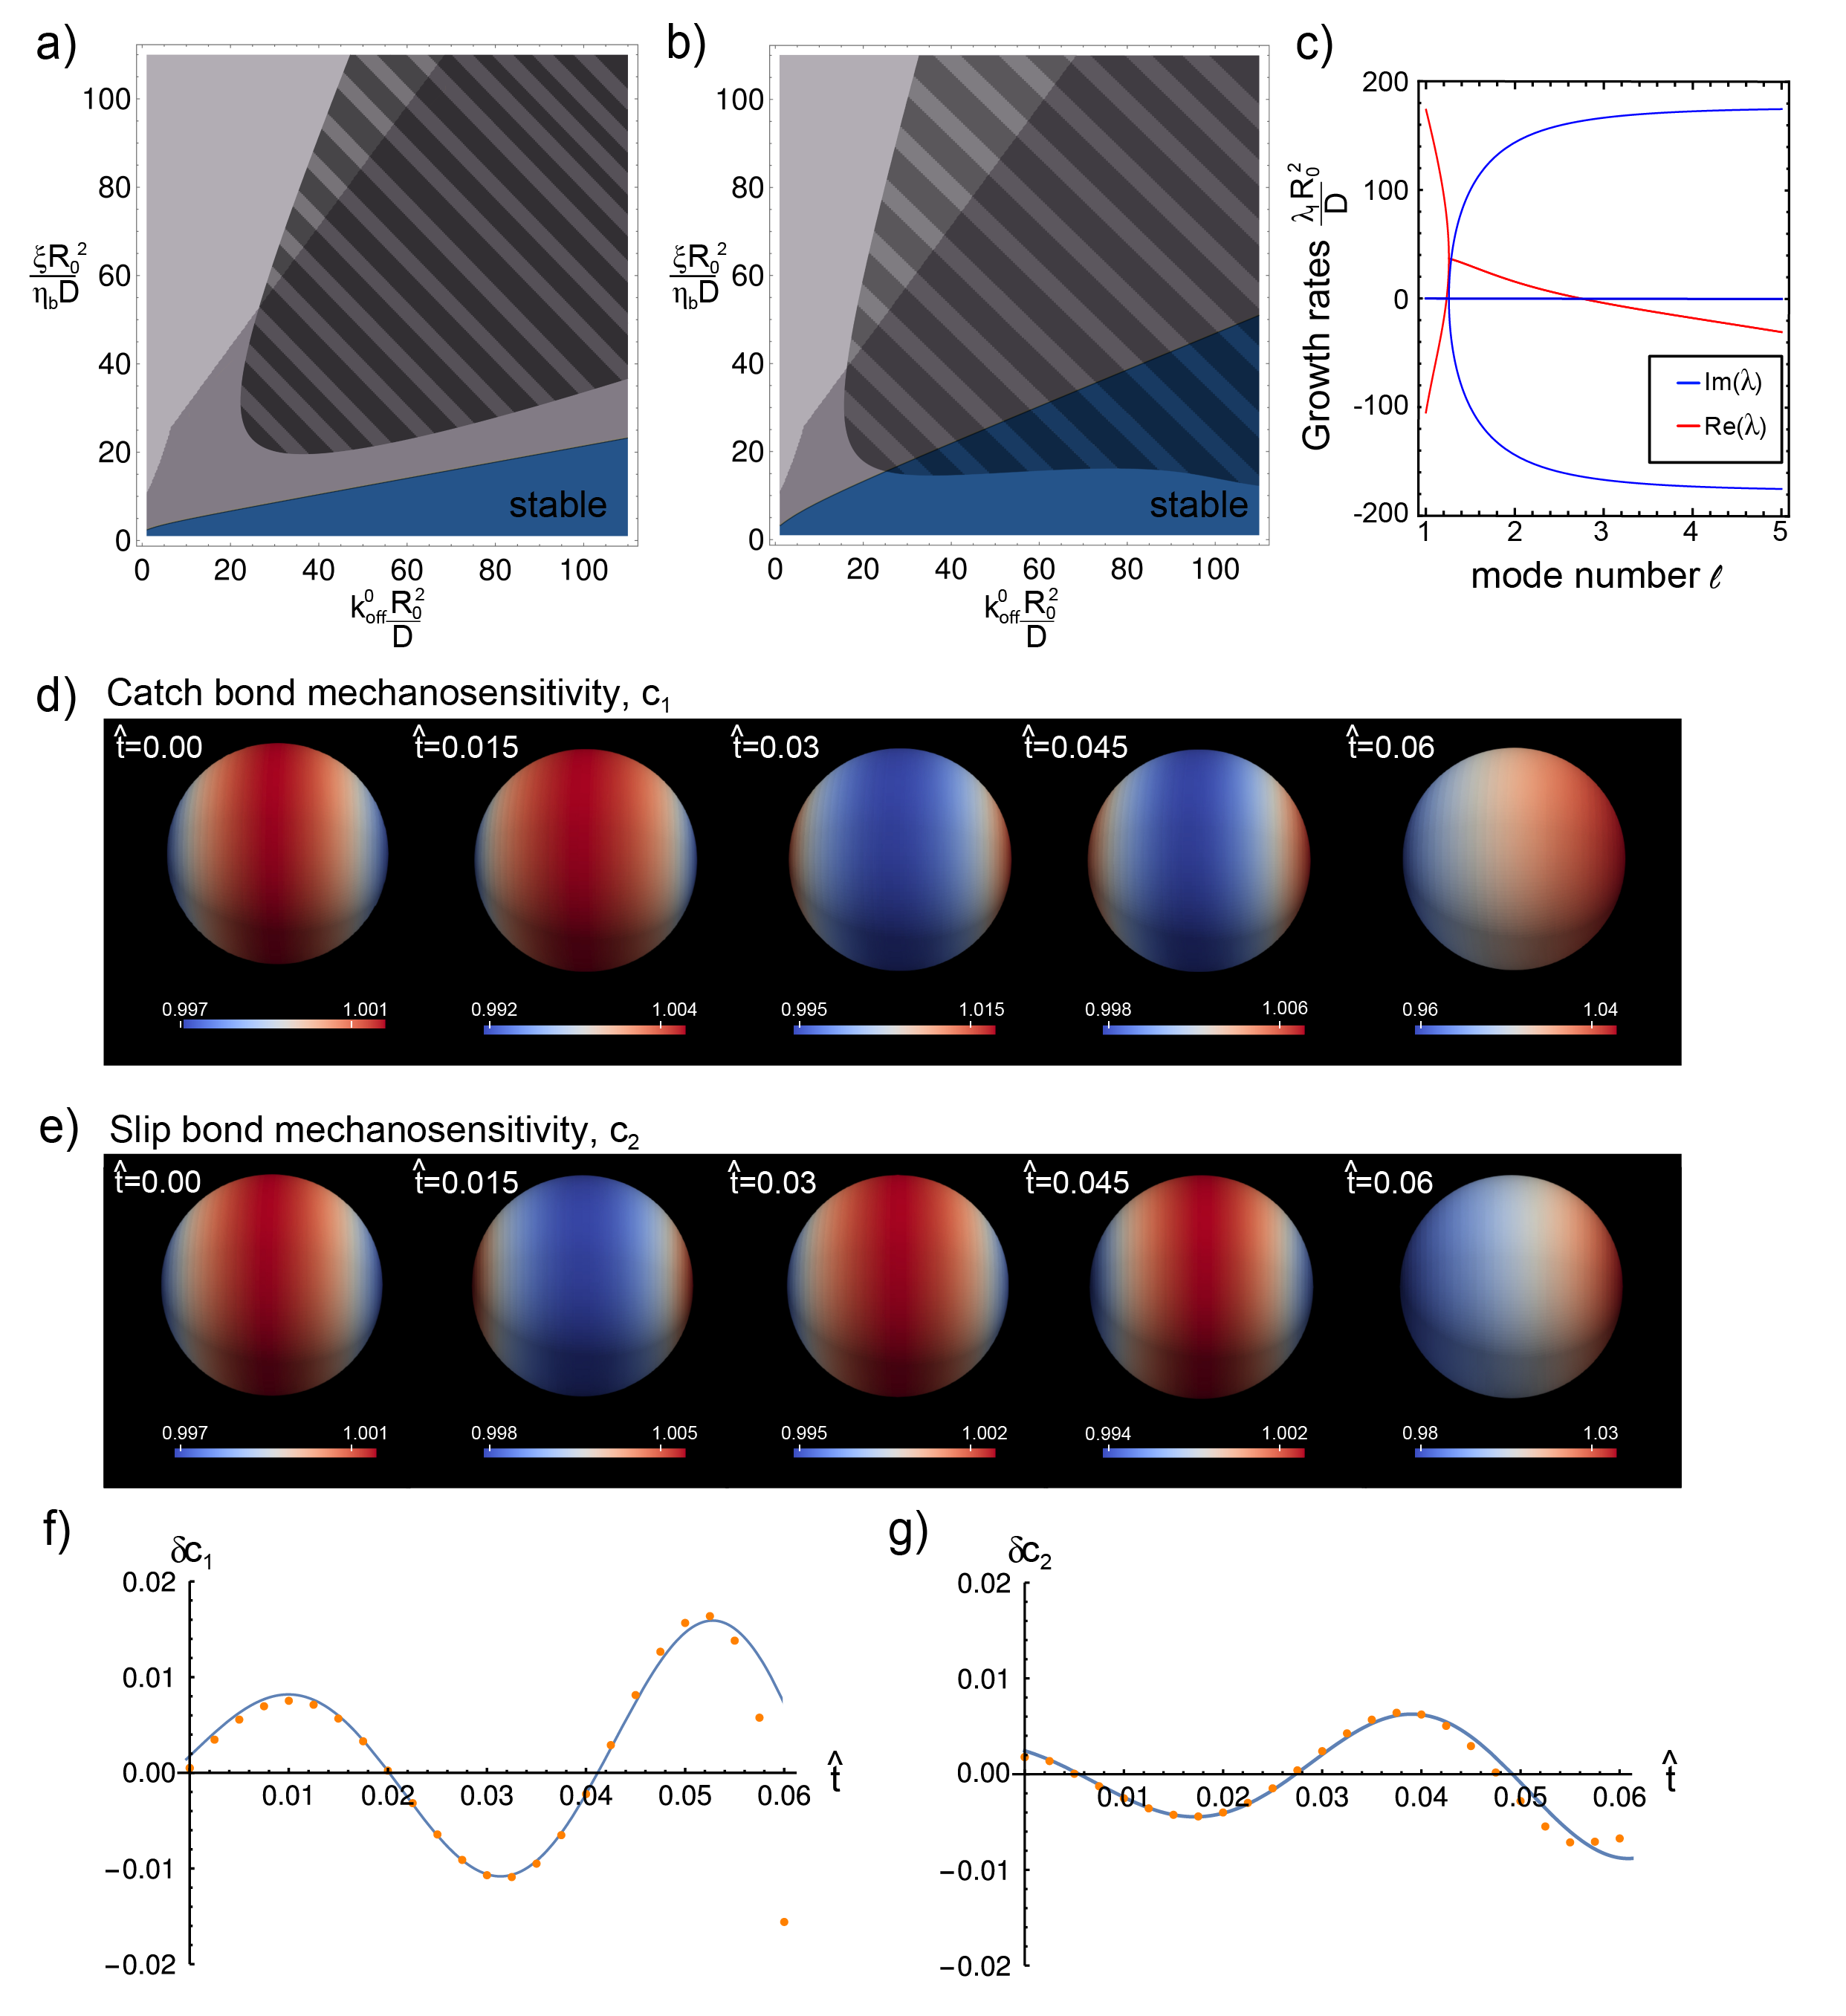
In the following, we will consider a concentration field describing a catch bond molecular regulator () in combination with a second concentration field describing a slip bond molecular regulator (). Making the specific choice of
and , we present a phase diagram as predicted by linear stability analysis in Fig. 2a (vanishing bulk viscosity) and 2b (small bulk viscosity ). For , oscillatory dynamics of mode perturbations can be found (see Fig. 2d,e,f,g). However, the real part of the growth rate of the mode is always greater than the growth rate of an oscillatory higher order mode. In accordance with this, we see stationary solutions with one concentration maximum at the pole emerging at longer times (see Fig. 2d,e).
It is noteworthy that for flat active surfaces, there are no pattern-forming eigenmodes that avoid shear strains in the linear regime. Correspondingly, persistent oscillatory concentration patterns are predicted by the linear stability analysis (see Supplementary Section 4). Making the choice that , , , and , we find oscillatory solutions if
| (7) |
where is the trace of the stress in steady state (see Supplementary Section 4). The emergence of oscillations in this parameter regime can be understood as follows: perturbative local enrichments of molecular regulators will give rise to local contractile advection because of locally increased . In the presence of shear deformation, the induced flow will give rise to a local increase of the trace of the stress tensor . In turn, the catch bonding property of the first molecular regulator will at first locally increase and local contractility. After some delay (!), the locally increased of the slip bonding regulator kicks in reducing the local and correspondingly also local contractility. Therefore, concentration bumps are first amplified (due to the fast catch bonding regulator) and then shrink with a delay (due to the slow slip bonding regulator) giving rise to oscillatory concentration changes. It is noteworthy that this effect relies on the presence of a non-vanishing shear viscosity and shear deformation. Correspondingly, oscillatory eigenvalues do not occur for . Furthermore, it is noteworthy that the here reported mechanism of oscillatory pattern formation relies on the well-known mechanism of a fast activator (catch-bonding regulator) and a slow inhibitor (slip-bonding regulator) as was previously in depth characterized for reaction-diffusion systems Murray (2013); Cross and Hohenberg (1993).
IV Ring constriction on active spherical surfaces depends on the ratio between shear and bulk viscosity
During the division of animal cells, an initially round cell constricts through a contractile ring that forms as part of the actomyosin cortex of the cell Wollrab et al. (2016); Spira et al. (2017). This contractile ring is known to be enriched in molecular contractility regulators (myosin motors) Wollrab et al. (2016); Spira et al. (2017). It has been proposed that mitotic cell constriction might be driven by self-organized pattern formation of the active actomyosin cortex at the cell periphery, see e.g. Mietke et al. (2019a, b); Bois et al. (2011); Kumar et al. (2014); Salbreux and Jülicher (2017); Wagner and Glotzer (2016); Salbreux et al. (2009); Berthoumieux et al. (2014); Gross et al. (2019); Reymann et al. (2016). Furthermore, myosin motors have been previously suggested to exhibit catch bond mechanosensitivity in their actin binding Schiffhauer et al. (2016); Guo and Guilford (2006).
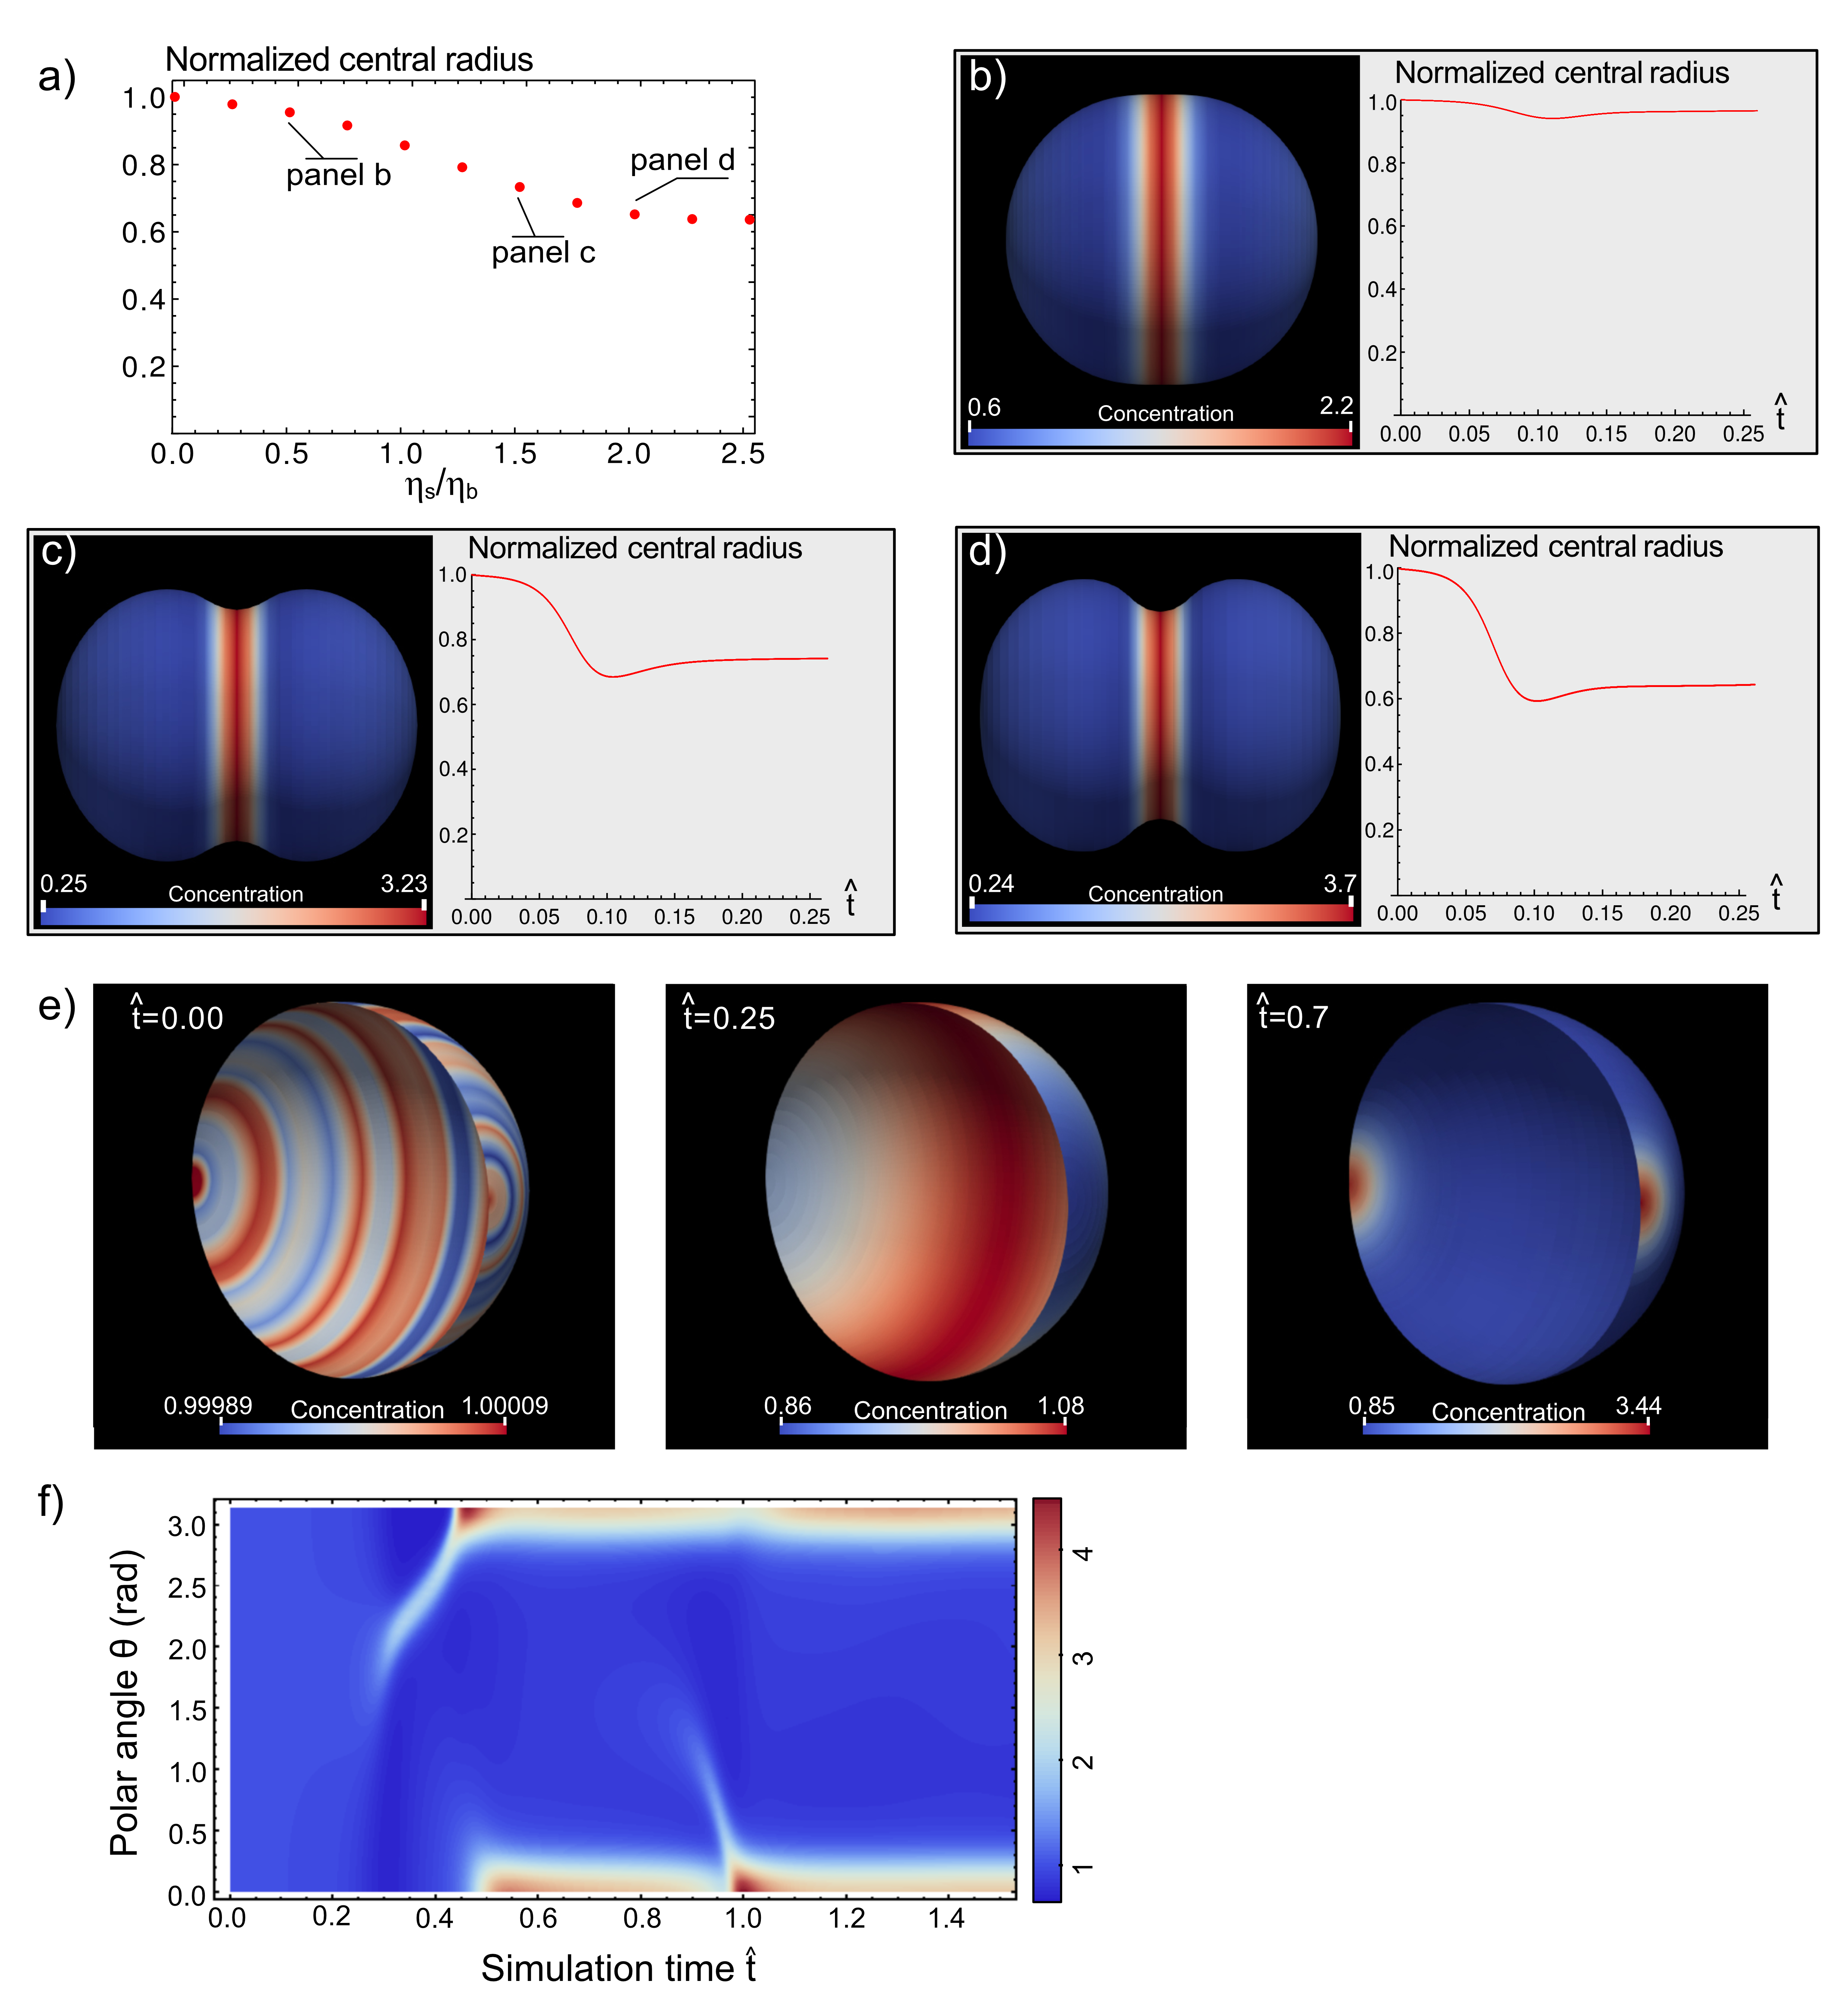
Therefore, we asked to which extent active spherical surfaces in our model can form a ring constriction by one molecular regulator with catch bond mechanosensitivity. Overall, in the unstable parameter regime, small ring-shaped concentration perturbations (proportional to a negative mode, see e.g. Fig. 1e) lead to a surface constriction that is enhanced by the contractility parameter , see Wittwer and Aland (2022). Here, we show that constriction increases also in dependence of the ratio between area shear viscosity and area bulk viscosity (see Fig. 3a-d). Intuitively, this can be understood as follows; in a ring-shaped concentration peak, there is a continuous flux from the poles to the ring Wittwer and Aland (2022), leading to a unidirectional compression of material in the direction orthogonal to the ring. If shear viscosity is high, shear deformations (i.e. aspect ratio changes of surface elements) tend to be avoided by the dynamics of the system. Correspondingly, unidirectional compression of the material orthogonal to the ring tends to trigger compression along the ring. Therefore, the ring gets smaller in diameter, i.e. it constricts.
For growing values of , harmonic modes with increasing value of become dominant. In particular, for the parameter choice in Fig. 3, mode dominance transitions from the mode to the mode once . Hence, we see that large symmetric ring constrictions are not a stationary state but start to evolve to an asymmetric distribution after or greater.
We had seen that in certain parameter regimes ring-shaped concentration distributions may emerge from random concentration perturbations of catch bonding cross-linkers (see Fig. 1b,e). However, we observed in simulations that, in these cases, the emerging ring is not stable in the nonlinear regime and slips to one of the poles such that, eventually, the system emerges to a steady state conformation with two concentration maxima at the poles (see Fig. 3e,f and Movie 1). We conclude, that with the current model of one mechanosensitive catch bond cross-linker in the limit of low cytoplasmic viscosity (large hydrodynamic length scale), we could not find parameters for which we obtained stable constricted rings emerging from random perturbations in a self-organized manner.
V Concentration-dependent shear viscosities can enhance the robustness of ring formation
In the search for mechanisms that would stabilize the ‘ring’ pattern on an active surface, we further investigated modifications of the model that exclusively affected the nonlinear range of concentration and shape perturbations. In particular, we decided to investigate the case of concentration dependent shear viscosities. The concentration dependence of shear viscosity can be motivated by two arguments: 1) It has been observed experimentally that the complex shear modulus increases upon increased cross-linking, see e.g. Gardel et al. (2004, 2006). (In particular, cross-linking was associated to a disproportionate increase of shear stiffness over bulk stiffness as can be inferred from the observation of a cross-linking induced decrease of the Poisson ratio Greaves et al. (2011).) 2) The second argument is provided by the experimental finding that active stress leads to shear-stiffening of biopolymeric networks as was suggested by in vivo and in vitro studies Fischer-Friedrich et al. (2016); Wang et al. (2002); Koenderink et al. (2009); Fernández et al. (2006); Stamenović et al. (2004). This stress-stiffening might result from the shear-induced nematic alignment of cortical filaments Fischer-Friedrich (2018); Ingber et al. (2014) or from other stress-induced structural changes Broedersz and MacKintosh (2011). (As active stress in the active surface increases monotonically as a function of concentration of molecular regulators, the shear viscosity increase in dependence of active stress can be translated into a viscosity increase in dependence of molecular concentration .)
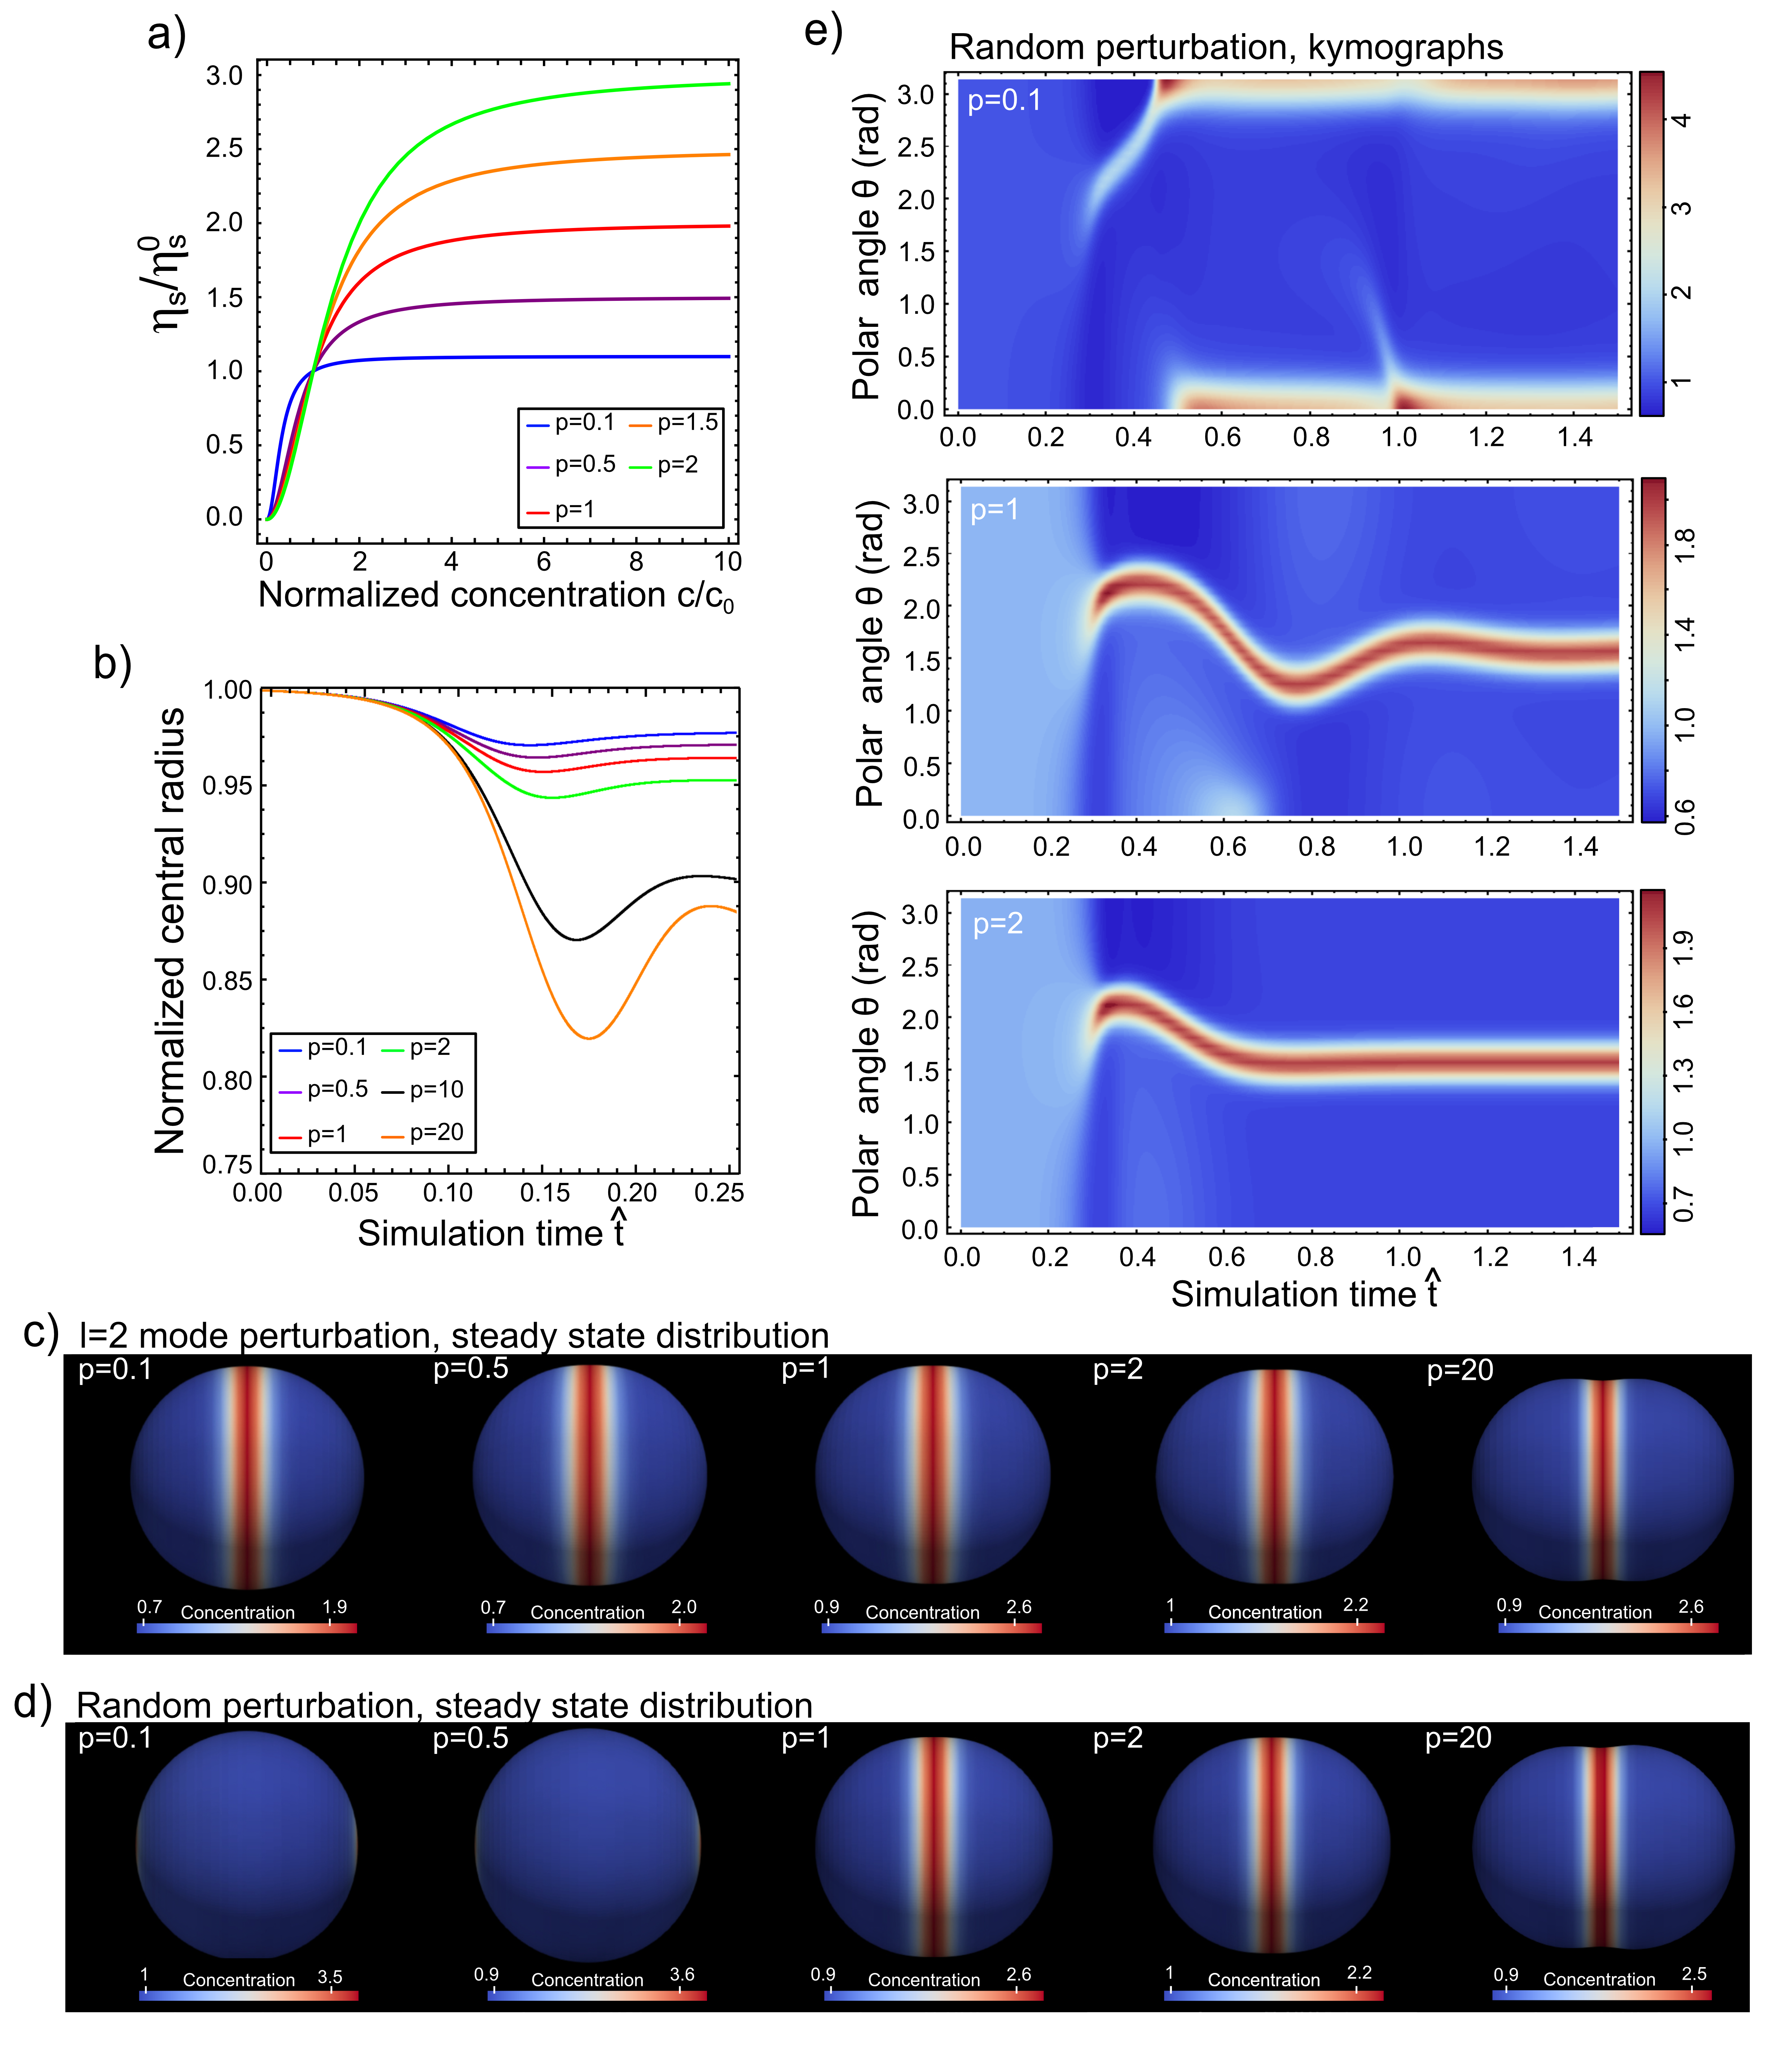
We make the specific choice of , where is a parameter that tunes the concentration dependence of shear viscosity. Here, corresponds to the case of no concentration dependence and corresponds to the strong concentration dependence (see Fig. 4a). We find that increasing values of lead to increasing constriction of ring distributions in our simulations (see Fig. 4b,c). This is expected from our finding that high ratios of area shear and bulk viscosity promote ring constriction, as this viscosity ratio grows with parameter inside the ring (see Fig. 3a and Fig. 4a,c).
While for low values of the contractile ring slips toward the poles at later times (see Fig. 4e, top panel and Movie 2), we find that for a sufficiently strong rise of with concentration , this ring slippage does not take place anymore (see Fig. 4d,e). In fact, we find that initially off-centered ring conformations can be centred over time by the dynamics of the system (Fig. 4e, Fig. S1 and Movie 3 and 4). This behavior can be understood as follows; in the ring, regulator concentrations are high which increases viscosity locally and slows ring dynamics; when the ring is in an off-center position, the neighboring larger segment of the sphere is drained to a lesser extent of molecular regulators through advective flux into the ring. Therefore, in the larger segment, the regulator concentration starts to become higher than in the smaller segment of the sphere on the other side of the ring (see e.g. time point in Fig. 4e, mid panel). Therefore, the ring is ‘fed’ more from the side of the larger segment. In turn, the ring moves towards the side of the larger segment over time. If the ring motion is not slow enough, this phenomenon can lead to an overshoot, that means a ring movement beyond the center (see e.g. time point in Fig. 4e, mid panel). A damped left-right oscillation of the ring follows until the ring stays in the center (see Fig. 4e, mid panel, and Movie 3). For sufficiently large values of , viscosities in the ring are so high, that no overshoot happens and the ring centers more quickly (see Fig. 4e, bottom panel, Fig. S1 and Movie 4).
In spite of the described effect of ring centering, we observed that the emergence of a ring conformation depends on the nature of the random perturbation. Choosing ten different random seeds, we see ring emergence in seven out of ten cases. In the remaining three cases, concentration aggregates start to emerge at the pole or close to the pole. In these cases, two concentration maxima at the pole are forming as steady state conformation. Therefore, we conclude that emergence of a ring conformation from a uniform state requires perturbations that favor ring-shaped concentration patterns over polar concentration peaks.
VI Discussion
In this study, we revisited a minimal model of active cortical surfaces of animal cells as introduced by Mietke et al. Mietke et al. (2019b). Model cortices with spherical reference geometry were described as closed active viscous surfaces whose mechanics is determined by a shear and bulk surface viscosity and as well as an active stress contribution adjusted by the local concentration of molecular regulators and an activity tuning parameter (see Eq. (1)). Furthermore, an internal bulk fluid of significantly lower viscosity was mechanically coupled to the active surface. The corresponding hydrodynamic length scale was chosen to be large as suggested by measurements on cells Fischer-Friedrich et al. (2016); Hosseini et al. (2021).
The model by Mietke et al. was extended by the new feature of mechanosensitive molecular regulators. In particular, we discussed the case of a molecular unbinding rate with an exponential dependence on the trace of the local surface stress tensor (see Eq. (1)). Corresponding exponential growth of the unbinding rate was mimicking a slip bond behavior, while an exponential decline with was mimicking a catch bond behavior of the molecular regulator. Therefore, the lifetime of catch bond regulators at the active surface is increased for higher values of , while the lifetime of slip bond cross-linkers at the active surface is reduced at increased .
Using linear stability analysis and finite element numerical simulations, we analysed the pattern formation of our model in different parameters regimes. For the case of one molecular species with slip-bond mechanosensitivity, we find that the harmonic mode with always becomes unstable first analogous to the case of stress-independent (see Fig. 1a) Mietke et al. (2019b). By contrast, for the case of one molecular regulator with catch-bond mechanosensitivity, the spectrum of emerging patterns significantly widens; for arbitrary (spherical) harmonic modes, we found parameter regions in which associated concentration perturbations are dominantly amplified (Fig. 1b). This effect originates from the growth rates of higher order modes () being increased through the stress-dependence of in the catch bond case. On the other hand, the growth rate of the mode remains unchanged because the stress trace stays uniform across the sphere for perturbations (in the linear regime). In fact, only higher order modes generate area shear deformation in the linear regime, which allows for local variation of and a corresponding variation of molecular lifetime at the cortex (see Eq. (6) and Supplementary Section 3).
Admitting for two molecular regulators with mixed mechanosensitivity, we found that oscillatory higher order modes () can be generated as transient patterns on the sphere (Fig. 3). For a flat two-dimensional active surface, stable oscillatory solutions are predicted by linear stability analysis for adequate parameter regimes (see Supplementary Section 4).
Motivated by the myosin-rich contractile ring that constricts cells during cell division, we asked to which extent active spherical surfaces in our model can be constricted by one molecular regulator with catch bond mechanosensitivity. We observed that amplification of mode perturbations in ring conformation can give rise to self-organized central accumulation of molecular regulators and central constriction of the cell. We found that this constriction increases with the ratio between area shear and bulk viscosity. However, we further observed that corresponding ring conformations of the cortex are not stable with regards to small asymmetric concentration perturbations in the nonlinear regime; over time, ring conformations transition into other patterns, such as two symmetric concentration maxima at the poles, via asymmetric ring slippage (see Fig. 3e,f).
To investigate if ‘ring’ conformations of the active surface could be stabilized in the nonlinear regime, we further tested a modification of the model that exclusively affects the nonlinear range of concentration and shape perturbations. In particular, we investigated the case of area shear viscosities that depend on the local concentration of molecular regulators as motivated by experimental observations Gardel et al. (2004). We found that the ‘ring’ conformation of the active cortex can be stabilised by this effect and even ring centering can be achieved over time (Fig. 4d,e).
Numerous experimental findings have highlighted the key role of actin cross-linkers as key regulators of actin cortex mechanics in cells. In addition, experimental evidence is increasing that actin cross-linker binding dynamics is by itself mechanosensitive Yao et al. (2013); Schiffhauer et al. (2016); Luo et al. (2013); Hosseini et al. (2020); Mulla et al. (2020). Here, we investigated the influence of mechanosensitive molecular regulators on pattern formation and deformation of active spherical surfaces. Our analysis shows that mechanosensitivity of molecular regulators significantly enriches the pattern spectrum of mechanochemical self-organization in the regime of large hydrodynamic length scales. Thus molecular mechanosensitivity of cortical regulators may serve cells as a mechanism to tune cortical pattern formation adapted to cellular function.
Acknowledgments
We thank Frank Jülicher, Christoph Weber, Stephan Grill and Axel Voigt for support of the project and fruitful discussions on the topic. SA and EFF acknowledge financial support from the DFG in the context of the Forschergruppe FOR3013, projects AL 1705/6-1 (SA) and FI 2260/5-1 (EFF). E.F.-F. was further supported by the Deutsche Forschungsgemeinschaft under Germany’s Excellence Strategy, EXC-2068-390729961, Cluster of Excellence Physics of Life of TU Dresden. Simulations were performed at the Center for Information Services and High Performance Computing (ZIH) at TU Dresden.
References
- Salbreux et al. (2012) Salbreux, G., G. Charras, and E. Paluch, 2012. Actin cortex mechanics and cellular morphogenesis. Trend. Cell. Biol. 22:536–545.
- Chugh and Paluch (2018) Chugh, P., and E. K. Paluch, 2018. The actin cortex at a glance. J. Cell. Sci. 131.
- Koenderink and Paluch (2018) Koenderink, G. H., and E. K. Paluch, 2018. Architecture shapes contractility in actomyosin networks. Curr Opin Cell Biol 50:79–85.
- Mietke et al. (2019a) Mietke, A., F. Jülicher, and I. F. Sbalzarini, 2019. Self-organized shape dynamics of active surfaces. PNAS 116:29–34.
- Mietke et al. (2019b) Mietke, A., V. Jemseena, K. V. Kumar, I. F. Sbalzarini, and F. Jülicher, 2019. Minimal Model of Cellular Symmetry Breaking. Phys. Rev. Lett. 123:188101.
- Bois et al. (2011) Bois, J. S., F. Jülicher, and S. W. Grill, 2011. Pattern Formation in Active Fluids. Phys. Rev. Lett. 106:028103.
- Kumar et al. (2014) Kumar, K. V., J. S. Bois, F. Jülicher, and S. W. Grill, 2014. Pulsatory Patterns in Active Fluids. Phys. Rev. Lett. 112:208101.
- Salbreux and Jülicher (2017) Salbreux, G., and F. Jülicher, 2017. Mechanics of active surfaces. Phys. Rev. E 96:032404.
- Wagner and Glotzer (2016) Wagner, E., and M. Glotzer, 2016. Local RhoA activation induces cytokinetic furrows independent of spindle position and cell cycle stage. J. Cell. Biol. 213:641–649.
- Salbreux et al. (2009) Salbreux, G., J. Prost, and J. F. Joanny, 2009. Hydrodynamics of cellular cortical flows and the formation of contractile rings. Phys. Rev. Lett. 103:058102.
- Berthoumieux et al. (2014) Berthoumieux, H., J.-L. Maître, C.-P. Heisenberg, E. K. Paluch, F. Jülicher, and G. Salbreux, 2014. Active elastic thin shell theory for cellular deformations. New J. Phys. 16:065005.
- Gross et al. (2019) Gross, P., K. V. Kumar, N. W. Goehring, J. S. Bois, C. Hoege, F. Jülicher, and S. W. Grill, 2019. Guiding self-organized pattern formation in cell polarity establishment. Nat. Phys. 15:293–300.
- Reymann et al. (2016) Reymann, A.-C., F. Staniscia, A. Erzberger, G. Salbreux, and S. W. Grill, 2016. Cortical flow aligns actin filaments to form a furrow. eLife 5:e17807.
- Ennomani et al. (2016) Ennomani, H., G. Letort, C. Guérin, J.-L. Martiel, W. Cao, F. Nédélec, E. M. De La Cruz, M. Théry, and L. Blanchoin, 2016. Architecture and Connectivity Govern Actin Network Contractility. Curr. Biol. 26:616–626.
- Fischer-Friedrich et al. (2016) Fischer-Friedrich, E., Y. Toyoda, C. J. Cattin, D. J. Müller, A. A. Hyman, and F. Jülicher, 2016. Rheology of the active cell cortex in mitosis. Biophys. J. 111:589–600.
- Alvarado et al. (2013) Alvarado, J., M. Sheinman, A. Sharma, F. C. MacKintosh, and G. H. Koenderink, 2013. Molecular motors robustly drive active gels to a critically connected state. Nature Physics 9:591–597.
- Toyoda et al. (2017) Toyoda, Y., C. J. Cattin, M. P. Stewart, I. Poser, M. Theis, T. V. Kurzchalia, F. Buchholz, A. A. Hyman, and D. J. Müller, 2017. Genome-scale single-cell mechanical phenotyping reveals disease-related genes involved in mitotic rounding. Nat. Commun. 8:1266.
- Gardel et al. (2004) Gardel, M. L., J. H. Shin, F. C. MacKintosh, L. Mahadevan, P. Matsudaira, and D. A. Weitz, 2004. Elastic Behavior of Cross-Linked and Bundled Actin Networks. Science 304:1301–1305.
- Gardel et al. (2006) Gardel, M. L., F. Nakamura, J. H. Hartwig, J. C. Crocker, T. P. Stossel, and D. A. Weitz, 2006. Prestressed F-actin networks cross-linked by hinged filamins replicate mechanical properties of cells. PNAS 103:1762–1767.
- Yao et al. (2013) Yao, N. Y., C. P. Broedersz, M. Depken, D. J. Becker, M. R. Pollak, F. C. MacKintosh, and D. A. Weitz, 2013. Stress-Enhanced Gelation: A Dynamic Nonlinearity of Elasticity. Phys. Rev. Lett. 110:018103.
- Schiffhauer et al. (2016) Schiffhauer, E. S., T. Luo, K. Mohan, V. Srivastava, X. Qian, E. R. Griffis, P. A. Iglesias, and D. N. Robinson, 2016. Mechanoaccumulative Elements of the Mammalian Actin Cytoskeleton. Curr. Biol. 26:1473–1479.
- Luo et al. (2013) Luo, T., K. Mohan, P. A. Iglesias, and D. N. Robinson, 2013. Molecular mechanisms of cellular mechanosensing. Nat. Mater. 12:1064–1071.
- Hosseini et al. (2020) Hosseini, K., L. Sbosny, I. Poser, and E. Fischer-Friedrich, 2020. Binding dynamics of alpha-actinin-4 in dependence of actin cortex tension. Biophys. J. 1091–1107.
- Mulla et al. (2020) Mulla, Y., M. J. Avellaneda, A. Roland, L. Baldauf, S. J. Tans, and G. H. Koenderink, 2020. Weak catch bonds make strong networks. bioRxiv 2020.07.27.219618.
- Guo and Guilford (2006) Guo, B., and W. H. Guilford, 2006. Mechanics of actomyosin bonds in different nucleotide states are tuned to muscle contraction. PNAS 103:9844–9849.
- Kelkar et al. (2020) Kelkar, M., P. Bohec, and G. Charras, 2020. Mechanics of the cellular actin cortex: From signalling to shape change. Curr. Opin. Cell Biol. 66:69–78.
- Hosseini et al. (2021) Hosseini, K., A. Frenzel, and E. Fischer-Friedrich, 2021. EMT changes actin cortex rheology in a cell-cycle-dependent manner. Biophys. J. 120:3516–3526.
- Kalwarczyk et al. (2011) Kalwarczyk, T., N. Ziȩbacz, A. Bielejewska, E. Zaboklicka, K. Koynov, J. Szymański, A. Wilk, A. Patkowski, J. Gapiński, H.-J. Butt, and R. Hołyst, 2011. Comparative Analysis of Viscosity of Complex Liquids and Cytoplasm of Mammalian Cells at the Nanoscale. Nano Lett. 11:2157–2163.
- Daniels et al. (2006) Daniels, B. R., B. C. Masi, and D. Wirtz, 2006. Probing Single-Cell Micromechanics In Vivo: The Microrheology of C. elegans Developing Embryos. Biophys. J. 90:4712–4719.
- Landau and Lifshitz (1986) Landau, L., and E. Lifshitz, 1986. Theory of Elasticity. Elsevier Ltd., 3rd edition.
- Fischer-Friedrich et al. (2014) Fischer-Friedrich, E., A. A. Hyman, F. Jülicher, D. J. Müller, and J. Helenius, 2014. Quantification of surface tension and internal pressure generated by single mitotic cells. Sci. Rep. 4:6213.
- Thomas et al. (2008) Thomas, W. E., V. Vogel, and E. Sokurenko, 2008. Biophysics of Catch Bonds. Annu. Rev. Biophys. 37:399–416.
- Marshall et al. (2003) Marshall, B. T., M. Long, J. W. Piper, T. Yago, R. P. McEver, and C. Zhu, 2003. Direct observation of catch bonds involving cell-adhesion molecules. Nature 423:190–193.
- Wittwer and Aland (2022) Wittwer, L. D., and S. Aland, 2022. A computational model of self-organized shape dynamics of active surfaces in fluids. arXiv:2203.00099 [cond-mat] .
- Vey and Voigt (2007) Vey, S., and A. Voigt, 2007. AMDiS: adaptive multidimensional simulations. Comput. Vis. Sci. 10:57–67.
- Witkowski et al. (2015) Witkowski, T., S. Ling, S. Praetorius, and A. Voigt, 2015. Software concepts and numerical algorithms for a scalable adaptive parallel finite element method. Adv. Comput. Math. 41:1145–1177.
- Veigel et al. (2003) Veigel, C., J. E. Molloy, S. Schmitz, and J. Kendrick-Jones, 2003. Load-dependent kinetics of force production by smooth muscle myosin measured with optical tweezers. Nat. Cell Biol. 5:980–986.
- Lieleg et al. (2008) Lieleg, O., M. M. A. E. Claessens, Y. Luan, and A. R. Bausch, 2008. Transient binding and dissipation in cross-linked actin networks. Phys. Rev. Lett. 101:108101.
- Murray (2013) Murray, J. D., 2013. Mathematical Biology. Springer Science & Business Media.
- Cross and Hohenberg (1993) Cross, M. C., and P. C. Hohenberg, 1993. Pattern formation outside of equilibrium. Rev. Mod. Phys. 65:851–1112.
- Wollrab et al. (2016) Wollrab, V., R. Thiagarajan, A. Wald, K. Kruse, and D. Riveline, 2016. Still and rotating myosin clusters determine cytokinetic ring constriction. Nat. Commun. 7:11860.
- Spira et al. (2017) Spira, F., S. Cuylen-Haering, S. Mehta, M. Samwer, A. Reversat, A. Verma, R. Oldenbourg, M. Sixt, and D. W. Gerlich, 2017. Cytokinesis in vertebrate cells initiates by contraction of an equatorial actomyosin network composed of randomly oriented filaments. eLife 6:e30867.
- Greaves et al. (2011) Greaves, G. N., A. L. Greer, R. S. Lakes, and T. Rouxel, 2011. Poisson’s ratio and modern materials. Nat. Mater. 10:823–837.
- Wang et al. (2002) Wang, N., I. M. Tolić-Nørrelykke, J. Chen, S. M. Mijailovich, J. P. Butler, J. J. Fredberg, and D. Stamenović, 2002. Cell prestress. I. Stiffness and prestress are closely associated in adherent contractile cells. Am. J. Physiol.-Cell. Ph. 282:C606–C616.
- Koenderink et al. (2009) Koenderink, G. H., Z. Dogic, F. Nakamura, P. M. Bendix, F. C. MacKintosh, J. H. Hartwig, T. P. Stossel, and D. A. Weitz, 2009. An active biopolymer network controlled by molecular motors. PNAS 106:15192–15197.
- Fernández et al. (2006) Fernández, P., P. A. Pullarkat, and A. Ott, 2006. A master relation defines the nonlinear viscoelasticity of single fibroblasts. Biophys. J. 90:3796–3805.
- Stamenović et al. (2004) Stamenović, D., B. Suki, B. Fabry, N. Wang, J. J. Fredberg, and J. E. Buy, 2004. Rheology of airway smooth muscle cells is associated with cytoskeletal contractile stress. J. Appl. Physiol. 96:1600–1605.
- Fischer-Friedrich (2018) Fischer-Friedrich, E., 2018. Active Prestress Leads to an Apparent Stiffening of Cells through Geometrical Effects. Biophys. J. 114:419–424.
- Ingber et al. (2014) Ingber, D. E., N. Wang, and D. Stamenovifá, 2014. Tensegrity, cellular biophysics, and the mechanics of living systems. Rep. Prog. Phys. 77:046603.
- Broedersz and MacKintosh (2011) Broedersz, C. P., and F. C. MacKintosh, 2011. Molecular motors stiffen non-affine semiflexible polymer networks. Soft Matter 7:3186.