language=Verilog, morekeywords=unique, logic, always_comb, typedef, enum,
Bringing Source-Level Debugging Frameworks to Hardware Generators
Abstract.
High-level hardware generators have significantly increased the productivity of design engineers. They use software engineering constructs to reduce the repetition required to express complex designs and enable more composability. However, these benefits are undermined by a lack of debugging infrastructure, requiring hardware designers to debug generated, usually incomprehensible, RTL code. This paper describes a framework that connects modern software source-level debugging frameworks to RTL created from hardware generators. Our working prototype offers an Integrated Development Environment (IDE) experience for generators such as RocketChip (Chisel), allowing designers to set breakpoints in complex source code, relate RTL simulation state back to source-level variables, and do forward and backward debugging, with almost no simulation overhead (less than 5%).
1. Introduction
The past two decades have seen many hardware generation frameworks (HGFs) that increase design productivity by mixing software programming languages with hardware description languages (HDLs). Either a scripting language is added on-top of an existing HDL (et al., 2010) or the HDL is embedded into another high-level programming language, such as Chisel (Scala) (et al., 2012), Mamba (el.al, 2018), and Magma (Python) (Truong and Hanrahan, 2021). A growing trend in this hardware generator domain is to apply software engineering concepts such as object-oriented programming and functional programming to hardware design, which has been shown to increase design productivity (et al., 2012).
However, even though generators have moved the hardware description up a level closer to software engineering, many of the IP blocks used in the system are still coded/transferred at the RTL level, and all state of the art logic simulators still focus on this level. This reality forces HGF designers to debug system and interface errors through RTL simulation. Our solution to this problem lets the programmer leverage advanced software debugging techniques, developed over decades, to debug hardware designs simulated at the RTL level using the context of a generator’s source code and data structures. Just like everyone expects to debug their C-code using a source-level debugger, we think hardware designers deserve the same type of debugging environment, without having to reason about the generated RTL, i.e. the assembly language.
The debugging system should be orthogonal to the testing environment so that the framework can be used with well-established testing frameworks such as Universal Verification Methodology (UVM). This allows designers to leverage drivers and monitors provided by testing frameworks that have been widely used in practice and shown to reduce the verification difficulties on large systems (et al., 2011). Thus our new system can combine the benefits of software debugging and hardware testing frameworks. In addition, because simulators are capable of capturing the traces for every state change, we can replay the trace and enable reverse-debugging, which is much more challenging to implement for software.
This paper presents our system, hgdb (hardware generator de-bugger), which is capable of debugging designs from various HGFs using commercial simulators and trace files. Key contributions of this paper include: (1) A modular software architecture with a well-defined interface for source-level debugging that allows existing tools to cleanly and efficiently interact. (2) A breakpoint emulation approach with minimal simulation overhead. (3) A prototype implementation of this type of debugger, hgdb, that allows source-level debugging for Chisel on complex designs.
2. Background
In the early stages of software engineering, developers had to write their code in a high-level language such as C or COBOL and then debug the assembly code directly after compiler optimizations, which is difficult to do. David Ditzel and David Patterson (et al., 1980) argued that the computer system should use high-level languages for both programming and debugging, and the system should report execution errors in terms of the high-level language source program. To enable high-level debugging, the compiler needs to track the source file information and store it in a separate symbol table that maps variable names to actual memory addresses and vice versa. During program execution, an external tool, a debugger, can load this symbol table and display the values with their original variable names instead of memory addresses. For a program where variables have different lifetimes, the variable binding, or scope, depends on the context of execution, and the debugging mapping must change accordingly. One major task for debuggers is to construct the scoped stack frame information based on the symbol table when required.
To allow easy interoperability between tools, software debuggers have adopted a set of standards, such as DWARF (committee, 2017). Regardless of the targeted programming languages, these systems essentially provide a mechanism that maps source-level information to a construct understandable by the debugger. The mapping includes (a) variable and scope mapping; and (b) line number mapping.
On the other hand, although HGFs such as Chisel and PyMTL have their own performant simulators that directly digest their respective intermediate representations (IRs) (Beamer and Donofrio, 2020; el.al, 2018), they do not offer any source-level debugging support, nor do they incorporate external IPs written in conventional Verilog. As a result, designers still have to resort to traditional waveforms with somewhat obfuscated RTL when debugging system-level issues.
Inspect (et.al, 2014) is an experimental system designed for debugging High-Level Synthesis (HLS) on FPGA. Inspect defines a symbol table which is used to reconstruct the source execution state so users can debug HLS programs at source-level. Because it is tightly integrated into the compiler tool chain, it has control over the code generation as well as various compiler passes. To facilitate debugging, Inspect inserts additional circuits into the underlying design and gathers debugging information during FPGA emulation. As a result, Inspect is tightly locked to its own compiler tool chain and a specific FPGA vendor. Our proposed system is inspired by Inspect, but instead focuses on traditional RTL simulations. It also decouples the dependencies on compilers and testing environment and avoids inserting additional RTL logic into the design to minimize undesirable simulation overhead.
Industrial debugging tools such as Verdi (Synopsys, 2021) employ powerful debugging techniques that enable hardware designers to quickly identify bugs in the RTL code. However, they are less useful for HGFs since the generated RTL does not convey the design intent, as shown in Listing 3 and 4. Our work addresses the challenge to correlate the problematic signals back to the source code and provide source-level debugging.
3. hgdb : A Debugger for HGF’s
Building an ambitious system that supports various simulation environments with a unified debugging infrastructure is clearly challenging. Many software debugging frameworks instead opt for language and platform specific debugging environments. To achieve our design goals, we believe the key is to define a clean interface between our three main components: simulators, debuggers, and symbol table.
One challenge is how to implement breakpoints: only a few simulators allow users to set breakpoints interactively, and their interface varies. To support all simulators means hgdb will need to emulate the breakpoints externally to the simulators; emulating breakpoints faithfully and efficiently is critical.
Another potential challenge is that developers rarely use an HGF to generate the entire design and test bench; instead, IP blocks from different sources are composed together to form a larger system and then simulated under a complex testing environment. As a result, hgdb only has a partial view of the final design and it needs a method to locate the generated IP in the complete system during simulation.
To address the breakpoint challenge, we leverage two facts about modern designs (1) most designs are synchronous, which implies that signals have to be stable before the rising edge of the clock; (2) most RTL simulations use zero-delay logic models. The first means that our system only needs to check for potential breakpoints at the rising edge of the clock. The second means that all logical values will be stable at every clock edge in the simulator. Thus, for a small loss in efficiency, one does not need to associate breakpoints with clock domains: one can check all breakpoints on every clock transition. Of course, evaluating breakpoints only on clock transitions create a number of subtle issues which hgdb must address. These issues are discussed in Section 3.1.
In terms of efficiency, for a large scale simulation, most of the computation time within a simulated clock cycle is consumed on evaluating logic performed in this cycle. Compared to this time intensive task, calling into a custom routine at each simulated clock cycle results in low overhead (5% as shown in Section 4.3).
To locate the generated IP within the entire design, we use the fact that all simulators have interfaces to query design hierarchy and hierarchical signal names. Since most HGFs use a number of compiler passes to lower some form of IR to RTL, these passes can be used to extract out symbol mappings. Although the design hierarchy presented in this symbol table is only a subset of the final design, the relative hierarchy does not change. Section 3.4 explains how hgdb can locate the generated IP block and use it to map source signals to the actual RTL hierarchical path inside the test bench by finding the block with matching module/signal names.
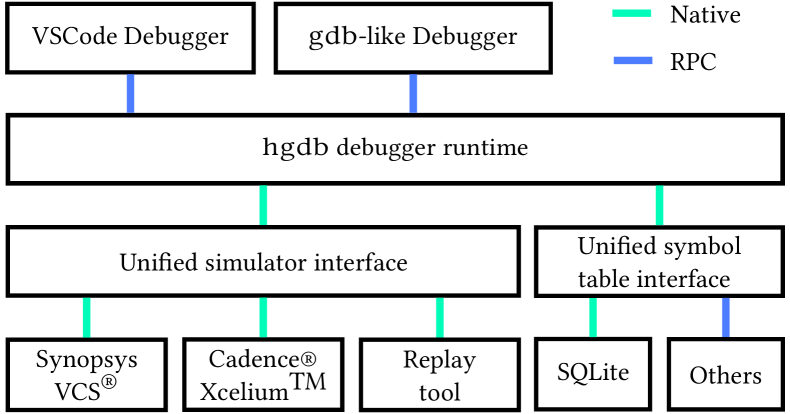
[hgdb system overview]hgdb system overview
As a result, hgdb defines two sets of unified interfaces: one for the simulator, and another one for the symbol table, as shown in Figure 1. Each interface defines a small set of primitives required to implement the functionality described above. By abstracting away the vendor-specific APIs and implementation details, we can maximize the compatibility across different tools and systems, which we believe is unique among hardware debugging systems. In addition, since the debugger runtime directly interacts with the simulator, we use native implementation to ensure minimal simulator overhead. However, for debugging interactions that are less timing sensitive, we use Remote Procedure Call (RPC) to enable compatibility.
3.1. Emulating Breakpoints in Simulation
The challenge in using state values after the simulator reaches equilibrium is that some desirable intermediate values are overwritten while the state is converging. This typically happens when the same variable is reused inside combinational logic to obtain the final result. For instance, a variable called sum can be overwritten multiple times inside a for loop for accumulation. If we inspect the design state at the next clock edge, we will only see the final result and lose all the intermediate partial sums, as shown by a C-like pseudo code in Listing 1.
Our solution is to leverage a widely used algorithm in HGF compilers, namely Static Single Assignment (SSA) (Rosen et al., 1988). Because the symbol name aliasing problem only happens in combinational logic, SSA is the perfect solution. During the SSA transform, fixed-length loops get unrolled and conditional statements get flattened so that each variable will only be assigned exactly once. Listing 2 shows the pseudo-code after the SSA transformation. Notice that the transform creates several temporal variables to hold the value of sum, which implies that the variable mapping can be different depending on context. We can use standard compiler techniques to track the variable mapping. In this case, if the breakpoint hits Line 4 in Listing 2, we should fetch the value of sum0 to represent sum, and sum1 at Line 6.
Due to loop unrolling and SSA, if the user sets a breakpoint at Line 4 in Listing 1, we need to emulate two breakpoints in Listing 2, one at Line 4 and one at Line 6. However, since these two mapped statements always execute regardless of the input condition, we need something called an enable condition that determines which line can be active during simulation. For instance, the enable condition for Line 4 in Listing 2 is data[0] % 2, which specifies that the potential breakpoint can be enabled only if data[0] is odd. The enable condition can be obtained by AND-reduction on the SSA transform condition stack. For conditional logic in sequential blocks, enable condition extraction is much easier, since we can simply walk up the hierarchy in the syntax tree and perform an AND-reduction on the conditions.
[C++ code before SSA transform]C++ code before SSA transform
[SSA transformed code]SSA transformed code
3.2. Breakpoint Scheduling and Reverse-Debugging
Since the breakpoints are emulated in software, hgdb is free to choose the ordering in which breakpoints are evaluated. If supported by the underlying simulator/toolchain, we can also use the same scheduling algorithm for reverse-debugging.
Notice that because hardware is concurrent, there could be tens of threads that share the same source information but operating on different data. To faithfully represent this concurrent behavior, we insert and schedule all breakpoints that share the same source location requested by the user. This is similar to thread information in software debugging, where users can select different threads during a breakpoint, as shown in Figure 4 \CircledB.
The scheduling algorithm is shown in Figure 2. Before the simulation starts, we compute the absolute ordering of every potential breakpoint based on the symbol table. In most cases, they are ordered by their lexical order and scopes, i.e. ordered by line and column number within a function. At the positive edge of the clock, we enter this breakpoint evaluation loop: (1) we select a list of inserted breakpoints that share the same source location based on the pre-computed ordering. If there is no breakpoint left to select, we exit the loop and wait for next clock edge; (2) we evaluate each breakpoint condition in parallel. Besides the breakpoint enable condition computed from SSA, each breakpoint can also contain conditional expressions specified by the user; (3) if any breakpoint matches the condition, we reconstruct the stack frame based on the symbol table and then send the result to the user; (4) once the user responds with a command, we loop back to step 1.
There are several benefits of using such loop-based breakpoint scheduling given our breakpoint emulation mechanism. First, we can exit the loop immediately if there is no breakpoint inserted, thus minimizing runtime overhead. Second, we can evaluate multiple breakpoints at the same time, reducing latency between breakpoint hits in the runtime and when user sees the reconstructed frames. Third, which is more subtle, we allow reverse-debugging within the same timestamp, which we call intra-cycle reverse debugging, regardless of the underlying simulators. Notice that in a normal debugging scenario, we select breakpoints in the order specified by the symbol table. If we reverse the selection order, however, we can create the illusion of going back in time as statements in the source code appear to be executed in reversed order. If the underlying simulator supports reversing time, such as a trace-based replay engine, we can extend this reverse-debugging capability to its full potential, since we can go to previous clock cycle and start breakpoint selection in reversed order again.

[hgdb breakpoint scheduling algorithm]hgdb breakpoint scheduling algorithm
3.3. Unified Simulator Interface
When selecting simulator interface primitives, one obvious challenge is how to support various simulator vendors, both commercial and open-source, and also enable offline replay from captured trace. Based on our prototyping experiences, we defined a minimum set of simulator interface primitives that enable hgdb to function.
-
•
Get signal value. This is essential to emulate breakpoint and reconstruct frames.
-
•
Get design hierarchy and clock information. This is used to map generated RTL to the full test environment when the testbench is produced outside the HGFs. We also need the clock information to know when to pause the simulation.
-
•
Place callbacks on clock changes. This is required to allow hgdb to evaluate breakpoints.
-
•
Get and set simulation time. This optional command enables reverse debugging.
-
•
Set signal value. This optional command enables the debugger to change simulation values (not possible when interfacing with a trace file).
These primitives are implemented using the Verilog Procedural Interface (VPI), an intrinsic part of the SystemVerilog standard. To maximize the compatibility, hgdb only uses a small subset of VPI functions, ones that are supported by all simulator vendors, to implement these primitives. For tools that do not have a VPI interface, we implement these primitives using additional design information. For instance, since VCD-based traces only contain design hierarchy but not definition information, we can use instance names from the symbol to figure out the actual hierarchy mapping, using common substring matching.
The interface is handled automatically by an Application Binary Interface (ABI) during executable linking time, which makes hgdb easy to integrate into any existing simulator environment.
3.4. Symbol Table
Symbol tables are crucial for translating filename/line numbers into breakpoint and reconstructing stack frame information. Based on our experience with different HGFs, we select a minimum set of primitives that can be easily provided by each HGF:
-
•
Get breakpoints from source location. This is used to translate line information to the actual breakpoints.
-
•
Get scope information for each breakpoint. This is required to construct a frame when a breakpoint is hit.
-
•
Resolve scoped variable names to RTL name. When constructing frames for the breakpoint, hgdb needs to translate source-level local variables into full hierarchical RTL names to query the simulator interface.
-
•
Resolve instance variable names to RTL name. Similar to scoped variable name, hgdb needs to translate instance-specific variables into full hierarchical RTL names.
Symbol table primitives are queried either through RPC or ABI implemented via a native SQLite database. The SQL schema is designed to be simple yet efficient to query debugging information, as shown in Figure 3. Table Instance describes hierarchical name in RTL and table Breakpoint encodes the source location information as well as the enable condition. It also references the instance so we can reconstruct the generator instance variables once a breakpoint hits. Scope Variable together with Variable can be used to construct the frame associated with any breakpoint. The symbol table primitives can be naturally translated into relational queries since these entities are linked together.
Notice that since the simulator is paused whenever hgdb interacts with the symbol table, e.g. either inserting breakpoints or constructing frames, the symbol table performance is less important compared to the simulator interface. This makes RPC-based implementations desirable for frameworks that implement their own symbol table.
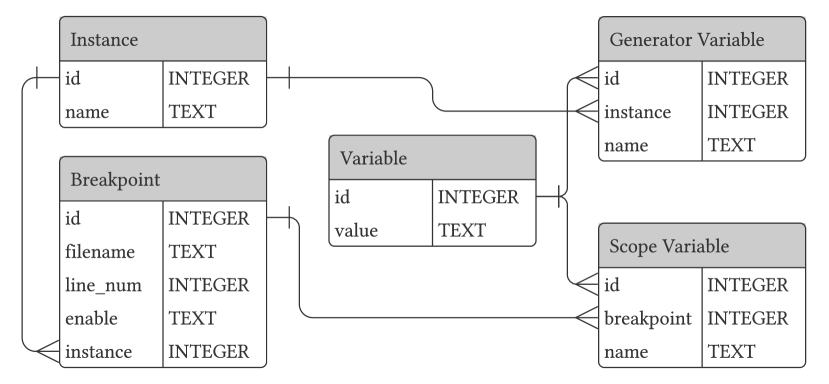
[hgdb schema diagram]hgdn schema diagram
3.5. Debugger Environment
The debugger is one of the most important parts of the debugging experience. hgdb offers two debuggers. One is a GNU Debugger (gdb)-inspired debugger, and the other is more akin to an IDE, implemented as a Visual Studio Code (VSCode) extension. Users can directly view source code and set breakpoints in the IDE, and issue debugging commands. In order to support different debuggers, hgdb relies on RPC-based debugging protocol similar to gdb remote protocol, where the debugger connects to hgdb via WebSocket. Figure 4 shows the hgdb IDE, where users can write and debug code in the same environment.
[VSCode screenshot]VSCode screenshot
4. Case Study Using Chisel
Chisel is one of the most popular HGFs, and it has consequently been widely used for hardware design (et al., 2012). Its frontend language is embedded in Scala, which gets compiled into an IR called FIRRTL (et al., 2017). Then the design is further optimized and lowered to RTL. In this section, we first illustrate how to extract symbol table information from the IR, and then demonstrate how we can use hgdb to debug RocketChip, a popular RISC-V SoC written in Chisel, and finally we benchmark the performance impact on simulation.
4.1. Extracting Symbol Table from FIRRTL
The FIRRTL IR has three levels, High, Middle, and Low. The High form has high-level constructs, such as port bundle, that must be lowered for synthesis. Designs written in Scala are typically transformed into the High form of FIRRTL, which goes through multiple optimization passes and eventually gets lowered to a much restricted set of primitives such as registers and multiplexers.
Due to the semantic gap between Scala and FIRRTL, Chisel has to perform transforms to lower some high-level constructs into FIRRTL. For instance, a one-liner of map and reduce chained calls in Chisel may result in tens of lines of FIRRTL statements, since FIRRTL, being closer to hardware representation, is not functional. As a result, there are some transformation artifacts in the IR that make it difficult to read. Furthermore, there are many optimization passes employed by default in FIRRTL, such as constant propagation, common sub-expression elimination, and dead code elimination (et al., 2017). Although these optimizations reduce the final netlist gate count, they make the final RTL challenging to debug.
Nevertheless, there is still useful information we can extract from the High form of FIRRTL. For instance, Chisel stores original Scala filenames and line numbers in FIRRTL for variable declaration and assignment, which can be used to compute breakpoints. In addition, the High form of FIRRTL preserves high-level logic such as conditional statements, which allows us to compute the breakpoint’s enable condition.
Since FIRRTL is an IR, we can write passes to extract the debugging information and compute symbol table for hgdb. FIRRTL does not offer symbol tracking natively, so, in order to work with compiler optimization, we adopt a two-pass approach. The first pass operates on the High form where the IR best resembles the source structure, and the second pass operates on the Low form where the IR is close to generated RTL. As shown in Algorithm 1, the first pass annotates variables and statements of interest; the second pass collects these annotations and computes the final mapping and symbol table. Function ComputeSymbolTable employs some heuristics to recover high-level information as much as possible given the FIRRTL information. Since the annotation collection operates on the Low form, if the compiler optimization removes a variable, we will not see it in the Low form. As a result, the generated symbol table will not contain the variable optimized away, a behavior consistent with software compilers. We also need to compute our enable condition in the High form because, once the IR is lowered to Low form, FIRRTL flattens the structure and uses a MUX instead, making the condition extraction more difficult.
In debug mode, similar to gcc’s -O0, the first pass can insert DontTouchAnnotation, which keeps the target IR node away from any compiler optimization. This will bloat the generated RTL and slow down the simulation, since FIRRTL will not perform any optimization; however, it contains all the source information, which can be useful for debugging. We have noticed about 30% increase in the symbol table size when the debug mode is on.
4.2. Debugging RocketChip
To demonstrate the productivity gain of using hgdb versus more traditional debugging techniques, we have reproduced a known bug in the floating point unit (FPU) of the RocketChip, as shown in Listing 3. When the RocketChip simulator uses this code to execute a floating point comparison, the FPU output mismatches with the functional model.
To debug the problem, we first use our IDE to set a tentative breakpoint on the floating point control logic where we need to inspect the circuit state, as shown previously in Figure 4. The breakpoint is set inside the when statement, since this is the condition where floating-point comparison is enabled.
Once the breakpoint hits, we can examine the generator variables. The final output toint seems to be correct but the exception flags are incorrectly set. We then examine the inputs to dcmp. hgdb has the ability to reconstruct structured variables from a list of flattened RTL signals; in this case, the IO ports are represented as a Chisel PortBundle, as one would expect from the source code. With a quick glance, we can see that dcmp.io.signaling is not set properly since it is permanently asserted. It can be easily fixed by correcting dcmp.io.signaling assignment.
Although the bug seems obvious once we know where to look, it can be tricky and tedious if we start from the generated RTL and waveform. Listing 4 shows (partially) the code regarding toint calculation. It is difficult to discern the source for toint since the control flow is flattened by the compiler.
4.3. Performance Benchmark
To demonstrate our system’s minimal performance overhead, we have benchmarked the simulator performance using the benchmark suite shipped with the RocketChip, running on a popular commercial simulator. The benchmark suite runs a set of RISC-V programs and computes their clocks-per-instruction (CPI). We compare simulation speed on various settings:
-
•
baseline (optimized);
-
•
baseline + hgdb (optimized);
-
•
debug (unoptimized build and debug, without hgdb); and
-
•
debug + hgdb (unoptimized build and debug with hdgb).
The hgdb runtime is compiled using gcc with -O3 optimization and we run the benchmark multiple times on an Intel Xeon 4214 CPU.
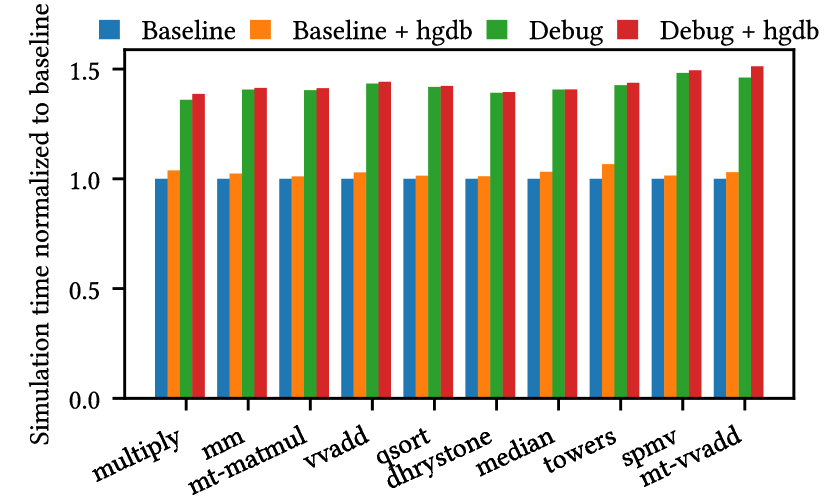
[hgdb benchmark result]
As shown in Figure 5, hgdb introduces less than 5% simulation overhead regardless of whether the design is optimized or not. This is because the only overhead in hgdb is the clock edge callback, which returns immediately. The more complex the design, the more time the simulator spends to compute state updates. Hence the fixed cost of callback per clock cycle is negligible. We observe similar minimal performance overhead on multiple commercial simulators and the open-source Verilator.
5. Conclusions
Debugging designs created by widely used HGFs is difficult, since common source-level debugging techniques, such as symbol mapping and breakpoints, have previously not been available. Our system addresses these issues, enabling hardware generated by HGFs to be debugged at the source level. Since our system does not require the testing environment to be within the generator framework, it works with any existing test bench and any SystemVerilog simulator. While this paper uses Chisel as a case study, the technique can and has been applied to other HGFs. To encourage the conversation on HGFs source-level debugging, we have open-sourced our debugging protocol as well as our implementation on Github.111https://github.com/Kuree/hgdb
References
- (1)
- Beamer and Donofrio (2020) Scott Beamer and David Donofrio. 2020. Efficiently exploiting low activity factors to accelerate RTL simulation. In DAC. ACM/IEEE, USA, 1–6.
- committee (2017) The DWARF committee. 2017. The DWARF Debugging Standard.
- Rosen et al. (1988) Barry K Rosen, Mark N Wegman, and F Kenneth Zadeck. 1988. Global value numbers and redundant computations. In Proceedings of the 15th SIGPLAN-SIGACT symposium on Principles of programming languages. ACM, USA, 12–27.
- Synopsys (2021) Synopsys. 2021. Verdi.
- el.al (2018) S. Jiang el.al. 2018. Mamba: closing the performance gap in productive hardware development frameworks. In DAC. ACM/IEEE, USA, 1–6.
- et al. (2017) A. Izraelevitz et al. 2017. Reusability is FIRRTL ground: Hardware construction languages, compiler frameworks, and transformations. In ICCAD. IEEE, USA, 209–216.
- et al. (1980) David R Ditzel et al. 1980. Retrospective on high-level language computer architecture. In ISCA. ACM, USA, 97–104.
- et al. (2012) J. Bachrach et al. 2012. Chisel: Constructing hardware in a Scala embedded language. In DAC. ACM/IEEE, USA, 1212–1221.
- et al. (2010) Ofer Shacham et al. 2010. Rethinking digital design: Why design must change. IEEE micro 30, 6 (2010), 9–24.
- et al. (2011) Young-Nam Yun et al. 2011. Beyond UVM for practical SoC verification. In International SoC Design Conference. IEEE, USA, 158–162.
- et.al (2014) N. Calagar et.al. 2014. Source-level debugging for FPGA high-level synthesis. In FPL. IEEE, USA, 1–8.
- Truong and Hanrahan (2021) Leonard Truong and Pat Hanrahan. 2021. Magma circuits. https://github.com/phanrahan/magma