Computational Image-based Stroke Assessment for Evaluation of Cerebroprotectants with Longitudinal and Multi-site Preclinical MRI
Abstract
While ischemic stroke is a leading cause of death worldwide, there has been little success translating putative cerebroprotectants from rodent preclinical trials to human patients. We investigated computational image-based assessment tools for practical improvement of the quality, scalability, and outlook for large scale preclinical screening for potential therapeutic interventions in rodent models. We developed, evaluated, and deployed a pipeline for image-based stroke outcome quantification for the Stroke Preclinical Assessment Network (SPAN), a multi-site, multi-arm, multi-stage study evaluating a suite of cerebroprotectant interventions. Our fully automated pipeline combines state-of-the-art algorithmic and data analytic approaches to assess stroke outcomes from multi-parameter MRI data collected longitudinally from a rodent model of middle cerebral artery occlusion (MCAO), including measures of infarct volume, brain atrophy, midline shift, and data quality. We applied our approach to 1,368 scans and report population level results of lesion extent and longitudinal changes from injury. We validated our system by comparison with both manual annotations of coronal MRI slices and tissue sections from the same brain, using crowdsourcing from blinded stroke experts from the network. Our results demonstrate the efficacy and robustness of our image-based stroke assessments. The pipeline may provide a promising resource for ongoing rodent preclinical studies conducted by SPAN and other networks in the future.
Index Terms— stroke, preclinical MRI, quantitative imaging, machine learning, rodents, multi-site, longitudinal
1 Introduction
Many proposed stroke treatments have reached clinical trials with preclinical support from animal models, but few successfully translate to cerebroprotectants in patients. Technical and procedural challenges contribute to the failures of preclinical translation, particularly reliability and reproducibility [1] [2]. We developed a fully automated image analysis pipeline for the Stroke Preclinical Assessment Network (SPAN) [3] to help meet these needs and address critical issues of rigor, transparency, and reproducibility. The network includes six research universities and a coordinating center (CC) who manage enrollment of animals, experimental stroke, and blinded and randomized treatment with several candidate cerebroprotectants. SPAN examines both behavioral and tissue readouts of stroke outcome, and we focus here on the magnetic resonance imaging (MRI) tissue readouts.
Most preclinical stroke studies measure tissue outcomes with triphenyltetrazolium chloride (TTC) stained brain sections [4], which has several weaknesses: morphometric changes with tissue handling, variation in preparation and staining intensity across labs, availability at only a single time point, limited options for subsequent tissue analysis, and high inter-rater variability [5]. MRI instead enables: (i) a direct translational path to human diagnostics with multiple biological and clinical readouts, (ii) repeated longitudinal scans and standardization across sites, and (iii) preserved brain morphology. Numerous algorithms have been proposed for MRI-based stroke imaging [6, 7, 8], demonstrating feasibility of MRI in preclinical stroke studies.
We build on this work to develop a fully automated pipeline for image-based stroke assessment for SPAN to provide robust processing and continuous reporting of data from multiple time points after injury at multiple imaging centers. We focus on three distinguishing contributions: first, providing a robust end-to-end solution including measures of lesion volume, brain atrophy, ventricular volume, midline shift, and data quality; second, robust handling of multi-site longitudinal data; third, a dataset larger than any previous preclinical stroke MRI study (N = 1,368). We validated our approach with blinded and randomized human labeling of TTC tissue staining and human labeling of MRI sections.
2 Methods
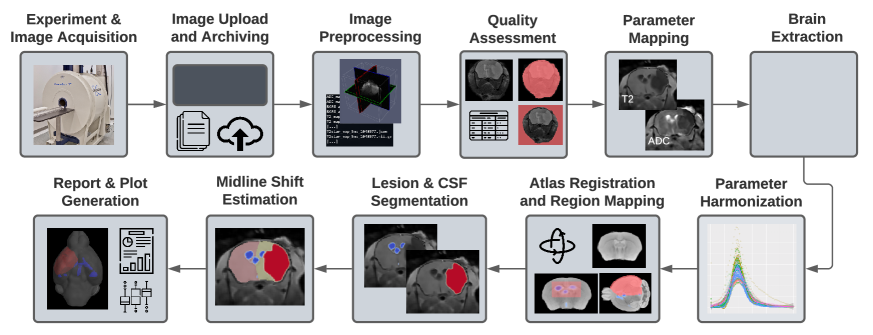
Our image analysis software pipeline (Fig. 1) was implemented with the Quantitative Imaging Toolkit (QIT) [9], Advanced Normalization Tools (ANTs) [10], and R 4.1.0 for plotting and statistical analysis. The pipeline includes image acquisition, preprocessing, quality assessment, harmonization, brain and lesion segmentation, midline shift quantification, and analytic reporting, described as follows.
Imaging protocol and data collection: Data were collected from a mouse model with experimental middle cerebral artery occlusion (MCAO) at day 2 and day 30 after injury. With ethics board approval, imaging was performed across six imaging centers on Bruker scanners (field strengths including 7T, 9.4T, 11.7T); one site used a surface coil and others used a volume coil. The multi-parameter imaging protocol included multi-echo T2, and diffusion-weighted MRI (DWI) collected at 150 m2 coronal in-plane resolution and 500 m slice thickness. All sites used three b-values for DWI (0, 500, 1000 s/mm2) and the T2 protocol used either three echoes (15, 30, 45 ms) or ten echoes (equally spaced from 10 to 100 ms). 100 mice were scanned in an initial pilot phase of SPAN, the first stage proceeded to acquire MRI data from 780 animals with a total of 1,368 scanning session, accounting for mortality after injury. All data were routinely uploaded by each site in the DICOM format to the LONI Image Database Archive for long term storage and analytics.
Pre-processing and quality assessment: Data preprocessing included parsing DICOM tags, sorting by imaging parameters, fixing image coordinates, converting using dcm2nii, and finally producing a set of matching NIfTI files for each case. We applied adaptive non-local means denoising with voxelwise noise estimation, and uniform tricubic resampling at 150 m isotropic resolution. We performed image quality assessment by segmenting foreground and background using Otsu thresholding and computing the signal-to-noise ratio, contrast-to-noise ratio, and signal variance-to-noise ratio. We then performed relaxometry to derive quantitative parameter maps, which included a signal baseline and rate of decay (T2, ADC) for the multi-echo T2 and DWI scans (Figs. 2.A1,2.A2) For simplicity of presentation, we report all T2 values as the inverse relaxation rate (R2).
Brain segmentation and spatial normalization: We performed brain extraction using a deep learning neural network with a U-net architecture (Fig. 2.A3) implemented in PyTorch [11] and similarly to previous work [12] [13]. We bootstrapped our model using a semi-automated conventional brain extraction approach applied to the baseline ADC (least lesion contrast); this process involved edge-preserving smoothing, gradient computation, thresholding, and morphological operations to isolate the brain. We selected training examples from 180 cases and hold-out testing and validation examples from 30 cases; each was split roughly evenly between imaging centers and time points. Our network took all four parameter maps as input (128x128x4 resolution), used a kernel size of 64 and a batch size of 20, with augmentation by translation, rotation, scaling, contrast, and deformation. We trained a single 2D U-net with data from each image plane, and then at inference time, we applied the model to each image slice direction and computed the average prediction. We trained for 10 epochs on an Nvidia 1080 Ti 12GB GPU for two hours and ten minutes. Following this, we performed linear registration of each case to the Mouse BIRN Atlasing Toolkit (MBAT) [14] atlas using the T2 rate parameter map.
Harmonization and lesion segmentation: There were inter-site differences in quantiative MRI parameters (Figs. 2.B1, 2B3), likely due to variety in imaging hardware and physiological factors, so we performed global intensity harmonization of each individual scan (Figs. 2.B2, 2.B4). Using a smoothed histogram of the brain intensity distribution, we identified the peak value (the mode) and scaled the entire image to bring the most likely value to one. We chose the mode because it is less affected by distributional skew due to lesion. We performed lesion segmentation using multiple thresholding of the harmonized parameter maps (Fig. 2.B4). We first defined an initial lesion map by applying an inverted sigmoidal soft threshold of 0.8 to the R2 map and a threshold of 1.5 to the ADC map. We applied a median smoothing filter and a hysteresis threshold to extract a lesion mask, with a strong threshold of 0.55 and a weak threshold of 0.45. We performed morphological opening to refine the mask and reduce spurious voxel labels. We then applied an atlas-defined restriction mask to exclude lesion labels on the contralateral side to injury. We applied a similar procedure to segment cerebrospinal fluid (CSF) with a R2 threshold of 0.75 and ADC threshold of 1.25 (not inverted). Hence, we identified lesion as areas with both dark T2 and ADC, and CSF as areas with dark R2 and bright ADC. We then took the remainder of the brain to be a third segment for “normal appearing tissue”. This thresholding approach was jointly chosen by the network’s imaging team with the strict goal of having an interpretable and understandable lesion definition.
Midline shift quantification: We estimated midline shift metrics including the raw lateral displacement, a normalized shift index, and ratio of hemispheric volumes. We first estimated the anatomical midpoint based on ventricular geometry, using an atlas-defined restriction mask to select voxels from the lateral and third ventricles in a coronal section (seven voxels thick) located roughly at the midpoint of the corpus callosum and computed the average 3D CSF position. We defined a surface splitting the hemispheres based on this estimated midpoint and fit an implicit quadratic surface based on the extreme points. The surface evaluated to produce volumetric masks for each hemisphere (Fig. 2.B4). We computed the absolute midline shift from the difference between the estimated midline and the typical atlas midline. We computed a normalized midline shift index from the ratio of the absolute shift over the width of the brain, as well as left and right hemisphere volumes and their lateralization index.
Analytic reporting and network feedback: We finally created reports summarizing these outcome measures across the study cohort. This included 3D visualizations (Figs. 2.A.5, 2.A.6) and mosaic plots showing a matrix of coronal sections with segmentation masks superimposed. We also created data tables which are shared biweekly with the statistics team. Data was processed at the USC Neuro Imaging Computing Center (NICC) using a 4096 core Sun Grid Engine computing environment.
3 Results and Discussion
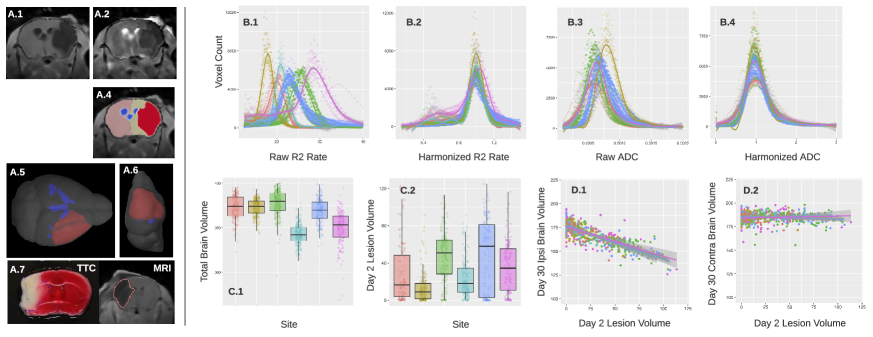
System refinement and testing: Our final brain extraction model had a Dice score of 0.964 on the held-out test dataset. We found that T2 parameters had greater inter-site variability than ADC; however, both modalities required harmonization for fully automated lesion segmentation (Fig. 2.B.2, 2.B.4). We found that several sites had image artifact due to the MCAO catheter and also the imaging hardware; these were sometimes misclassified as lesion, but this could be simply excluded by the atlas lesion restriction mask. We tested a range of lesion and CSF thresholds within 0.05 of our chosen thresholds and found results to be robust to minor changes. We analyzed a total of 1,368 scans, and among these there were 20 cases excluded, including one due to file transfer issues, six due to missing scans, and 13 due to excessive motion. A final count of 1,348 scans passed QC with an analytics completion rate of 98.5%. The average time to process one case was one hour and 48 minutes.
Group-level analysis of lesion extent and longitudinal changes: We computed distributional statistics of total brain volume, lesion volume, midline shift, and atrophy in aggregate and split by site (Figs. 2.C, 2.D). We also computed lesion probability maps for the entire cohort and split by site; these were visualized on sectional anatomy of the atlas and also as 3D surface renderings (Figs. 2.A.5, 2.A.6). We examined longitudinal changes in outcome measures by comparing day 2 lesion volume to day 30 atrophy (both whole brain and split by hemisphere). The results indicate that there exists a small but consistent differences in apparent total brain volume by site (F5,1347 = 264.4, p 10-15), suggesting that per-site corrections should be included in statistical models. We found inter-site variability in lesion volume, but the anatomical location of lesion was consistent across sites. The average lesion volume was 32.26 mm3. With site as a covariate, we found that day 2 volume was highly predictive of hemispheric atrophy on the side ipsilateral to the injury at day 30 (R2 = 0.73, = -0.34, p 10-15; Fig. 2.D.1), while there was no significant effect contralateral to injury at day 30 (R2 = 0.57, = -0.01, p = 0.23; Fig. 2.D.2). This supports the general understanding that MCAO later leads to localized tissue atrophy, and it supports the notion that the pipeline is able to measure both lesion and lateralized atrophy with high fidelity.
Validation with manual tracing of MRI sections: We performed an initial validation experiment to determine the accuracy of our lesion segmentation. We first selected ten typical day 2 scans, and two SPAN network stroke experts estimated lesion volume from manually delineated coronal sections of the R2 parameter map using ImageJ. All ten cases were analyzed by both raters, and they were blinded to the results of our pipeline. The same ten cases were subsequently processed with our pipeline without manual intervention to obtain the lesion volume for comparison in each case. We compared the human raters and the automated approach by computing descriptive statistics, the root-mean-square error (RMSE), and Pearson’s correlation coefficient. We found the average lesion volume from manual raters was 11.56 mL and from the automated approach was 11.38 mL. The RMSE error between the two human raters was 2.22 mL, and the RMSE error between the humans and automated approach was 2.99 mL. The correlation between the human raters was 0.969 and that between the humans and automated approach was 0.957. The results indicate that the automated approach recovered similar lesion estimates as human raters, and difference in performance was practically the same as between humans.
Validation with manual tracing of TTC stained sections: We performed a validation experiment to address whether the MRI-derived lesion metrics reflect tissue-level changes as observed using the standard approach of TTC stained sections (Fig. 2.A7). For this, 37 mice were randomly selected, treated with MCAO, and imaged at day 2. But unlike others enrolled in the study, these cases were sacrificed immediately after imaging and their brains were subsequently sectioned in 2 mm thick slices, stained with TTC, photographed on slides (front and back), and the images were shared with the imaging team. The cases were split among the sites to ensure the TTC stains were representative of the variation in the greater stroke field. This resulted in a total of 746 individual images, and we chose a total of six annotators (one from each site) to provide at least two annotation for each image. Due the scale and logistics of the task, we built an online web-based annotation system based on LabelMe [15] to support remote annotations. We modified LabelMe to use a restricted set of drawing operations, to anonymize the images and raters, to enable deployment across multiple isolated servers for each rater, and to provide instructions to label the brain, lesion, and any other relevant features. Once collected, we computed the lesion volume fraction from the ratio of the total lesion area over the total brain surface area. The MRI data from these 37 were processed like the other cases without manual intervention, and the lesion volume fraction was computed similarly. We estimated the reliability among human-TTC raters using the coefficient of variation (CoV = / ) and measured Pearson’s correlation coefficient between the human-TCC and automated-MRI lesion volume fractions. We found human-TTC raters to be highly reliable in delineating the brain (CoV = 2.50%); however, lesion segmentations had greater variability (CoV = 18.5%). Given this, we also selected a subgroup of “high-reliability” TTC cases (N= 24 cases with CoV 5%). The overall Pearson correlation between the automated-MRI volume fraction and the human-TTC in all cases was 0.743, and in the “high-reliability” cases, the correlation was 0.865. The results generally indicate the substantial agreement between lesion quantification gathered from both TTC tissue and automated MRI analysis. TTC staining is considered the gold-standard technique for stroke preclinical imaging, but even so, inter-rater variability in several cases demonstrated potential limitations as well. One explanatory factor may be temporal effects, as the experiment requires some time to elapse between MR imaging and tissue staining.
Conclusions: We developed, evaluated, and deployed a pipeline for image-based stroke outcome quantification for SPAN that combines state-of-the-art data analytic approaches to assess stroke outcomes from preclinical multi-parameter MRI data collected longitudinally from a rodent model of middle cerebral artery occlusion (MCAO), including measures of lesion extent, brain atrophy, midline shift, and data quality. We applied our approach with the largest preclinical cohort of mice to date and rigorously evaluated the validity of our approach with expert manual annotations of MRI and TTC-stained sections from the same specimens, with the results suggesting the efficacy and robustness of the pipeline. Open challenges include increasing the imaging resolution, inclusion of additional modalities for detecting hemorrhage and water content, and combined analysis with behavioral readouts. Our pipeline may provide a resource for ongoing preclinical studies conducted by SPAN and others in the future, and our software may be found online [16].
Acknowledgements: Supported by National Institutes of Health (NIH) grant NS U24 NS113452 from the National Institute of Neurological Disorders and Stroke (NINDS) (PI: Author PL). RPC Supported by the CZI Imaging Scientist Award Program number 2020-225670 from the Chan Zuckerberg Initiative DAF, an advised fund of Silicon Valley Community Foundation (PI: Author RPC).
References
- [1] Francesca Bosetti, James I Koenig, Cenk Ayata, Stephen A Back, Kyra Becker, Joseph P Broderick, S Thomas Carmichael, Sunghee Cho, Marilyn J Cipolla, Dale Corbett, et al., “Translational stroke research: vision and opportunities,” Stroke, vol. 48, no. 9, pp. 2632–2637, 2017.
- [2] Ryan P Cabeen, Riikka Immonen, Neil G Harris, Olli Gröhn, Gregory Smith, Eppu Manninen, Rachael Garner, Dominique Duncan, Asla Pitkänen, and Arthur W Toga, “A computational diffusion MRI framework for biomarker discovery in a rodent model of post-traumatic epileptogenesis,” in 2020 IEEE 17th International Symposium on Biomedical Imaging (ISBI). IEEE, 2020, pp. 1013–1017.
- [3] Patrick D Lyden, Francesca Bosetti, Márcio A Diniz, André Rogatko, James I Koenig, Jessica Lamb, Karisma A Nagarkatti, Ryan P Cabeen, David C Hess, Pradip K Kamat, et al., “The Stroke Preclinical Assessment Network: Rationale, Design, Feasibility, and Stage 1 Results,” Stroke, vol. 53, no. 5, pp. 1802–1812, 2022.
- [4] D J Cole, J C Drummond, E A Ghazal, and H M Shapiro, “A reversible component of cerebral injury as identified by the histochemical stain 2,3,5-triphenyltetrazolium chloride (TTC),” Acta neuropathologica, vol. 80, no. 2, pp. 152–155, 1990.
- [5] Felix Friedländer, Ferdinand Bohmann, Max Brunkhorst, Ju-Hee Chae, Kavi Devraj, Yvette Köhler, Peter Kraft, Hannah Kuhn, Alexandra Lucaciu, Sebastian Luger, Waltraud Pfeilschifter, Rebecca Sadler, Arthur Liesz, Karolina Scholtyschik, Leonie Stolz, Rajkumar Vutukuri, and Robert Brunkhorst, “Reliability of infarct volumetry: Its relevance and the improvement by a software-assisted approach,” Journal of cerebral blood flow and metabolism: official journal of the International Society of Cerebral Blood Flow and Metabolism, vol. 37, no. 8, pp. 3015–3026, Aug. 2017.
- [6] Herng-Hua Chang, Shin-Joe Yeh, Ming-Chang Chiang, and Sung-Tsang Hsieh, “Automatic brain extraction and hemisphere segmentation in rat brain MR images after stroke using deformable models,” Medical physics, Aug. 2021.
- [7] Juan Miguel Valverde, Artem Shatillo, Riccardo De Feo, Olli Gröhn, Alejandra Sierra, and Jussi Tohka, “Automatic Rodent Brain MRI Lesion Segmentation with Fully Convolutional Networks,” in Machine Learning in Medical Imaging. 2019, pp. 195–202, Springer International Publishing.
- [8] Herng-Hua Chang, Shin-Joe Yeh, Ming-Chang Chiang, and Sung-Tsang Hsieh, “Infarct region segmentation in rat brain T2 MR images after stroke based on fully convolutional networks,” in Medical Imaging. Feb. 2020, vol. 11317, p. 113172G, International Society for Optics and Photonics.
- [9] Ryan P Cabeen, David H Laidlaw, and Arthur W Toga, “Quantitative imaging toolkit: software for interactive 3d visualization, data exploration, and computational analysis of neuroimaging datasets,” ISMRM-ESMRMB Abstracts, pp. 12–14, 2018.
- [10] Brian B Avants, Nick Tustison, Gang Song, et al., “Advanced normalization tools (ants),” Insight j, vol. 2, no. 365, pp. 1–35, 2009.
- [11] Olaf Ronneberger, Philipp Fischer, and Thomas Brox, “U-net: Convolutional networks for biomedical image segmentation,” in International Conference on Medical image computing and computer-assisted intervention. Springer, 2015, pp. 234–241.
- [12] Li-Ming Hsu, Shuai Wang, Paridhi Ranadive, Woomi Ban, Tzu-Hao Harry Chao, Sheng Song, Domenic Hayden Cerri, Lindsay R Walton, Margaret A Broadwater, Sung-Ho Lee, Dinggang Shen, and Yen-Yu Ian Shih, “Automatic Skull Stripping of Rat and Mouse Brain MRI Data Using U-Net,” Frontiers in neuroscience, vol. 14, pp. 568614, Oct. 2020.
- [13] Riccardo De Feo, Artem Shatillo, Alejandra Sierra, Juan Miguel Valverde, Olli Gröhn, Federico Giove, and Jussi Tohka, “Automated joint skull-stripping and segmentation with Multi-Task U-Net in large mouse brain MRI databases,” NeuroImage, vol. 229, pp. 117734, Apr. 2021.
- [14] Allan J MacKenzie-Graham, Erh-Fang Lee, Ivo D Dinov, Heng Yuan, Russell E Jacobs, and Arthur W Toga, “Multimodal, multidimensional models of mouse brain,” Epilepsia, vol. 48, pp. 75–81, 2007.
- [15] Bryan C Russell, Antonio Torralba, Kevin P Murphy, and William T Freeman, “Labelme: a database and web-based tool for image annotation,” International journal of computer vision, vol. 77, no. 1, pp. 157–173, 2008.
- [16] “SPAN-MRI Code Repository,” https://github.com/cabeen/span-mri.