The Lick Observatory Supernova Search follow-up program: photometry data release of 70 stripped-envelope supernovae
Abstract
We present and unfiltered (Clear) light curves of 70 stripped-envelope supernovae (SESNe), observed between 2003 and 2020, from the Lick Observatory Supernova Search (LOSS) follow-up program. Our SESN sample consists of 19 spectroscopically normal SNe Ib, two peculiar SNe Ib, six SNe Ibn, 14 normal SNe Ic, one peculiar SN Ic, ten SNe Ic-BL, 15 SNe IIb, one ambiguous SN IIb/Ib/c, and two superluminous SNe. Our follow-up photometry has (on a per-SN basis) a mean coverage of 81 photometric points (median of 58 points) and a mean cadence of 3.6 d (median of 1.2 d). From our full sample, a subset of 38 SNe have pre-maximum coverage in at least one passband, allowing for the peak brightness of each SN in this subset to be quantitatively determined. We describe our data collection and processing techniques, with emphasis toward our automated photometry pipeline, from which we derive publicly available data products to enable and encourage further study by the community. Using these data products, we derive host-galaxy extinction values through the empirical colour evolution relationship and, for the first time, produce accurate rise-time measurements for a large sample of SESNe in both optical and infrared passbands. By modeling multiband light curves, we find that SNe Ic tend to have lower ejecta masses and lower ejecta velocities than SNe Ib and IIb, but higher 56Ni masses.
keywords:
galaxies: distances and redshifts – supernovae: general1 Introduction
It is well established that massive stars (i.e., those having M☉) have short lives that end in catastrophic explosions known as core-collapse supernovae (CCSNe). Among CCSNe, those whose spectra show features of hydrogen are classified as Type II SNe (see, e.g., Filippenko 1997; Gal-Yam 2017 for reviews of SN classification). In contrast, hydrogen-poor CCSNe are classified as Type Ib or Ic, depending on whether their optical spectra contain obvious helium features (Matheson, 2001). The progenitor stars of hydrogen-poor CCSNe have their outer envelopes stripped away before explosion by strong winds during the Wolf-Rayet phase (e.g., Conti, 1975; Smith & Owocki, 2006; Gal-Yam et al., 2014), By interaction with a binary companion (e.g., Podsiadlowski et al., 1992; Sana et al., 2012; Eldridge et al., 2013), or some combination of these two modes. If the envelope-stripping process is highly efficient, the helium shell is also removed before explosion, leading to the differentiation between SNe Ib (He-rich) and SNe Ic (He-poor). Hydrogen-poor CCSNe are generally referred to as stripped-envelope supernovae (SESNe).
SESNe are found to be observationally heterogeneous. For example, in some cases, the stripping process is incomplete and thus the envelope is left with some fraction of hydrogen. These SNe typically show H lines at early times that rapidly disappear after maximum light (Filippenko, 1988; Filippenko et al., 1993), and their spectra resemble SNe Ib at late times. A small subset of SN Ib-like events show evidence of interaction with dense circumstellar material (CSM); having relatively narrow spectral emission lines (e.g., Pastorello et al., 2007; Foley et al., 2007; Hosseinzadeh et al., 2017), these objects have been dubbed SNe Ibn (“n” for “narrow lines”). In addition, a subset of SNe Ic characterised by the presence broad spectral lines which indicate extremely high ejecta velocities ( km s-1) are designated as SNe Ic-BL (e.g., Modjaz et al., 2014). Objects within this subclass have been found to be associated with long-duration gamma-ray bursts (e.g., Woosley & Bloom, 2006). Recently, a new class, SNe Icn, has been proposed by Gal-Yam et al. (2021) based on the prototype SN 2019hgp, followed by SNe 2021csp (Perley et al., 2021; Fraser et al., 2021) and 2021ckj (Pastorello et al., 2021). The early-time spectra of these objects are dominated by narrow lines with profiles similar to those seen in SNe Ibn, but originating from carbon and oxygen rather than He. In any case, all of the aforementioned SN classifications (Ib, IIb, Ibn, Ic, Ic-BL, and Icn) are, to some extent, related to the envelope of their progenitor star being stripped. Accordingly, we consider all of them to be SESNe in the analysis presented herein.
Owing to the efforts of various SN surveys spanning the globe, the study of SESNe with large light-curve samples has proliferated. Li et al. (2011) presented a set of roughly two dozen unfiltered SESN light curves within Mpc. In the same year, Drout et al. (2011) presented - and -band light curves of 25 SESNe from the Palomar 60 inch telescope. Bianco et al. (2014) published multiband light curves of 64 SESNe obtained by the Harvard-Smithsonian Center for Astrophysics (CfA) SN group, and Taddia et al. (2015) presented expanded sets of multiband light curves of 20 SESNe from the Sloan Digital Sky Survey (SDSS) SN Survey II. In addition, Stritzinger et al. (2018a) published 34 SESN light curves from the first phase of the Carnegie Supernova Project (CSP-I). Despite these impressive efforts, the state of large-scale photometric studies of SESNe substantially lags that of other SNe (e.g., SNe Ia, which are routinely studied photometrically at the hundreds-of-objects scale).
Over the past two decades, our Lick Observatory Supernova Search (LOSS; Filippenko et al. 2001) program has invested considerably in both discovering and monitoring all kinds of SNe, including SESNe. Large light-curve samples have already been published by Ganeshalingam et al. (2010) and Stahl et al. (2019) for SNe Ia, and by de Jaeger et al. (2019) for SNe II. In this paper, we release the light curves of 70 SESNe observed by LOSS since 2003. In the remainder of the paper, we describe the sample (Sec. 2) and our data-reduction strategies (Sec. 3) before presenting an analysis of the light curves (Sec. 4) and offering our conclusions (Sec. 5).
2 Data Sample
The Berkeley SESN sample consists of 70 objects observed between 2003 and 2020. Two main telescopes were used for follow-up observations: (i) the fully robotic 0.76 m Katzman Automatic Imaging Telescope (KAIT; Filippenko et al. 2001), and (ii) the 1 m Anna Nickel telescope, both located at Lick Observatory on Mount Hamilton, near San Jose, CA, USA. Most SESNe in our sample were observed in multiple optical passbands (, , , ), and some have additional Clear-band (unfiltered) data.111A small fraction are covered with only Clear-band observations. For a large fraction of SESNe in our sample, spectra were also obtained by our group using multiple facilities. A detailed analysis and release of the LOSS spectra of SESNe was published by Shivvers et al. (2019), so the present paper focuses exclusively on our photometric observations.
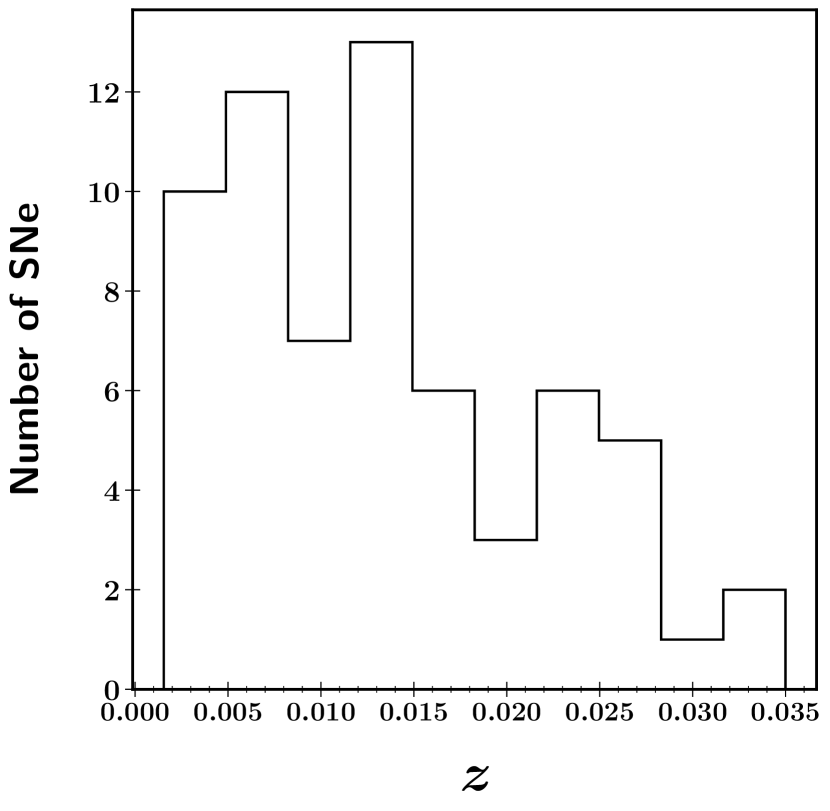
Table 1 provides the basic information for each SN in our sample, including its spectroscopic classification, host-galaxy name, distance, recession velocity, and Galactic extinction (Schlafly & Finkbeiner, 2011). The listed classifications are adopted from the Transient Name Server222www.wis-tns.org (TNS), but where they conflict with those given by Shivvers et al. (2019), we adopt the latter owing to the more sophisticated and systematic approach that resulted in their determinations. The single exception to this paradigm is SN 2008fz, which was classified as an SN Ic by Shivvers et al. (2019) but for which we adopt the classification of superluminous SN IIn (i.e., SLSN-IIn) from Drake et al. (2010). In summary, our SESN sample consists of 19 spectroscopically normal SNe Ib, two peculiar SNe Ib, six SNe Ibn, 14 normal SNe Ic, one peculiar SN Ic, ten SNe Ic-BL, 15 SNe IIb, one ambiguous SN IIb/Ib/c, and two SLSNe.
The host-galaxy distances reported in Table 1 were obtained from the NASA/IPAC Extragalactic Database of redshift-independent distances (NED-D333http://ned.ipac.caltech.edu/Library/Distances/) when available, and otherwise calculated using a standard cosmological model with H0 = 70 km s-1 Mpc-1, , and . Figure 1 shows the redshift distribution of the 65 SESNe in our sample which have reliable host-galaxy heliocentric velocity measurements. The redshifts range from 0.0015 (SN 2011dh) to 0.0350 (SN 2009er), with an average value of 0.0136 and a standard deviation of 0.0082. 40 SESNe have . For the remaining five SESNe without host heliocentric velocity measurements, we adopt redshifts from various literature sources (see the footnote of Table 1 for more details).
3 Data Reduction
All photometric data published herein were obtained with the Lick KAIT and 1 m Nickel telescopes. Over the past two decades, the KAIT CCD and filter have been updated several times, resulting in four different CCD/filter combinations, which we refer as KAIT1-4 (see Ganeshalingam et al. 2010; Stahl et al. 2019 for more details). In its current configuration (KAIT4), KAIT is equipped with a Finger Lakes Instrument camera with pixels covering a field of view. The 1 m Nickel is a human-operated telescope, but it can be remotely operated from the UC Berkeley campus. It is equipped with a thinned, Loral, pixel CCD (binned by a factor of two along both axes to reduce the readout time), and has a field of view. The filter set on the Nickel telescope was updated once, in March 2009; we refer to the configuration before and after this change as Nickel1 and Nickel2, respectively (again, see Ganeshalingam et al. 2010; Stahl et al. 2019 for more details).
A novel automated photometry pipeline444https://github.com/benstahl92/LOSSPhotPypeline was developed by Stahl et al. (2019) to process the significant volume of SN observations produced by LOSS consistently and accurately, while at the same time requiring minimal human intervention. Although we defer the details to Stahl et al. (2019), we briefly summarise the main procedures here. All images are first treated to remove the bias level, and are then flat-fielded before being astrometrically calibrated using code provided by astrometry.net555https://astrometry.net (Lang et al., 2010). Where necessary, image subtraction is applied so as to remove host-galaxy contamination, with the template images being sourced on dark nights using the Nickel telescope after the SNe have faded beyond detection (generally months after discovery). Point-spread-function (PSF) photometry is obtained using DAOPHOT (Stetson, 1987) from the IDL Astronomy User’s Library666http://idlastro.gsfc.nasa.gov/. Nearby stars are chosen from the Pan-STARRS1777http://archive.stsci.edu/panstarrs/search.php catalogue for calibration. Their magnitudes are first transformed into the Landolt system (Landolt, 1983, 1992) using the empirical prescription (Eq. 6) presented by Tonry et al. (2012), and then transformed to the appropriate KAIT/Nickel natural system (i.e., KAIT1-4 or Nickel1-2 as appropriate based on the equipment configuration on the date of observation). All apparent magnitudes are measured in the natural system, and the final results are then transformed to the standard system (see Eqs. 1a–1d of Stahl et al. 2019) using local calibrators and the appropriate colour terms as given by Ganeshalingam et al. (2010) and Stahl et al. (2019). Note that when transforming from the natural system back to the standard system, there are additional errors associated with the transformation that are not accounted for owing to differences between the spectral energy distributions of SNe and the reference stars (e.g., Stritzinger et al., 2005).
| SN | Type | RA (h,m,s) | Dec.( | Discovery Date | Host galaxy | Distance | Error | (host) | Error | Subtraction2? | |
|---|---|---|---|---|---|---|---|---|---|---|---|
| (J2000) | (J2000) | (UT) | (MW) | (Mpc) | (Mpc) | (km s-1) | (km s-1) | ||||
| 2003gk | Ib | 23:01:42.989 | +02:16:08.69 | 2003-07-01 | NGC7460 | 0.24 | 48.2 | 28.0 | 3,192 | 7 | Y |
| 2006el | IIb | 22:47:38.50 | +39:52:27.59 | 2006-08-25 | UGC 12188 | 0.31 | — | — | 5,115 | 14 | Y |
| 2006ep | Ib | 00:41:24.88 | +25:29:46.72 | 2006-08-30 | NGC 214 | 0.10 | 51.1 | 12.3 | 4,537 | 4 | N |
| 2006jc | Ibn | 09:17:20.78 | +41:54:32.69 | 2006-10-09 | UGC 4904 | 0.06 | — | — | 1,670 | 4 | Y |
| 2006lc | Ibn | 22:44:24.45 | 00:09:53.89 | 2006-10-21 | NGC 7364 | 0.18 | 70.6 | 22.1 | 4,865 | 5 | Y |
| 2007C | Ib | 13:08:49.30 | 06:47:01.00 | 2007-01-07 | NGC 4981 | 0.12 | 22.7 | 3.1 | 1,680 | 4 | Y |
| 2007D | Ic-BL | 03:18:38.71 | +37:36:26.39 | 2007-01-09 | UGC 2653 | 0.92 | 103.8 | 5.6 | 6,939 | 5 | Y |
| 2007ag | Ib | 10:01:35.99 | +21:36:42.01 | 2007-03-07 | UGC 5392 | 0.08 | 114.8 | 1.7 | 6,209 | 4 | Y |
| 2007cl | Ic | 17:48:21.19 | +54:09:05.18 | 2007-05-23 | NGC 6479 | 0.12 | — | — | 6,650 | 43 | Y |
| 2007kj | Ib | 00:01:19.58 | +13:06:30.60 | 2007-10-02 | NGC 7803 | 0.22 | — | — | 5,366 | 6 | Y |
| 2007ru | Ic-BL | 23:07:23.14 | +43:35:33.68 | 2007-11-27 | UGC 12381 | 0.71 | — | — | 4,636 | 6 | N |
| 2007rw | IIb | 12:38:03.64 | 02:15:40.10 | 2007-11-29 | UGC 7798 | 0.09 | — | — | 2,568 | 5 | Y |
| 2007rz | Ic | 04:31:10.84 | +07:37:51.49 | 2007-12-08 | NGC 1590 | 0.55 | — | — | 3,897 | 7 | Y |
| 2007uy | Ib-pec | 09:09:35.35 | +33:07:08.90 | 2007-12-31 | NGC 2770 | 0.06 | 28.7 | 4.2 | 1,947 | 2 | Y |
| 2008aq | IIb | 12:50:30.42 | 10:52:01.42 | 2008-02-27 | MCG -02-33-20 | 0.12 | 32.0 | 3.0 | 2,390 | 5 | N |
| 2008cw | IIb | 16:32:38.27 | +41:27:33.19 | 2008-06-01 | SDSS J163238.15+412730.8 | 0.02 | — | — | 9,726 | 25 | Y |
| 2008dq | Ic | 16:06:03.11 | +55:25:37.42 | 2008-06-25 | UGC 10214 | 0.03 | — | — | 9,401 | 15 | Y |
| 2008eb | Ib | 18:11:52.17 | +14:58:50.59 | 2008-07-07 | NGC 6574 | 0.48 | 33.7 | 7.2 | 2,282 | 5 | Y |
| 2008ew | Ic | 16:58:28.92 | +20:02:38.00 | 2008-08-10 | IC 1236 | 0.22 | 38.0 | — | 6,030 | 5 | Y |
| 2008fi | IIb | 01:53:23.17 | +29:21:28.40 | 2008-08-26 | SDSS J015322.95+292131.2 | 0.17 | — | — | — | — | N |
| 2008fz | SLSN-IIn | 23:16:16.60 | +11:42:47.48 | 2008-09-22 | Anon. | 0.12 | — | — | — | — | N |
| 2008gj | Ic | 22:36:28.57 | +21:37:55.31 | 2008-10-19 | NGC 7321 | 0.13 | 92.0 | 10.9 | 7,145 | 5 | Y |
| 2009C | IIb | 23:13:42.84 | +49:40:47.21 | 2009-01-02 | UGC 12433 | 0.79 | — | — | 6,985 | 32 | Y |
| 2009K | IIb | 04:36:36.77 | 00:08:35.59 | 2009-01-14 | NGC 1620 | 0.16 | 40.2 | 4.7 | 3,512 | 1 | Y |
| 2009Z | IIb | 14:01:53.61 | 01:20:30.19 | 2009-02-02 | SDSS J140153.80-012035.5 | 0.13 | — | — | 7,534 | 3 | N |
| 2009er | Ib-pec | 15:39:29.84 | +24:26:05.32 | 2009-05-22 | SDSS J153930.49+242614.8 | 0.12 | — | — | 10,492 | 67 | N |
| 2009gk | IIb | 21:44:27.28 | +14:53:57.30 | 2009-06-23 | UGC 11803 | 0.24 | — | — | 7,946 | 34 | Y |
| 2009hy | Ic | 22:16:27.02 | +16:28:13.01 | 2009-08-02 | NGC 7244 | 0.14 | — | — | 7,564 | 7 | Y |
| 2009jf | Ib | 23:04:52.98 | +12:19:59.48 | 2009-09-27 | NGC 7479 | 0.31 | 28.3 | 6.1 | 2,381 | 1 | Y |
| 2010cn | IIb | 11:04:06.57 | +04:49:58.69 | 2010-05-04 | SDSS J110406.40+044955.5 | 0.13 | — | — | 7,795 | — | Y |
| 2010gd | Ic | 17:57:40.98 | +27:49:48.11 | 2010-07-08 | UGC 11064 | 0.16 | 107.1 | 21.6 | 7,043 | 10 | Y |
| 2010hy | SLSN-I | 18:59:32.89 | +19:24:25.88 | 2010-09-04 | Anon. | 1.45 | — | — | — | — | N |
| 2011dh | IIb | 13:30:05.12 | +47:10:10.81 | 2011-06-01 | NGC 5194 | 0.10 | 7.2 | 2.1 | 463 | 3 | Y |
| 2011fu | IIb | 02:08:21.41 | +41:29:12.30 | 2011-09-21 | UGC 1626 | 0.21 | — | — | 5,543 | 11 | Y |
| 2011gd | Ib | 16:34:25.67 | +21:32:28.39 | 2011-08-28 | NGC 6186 | 0.13 | — | — | 2,937 | 29 | Y |
| 2012aa | Ic | 14:52:33.48 | 03:31:54.01 | 2012-01-29 | Anon. | 0.28 | — | — | — | — | Y |
| 2012ap | Ic-BL | 05:00:13.72 | 03:20:51.22 | 2012-02-10 | NGC 1729 | 0.14 | 39.3 | 3.3 | 3,632 | 4 | N |
| 2012au | Ib | 12:54:52.18 | 10:14:50.21 | 2012-03-14 | NGC 4790 | 0.13 | 22.9 | 2.8 | 1,344 | 5 | Y |
| 2012fh | IIbIbc | 10:43:34.05 | +24:53:29.00 | 2012-10-18 | NGC 3344 | 0.09 | 11.9 | 6.2 | 580 | 1 | Y |
| 2013dk | Ic | 12:01:52.72 | 18:52:18.30 | 2013-06-22 | NGC 4038 | 0.13 | 21.1 | 3.9 | 1,642 | 12 | Y |
| 2014C | Ib | 22:37:05.60 | +34:24:31.90 | 2014-01-05 | NGC 7331 | 0.25 | 13.4 | 2.7 | 816 | 1 | Y |
| 2014L | Ic | 12:18:48.68 | +14:24:43.49 | 2014-01-26 | NGC 4254 | 0.11 | 15.2 | 2.0 | 2,407 | 3 | Y |
| 2014as | Ic-BL | 14:00:54.49 | +40:58:59.59 | 2014-04-18 | NGC 5410 | 0.04 | — | — | 3,738 | 26 | Y |
| 2014cp | Ic-BL | 02:25:30.46 | 25:37:37.99 | 2014-06-23 | ESO 479- G 001 | 0.05 | 45.1 | 7.2 | 4,846 | 3 | N |
| 2014ds | IIb | 08:11:16.45 | +25:10:47.39 | 2014-10-11 | NGC 2536 | 0.12 | — | — | 4,118 | 17 | Y |
| 2014eh | Ic | 20:25:03.86 | 24:49:13.30 | 2014-11-03 | NGC 6907 | 0.17 | 32.5 | 6.2 | 3,182 | 4 | N |
| 2014ei | Ib | 05:03:16.39 | 02:56:11.00 | 2014-11-05 | MCG -01-13-50 | 0.18 | 57.9 | 3.5 | 4,329 | 4 | Y |
| 2015G | Ibn | 20:37:25.58 | +66:07:11.50 | 2015-03-23 | NGC 6951 | 1.02 | 23.1 | 3.5 | 1,424 | 1 | Y |
| 2015K | Ic | 23:35:52.26 | +23:36:52.09 | 2015-04-25 | NGC 7712 | 0.15 | 49.0 | 3.2 | 3,053 | 2 | N |
| 2015Q | Ib | 11:47:35.081 | +55:58:14.70 | 2015-06-17 | NGC 3888 | 0.03 | 39.9 | 1.7 | 2,408 | 11 | Y |
| 2015U | Ibn | 07:28:53.87 | +33:49:10.60 | 2015-02-13 | NGC 2388 | 0.16 | 60.9 | 2.3 | 4,134 | 5 | Y |
| 2015Y | Ib | 09:02:37.87 | +25:56:04.20 | 2015-04-11 | NGC 2735 | 0.11 | 51.1 | 9.0 | 2,450 | 5 | Y |
| 2015ap | Ib | 02:05:13.32 | +06:06:08.39 | 2015-09-08 | IC1776 | 0.12 | — | — | 3,410 | 5 | Y |
| 2016G | Ic-BL | 03:03:57.74 | +43:24:03.50 | 2016-01-09 | NGC 1171 | 0.43 | 26.6 | 6.2 | 2,742 | 6 | Y |
| 2016P | Ic-BL | 13:57:31.10 | +06:05:51.00 | 2016-01-19 | NGC 5374 | 0.07 | 68.7 | 10.8 | 4,382 | 7 | Y |
| 2016ajo | Ib | 18:44:12.49 | +24:09:29.70 | 2016-02-20 | UGC 11344 | 0.34 | 58.5 | 4.2 | 3,836 | 4 | Y |
| 2016bau | Ib | 11:20:59.02 | +53:10:25.60 | 2016-03-13 | NGC 3631 | 0.04 | 10.3 | 5.4 | 1,156 | 1 | N |
| 2016coi | Ic-BL | 21:59:04.14 | +18:11:10.46 | 2016-05-27 | UGC 11868 | 0.23 | 17.2 | — | 1,093 | 5 | Y |
| 2016gcm | Ic | 21:04:55.22 | +65:42:29.30 | 2016-09-08 | PGC166705 | 1.33 | — | — | 7,263 | 50 | Y |
| 2016gkg | IIb | 01:34:14.46 | 29:26:25.00 | 2016-09-20 | NGC 613 | 0.05 | 20.9 | 5.7 | 1,481 | 5 | N |
| 2016gqv | Ic-pec | 04:02:48.53 | +01:58:15.60 | 2016-09-28 | UGC 02936 | 1.23 | 42.8 | 5.1 | 3,813 | 7 | Y |
| 2016iyc | IIb | 22:09:14.28 | +21:31:17.51 | 2016-12-18 | UGC 11924 | 0.21 | — | — | 3,803 | 5 | Y |
| 2017ein | Ic | 11:52:53.25 | +44:07:26.20 | 2017-05-25 | NGC3938 | 0.06 | 12.7 | 7.8 | 809 | 4 | N |
| 2017iro | Ib | 14:06:23.11 | +50:43:20.20 | 2017-11-30 | NGC 5480 | 0.05 | 24.2 | 6.0 | 1,856 | 5 | Y |
| 2018cow | Ic-BL | 16:16:00.22 | +22:16:04.83 | 2018-06-16 | CGCG 137-068 | 0.24 | — | — | 4,241 | 39 | N |
| 2018ie | Ic-BL | 10:54:01.06 | 16:01:21.40 | 2018-01-18 | NGC 3456 | 0.19 | 47.5 | 8.6 | 4,267 | 7 | N |
| 2019wep | Ibn | 11:04:37.033 | +45:58:38.95 | 2019-12-07 | UGC 06136 | 0.03 | — | — | 7,521 | 11 | N |
| 2020nxt | Ibn | 22:37:36.235 | +35:00:07.68 | 2020-07-03 | SDSS J223736.60+350007.4 | 0.21 | — | — | — | — | Y |
| MOTJ120451.50+265946.6 | Ib | 12:04:51.50 | +26:59:46.60 | 2014-10-28 | NGC 4808 | 0.07 | 18.4 | 2.0 | 567 | 4 | N |
| iPTF13bvn | Ib | 15:00:00.152 | +01:52:53.17 | 2013-06-16 | NGC5806 | 0.14 | 24.7 | 3.2 | 1,359 | 5 | Y |
4 Results
4.1 Photometry data release
We provide our final photometry in Tables 8 (standard system) and 9 (natural system) for all 70 SESNe in our sample. On average, each SN has 81 observations (median of 58) and 22 photometric points (median of 13 points) per filter, at a cadence of 3.6 d (median of 1.2 d). SN 2016coi has the best coverage (434 points), followed by SN 2015ap (351). The total number of distinct photometric observations published in this work is 5682. Of the 70 SNe in our sample, 38 have pre-maximum coverage and thus have their peak brightness measured in at least one band. Note that although several SNe in our sample have had their photometry previously published in individual papers, the magnitudes presented herein supersede these earlier measurements because (i) for some fields requiring image subtraction we have obtained new, higher-quality templates, and (ii) better calibration sources are now available that were not used previously. Moreover, our processing is now significantly more systematic and self-consistent owing to our use of the battle-tested LOSSPhotPypeline (Stahl et al., 2019; de Jaeger et al., 2019; Stahl et al., 2020).
Note that in this release, we do not include the systematic uncertainty of 0.03 mag in that was determined and discussed in detail by Stahl et al. (2019). This amount of systematic uncertainty was estimated by investigating many factors that may contribute to the error, including evolution of colour terms, evolution of atmospheric terms, configurations between different telescopes, and galaxy-subtraction procedures. None of these factors contributed uncertainty over 0.03 mag, consistent with the estimate of Ganeshalingam et al. (2010). Though not included in our photometry tables (Table 8 and 9) or light-curve figures (e.g., Figure 2 and Figure 11), this uncertainty must be accounted for when combining our dataset with others. Alongside the recent LOSS photometry release for SNe Ia (Stahl et al., 2019) and SNe II (de Jaeger et al., 2019), we aim for our SESN photometry to be used and further analysed by the astronomical community.
4.2 Light curves
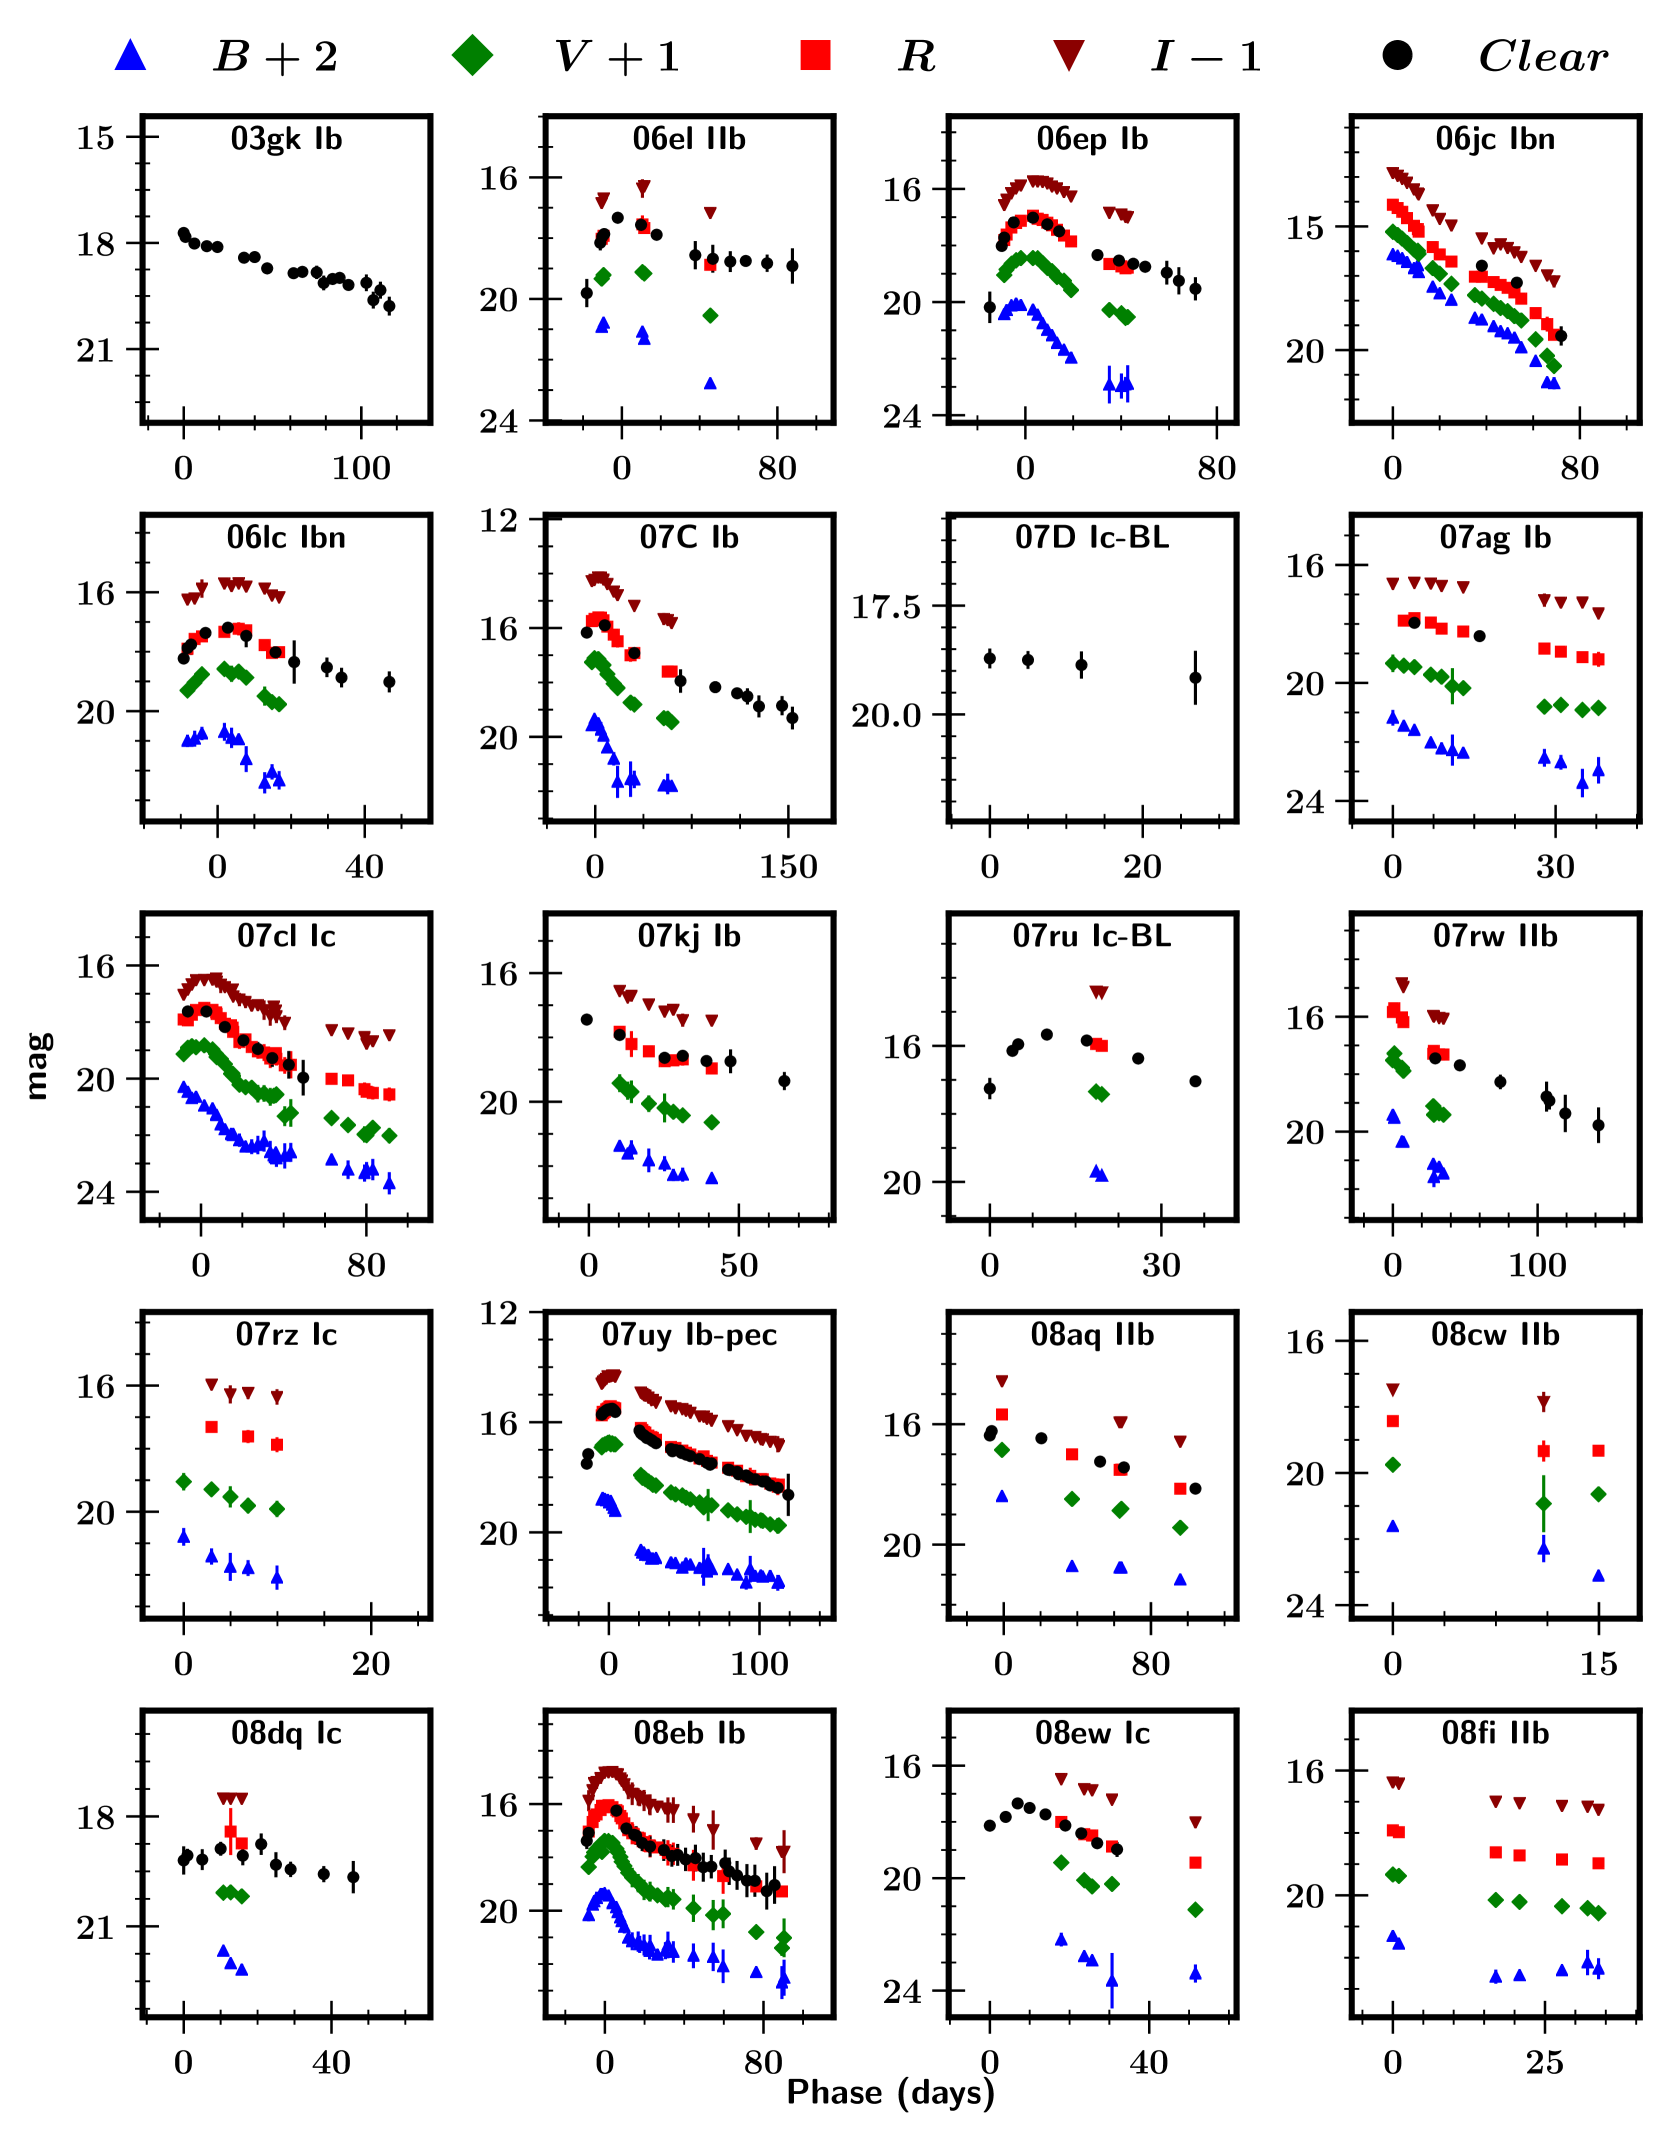
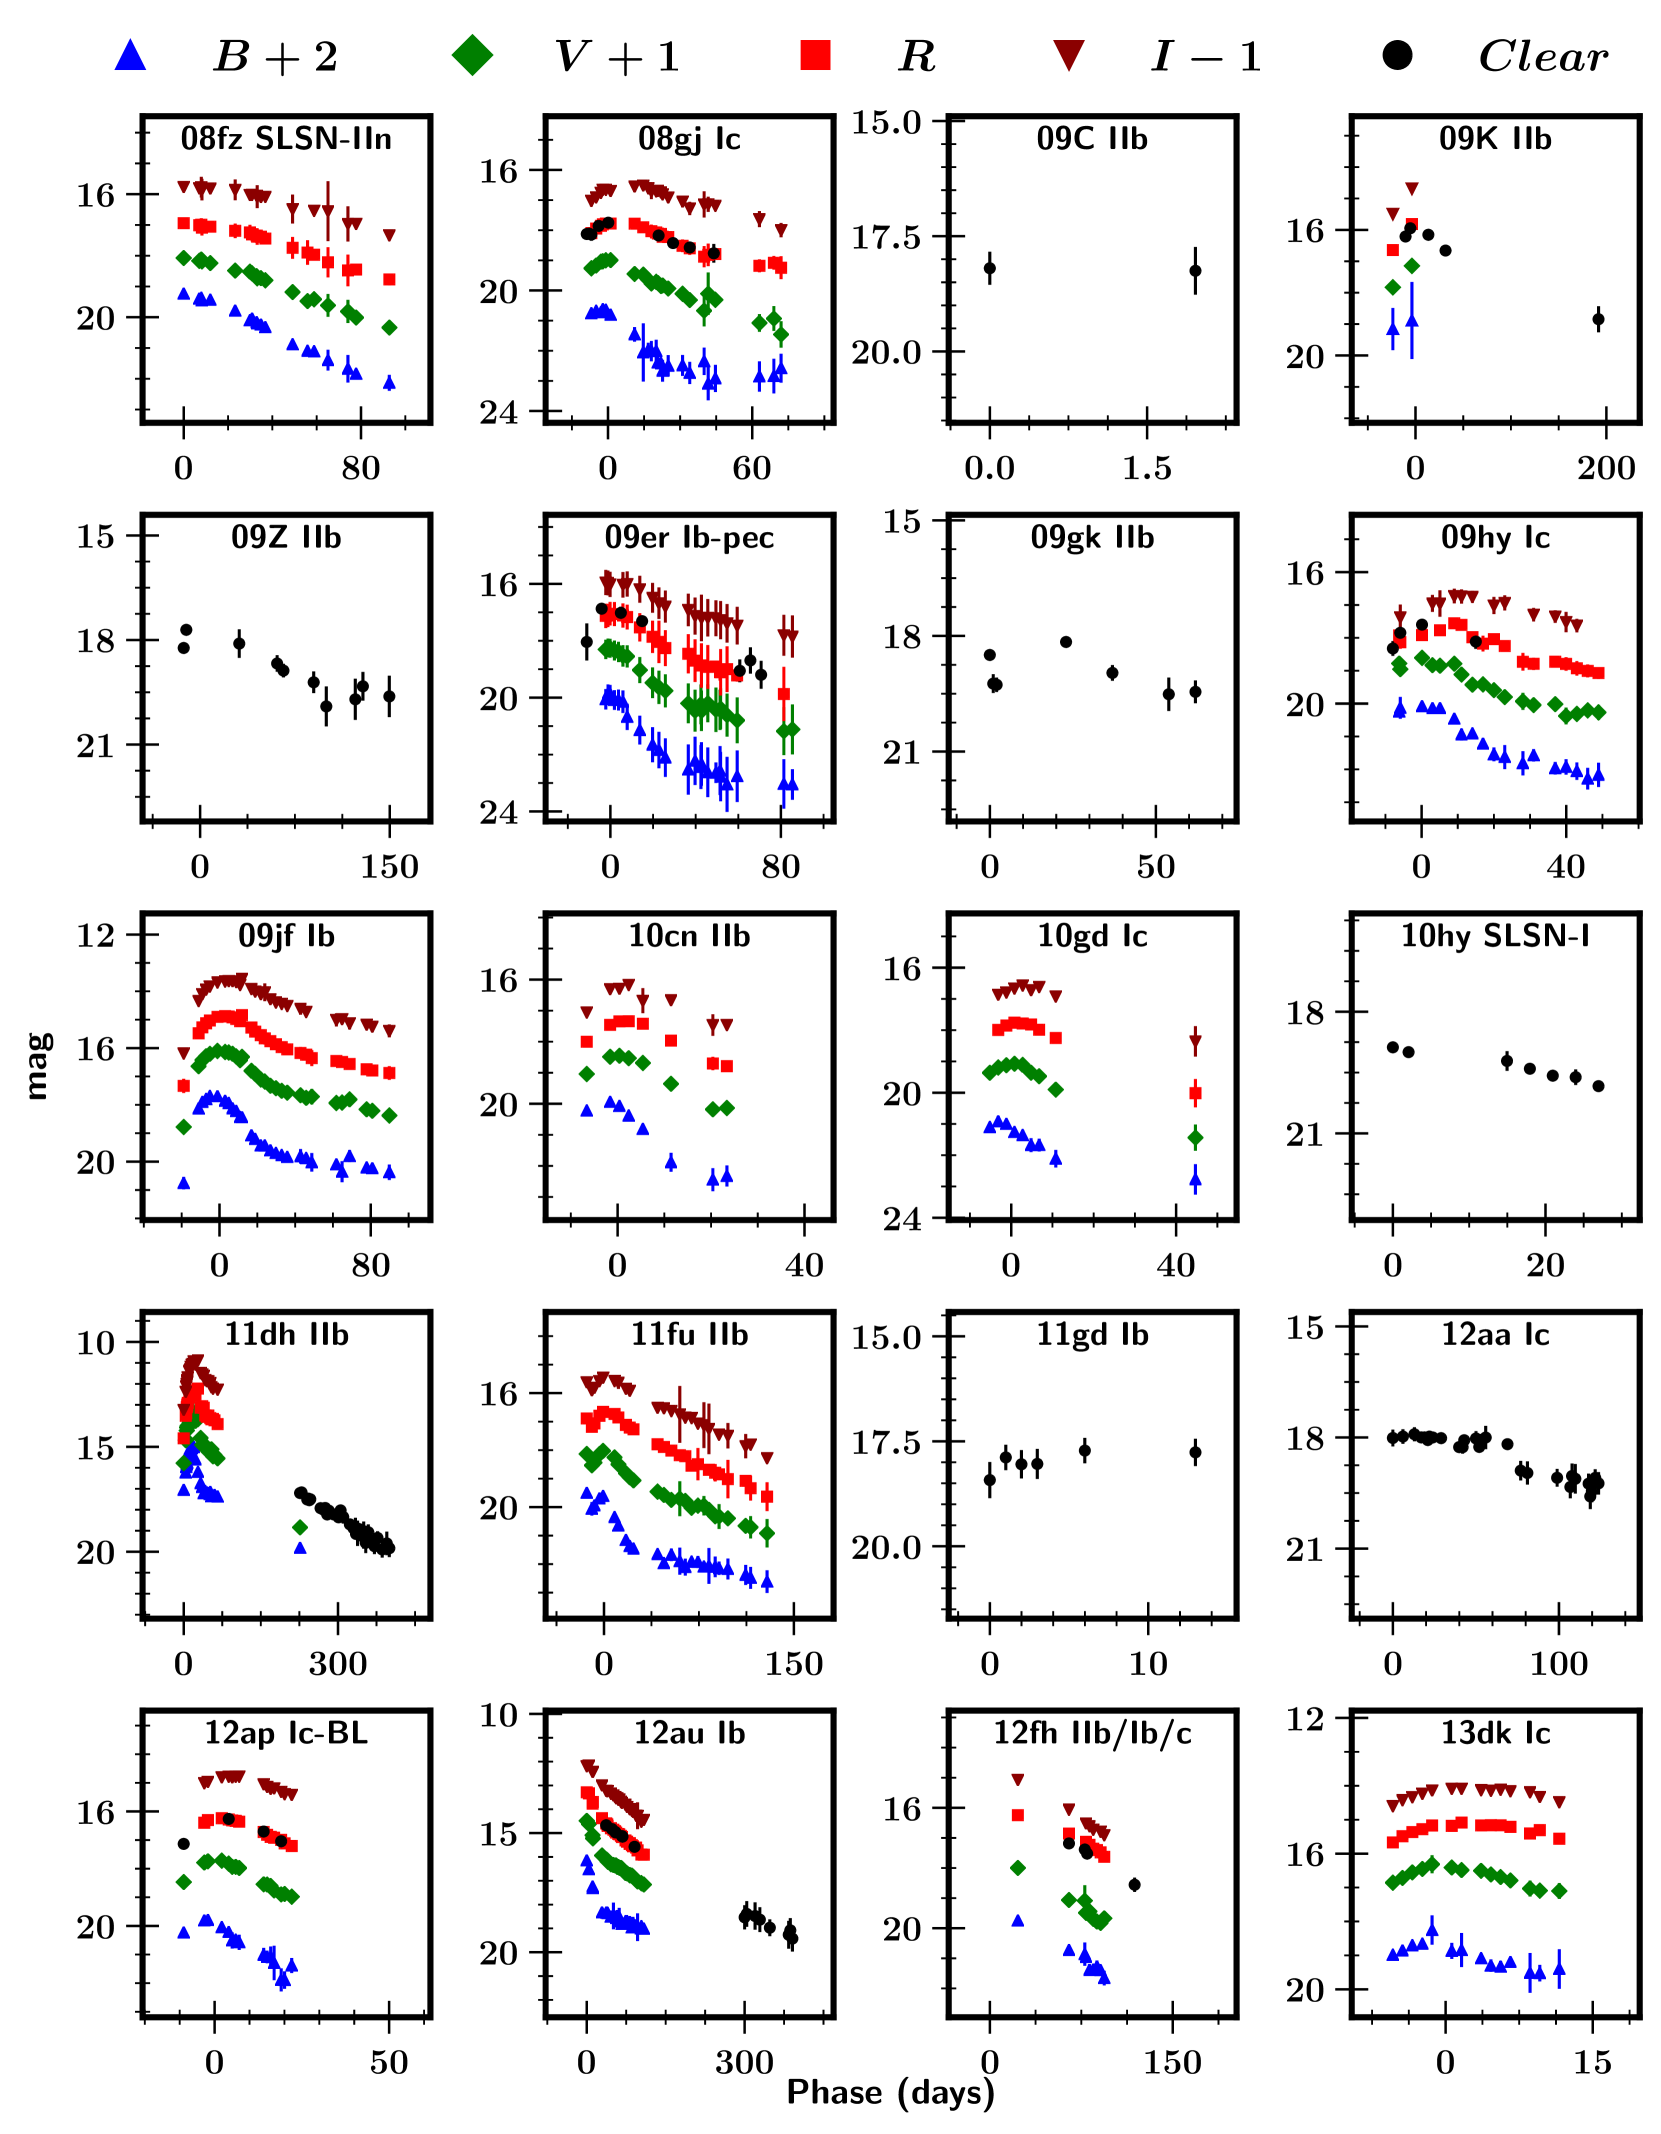
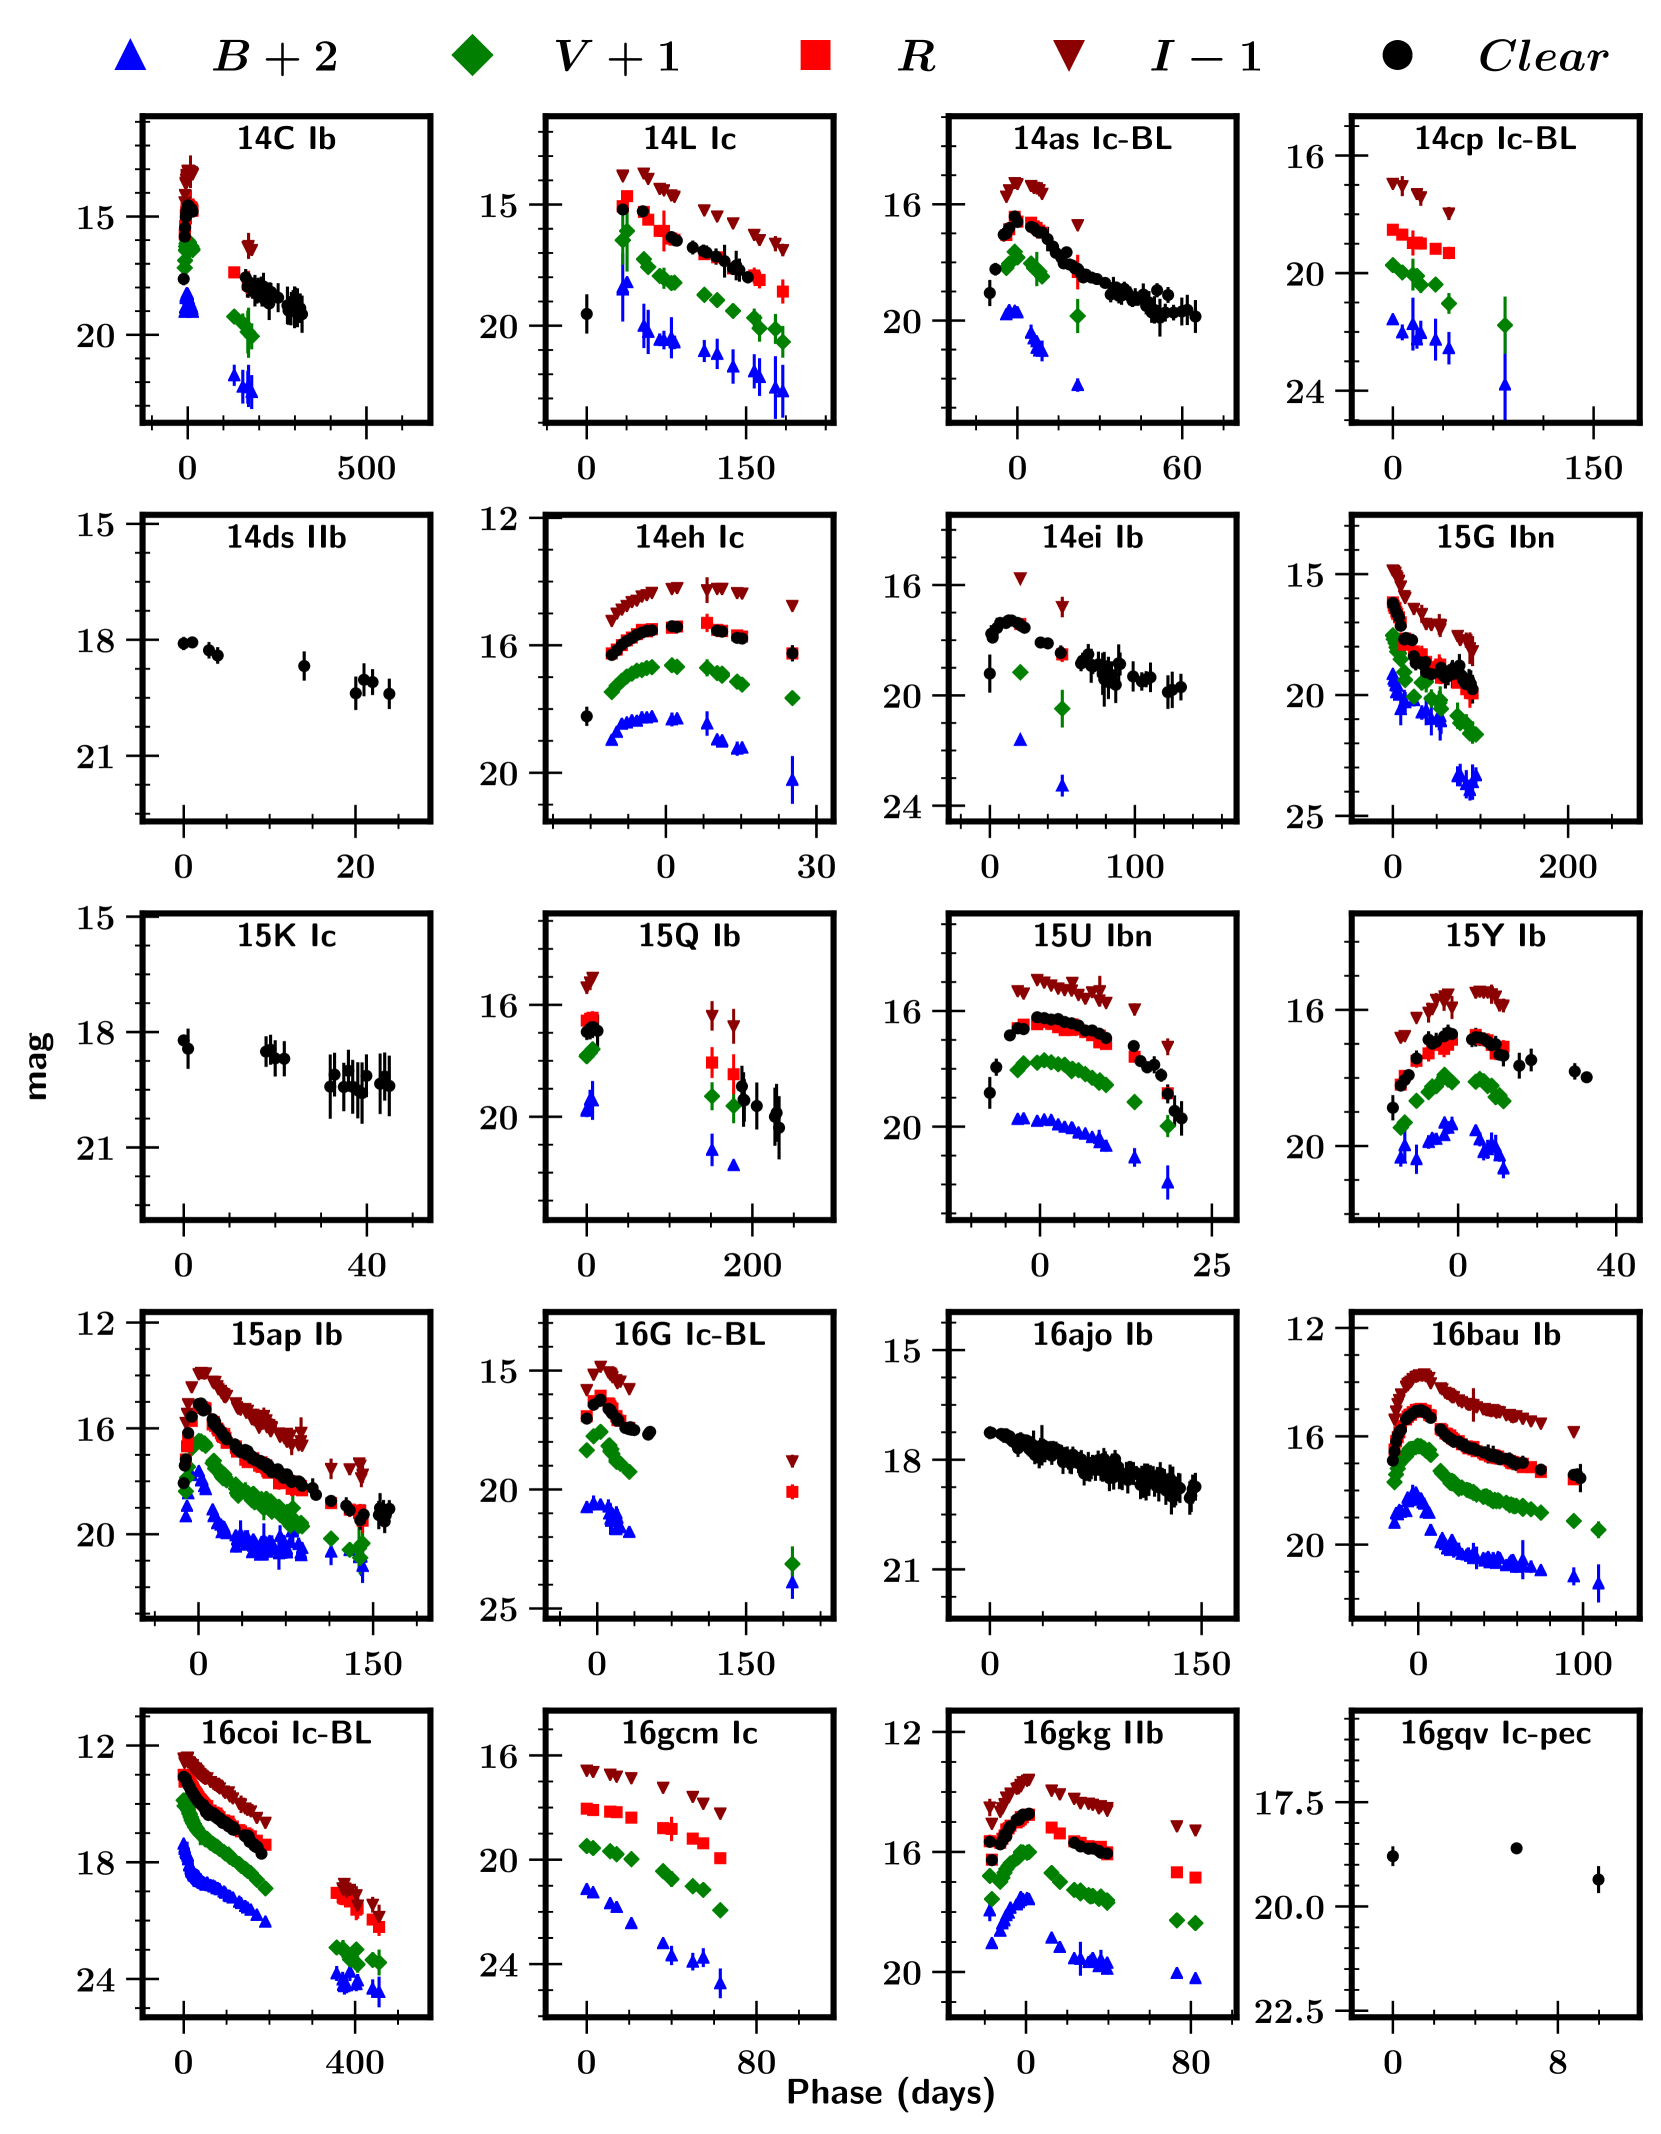
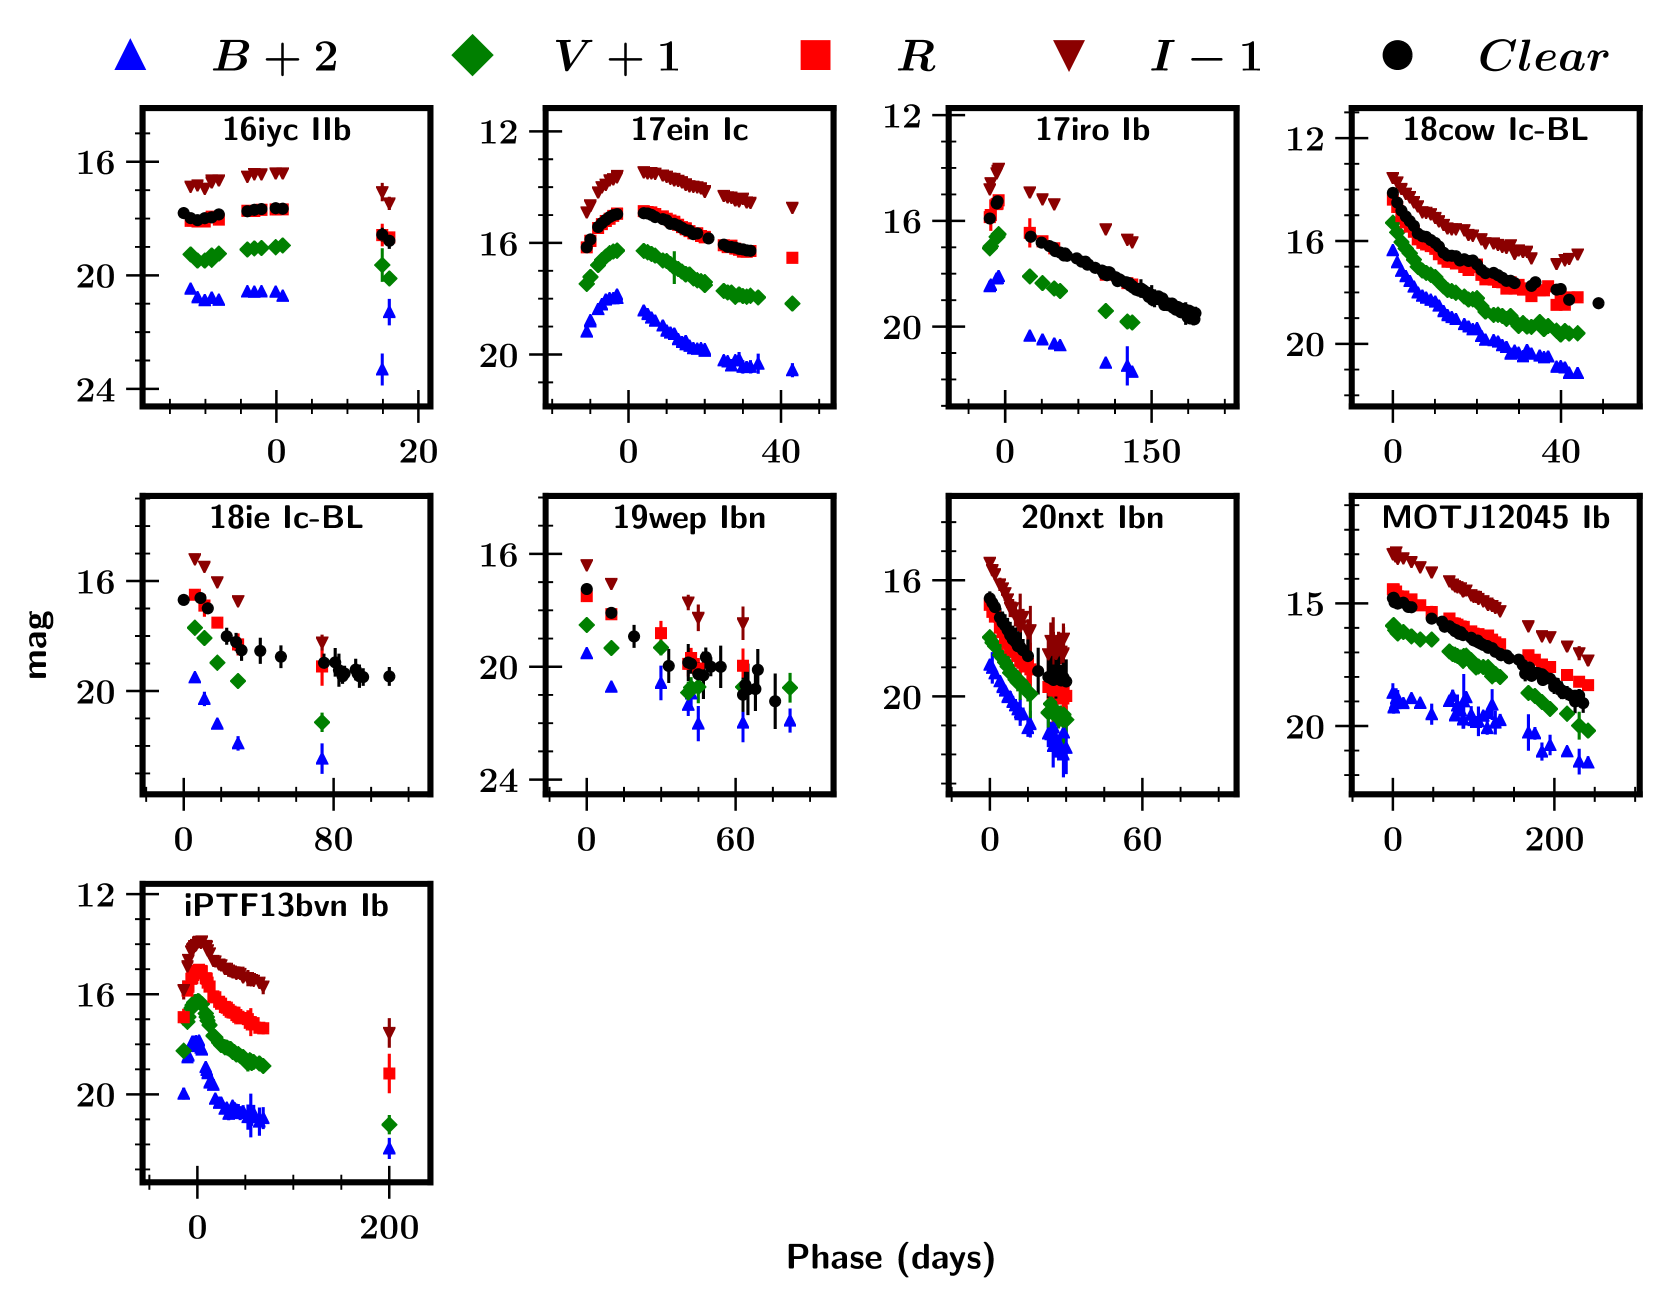
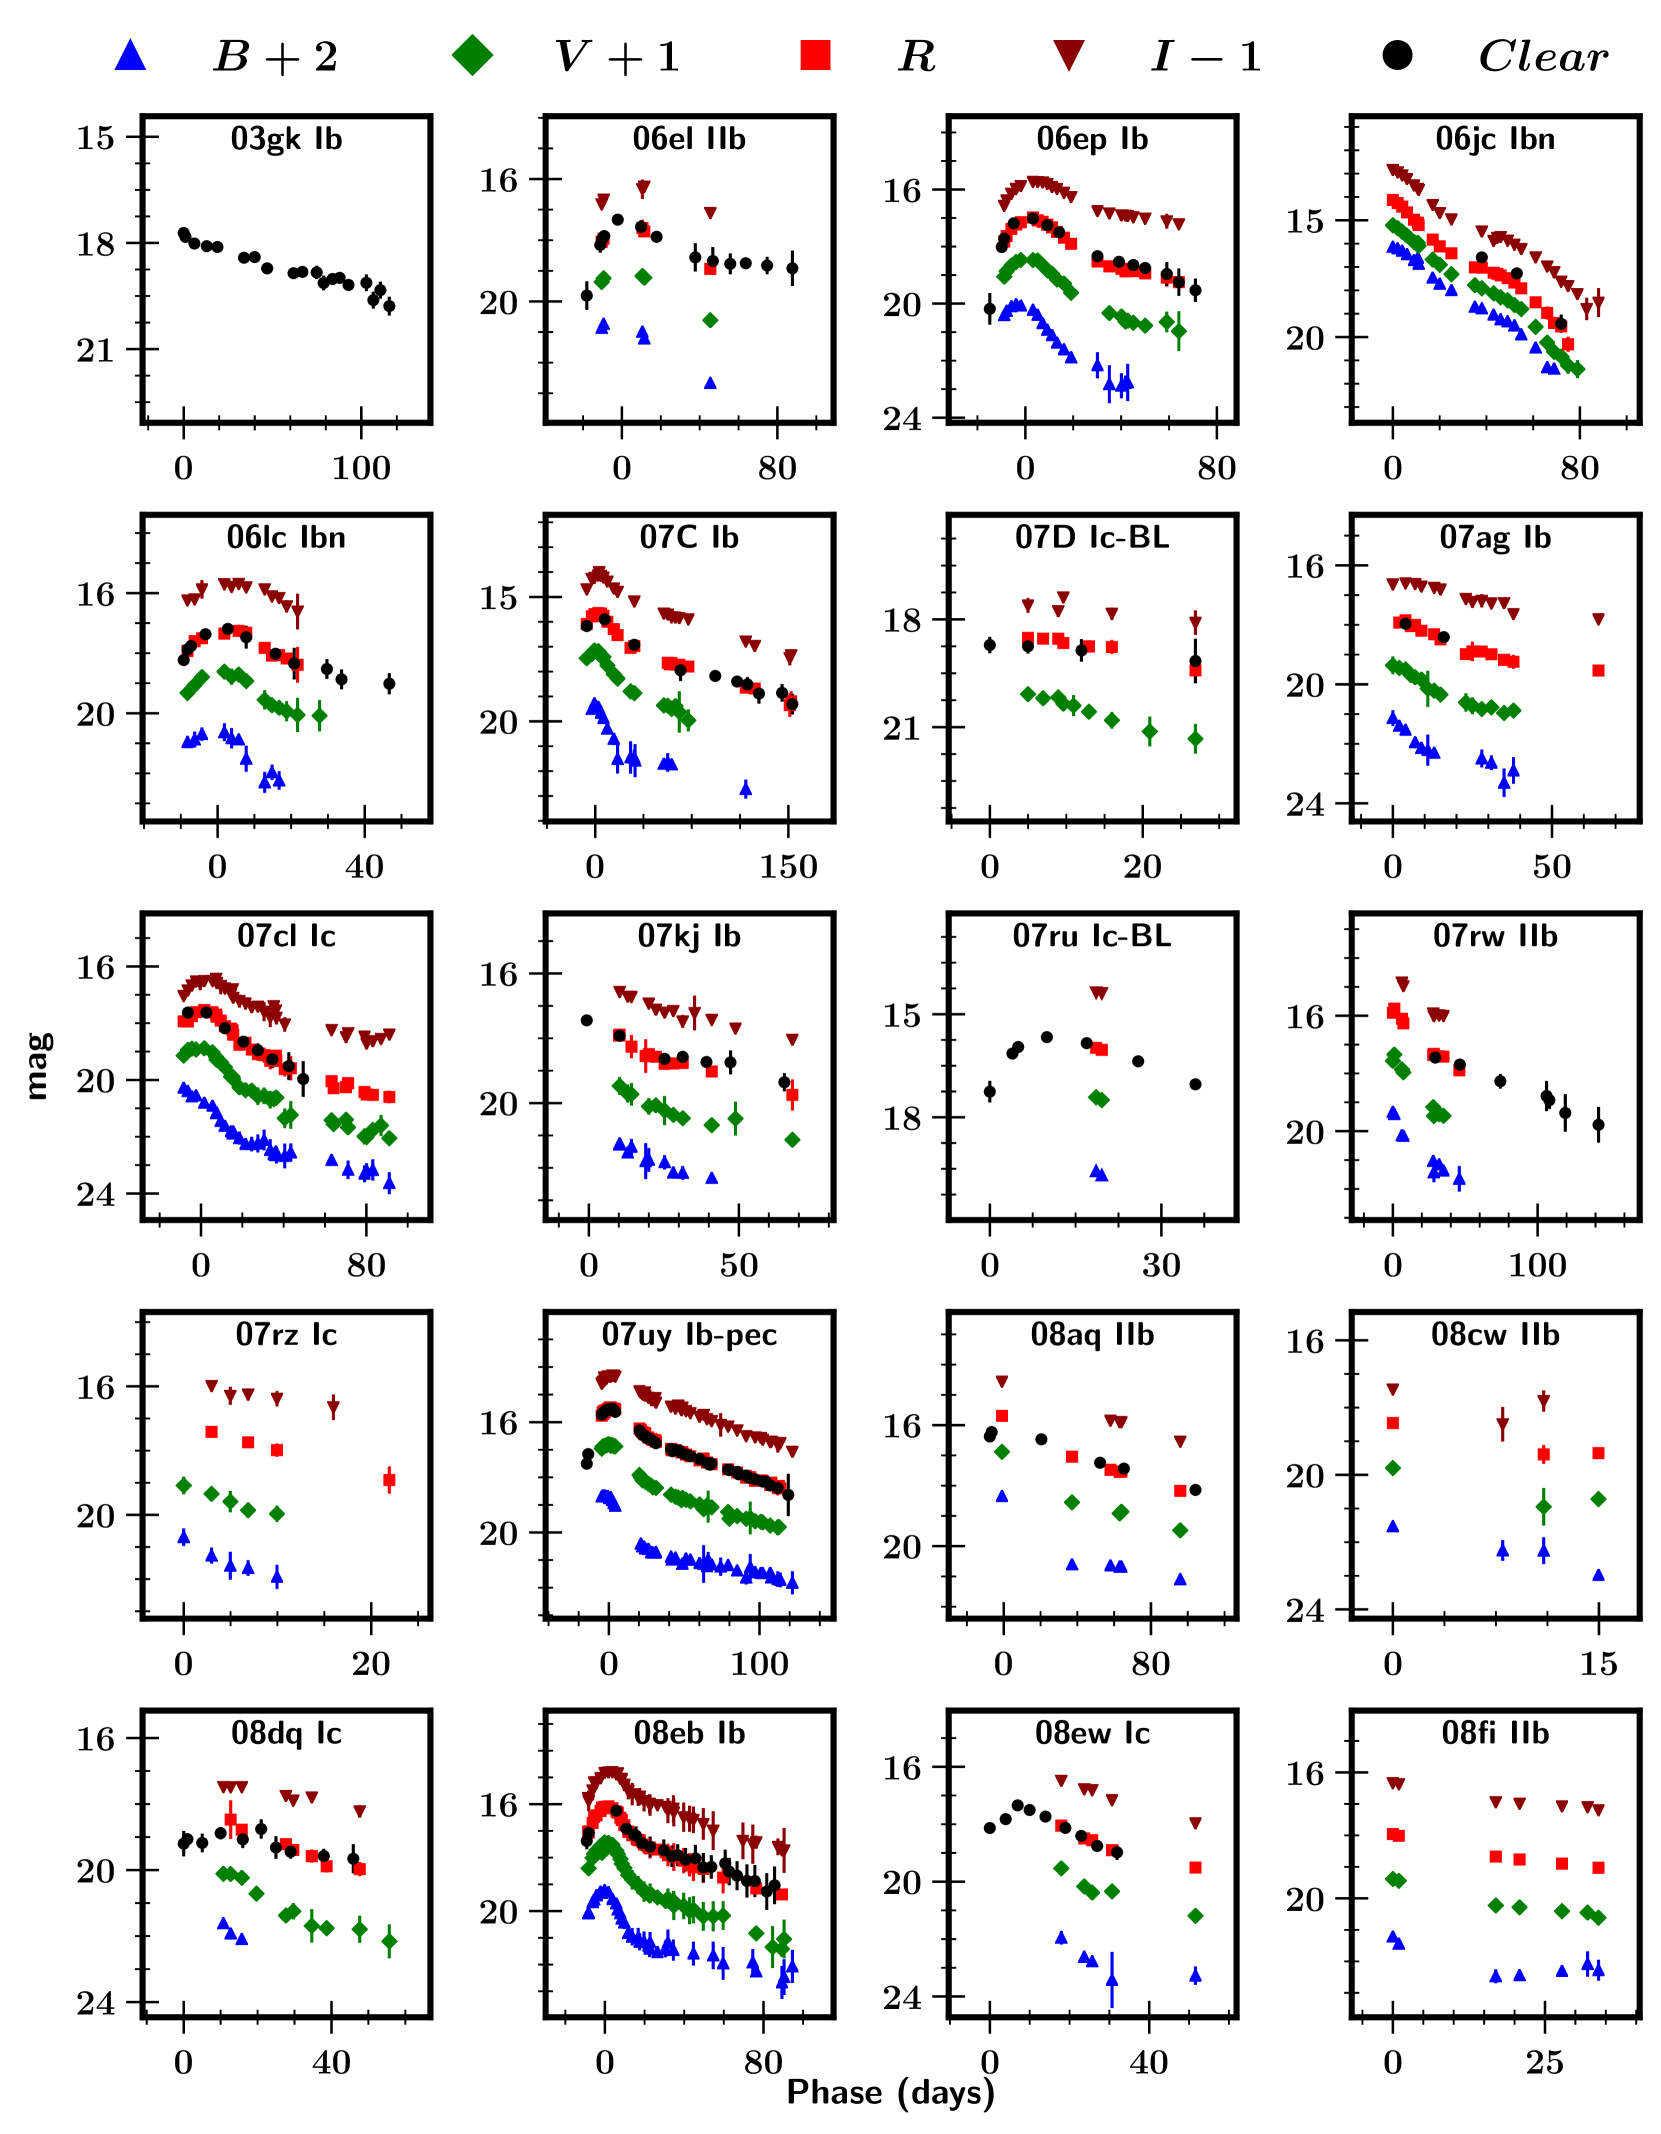
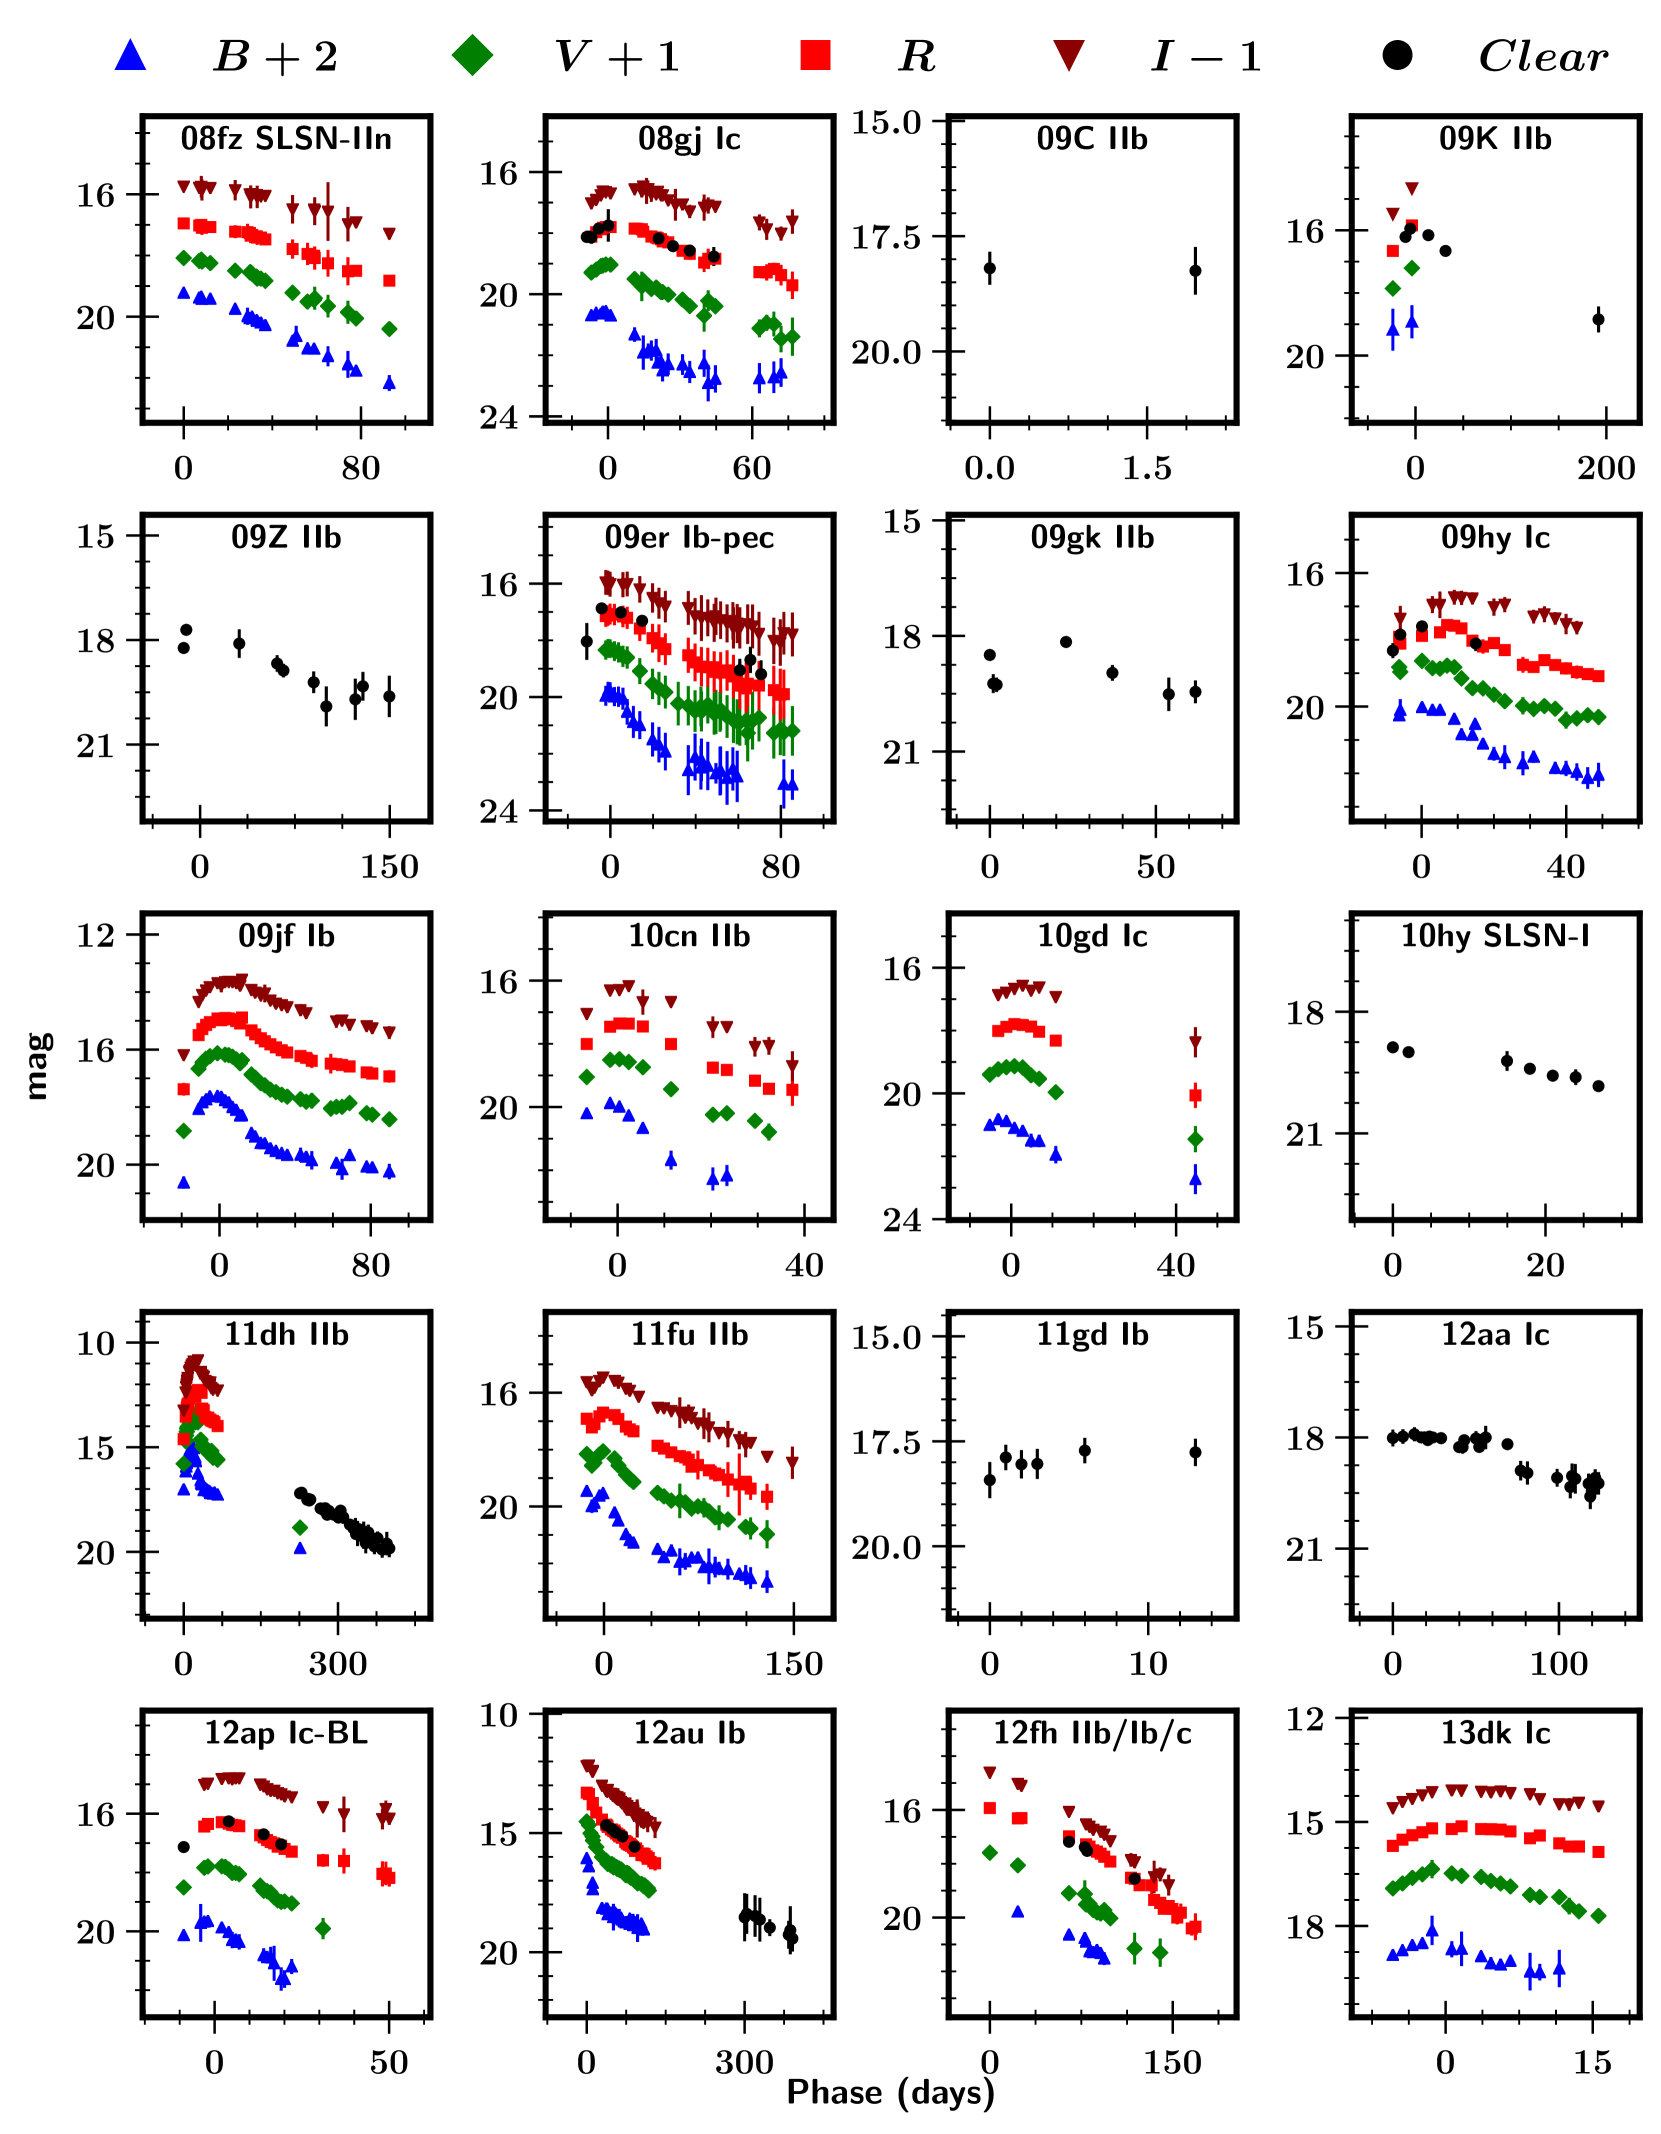
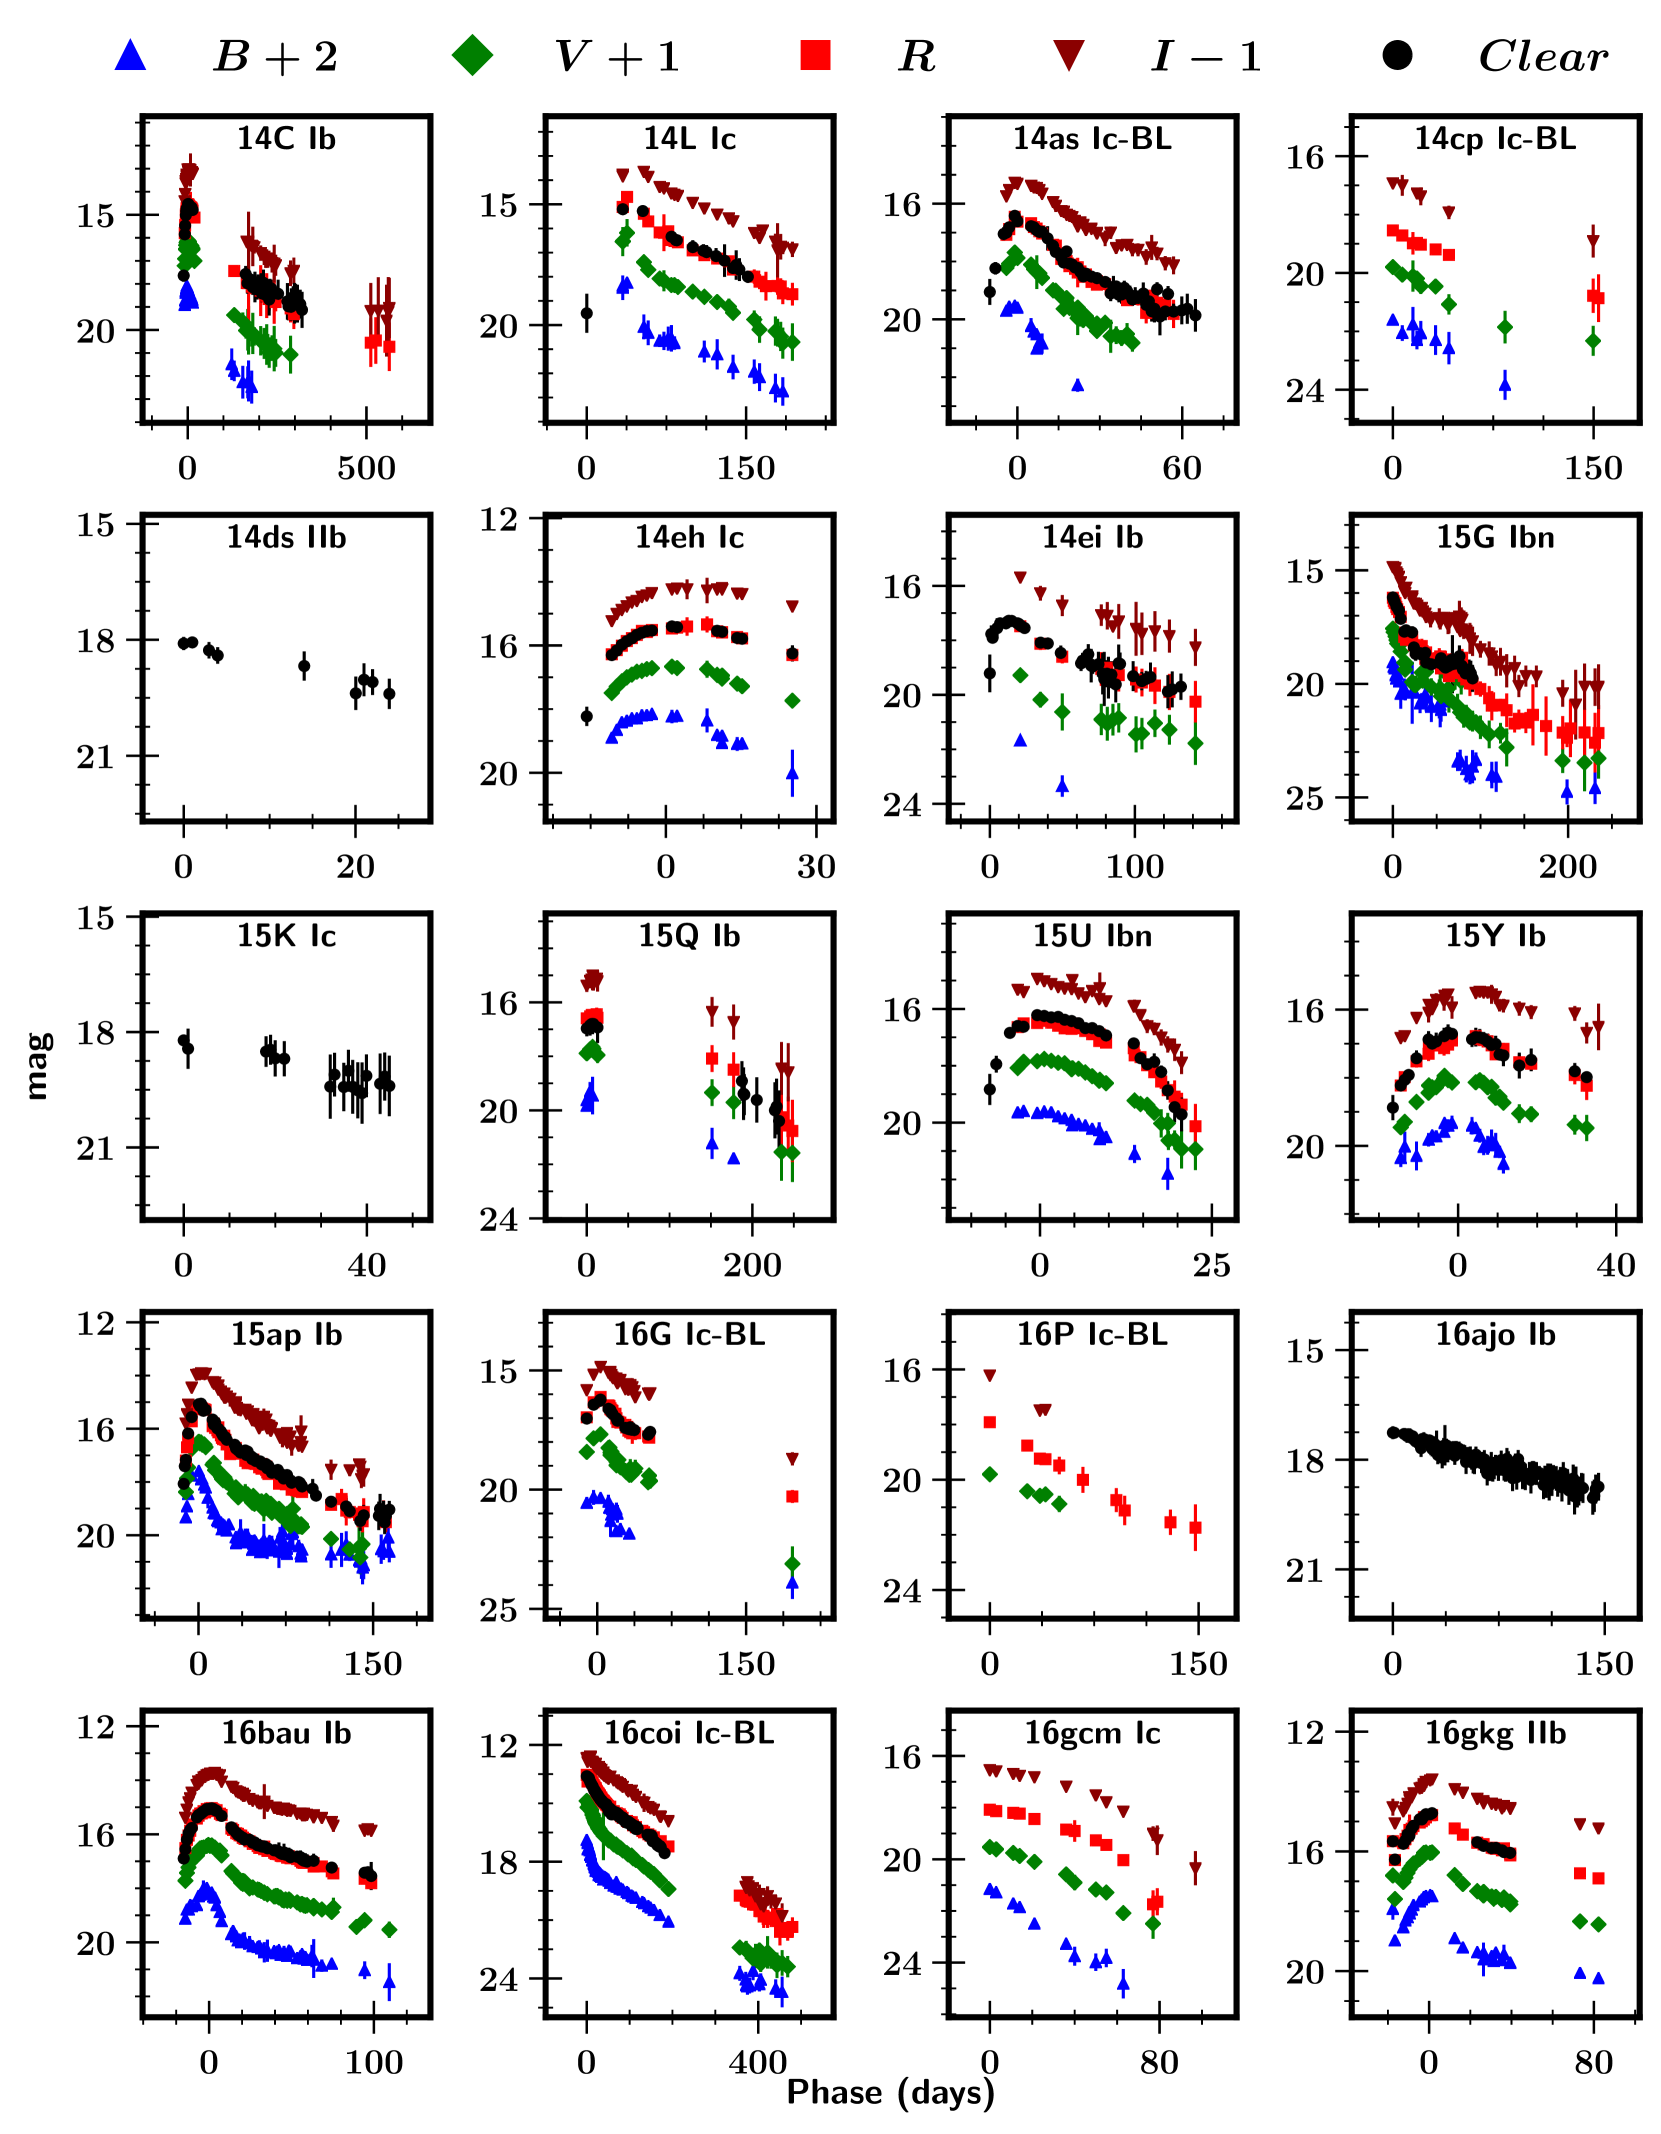
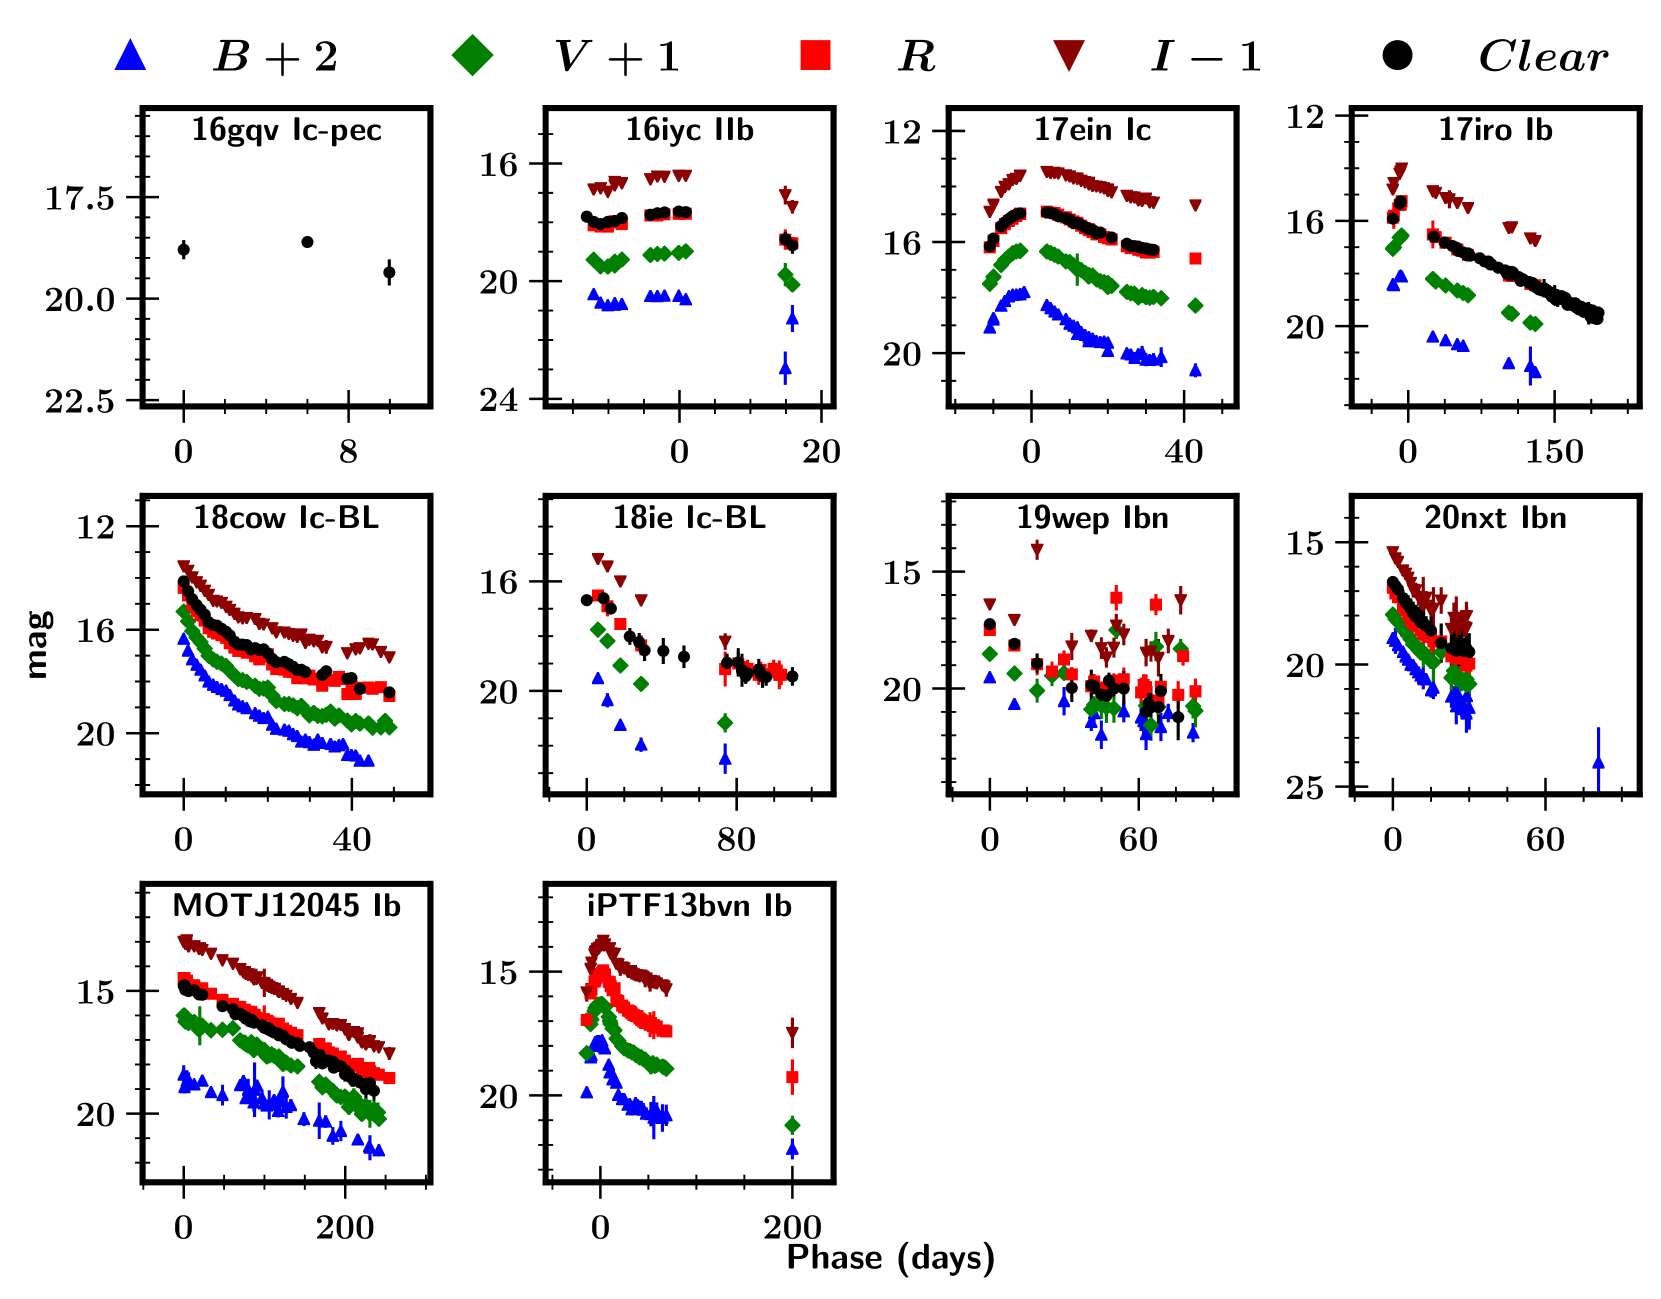
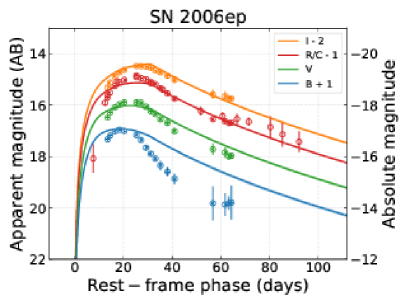
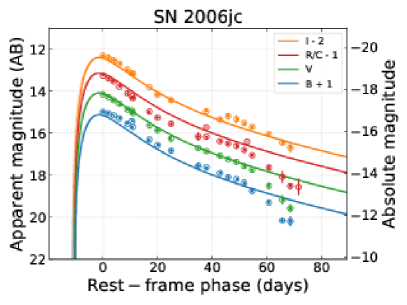
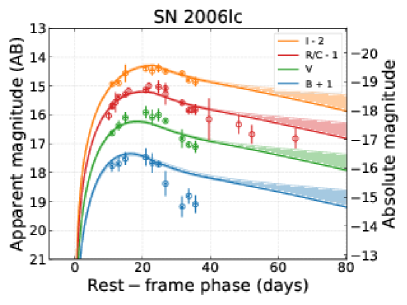
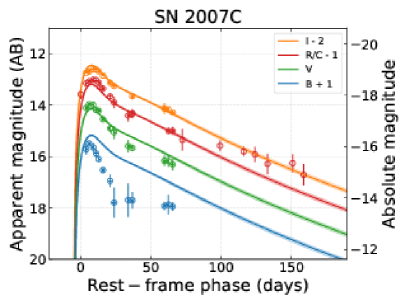
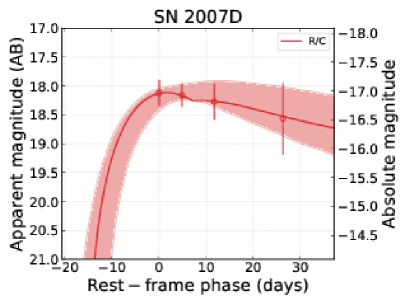
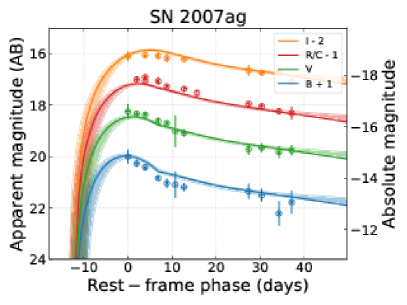
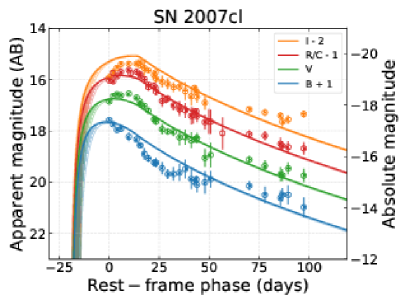
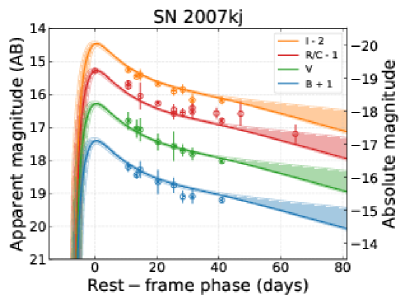
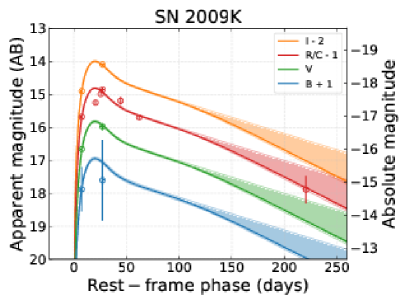
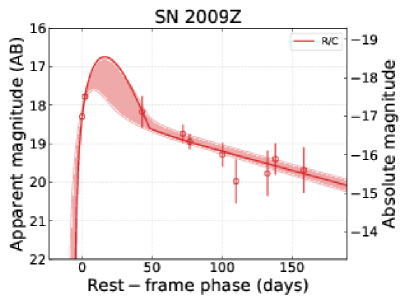
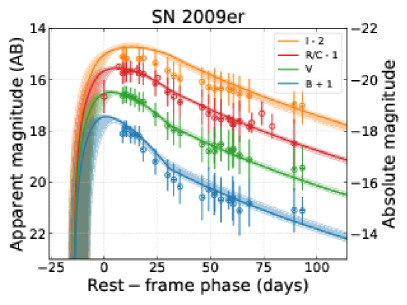
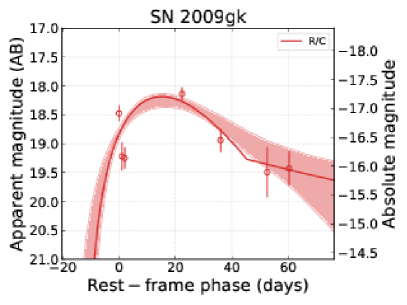
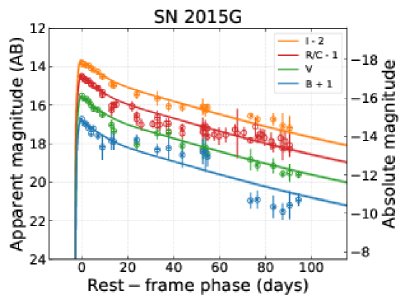
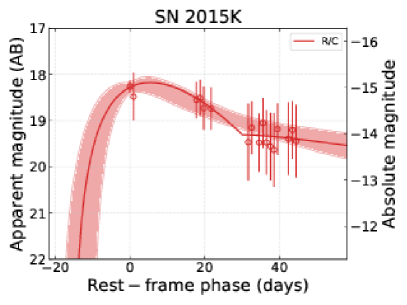
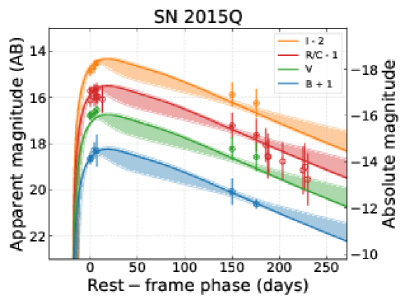
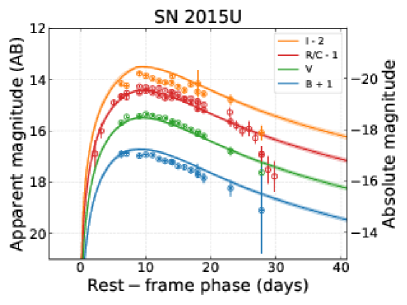
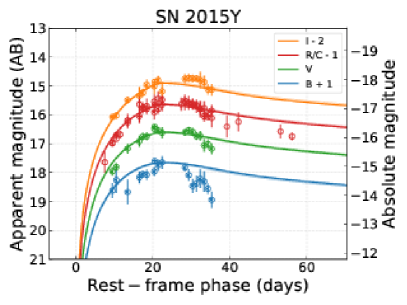
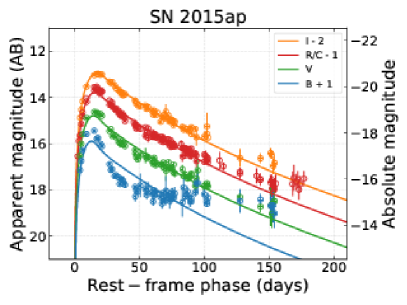
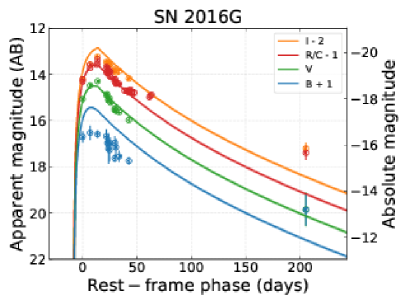
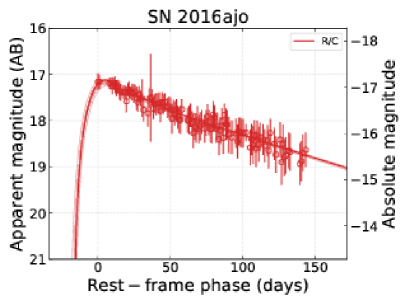
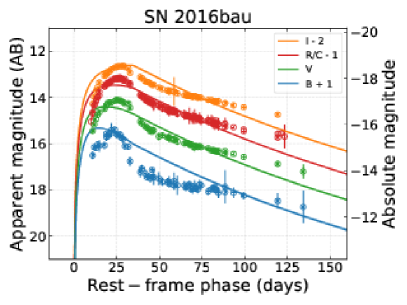
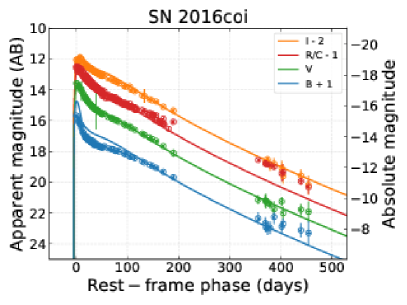
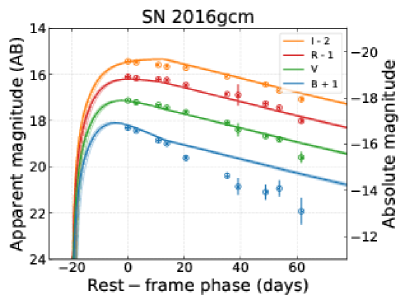
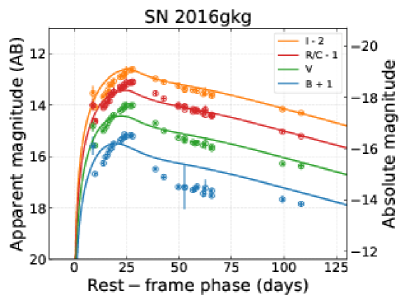
Figure 2 shows the apparent-magnitude light curves of all SESNe from our sample in the standard Landolt system without any extinction corrections applied. Note that we also include Clear-band light curves where available. Although unfiltered and thus nonstandard, it is most similar to the band (Li et al., 2003). The temporal axes are all in the observer frame and shifted such that times are measured relative to the times of maximum -band brightness as determined by fitting the near-maximum data with low-order Legendre polynomials. In the 37 cases where no maximum could be found via this method, the temporal axes are shifted relative to the time of the first observation. Such fitting was also applied to other bands if the data — after being supplemented with corresponding observations from Drout et al. (2011), Bianco et al. (2014), or Stritzinger et al. (2018a) — had sufficient near-maximum coverage.
4.3 Colour evolution and host extinction
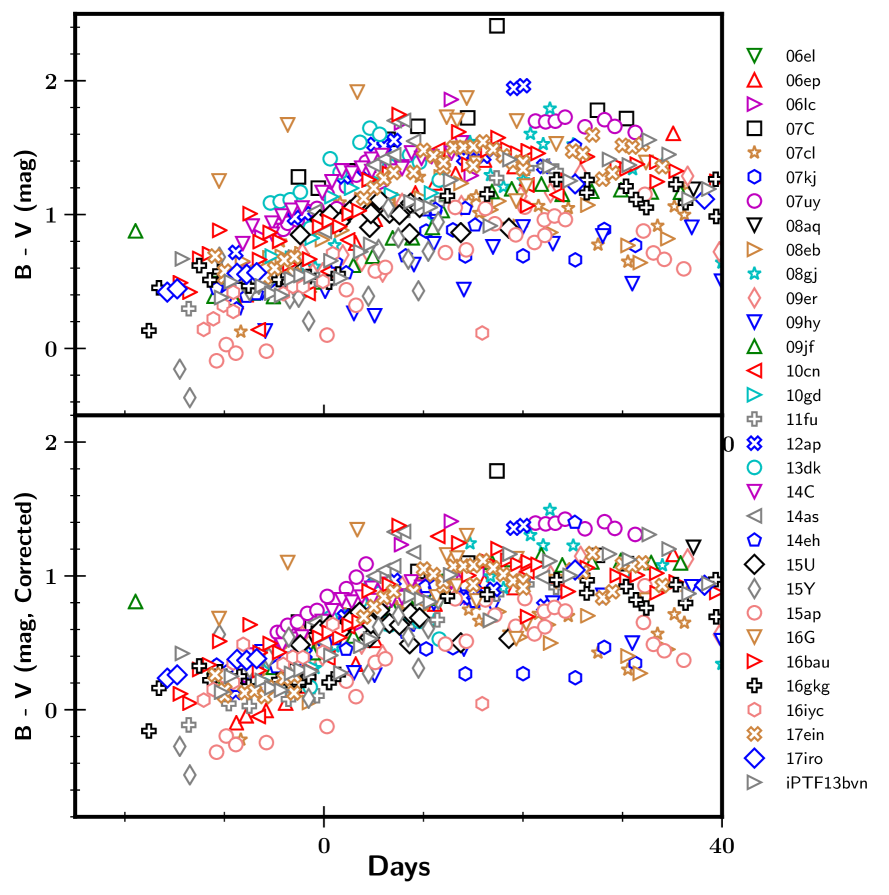
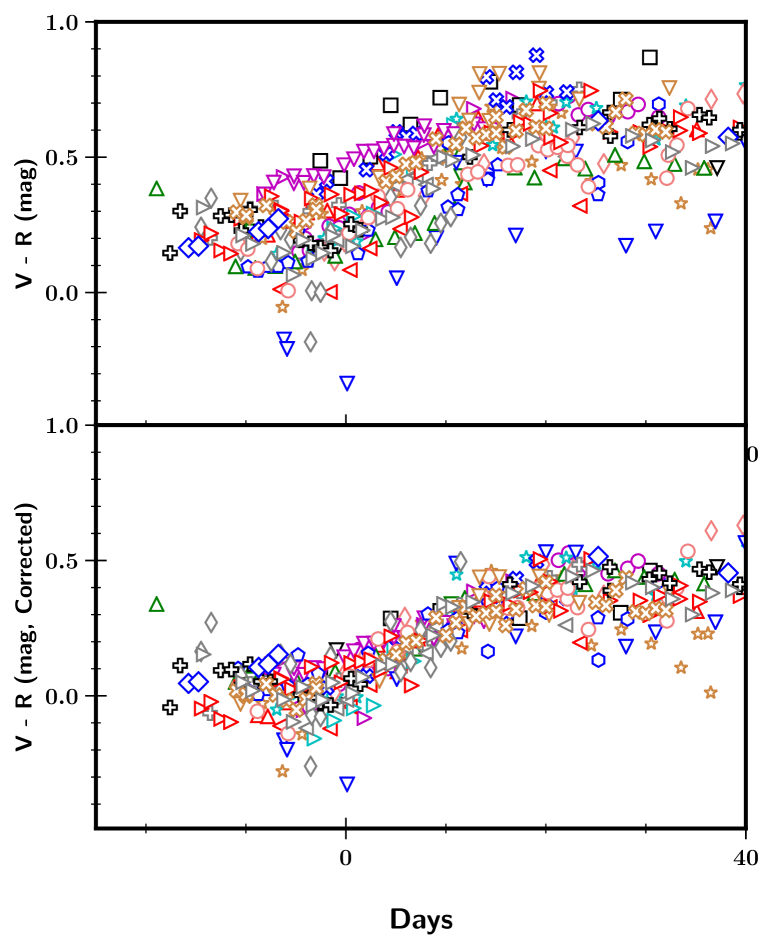
Figure 3 shows the () (top left) and () (top right) colour evolution of the SESNe in our sample which have the requisite observations in both bands, after correcting for Milky Way (MW) Galactic extinction (Schlafly & Finkbeiner, 2011) but not host-galaxy extinction. Individually, we find that the colours trend blue at very early times (e.g., d before -band peak), and then become progressively more red until d after -band maximum. As a whole, however, the colours we observe span a wide range at nearly every epoch, in part because we have not (yet) performed any corrections for host extinction. As SESNe often reside in dusty star-forming regions (e.g., van Dyk et al., 1996; Kelly et al., 2008), it is likely that the extinction due to the galactic hosts of our SNe is generally the dominant component of the total line-of-sight extinction.
One useful way to estimate host extinction is to exploit its relationship with the equivalent width of Na I D absorption as measured from high-resolution spectra (e.g., Poznanski et al., 2012; Stritzinger et al., 2018b). Unfortunately, such data are difficult to obtain, and low-resolution spectra, though easier to procure, are usually not of sufficient quality for such measurements (Poznanski et al., 2011).
Distinct from spectral proxies using Na I D absorption, Drout et al. (2011) found that the () colour evolution of SESNe has a small dispersion at d after -band peak, and thus can be exploited as a useful diagnostic for estimating host-galaxy extinction (Drout et al., 2011; Taddia et al., 2015; Stritzinger et al., 2018b). We therefore follow the approach of Drout et al. (2011) to estimate the extinction induced by the host galaxies of the SNe in our sample. To do this, we measure the () colour at 10 d after -band maximum, and apply extra extinction (assumed to be from the host) so that the () colour reaches 0.26 mag — the mean () colour found by Drout et al. (2011) after all corrections. We successfully applied this method to 31 SESNe in our sample with available data in both and at 10 d after -band maximum. We note that a few SESNe in our measured sample have negative implied host-extinction values by doing this, but such values are sufficiently small to be consistent with no host extinction.
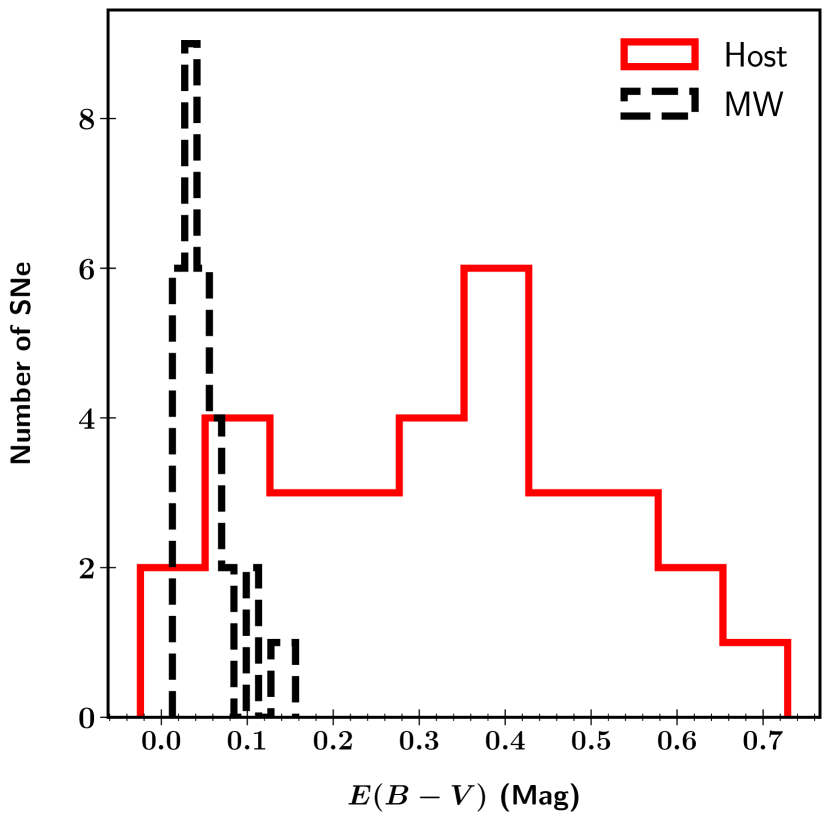
Figure 4 shows a histogram of the estimated values for the 31 SESNe in our sample (also listed in Tab. 2) assuming a Cardelli et al. (1989) reddening law with . It clearly shows that SESNe usually suffer moderately-high extinction from their host galaxies, with a mean value of 0.32 mag and standard deviation of 0.19 mag — consistent with the value found by other works using different SESN samples (Drout et al., 2011; Taddia et al., 2015; Stritzinger et al., 2018b). This mean host extinction is higher than recently studied samples of SNe Ia with mean mag (Burns et al., 2011; Stahl et al., 2019) and SNe II with mean mag (; Smartt et al. 2009).
After correcting for host extinction as described above, we plot the extinction-corrected () (bottom left) and () (bottom right) colour curves in Figure 3. The scatter in () colours is significantly decreased at 10 d after -band maximum, consistent with the results of Drout et al. (2011), Taddia et al. (2015), and Stritzinger et al. (2018b). However, although its scatter is modestly reduced, the () colour curve is by no means “tight” like we observe for (). This is not surprising because the host extinction is estimated from the () colour, not the () colour as proposed by Drout et al. (2011). This indicates that the () colour may not be as good a proxy as the () colour, or that the host extinction is more complicated, e.g., the hosts of SESNe are known to be with a range of (e.g., Stritzinger et al., 2018b), while adopting a constant to derive would lead to errors in and more scatter. In either case, a better method for estimating the host-galaxy extinction for SESNe would be a valuable contribution to the field.
4.4 Absolute light curve and peak magnitude
| SN | Type | ||||||||||||
|---|---|---|---|---|---|---|---|---|---|---|---|---|---|
| 2006el | IIb | 0.017062 | 0.25 | 17.88 | — | 18.28 | — | 17.60 | 17.33 | — | — | — | 17.44 |
| 2006ep | Ib | 0.015134 | 0.45 | 17.73 | 18.57 | 17.97 | 17.65 | 17.39 | 16.98 | 17.19 | — | 16.72 | 17.05 |
| 2006lc | Ibn | 0.016228 | 0.45 | 18.26 | 19.79 | 18.51 | 18.09 | 17.67 | 17.23 | 17.32 | — | 16.71 | 17.22 |
| 2007C | Ib | 0.005604 | 0.62 | 17.82 | — | 17.28 | — | 16.13 | 15.58 | 15.76 | — | 15.13 | 15.50 |
| 2007cl | Ic | 0.022182 | 0.35 | 18.27 | — | — | — | 17.85 | 17.60 | 17.48 | — | 17.42 | 17.69 |
| 2007kj | Ib | 0.017899 | 0.42 | — | 18.30 | 17.92 | 17.74 | 17.66 | — | 17.56 | — | — | 17.62 |
| 2007ru | Ic-BL | 0.015464 | — | — | — | — | — | — | — | — | 15.63 | — | — |
| 2007uy | Ib-pec | 0.006494 | 0.30 | 17.62 | — | 16.72 | — | 15.76 | 15.46 | 15.57 | — | 15.30 | 15.63 |
| 2008aq | IIb | 0.007972 | 0.02 | — | — | 16.40 | — | 15.84 | — | — | — | — | 15.95 |
| 2008eb | Ib | 0.007612 | 0.37 | 17.89 | — | 17.36 | — | 16.39 | 16.03 | — | — | 15.76 | — |
| 2008ew | Ic | 0.020114 | — | — | — | — | — | — | — | — | 17.51 | — | — |
| 2008gj | Ic | 0.023833 | 0.30 | 17.94 | — | 18.64 | — | 18.01 | 17.71 | — | — | 17.47 | — |
| 2009K | IIb | 0.011715 | — | — | 17.46 | 16.64 | 16.36 | 16.08 | — | 15.83 | — | — | — |
| 2009Z | IIb | 0.025131 | — | — | 18.36 | 17.75 | 17.48 | 17.25 | — | 17.16 | — | — | 17.16 |
| 2009er | Ib-pec | 0.034998 | 0.16 | 19.38 | — | 17.92 | — | 17.24 | 17.05 | 17.17 | — | — | 17.25 |
| 2009gk | IIb | 0.026505 | — | — | — | — | — | — | — | — | 18.05 | — | — |
| 2009hy | Ic | 0.025231 | 0.01 | 17.63 | — | 18.02 | — | 17.68 | 17.66 | — | — | 17.77 | — |
| 2009jf | Ib | 0.007942 | 0.07 | 17.81 | — | 15.66 | — | 15.07 | 14.86 | 14.99 | — | 14.63 | 15.00 |
| 2010cn | IIb | 0.026001 | 0.19 | 18.51 | — | 17.90 | — | 17.46 | 17.33 | — | — | 17.19 | — |
| 2010gd | Ic | 0.023493 | 0.50 | 18.75 | — | 18.91 | — | 18.09 | 17.76 | — | — | 17.62 | — |
| 2011fu | IIb | 0.018489 | 0.41 | 19.02 | — | 17.66 | — | 17.06 | 16.67 | — | — | 16.49 | — |
| 2012ap | Ic-BL | 0.012115 | 0.59 | 18.29 | — | 17.79 | — | 16.71 | 16.23 | — | — | 15.78 | — |
| 2013dk | Ic | 0.005477 | 0.73 | 18.38 | — | 16.65 | — | 15.37 | 15.12 | — | — | 15.07 | — |
| 2014C | Ib | 0.002722 | 0.50 | 17.55 | — | 16.25 | — | 15.05 | 14.52 | — | 14.57 | 14.07 | — |
| 2014L | Ic | 0.008029 | — | — | — | — | — | — | — | — | — | — | — |
| 2014as | Ic-BL | 0.012469 | 0.37 | 18.09 | — | 17.63 | — | 16.78 | 16.51 | — | 16.47 | 16.26 | — |
| 2014eh | Ic | 0.010614 | 0.11 | 17.57 | — | 16.23 | — | 15.63 | 15.40 | — | 15.41 | 15.17 | — |
| 2014ei | Ib | 0.014440 | — | — | — | — | — | — | — | — | 17.30 | — | — |
| 2015U | Ibn | 0.013790 | 0.36 | 18.51 | — | 17.73 | — | 16.74 | 16.43 | — | 16.23 | 16.01 | — |
| 2015Y | Ib | 0.008172 | 0.12 | 17.14 | — | 17.27 | — | 16.84 | 16.78 | — | 16.66 | 16.41 | — |
| 2015ap | Ib | 0.011375 | 0.22 | 18.92 | — | 15.53 | — | 15.45 | 15.18 | — | 15.09 | 14.89 | — |
| 2016G | Ic-BL | 0.009146 | 0.57 | 17.79 | — | 18.58 | — | 16.56 | 16.07 | — | 16.26 | 15.86 | — |
| 2016bau | Ib | 0.003856 | 0.37 | 15.99 | — | 16.20 | — | 15.36 | 15.02 | — | 15.05 | 14.75 | — |
| 2016gkg | IIb | 0.004940 | 0.29 | 17.56 | — | 15.58 | — | 14.99 | 14.79 | — | 14.78 | 14.68 | — |
| 2016iyc | IIb | 0.012685 | 0.07 | 16.36 | — | 18.55 | — | 17.99 | 17.68 | — | 17.65 | 17.41 | — |
| 2017ein | Ic | 0.002699 | 0.43 | 16.79 | — | 15.91 | — | 15.19 | 14.82 | — | 14.87 | 14.45 | — |
| 2017iro | Ib | 0.006191 | 0.18 | 17.54 | — | 16.07 | — | 15.39 | 14.87 | — | 14.98 | 14.79 | — |
| iPTF13bvn | Ib | 0.004533 | 0.25 | 17.65 | — | 15.86 | — | 15.26 | 15.03 | — | — | 14.90 | — |
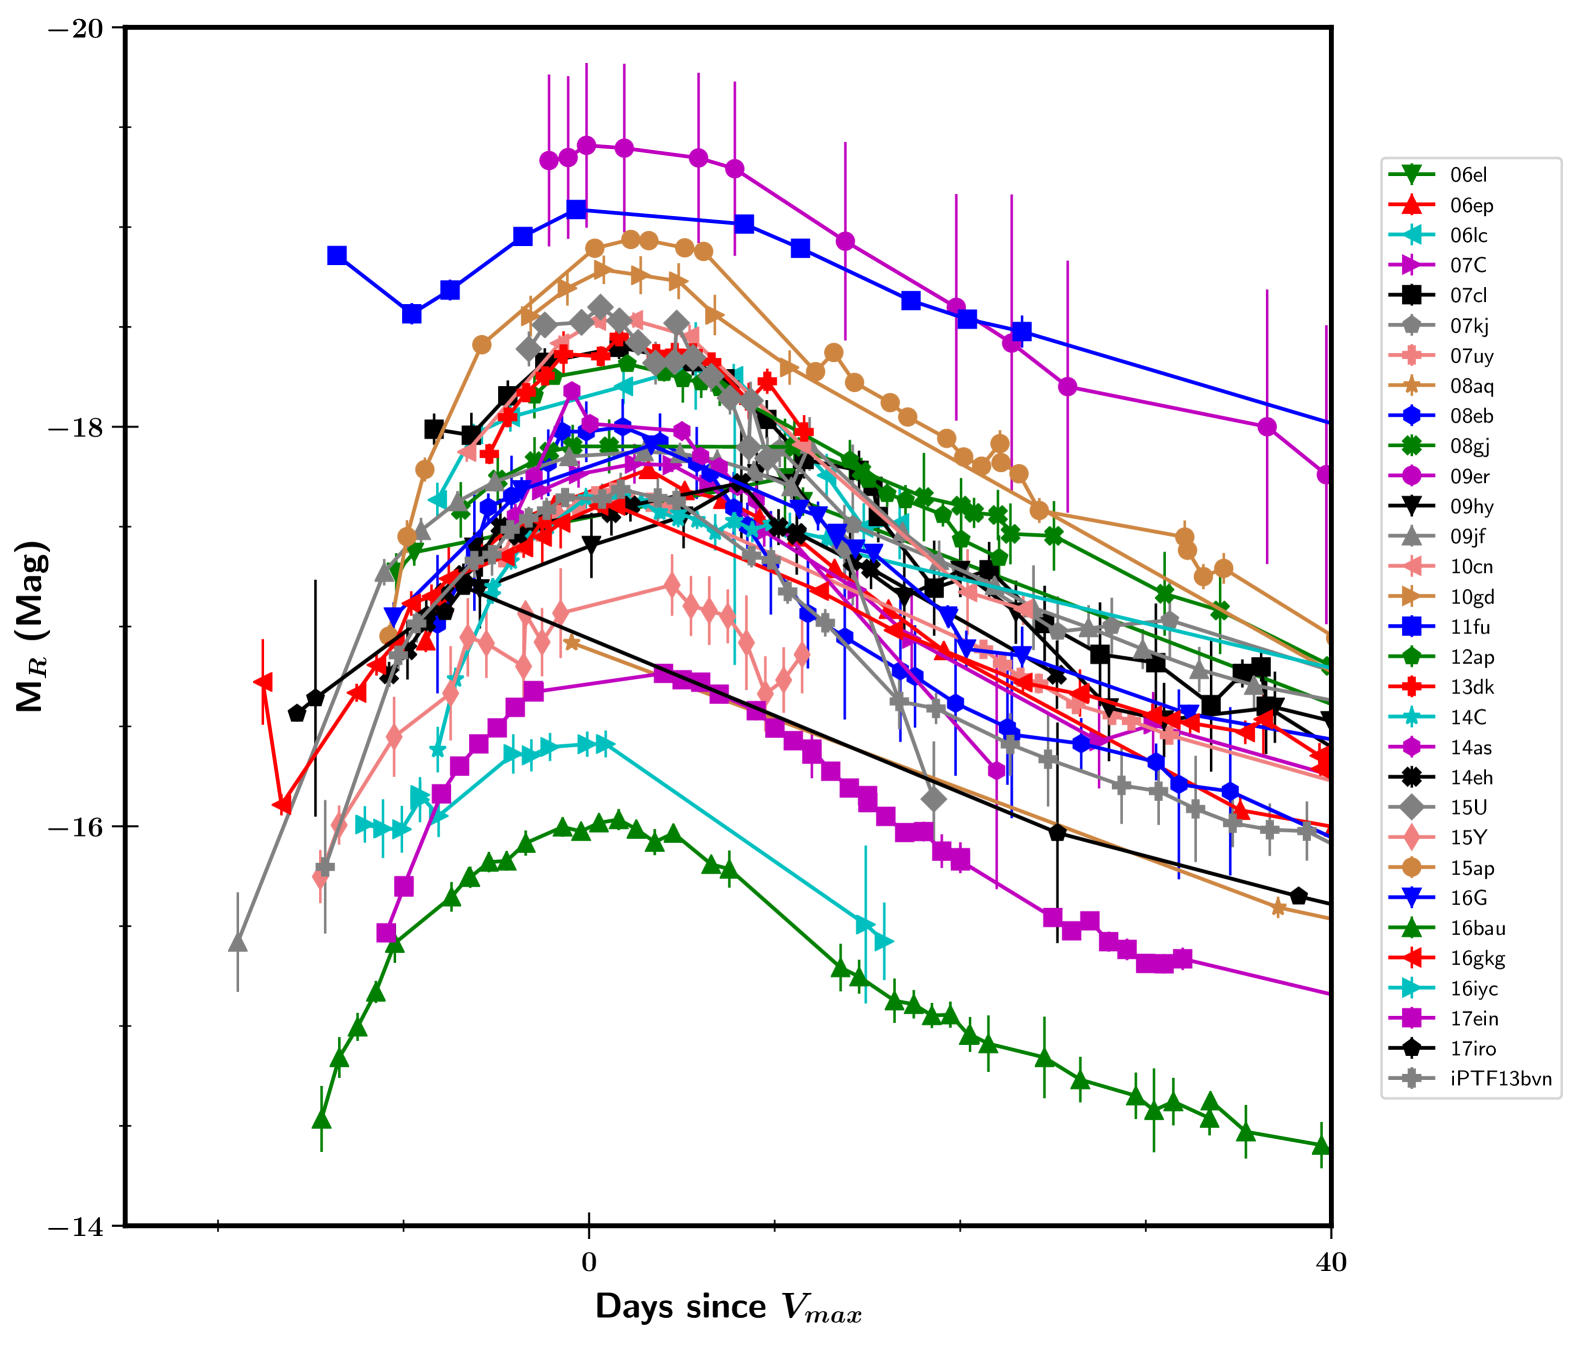
Figure 5 illustrates the absolute -band light curves of the 31 SESNe in our sample for which we are able to fully correct for extinction (i.e., correct for both MW and host-galaxy effects). Overall, the SESNe show smooth light-curve shapes with –20 d rise times before maximum brightness (see Sec. 4.5 for more details), followed by a slow decay. A few Type IIb SESNe (e.g., SNe 2011fu, 2016iyc, 2016gkg) exhibit a decline dip at very early times ( d before maximum) before rising. The early-time dips for these SNe IIb can be attributed to the shock-breakout cooling tail.
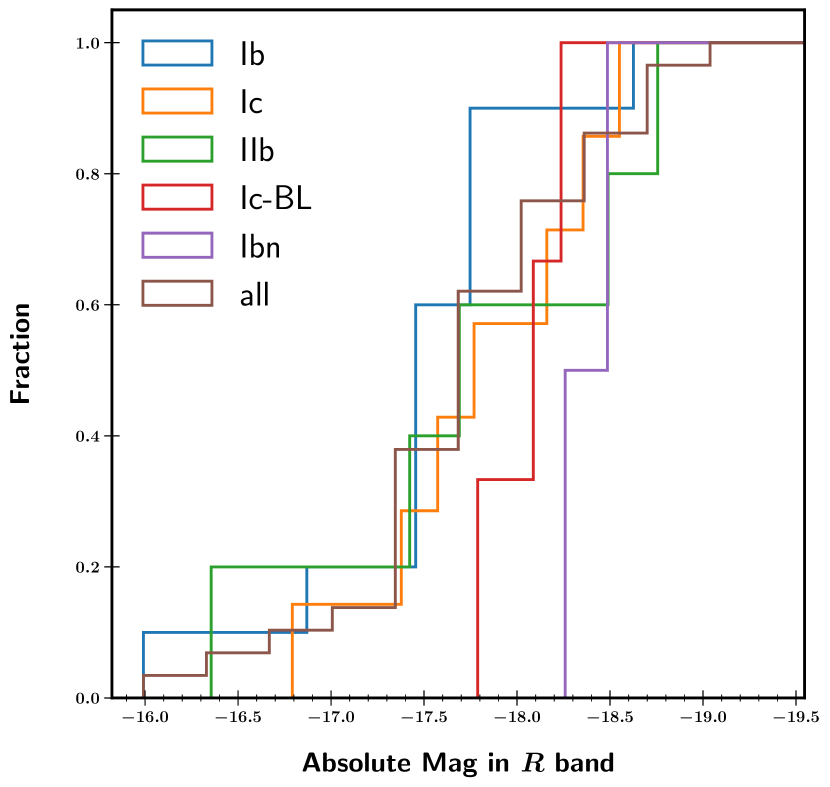
The peak -band absolute magnitude of SESNe spans a wide range from mag to over mag. In order to compare the peak magnitudes between different subgroups, we plot the cumulative distribution of -band absolute magnitude (after extinction correction) in Figure 6. We find that our whole sample (29 SNe with both peak and host-extinction measurements) has an average mean peak absolute magnitude of mag. We also calculate the mean peak brightness for each subgroup and find a value for SNe Ib of mag (ten SNe), mag for seven SNe Ic, and mag for five SNe IIb. With admittedly small samples of three SNe Ic-BL and two SNe Ibn, we found mag and mag, respectively — brighter than the other subgroups (SNe Ib, Ic, IIb) and consistent with the conclusion reported by Taddia et al. (2015) that SNe Ic-BL are more luminous than both SNe Ib and SNe Ic, and that SNe Ic appear slightly brighter than SNe Ib. Our reported mean magnitudes are consistent with the results from Drout et al. (2011), who found mag for SNe Ib and mag for SNe Ic in the band. Taddia et al. (2018) also reported similar trends, but in the band, with mag, mag, and for SNe Ib, Ic, and IIb, respectively (see their Table 5).
4.5 First-light time and rise time
With progressively more SESNe discovered and observed at very early phases, it has become possible to measure the true first-light time by fitting the observed light curve. Overall, the light-curve shape of SESNe resembles that of SNe Ia. Several empirical functions have been proposed to fit SESN light curves. For example, Taddia et al. (2015) used a phenomenological model — which was first employed by Bazin et al. (2011) for fitting SNe Ia — to fit their SESN light curves. Taddia et al. (2018) also proposed a three-component function that has proven to work well. Motivated by the former, we adopt a function proposed by Zheng & Filippenko (2017) for SN Ia light-curve fitting (Zheng et al., 2017) to fit the SESN light curves in our sample. The function is given as
| (1) |
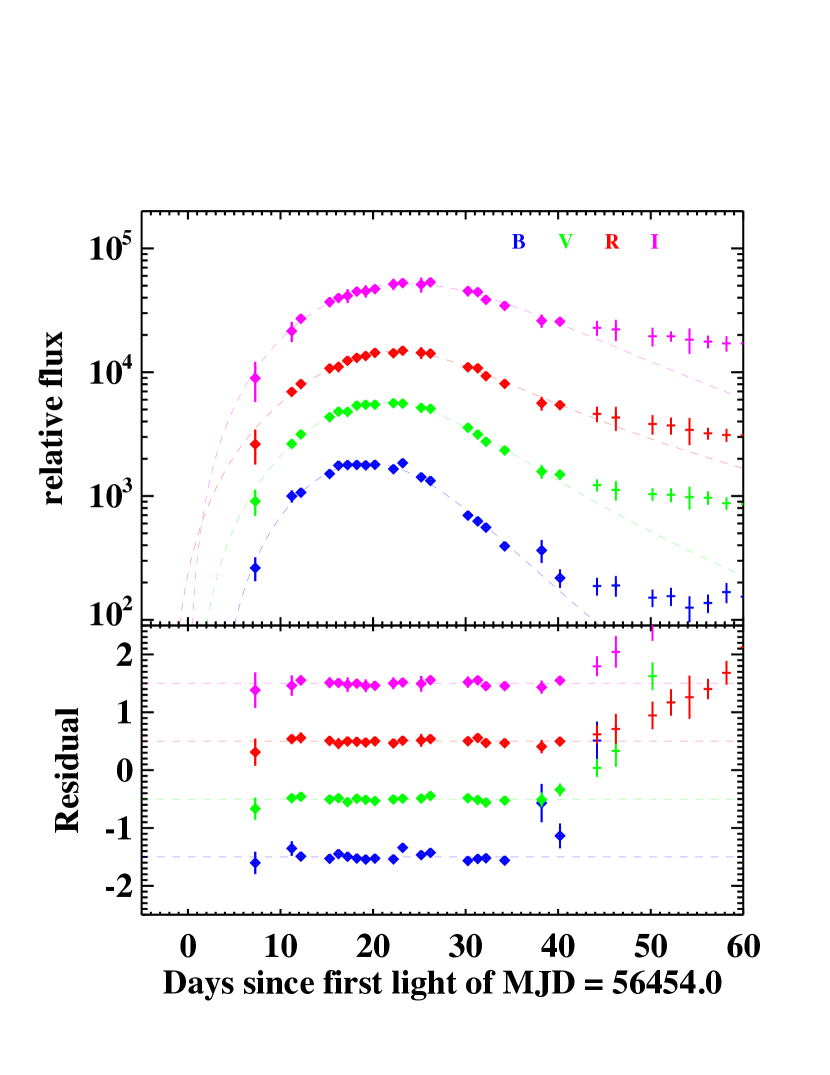
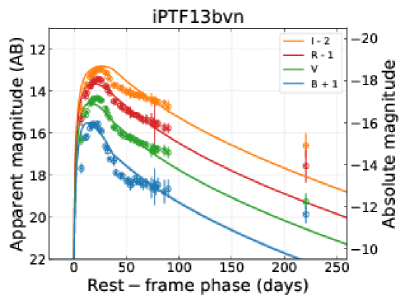
where is a scaling constant, is the first-light time, is the break time, and are the two power-law indices before and after the break, and is a smoothing parameter. We have found that this function can provide satisfactory fits to the SESN light curves in our sample. Figure 7 presents an example of this function fit to the well-observed SN Ib iPTF13bvn. This method directly takes the first-light time as a parameter in the fitting. Following the same procedure as Zheng et al. (2017), we fit for each filter with good-quality data. We finally adopt the mean value of the first-light time from the fitting if there are more than two measurements in different filters.
| SN | Type | (MJD) | ||||||||||||||
|---|---|---|---|---|---|---|---|---|---|---|---|---|---|---|---|---|
| 2006el | IIb | 0.017062 | 53,958.01.2 | — | 24.53.8 | — | 25.02.5 | 25.05.6 | — | — | — | 28.51.5 | — | — | — | — |
| 2006ep | Ib | 0.015134 | 53,964.72.4 | 17.73.0 | 19.82.4 | 20.43.0 | 22.22.6 | 24.33.0 | 24.02.8 | — | 25.82.5 | 25.82.4 | 28.72.4 | 30.22.4 | 30.42.4 | — |
| 2006lc | Ibn | 0.016228 | 54,022.00.9 | 17.03.6 | 18.32.1 | 18.33.6 | 19.12.1 | 21.81.6 | 20.52.0 | — | 22.71.1 | 21.41.1 | 25.21.6 | 26.21.6 | 26.41.6 | — |
| 2007ru | Ic-BL | 0.015464 | 54,426.52.1 | — | — | — | — | — | — | 13.83.2 | — | — | — | — | — | — |
| 2007uy | Ib-pec | 0.006494 | 54,458.01.0 | — | 19.21.1 | — | 23.01.1 | 25.31.1 | 25.51.1 | — | 26.11.1 | 26.11.1 | — | 31.91.0 | 33.11.0 | 34.21.0 |
| 2008eb | Ib | 0.007612 | 54,645.40.9 | — | 17.01.0 | — | 18.01.1 | 18.71.1 | — | — | 19.71.1 | — | — | — | — | — |
| 2009K | IIb | 0.011715 | 54,838.31.6 | 26.43.2 | 28.21.9 | 28.91.9 | 31.01.7 | — | 32.91.7 | — | — | — | 38.31.6 | 37.91.6 | 41.91.6 | — |
| 2009jf | Ib | 0.007942 | 55,097.81.1 | — | 21.01.5 | — | 23.31.3 | 25.31.8 | 25.51.5 | — | 26.51.3 | 26.81.8 | — | 31.11.1 | 32.31.1 | 35.01.1 |
| iPTF13bvn | Ib | 0.004533 | 56,454.01.4 | — | 19.51.5 | — | 21.41.6 | 22.81.5 | — | — | 24.01.6 | — | — | — | — | — |
| 2014C | Ib | 0.002722 | 56,656.60.8 | — | 11.10.9 | — | 13.70.9 | 14.80.9 | — | 14.41.4 | 15.90.9 | — | — | — | — | — |
| 2014as | Ic-BL | 0.012469 | 56,758.91.1 | — | 10.51.3 | — | 12.31.2 | 13.32.1 | — | 13.12.1 | 13.52.1 | — | — | — | — | — |
| 2014eh | Ic | 0.010614 | 56,955.11.0 | — | 16.91.7 | — | 19.61.7 | 21.92.3 | — | 22.02.9 | 24.42.3 | — | — | — | — | — |
| 2014ei | Ib | 0.014440 | 56,960.52.3 | — | — | — | — | — | — | 17.92.4 | — | — | — | — | — | — |
| 2015U | Ibn | 0.013790 | 57,061.00.9 | — | 7.61.1 | — | 9.51.0 | 9.71.0 | — | 9.91.0 | 9.81.0 | — | — | — | — | — |
| 2015Y | Ib | 0.008172 | 57,113.62.2 | — | 23.33.0 | — | 23.93.0 | 25.53.0 | — | 23.92.8 | 26.63.0 | — | — | — | — | — |
| 2015ap | Ib | 0.011375 | 57,270.10.9 | — | 12.22.4 | — | 14.92.4 | 16.61.1 | — | 15.31.0 | 18.01.0 | — | — | — | — | — |
| 2016bau | Ib | 0.003856 | 57,452.41.0 | — | 22.11.2 | — | 25.31.1 | 25.51.1 | — | 25.71.1 | 27.01.1 | — | — | — | — | — |
| 2016gkg | IIb | 0.004940 | 57,644.40.8 | — | 24.91.1 | — | 26.41.1 | 27.30.9 | — | 28.14.0 | 28.34.0 | — | — | — | — | — |
| 2017ein | Ic | 0.002699 | 57,895.70.8 | — | 14.82.6 | — | 17.52.6 | 19.02.6 | — | 18.12.6 | 20.12.6 | — | — | — | — | — |
| Literature sample. | ||||||||||||||||
| 2004dk | Ib | 0.005247 | 53,213.90.7 | — | — | — | 24.71.9 | 27.71.9 | — | — | — | — | — | — | — | — |
| 2004ex | IIb | 0.017549 | 53,281.71.0 | 22.91.7 | 23.91.7 | 24.31.7 | 25.41.1 | — | 26.51.1 | — | — | 28.41.1 | 32.11.0 | 27.51.0 | 30.31.0 | — |
| 2004fe | Ic | 0.017896 | 53,302.61.2 | 11.91.3 | 13.31.6 | 13.92.1 | 15.11.6 | 16.71.7 | 16.61.4 | — | — | 18.01.3 | — | — | — | — |
| 2004gv | Ib | 0.019927 | 53,343.90.9 | 19.21.1 | 20.61.1 | 20.61.1 | 21.91.6 | — | 23.71.6 | — | — | 25.71.4 | 26.90.9 | 26.80.9 | 32.10.9 | — |
| 2005hg | Ib | 0.021308 | 53,659.43.2 | 19.93.2 | 21.53.2 | — | 23.13.2 | 25.03.4 | 25.13.2 | — | — | 27.33.2 | — | 32.33.2 | 33.63.2 | 35.83.2 |
| 2006T | IIb | 0.008092 | 53,762.71.1 | 15.51.5 | 16.31.2 | 16.61.5 | 17.71.3 | — | 18.51.3 | — | — | 19.81.3 | 20.71.1 | 21.61.1 | 23.82.0 | — |
| 2007Y | Ib | 0.004637 | 54,142.42.0 | 18.92.1 | 19.92.1 | 20.52.1 | 21.92.1 | — | 23.32.1 | — | — | 24.12.3 | 23.32.0 | 25.22.0 | 24.52.3 | — |
| 2008D | Ib | 0.006494 | 54,468.90.9 | — | 22.23.7 | — | 23.93.3 | — | 24.73.7 | — | — | 25.51.0 | — | — | — | — |
| 2009bb | Ic | 0.009877 | 54,909.61.0 | 9.11.4 | 10.31.4 | 11.52.7 | 12.92.7 | — | 13.92.7 | — | — | 14.92.7 | 20.21.0 | 18.51.0 | 17.51.0 | — |
| 2009iz | Ib | 0.014196 | 55,077.31.1 | — | 28.21.2 | — | 31.02.8 | — | 33.12.8 | — | — | 36.31.3 | — | 42.91.1 | 47.11.1 | 45.31.1 |
Using the estimated first-light time along with the peak time derived above (see Sec. 4.2), one can measure the rise time after correcting for the redshift. Table 3 gives the first-light time, peak time, and rise time for the SESNe in our sample. The rise times for different bands are calculated separately when different peak times are available. In addition, we collect the infrared peak time in the , , , and filters for those SNe that are also presented by Bianco et al. (2014) or Taddia et al. (2018), in order to derive the rise time in infrared bands. Ten additional SESNe are added to the rise-time sample for this analysis; they are taken from the samples published by Drout et al. (2011), Bianco et al. (2014), Stritzinger et al. (2018a), and Taddia et al. (2018), and are listed at the bottom of Table 3.
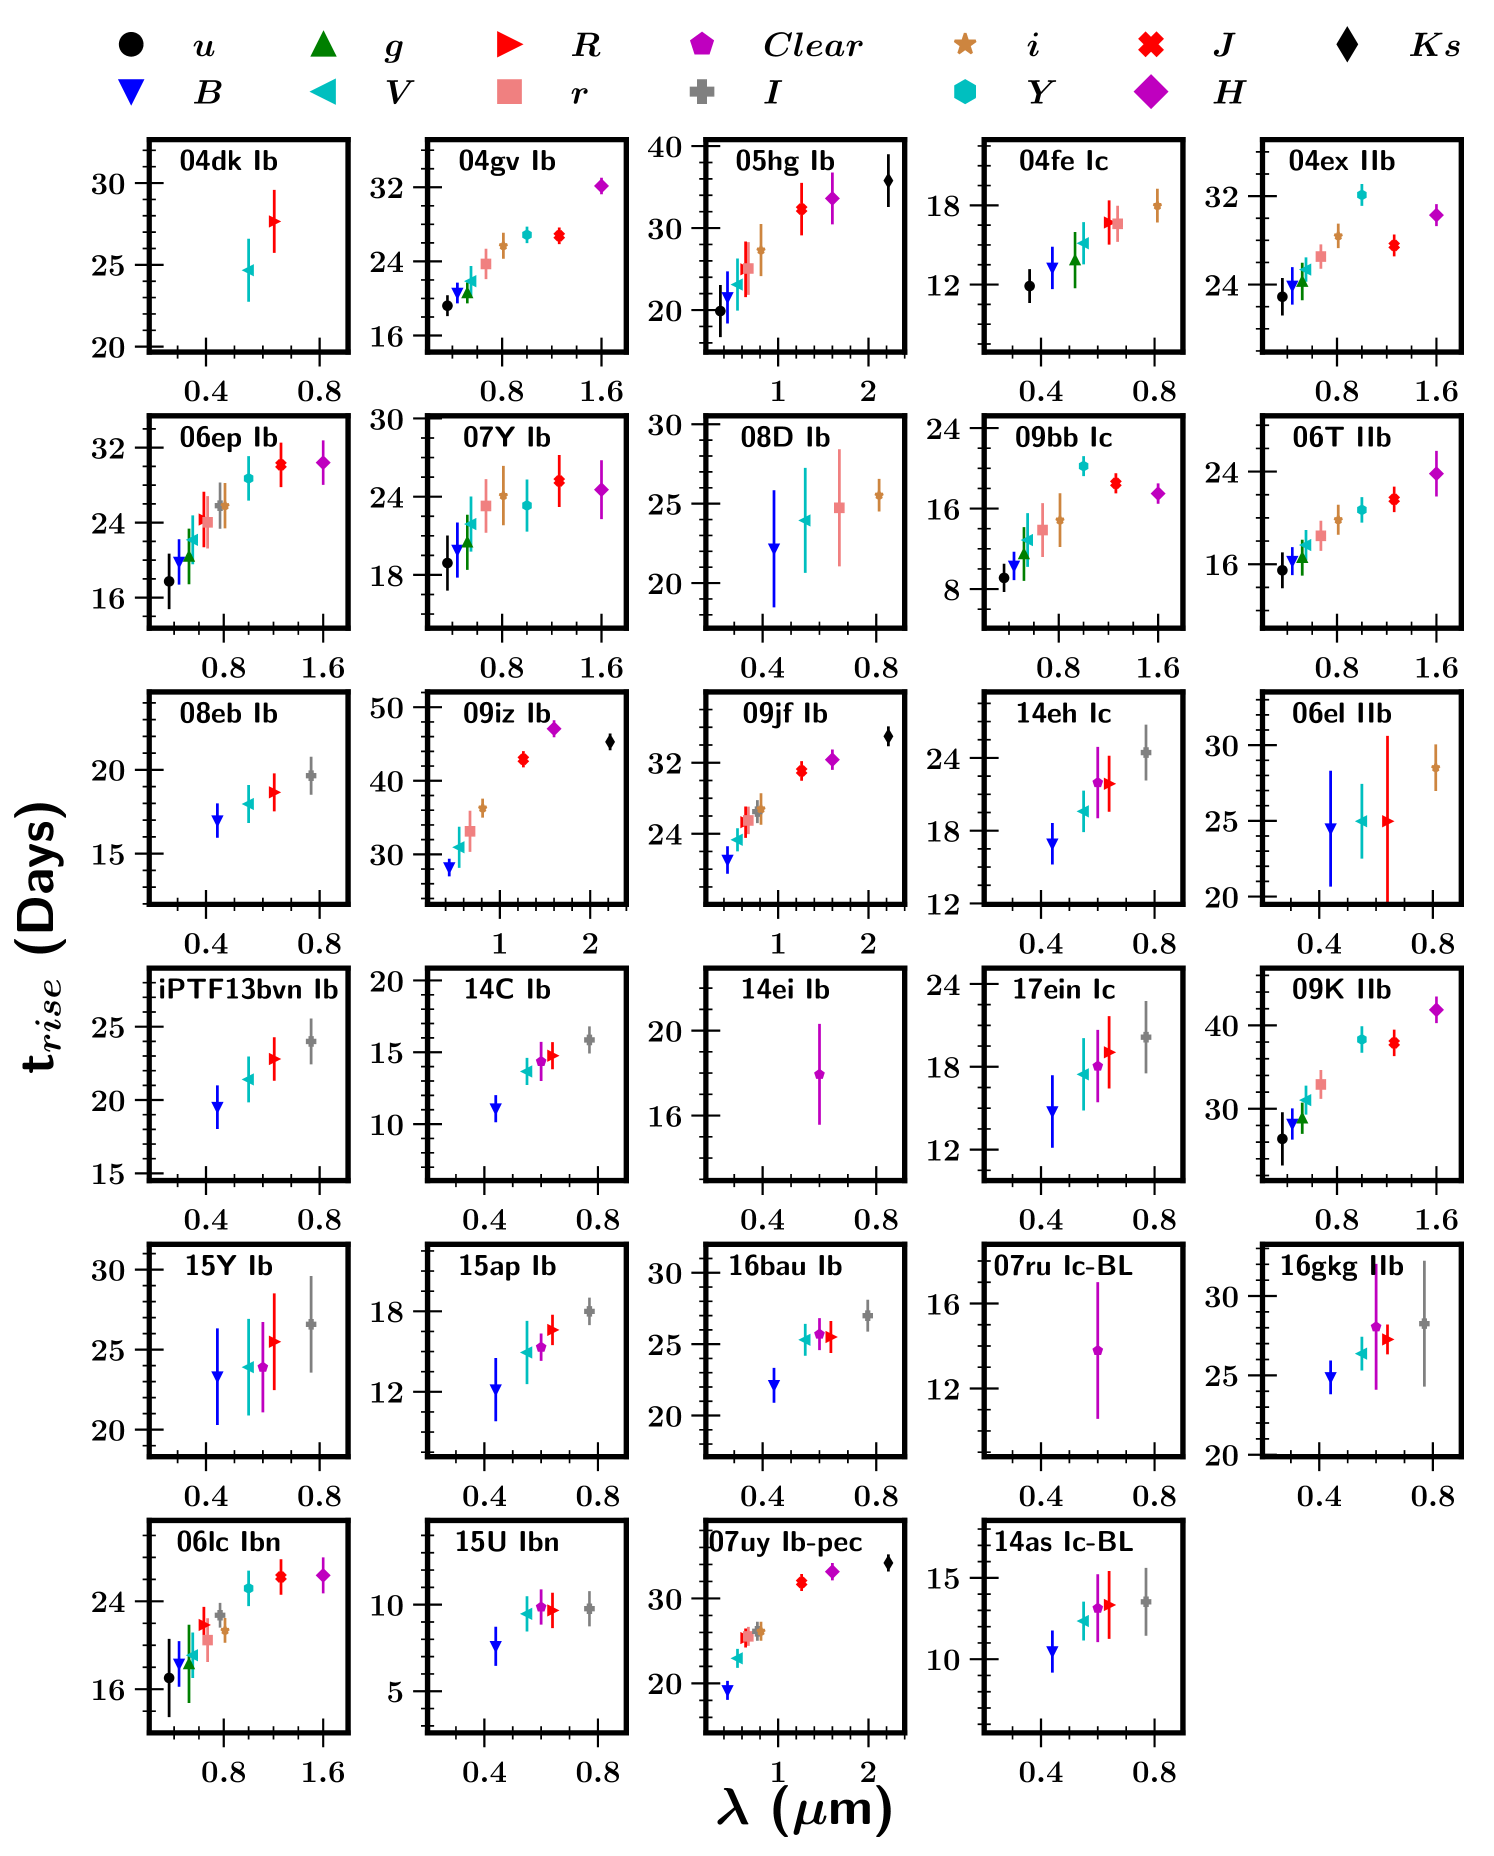
Figure 8 displays the rise time as a function of the effective wavelengths for different bands using all available fitting results for our sample. This figure is similar to Figure 10 of Taddia et al. (2015) and Figure 3 of Taddia et al. (2018). However, note that Taddia et al. (2015) use the explosion time — defined as the average between the epochs of last nondetection and first detection — instead of the first-light time, and Taddia et al. (2018) use the offset of peak time in different filters relative to the -band peak time in their Figure 10. Consequently, we claim that the first-light times and rise times presented herein are the first true measurements of such for a large sample of SESNe. Also for the first time, we measure accurate rise times of a large sample of SESNe in infrared bands. These measurements are important for understanding the explosion properties of SESNe (see Sec. 4.6).
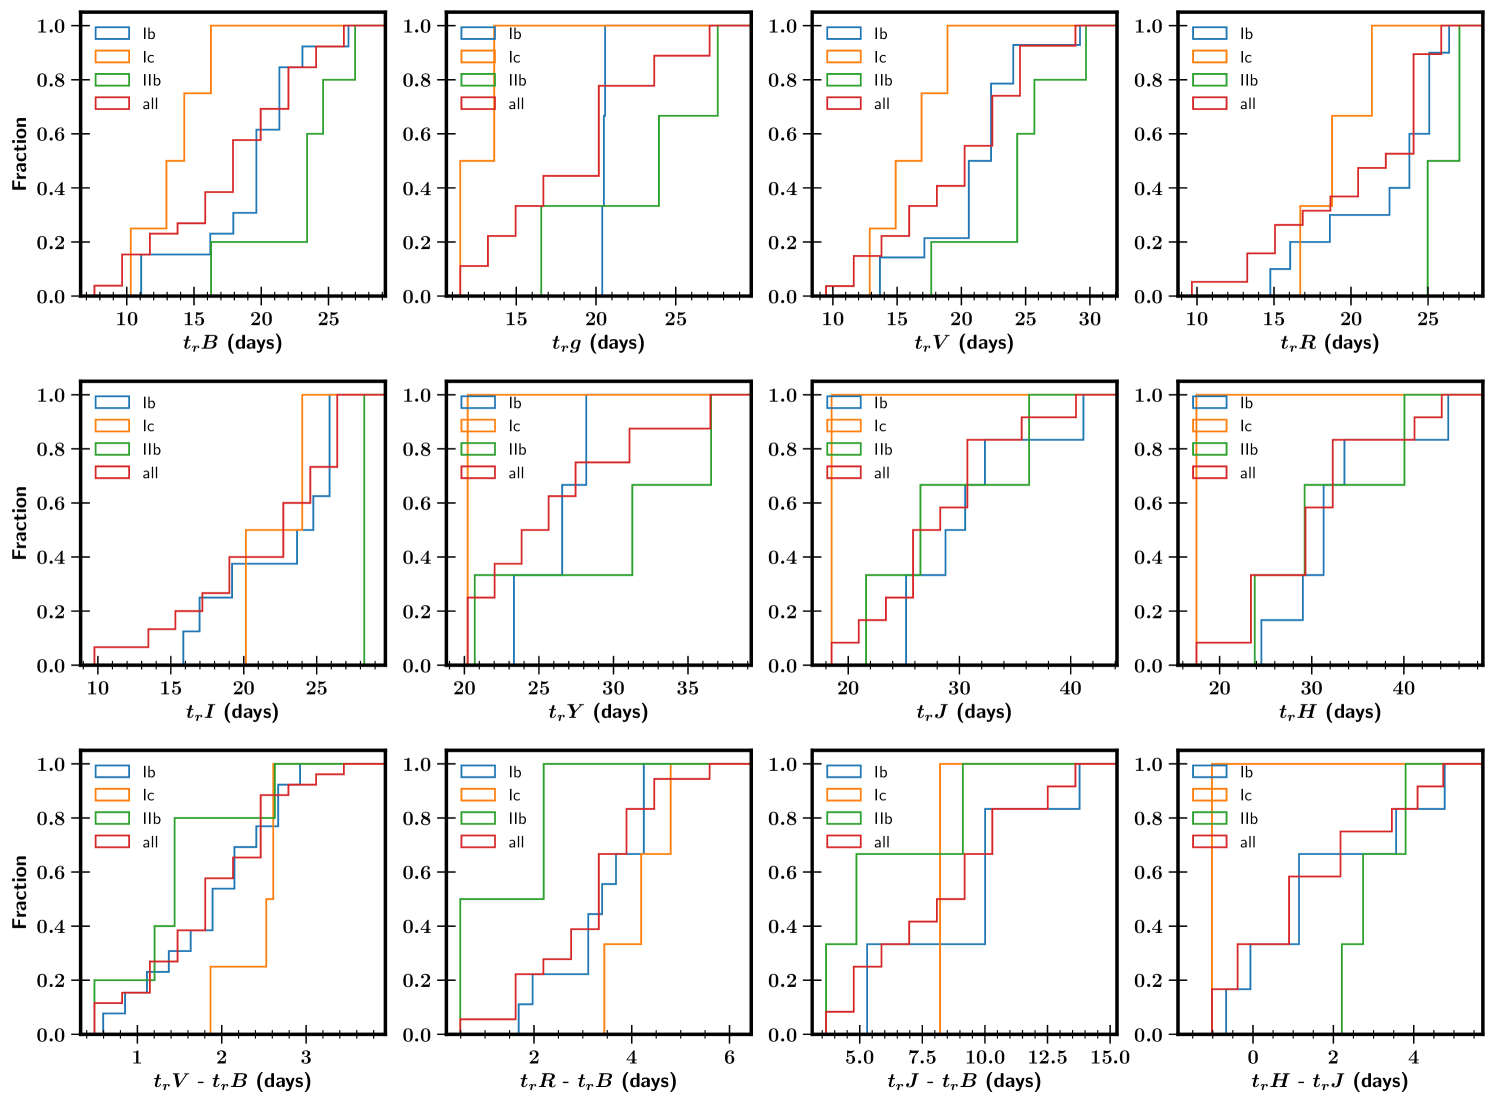
As can be seen in Figure 8, the rise time is generally longer in red filters than it is in blue filters, confirming the similar result found by Bianco et al. (2014), Taddia et al. (2015), and Taddia et al. (2018). The rise time in infrared bands is typically a factor of longer than in blue bands ( or ). The rise times in different subtypes of SNe also show differences, which we visualise via the cumulative distribution of the rise time for each subgroup consisting of SNe Ib, Ic, and IIb in Figure 9. A Kolmogorov-Smirnov (K-S) test comparing SNe Ib and SNe Ic in the band gives a -value of 0.013, showing a significant difference between the two populations, and an analogous K-S test between SNe IIb and SNe Ib in the band gives a -value of 0.025 — also showing a significant difference between the two populations. We find that the average rise time for SNe IIb, Ib, and Ic are 23.5, 19.9, and 13.8 d (respectively) in the band, and 26.1, 22.6, and 19.2 d (respectively) in the band. It is obvious that for almost all bands, SNe IIb have the longest rise times, while SNe Ic have the shortest, consistent with the findings of Valenti et al. (2011), Taddia et al. (2015), and Taddia et al. (2018). We also notice that the different rise times between each SN subtype are less clear in infrared bands compared to optical bands, though we caution that the infrared sample is much smaller.
The bottom row in Figure 9 shows the difference between rise times in the selected two bands. Typically, SNe Ic take more time for redder bands to reach peak after -band peak compared with SNe IIb, opposite to the aforementioned rise-time relations.
4.6 Light-curve fitting and modeling
| Parameter | Definition | Unit | Posterior |
| 56Ni model | |||
| ejecta mass | M⊙ | ||
| ejecta velocity | cm s-1 | ||
| 56Ni mass | M⊙ | ||
| gamma-ray opacity of 56Ni-cascade-decay photons | cm2 g-1 | ||
| temperature floor of the photosphere | 103 K | ||
| explosion time relative to the first data | days | ||
| Cooling model with three additional parameters compared to the 56Ni model. | |||
| envelope mass | M⊙ | ||
| envelope radius | cm | ||
| energy passed into the envelope from SN core | erg s-1 | ||
| Magnetar model with three different parameters compared to the 56Ni model, but dropped and . | |||
| initial period of the magnetar | ms | ||
| magnetic field strength of the magnetar | G | ||
| gamma-ray opacity of magnetar photons | cm2 g-1 | ||
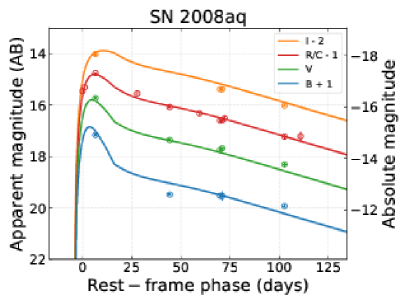
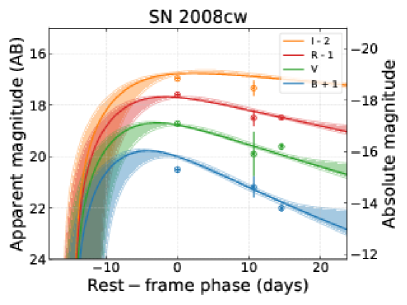
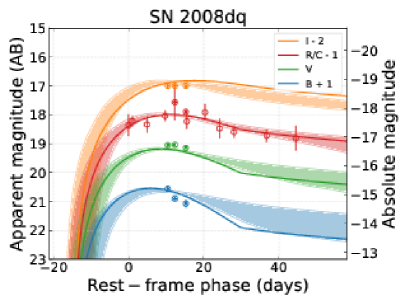
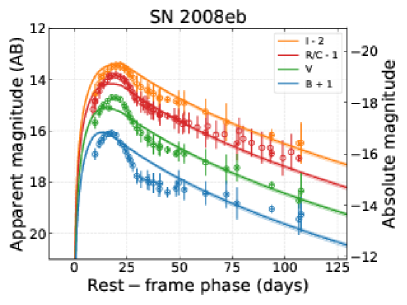
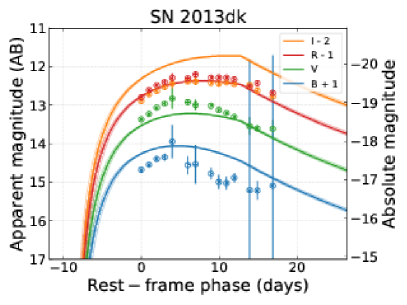
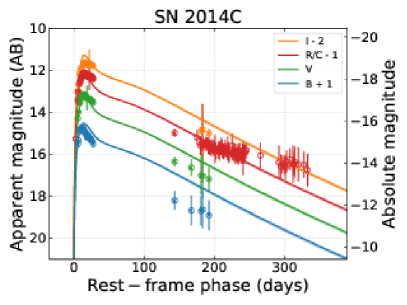
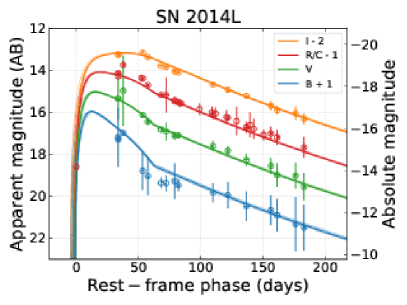
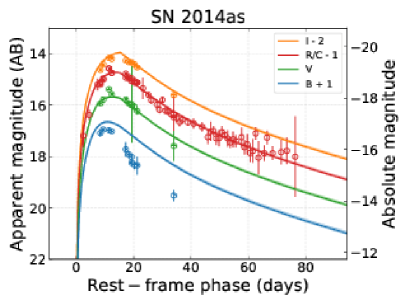
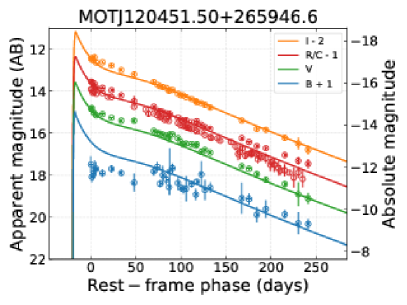
To further study the physical properties of the SESNe in our sample, we model the multiband light curves using the 56Ni model subject to the following assumptions: (i) the bolometric luminosities of the photospheres of the SNe are powered by 56Ni cascade decay (Arnett, 1982; Chatzopoulos et al., 2012; Wang et al., 2015), (ii) the spectral energy distributions of the SNe can be described by the blackbody or ultraviolet-absorbed blackbody function (see Nicholl et al. 2017, and references therein), and (iii) the velocities of the SN photospheres are constant at early times, and the radii of the photospheres are determined by the bolometric luminosities and the temperature at the late epochs when the temperature no longer changes (see, e.g., Eqs. 8 and 9 of Nicholl et al. 2017). We do not consider the case of interactions with dense circumstellar material, which usually make the light curves flattened at late times and are more likely related to Type IIn SNe, while the light curves in our sample do not show enough evidence for such cases. The definitions, units, and prior ranges of the free parameters of the 56Ni model are given in Table 4, where the prior is uniformly sampled either linearly or in log space over the range. We employ a Markov Chain Monte Carlo (MCMC) method via the emcee Python package (Foreman-Mackey et al., 2013) to get the best-fit parameters and confidence ranges of the fitted parameters.
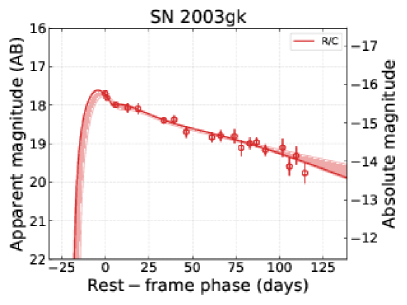
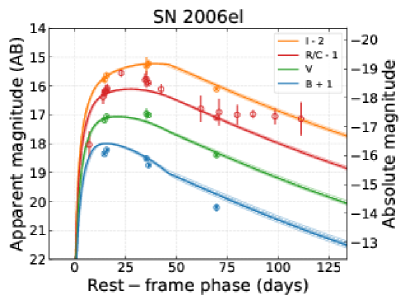
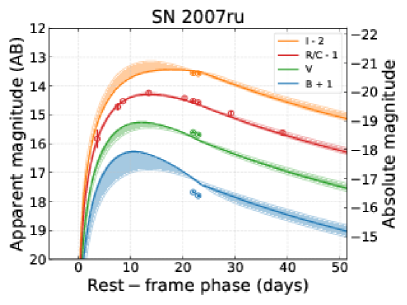
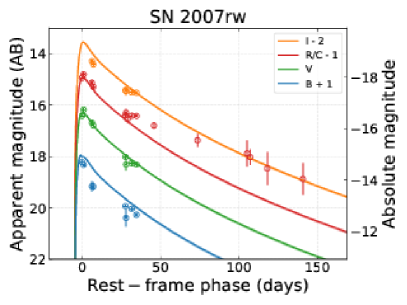
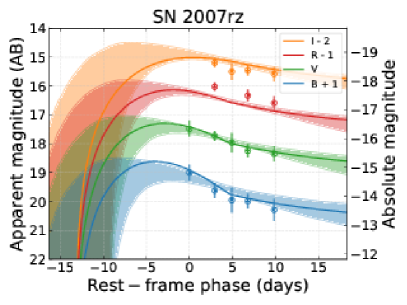
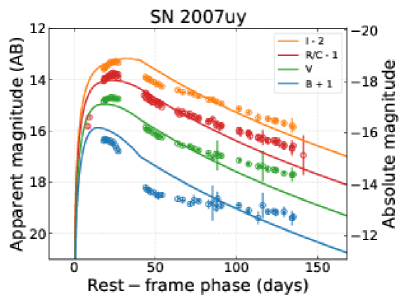
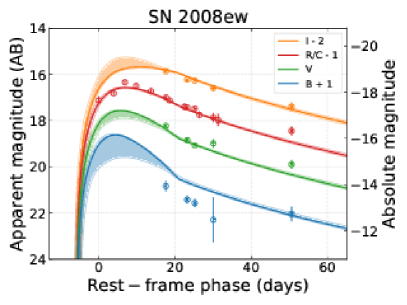
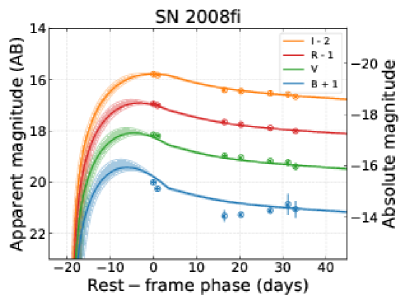
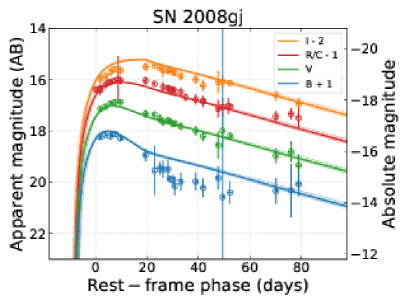
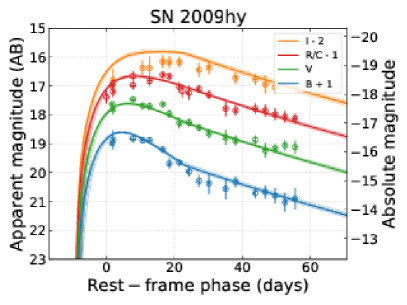
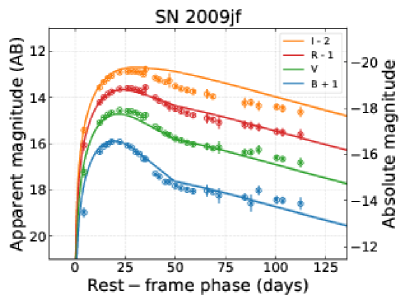
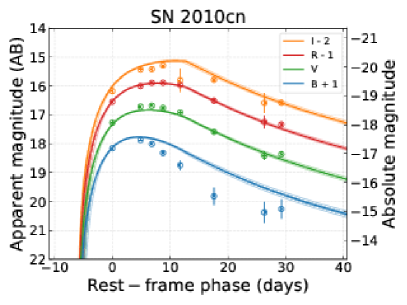
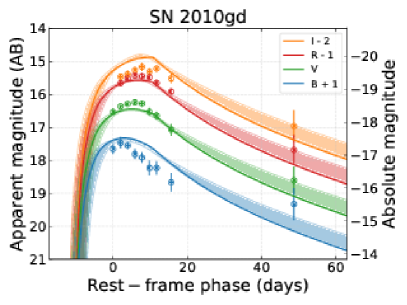
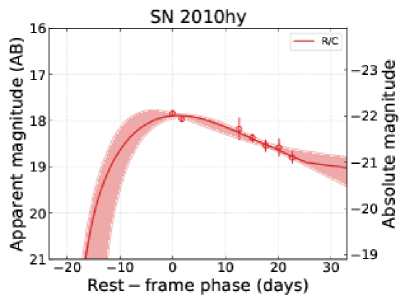
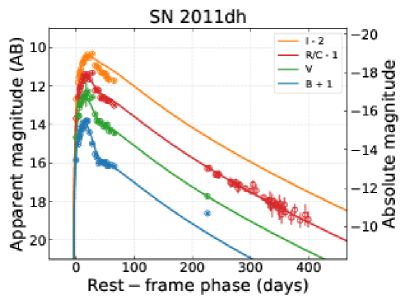
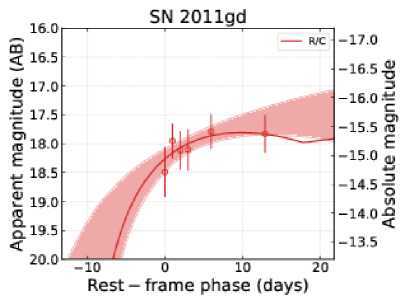
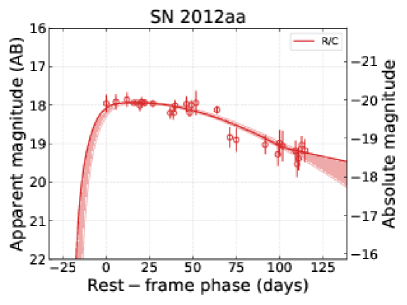
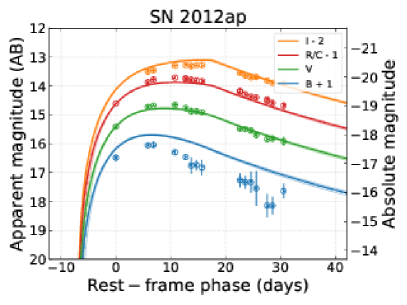
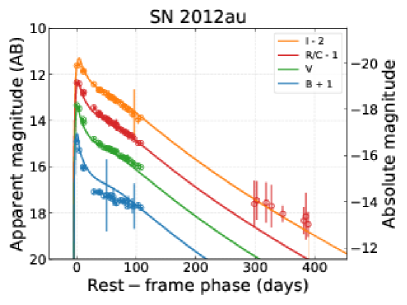
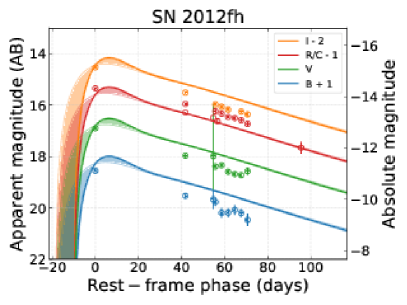
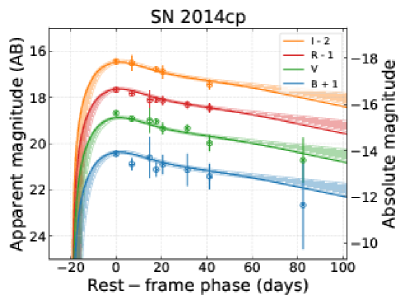
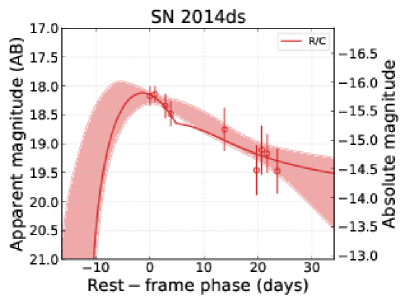
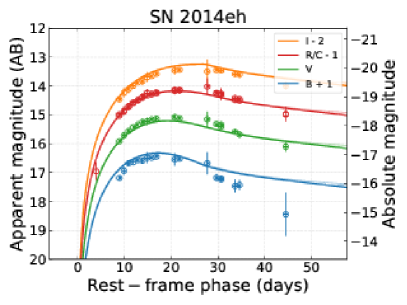
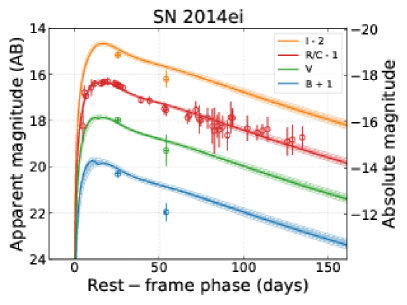
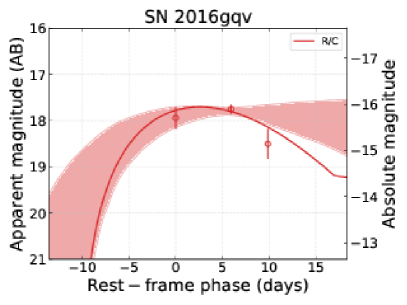
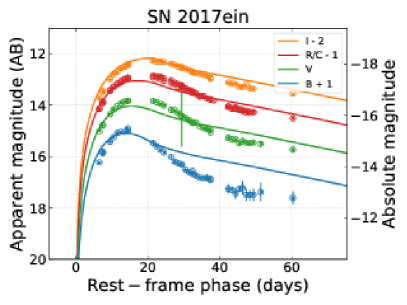
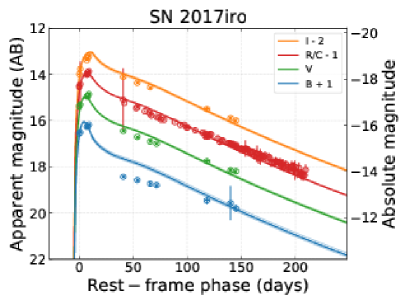
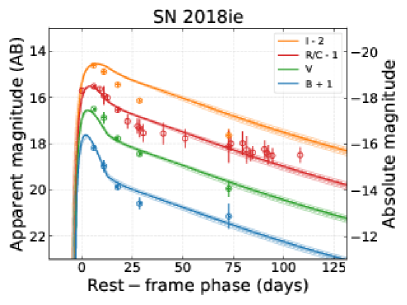
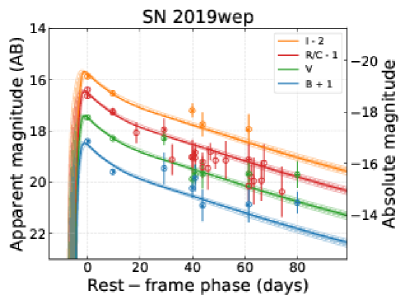
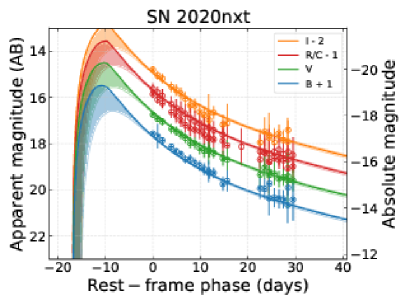
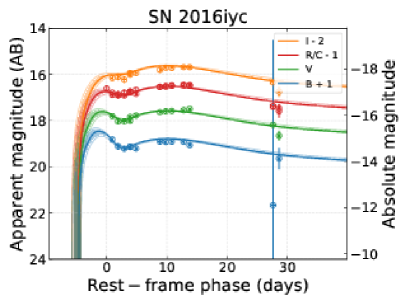
The 56Ni model-fitting results for all SESNe in our sample are shown in Figure 12, except SN 2009C for which there is not enough data to meaningfully constrain the fitting. The best-fitted parameter values are given in Table 5, where we also list in parentheses the median values for comparison. As one can see, for most of the SNe, though the -band fitting deviates more than other filters for some cases, our 56Ni model can fit the general observed light curves with reasonable physical parameters.
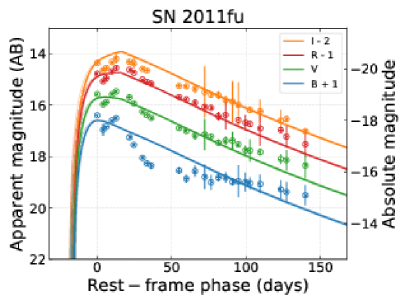
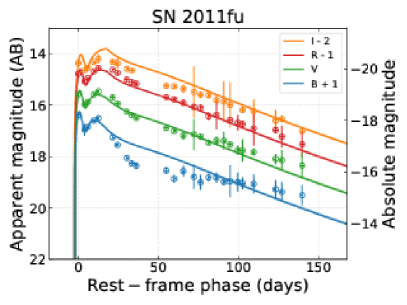
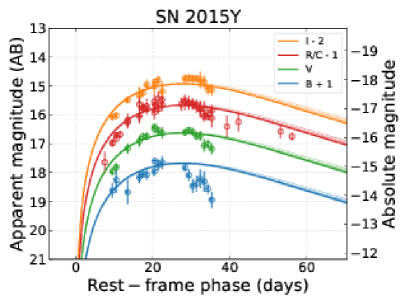
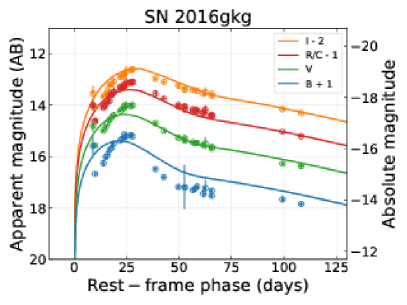
However, for a group of SNe with double peaks or rebrightening after initial fading (including SNe 2011fu, 2015Y, 2016gkg, and 2016iyc), our simple 56Ni model fails to adequately fit the early-time initial decay. In these cases, we therefore adopt an additional cooling component and refit the light curve. The new cooling plus 56Ni model contains three additional parameters: (i) the mass of the extended envelope (), (ii) the radius of the extended envelope (), and (iii) the energy passed into the extended envelope () from the SN core (Piro et al., 2021). The cooling plus 56Ni model can better fit the light curves as shown in Figure 13, and the new fitting results are given in Table 6.
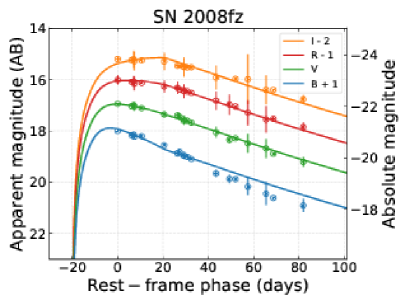
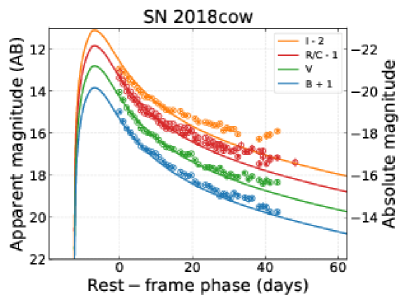
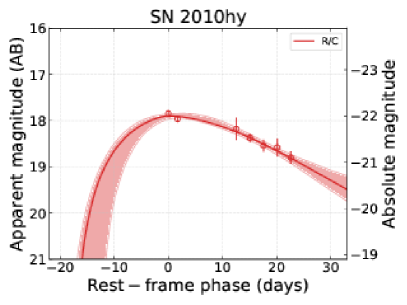
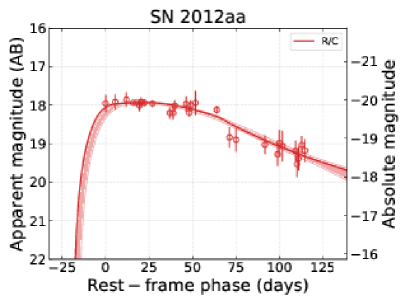
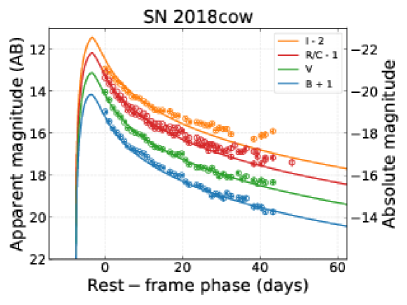
For another group of four SNe (including SNe 2008fz, 2010hy, 2012aa, and 2018cow), the 56Ni model results suggest extremely high 56Ni masses, some even higher than the ejecta mass, which is clearly unphysical. For these four luminous or superluminous SNe, we therefore adopt the magnetar model (Kasen & Bildsten, 2010; Woosley, 2010; Chatzopoulos et al., 2012; Wang et al., 2015; Dai et al., 2016) to refit the light curves. Three new parameters are included compared to the 56Ni model (also listed in Table 5): the initial period (), the magnetic field strength of the magnetar (), and the gamma-ray opacity of magnetar photons (). The magnetar model fitting is shown in Figure 14. and the results are given in Table 7. Compared to the 56Ni model, the magnetar model provides comparable fitting results for the light curves, but with more reasonable physical parameters, indicating that a small fraction of SESNe may be powered by central magnetars888Note that we cannot exclude the possibility of a hidden (fainter) magnetar in other SESNe, but those SESNe do not require the fainter magnetar in the model fitting..
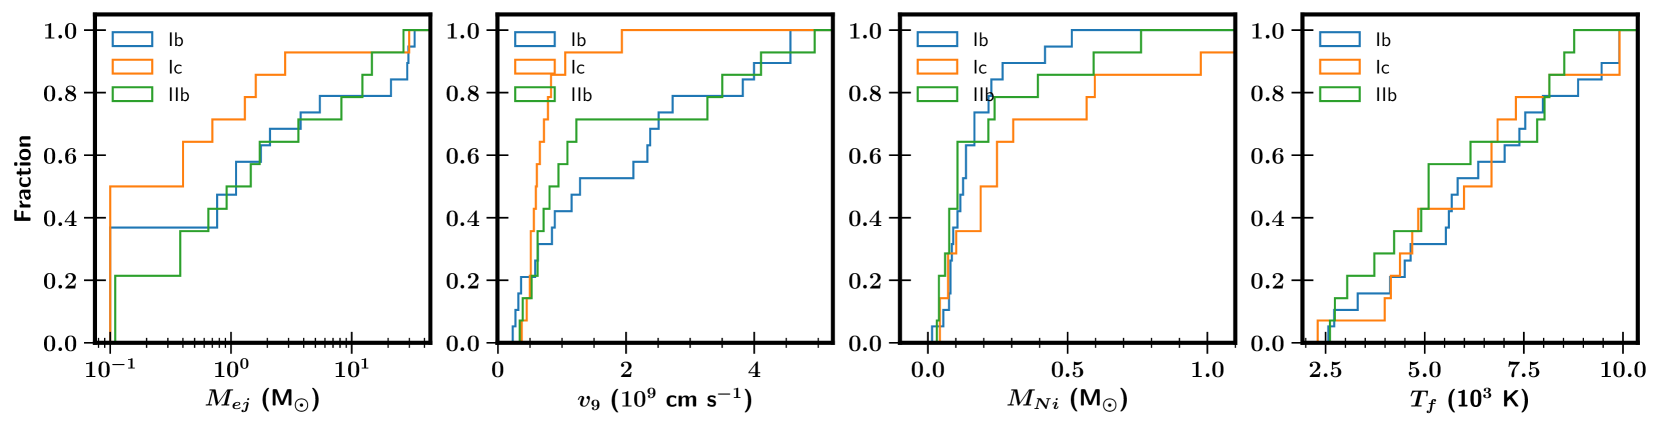
To summarise, Figure 10 shows the cumulative distribution of the four parameters (, , , and ) from the model fitting. We find that SNe Ic tend to have lower ejecta masses and also slower ejecta velocities, on average, compared to SNe Ib and SNe IIb. On the other hand, the 56Ni mass of SNe Ic tends to be higher than in SNe Ib and SNe IIb, consistent with the findings Of Prentice et al. (2016) (see Table 10 in the paper). Anderson (2019) reached a similar conclusion (see Table 1 in their paper) that SNe Ic have higher 56Ni mass than SNe IIb, though their estimate of the 56Ni mass for SNe Ib is comparable to that of SNe Ic. The temperature floor of the photosphere distribution shows no significant difference between different subtypes.
5 Conclusion
In this paper, we have presented multiband (, along with some Clear) light curves of a large sample of SESNe observed by the KAIT and Nickel telescopes at Lick Observatory under the LOSS follow-up program from 2003 through 2020. Our data are processed in a homogeneous fashion, and here we publicly release all derived data products to the supernova community. Our main results are as follows.
(i) We significantly enlarge the SESN sample by adding 70 SESNe observed by LOSS.
(ii) We confirm that SESNe usually suffer moderately high extinction from their host galaxies. Quantitatively, we find a mean value of 0.32 mag, substantially higher than the MW extinction, and also higher than that of SN Ia and SN II samples.
(iii) The peak -band absolute magnitude of SESNe shows a wide range from mag to brighter than mag. SNe Ic-BL are more luminous than both SNe Ib and SNe Ic, and SNe Ic appear to be slightly brighter than SNe Ib.
(iv) SESNe exhibit smooth light-curve shapes with a –20 d rising phase before reaching maximum brightness, followed by a slow decay. A few SNe IIb show a decline dip at very early times before rising again, which can be attributed to the shock-breakout cooling tail.
(v) For the first time, we derive reliable, robust measurements of the rise times for a large sample of SESNe in both optical and infrared bands. Our results show that SESNe rise faster in blue bands than in red bands.
(vi) Helium-poor SNe (SNe Ic) rise to maximum faster than helium-rich SNe (SNe Ib and IIb). Average rise times for SNe IIb, Ib, and Ic are 23.5, 19.9, and 13.8 d (respectively) in the band, and 26.1, 22.6, and 19.2 d (respectively) in the band. K-S tests show significant differences between normal SNe Ib and SNe Ic, and also between SNe IIb and SNe Ib.
(vii) SNe Ic tend to have lower ejecta masses and also slower ejecta velocities, on average, compared to SNe Ib and SNe IIb, but with higher 56Ni mass.
Acknowledgements
We thank Jenifer Rene Gross and Alessondra Springmann for their effort in taking Lick/Nickel data. We are grateful to the staff at Lick Observatory for their assistance with the Nickel telescope and KAIT. KAIT and its ongoing operation were made possible by donations from Sun Microsystems, Inc., the Hewlett-Packard Company, Auto Scope Corporation, Lick Observatory, the National Science Foundation (NSF), the University of California, the Sylvia & Jim Katzman Foundation, and the TABASGO Foundation. Research at Lick Observatory is partially supported by a generous gift from Google.
Support for A.V.F.’s supernova group has been provided by the NSF, Marc J. Staley (whose fellowship partly funded B.E.S. whilst contributing to the work presented herein as a graduate student), the Richard and Rhoda Goldman Fund, the TABASGO Foundation, Gary and Cynthia Bengier (who provided financial support for T.deJ. via the Bengier Postdoctoral fellowship), the Christopher R. Redlich Fund, and the UC Berkeley Miller Institute for Basic Research in Science (in which A.V.F. was a Miller Senior Fellow at the time of this research). In addition, we greatly appreciate contributions from numerous individuals, including Charles Baxter and Jinee Tao, George and Sharon Bensch Greg and Patty Bernstein, Firmin Berta, Jack Bertges, Marc and Cristina Bensadoun, Greg and Patty Bernstein, Frank and Roberta Bliss, Ann and Gordon Brown, Eliza Brown and Hal Candee, Kathy Burck and Gilbert Montoya, Alan and Jane Chew, Christopher Cook, David and Linda Cornfield, Michael Danylchuk, Robert Davenport, Jim and Hildy DeFrisco, Alli and Byron Deeter, Tim and Melissa Draper, William and Phyllis Draper, Luke Ellis and Laura Sawczuk, Jim Erbs and Shan Atkins, Alan Eustace and Kathy Kwan, Art and Cindy Folker, Peter and Robin Frazier, David Friedberg, Harvey Glasser, Charles and Gretchen Gooding, Alan Gould and Diane Tokugawa, Richard Gregor, Thomas and Dana Grogan, Timothy and Judi Hachman Michael and Virginia Halloran, Gregory Hirsch and Kathy Long, Alan and Gladys Hoefer, Jerry and Patti Hume, Charles and Patricia Hunt, Stephen and Catherine Imbler, Adam and Rita Kablanian, Heidi Gerster Kikawada, Roger and Jody Lawler, Arthur and Rita Levinson, Jesse Levinson, Kenneth and Gloria Levy, Greg Losito and Ronnie Bayduza, Walter and Karen Loewenstern, Peter Maier, DuBose and Nancy Montgomery, Rand Morimoto and Ana Henderson, Sunil Nagaraj and Mary Katherine Stimmler, Peter and Kristan Norvig, James and Marie O’Brient, Emilie and Doug Ogden, Paul and Sandra Otellini, Margaret Renn, Robina Riccitiello, Leslie Roberts, Jeanne and Sanford Robertson, Paul Robinson, Eric Rudney, Sissy Sailors and Red Conger, Geraldine and David Sandor, Tom and Cathy Saxton, Stanley and Miriam Schiffman, Thomas and Alison Schneider, Ajay Shah and Lata Krishnan, Alex and Irina Shubat, Silicon Valley Community Foundation, Bruce and Debby Smith, Mary-Lou Smulders and Nicholas Hodson, Hans Spiller, Alan and Janet Stanford, Richard and Shari Stegman, Hugh Stuart Center Charitable Trust, Toby Stuart, Gerald and Virginia Weiss, Clark and Sharon Winslow, Ron and Geri Wohl, Weldon and Ruth Wood, David and Angie Yancey, Tom Zdeblick, and many others. X.G.W. is supported by the National Natural Science Foundation of China (NSFC grant 11673006) and the Guangxi Science Foundation (grants 2016GXNSFFA380006 and 2017AD22006).
This research has made use of the NASA/IPAC Extragalactic Database (NED), which is operated by the Jet Propulsion Laboratory, California Institute of Technology, under contract with NASA. The Pan-STARRS1 Surveys (PS1) and the PS1 public science archive have been made possible through contributions by the Institute for Astronomy, the University of Hawaii, the Pan-STARRS Project Office, the Max-Planck Society and its participating institutes, the Max Planck Institute for Astronomy, Heidelberg and the Max Planck Institute for Extraterrestrial Physics, Garching, The Johns Hopkins University, Durham University, the University of Edinburgh, the Queen’s University Belfast, the Harvard-Smithsonian Center for Astrophysics, the Las Cumbres Observatory Global Telescope Network Incorporated, the National Central University of Taiwan, the Space Telescope Science Institute, NASA under grant NNX08AR22G issued through the Planetary Science Division of the NASA Science Mission Directorate, the National Science Foundation grant AST-1238877, the University of Maryland, Eotvos Lorand University (ELTE), the Los Alamos National Laboratory, and the Gordon and Betty Moore Foundation. Funding for the Sloan Digital Sky Survey (SDSS) has been provided by the Alfred P. Sloan Foundation, the Participating Institutions, NASA, the NSF, the U.S. Department of Energy, the Japanese Monbukagakusho, and the Max Planck Society. The SDSS Web site is http://www.sdss.org/. The SDSS is managed by the Astrophysical Research Consortium (ARC) for the Participating Institutions. The Participating Institutions are The University of Chicago, Fermilab, the Institute for Advanced Study, the Japan Participation Group, The Johns Hopkins University, Los Alamos National Laboratory, the Max-Planck-Institute for Astronomy (MPIA), the Max-Planck-Institute for Astrophysics (MPA), New Mexico State University, University of Pittsburgh, Princeton University, the United States Naval Observatory, and the University of Washington.
Availability of data
The data underlying this article are available in the article and in its online supplementary material.
References
- Anderson (2019) Anderson J. P., 2019, A&A, 628, A7
- Arnett (1982) Arnett W. D., 1982, ApJ, 253, 785
- Bazin et al. (2011) Bazin G., et al., 2011, A&A, 534, A43
- Bianco et al. (2014) Bianco F. B., et al., 2014, ApJS, 213, 19
- Burns et al. (2011) Burns C. R., et al., 2011, AJ, 141, 19
- Cardelli et al. (1989) Cardelli J. A., Clayton G. C., Mathis J. S., 1989, ApJ, 345, 245
- Chatzopoulos et al. (2012) Chatzopoulos E., Wheeler J. C., Vinko J., 2012, ApJ, 746, 121
- Conti (1975) Conti P. S., 1975, Memoires of the Societe Royale des Sciences de Liege, 9, 193
- Dai et al. (2016) Dai Z. G., Wang S. Q., Wang J. S., Wang L. J., Yu Y. W., 2016, ApJ, 817, 132
- de Jaeger et al. (2019) de Jaeger T., et al., 2019, MNRAS, 490, 2799
- Drake et al. (2010) Drake A. J., et al., 2010, ApJ, 718, L127
- Drout et al. (2011) Drout M. R., et al., 2011, ApJ, 741, 97
- Eldridge et al. (2013) Eldridge J. J., Fraser M., Smartt S. J., Maund J. R., Crockett R. M., 2013, MNRAS, 436, 774
- Filippenko (1988) Filippenko A. V., 1988, AJ, 96, 1941
- Filippenko (1997) Filippenko A. V., 1997, ARA&A, 35, 309
- Filippenko et al. (1993) Filippenko A. V., Matheson T., Ho L. C., 1993, ApJ, 415, L103
- Filippenko et al. (2001) Filippenko A. V., Li W. D., Treffers R. R., Modjaz M., 2001, in Paczynski B., Chen W.-P., Lemme C., eds, Astronomical Society of the Pacific Conference Series Vol. 246, IAU Colloq. 183: Small Telescope Astronomy on Global Scales. p. 121
- Foley et al. (2007) Foley R. J., Smith N., Ganeshalingam M., Li W., Chornock R., Filippenko A. V., 2007, ApJ, 657, L105
- Foreman-Mackey et al. (2013) Foreman-Mackey D., Hogg D. W., Lang D., Goodman J., 2013, PASP, 125, 306
- Fraser et al. (2021) Fraser M., et al., 2021, arXiv e-prints, p. arXiv:2108.07278
- Gal-Yam (2017) Gal-Yam A., 2017, Observational and Physical Classification of Supernovae. p. 195, doi:10.1007/978-3-319-21846-5_35
- Gal-Yam et al. (2014) Gal-Yam A., et al., 2014, Nature, 509, 471
- Gal-Yam et al. (2021) Gal-Yam A., et al., 2021, arXiv e-prints, p. arXiv:2111.12435
- Ganeshalingam et al. (2010) Ganeshalingam M., Li W., Filippenko A. V., et al., 2010, ApJS, 190, 418
- Hosseinzadeh et al. (2017) Hosseinzadeh G., et al., 2017, ApJ, 836, 158
- Kasen & Bildsten (2010) Kasen D., Bildsten L., 2010, ApJ, 717, 245
- Kelly et al. (2008) Kelly P. L., Kirshner R. P., Pahre M., 2008, ApJ, 687, 1201
- Landolt (1983) Landolt A. U., 1983, AJ, 88, 439
- Landolt (1992) Landolt A. U., 1992, AJ, 104, 340
- Lang et al. (2010) Lang D., Hogg D. W., Mierle K., Blanton M., Roweis S., 2010, AJ, 139, 1782
- Li et al. (2003) Li W., Filippenko A. V., Chornock R., Jha S., 2003, PASP, 115, 844
- Li et al. (2011) Li W., Leaman J., Chornock R., et al., 2011, MNRAS, 412, 1441
- Matheson (2001) Matheson T., 2001, PASP, 113, 1155
- Modjaz et al. (2014) Modjaz M., et al., 2014, AJ, 147, 99
- Nicholl et al. (2017) Nicholl M., Guillochon J., Berger E., 2017, ApJ, 850, 55
- Pastorello et al. (2007) Pastorello A., et al., 2007, Nature, 447, 829
- Pastorello et al. (2021) Pastorello A., et al., 2021, Transient Name Server AstroNote, 71, 1
- Perley et al. (2021) Perley D. A., et al., 2021, arXiv e-prints, p. arXiv:2111.12110
- Piro et al. (2021) Piro A. L., Haynie A., Yao Y., 2021, ApJ, 909, 209
- Podsiadlowski et al. (1992) Podsiadlowski P., Joss P. C., Hsu J. J. L., 1992, ApJ, 391, 246
- Poznanski et al. (2011) Poznanski D., Ganeshalingam M., Silverman J. M., Filippenko A. V., 2011, MNRAS, 415, L81
- Poznanski et al. (2012) Poznanski D., Prochaska J. X., Bloom J. S., 2012, MNRAS, 426, 1465
- Prentice et al. (2016) Prentice S. J., et al., 2016, MNRAS, 458, 2973
- Sana et al. (2012) Sana H., et al., 2012, Science, 337, 444
- Schlafly & Finkbeiner (2011) Schlafly E. F., Finkbeiner D. P., 2011, ApJ, 737, 103
- Shivvers et al. (2019) Shivvers I., et al., 2019, MNRAS, 482, 1545
- Smartt et al. (2009) Smartt S. J., Eldridge J. J., Crockett R. M., Maund J. R., 2009, MNRAS, 395, 1409
- Smith & Owocki (2006) Smith N., Owocki S. P., 2006, ApJ, 645, L45
- Srivastav et al. (2020) Srivastav S., Smartt S. J., McBrien O., Smith K. W., Young D. R., Gillanders J., 2020, Transient Name Server Classification Report, 2020-2148, 1
- Stahl et al. (2019) Stahl B. E., et al., 2019, MNRAS, 490, 3882
- Stahl et al. (2020) Stahl B. E., Martínez-Palomera J., Zheng W., de Jaeger T., Filippenko A. V., Bloom J. S., 2020, MNRAS, 496, 3553
- Stetson (1987) Stetson P. B., 1987, PASP, 99, 191
- Stritzinger et al. (2005) Stritzinger M., Suntzeff N. B., Hamuy M., Challis P., Demarco R., Germany L., Soderberg A. M., 2005, PASP, 117, 810
- Stritzinger et al. (2018a) Stritzinger M. D., et al., 2018a, A&A, 609, A134
- Stritzinger et al. (2018b) Stritzinger M. D., et al., 2018b, A&A, 609, A135
- Taddia et al. (2015) Taddia F., et al., 2015, A&A, 574, A60
- Taddia et al. (2018) Taddia F., et al., 2018, A&A, 609, A136
- Tonry et al. (2012) Tonry J. L., et al., 2012, ApJ, 750, 99
- Valenti et al. (2011) Valenti S., et al., 2011, MNRAS, 416, 3138
- van Dyk et al. (1996) Van Dyk S. D., Hamuy M., Filippenko A. V., 1996, AJ, 111, 2017
- Wang et al. (2015) Wang S. Q., Wang L. J., Dai Z. G., Wu X. F., 2015, ApJ, 807, 147
- Woosley (2010) Woosley S. E., 2010, ApJ, 719, L204
- Woosley & Bloom (2006) Woosley S. E., Bloom J. S., 2006, ARA&A, 44, 507
- Zheng & Filippenko (2017) Zheng W., Filippenko A. V., 2017, ApJ, 838, L4
- Zheng et al. (2017) Zheng W., Kelly P. L., Filippenko A. V., 2017, ApJ, 848, 66
Appendix A Online Supplementary

| Name | /dof | ||||||
|---|---|---|---|---|---|---|---|
| (M⊙) | ( cm s-1) | (M⊙) | cm2 g-1 | ( K) | (days) | ||
| SN 2003gk | 0.45 (0.63 ) | ||||||
| SN 2006el | — | 6.18 (6.24 ) | |||||
| SN 2006ep | — | 11.38 (11.40) | |||||
| SN 2006jc | 104.49 (104.72) | ||||||
| SN 2006lc | — | 2.75 (2.86 ) | |||||
| SN 2007C | 9.94 (9.96 ) | ||||||
| SN 2007D | — | ||||||
| SN 2007ag | 2.13 (2.20 ) | ||||||
| SN 2007cl | 6.96 (7.02 ) | ||||||
| SN 2007kj | 2.08 (2.17 ) | ||||||
| SN 2007ru | — | 38.59 (39.35) | |||||
| SN 2007rw | 33.39 (33.47) | ||||||
| SN 2007rz | 1.45 (1.80 ) | ||||||
| SN 2007uy | — | 61.42 (61.43) | |||||
| SN 2008aq | 34.25 (34.25) | ||||||
| SN 2008cw | 7.46 (7.85 ) | ||||||
| SN 2008dq | 2.63 (3.16 ) | ||||||
| SN 2008eb | — | 3.01 (3.02 ) | |||||
| SN 2008ew | 4.91 (5.12 ) | ||||||
| SN 2008fi | 8.63 (8.76 ) | ||||||
| SN 2008fz | 7.10 (7.12 ) | ||||||
| SN 2008gj | 2.92 (2.93 ) | ||||||
| SN 2009K | — | 8.47 (8.80 ) | |||||
| SN 2009Z | 0.59 (1.35 ) | ||||||
| SN 2009er | 0.38 (0.42 ) | ||||||
| SN 2009gk | 23.75 (32.35) | ||||||
| SN 2009hy | 1.89 (1.92 ) | ||||||
| SN 2009jf | — | 7.81 (7.82 ) | |||||
| SN 2010cn | 7.43 (7.44 ) | ||||||
| SN 2010gd | 5.36 (5.56 ) | ||||||
| SN 2010hy | 1.91 (15.08) | ||||||
| SN 2011dh | 8.78 (8.78 ) | ||||||
| SN 2011fu | 16.12 (16.12) | ||||||
| SN 2011gd | — |
| Name | log | /dof | |||||
|---|---|---|---|---|---|---|---|
| (M⊙) | ( cm s-1) | (M⊙) | cm2 g-1 | ( K) | (days) | ||
| SN 2012aa | 0.79 (0.86 ) | ||||||
| SN 2012ap | 6.92 (6.98 ) | ||||||
| SN 2012au | 32.89 (32.89) | ||||||
| SN 2012fh | 42.34 (46.11) | ||||||
| SN 2013dk | 33.03 (33.09) | ||||||
| SN 2014C | — | 12.07 (12.07) | |||||
| SN 2014L | 3.62 (3.63 ) | ||||||
| SN 2014as | — | 7.22 (7.24 ) | |||||
| SN 2014cp | 0.76 (0.81 ) | ||||||
| SN 2014ds | 0.40 (4.45 ) | ||||||
| SN 2014eh | — | 3.42 (3.43 ) | |||||
| SN 2014ei | — | 0.81 (0.83 ) | |||||
| SN 2015G | 2.20 (2.22 ) | ||||||
| SN 2015K | 0.11 (0.45 ) | ||||||
| SN 2015Q | 0.84 (0.87 ) | ||||||
| SN 2015U | — | 6.01 (6.02 ) | |||||
| SN 2015Y | — | 2.82 (2.82 ) | |||||
| SN 2015ap | — | 11.96 (11.96) | |||||
| SN 2016G | 15.81 (15.85) | ||||||
| SN 2016ajo | 0.18 (1.60 ) | ||||||
| SN 2016bau | — | 15.47 (15.47) | |||||
| SN 2016coi | 180.05 (180.06) | ||||||
| SN 2016gcm | 9.93 (9.96 ) | ||||||
| SN 2016gkg | — | 55.79 (55.80) | |||||
| SN 2016gqv | — | ||||||
| SN 2016iyc | 2.75 (2.88 ) | ||||||
| SN 2017ein | — | 37.98 (37.99) | |||||
| SN 2017iro | 16.01 (16.02) | ||||||
| SN 2018cow | 241.67 (241.69) | ||||||
| SN 2018ie | 6.63 (6.65 ) | ||||||
| SN 2019wep | 1.70 (1.78 ) | ||||||
| SN 2020nxt | 0.47 (1.36 ) | ||||||
| iPTF13bvn | — | 10.14 (10.15) | |||||
| MOTJ120451.50+265946.6 | 15.53 (16.03) |
| Name | log | /dof | |||||||||
|---|---|---|---|---|---|---|---|---|---|---|---|
| (M⊙) | ( cm) | ( erg s-1) | (M⊙) | ( cm s-1) | (M⊙) | cm2 g-1 | ( K) | (days) | |||
| SN 2011fu | 10.27 | ||||||||||
| (0.054) | (156.23) | (0.37) | (0.78) | (1.18) | (0.61) | (-0.72) | (8.08) | (-2.36) | (10.28) | ||
| SN 2015Y | — | 5.14 | |||||||||
| (17.03) | (1347.86) | (-4.22) | (37.00) | (4.88) | (0.086) | (-1.56) | (9.80) | (5.17) | |||
| SN 2016gkg | — | 41.55 | |||||||||
| (0.21) | (2987.88) | (-1.80) | (1.09) | (0.30) | (0.11) | (-1.57) | (7.62) | (41.57) | |||
| SN 2016iyc | 1.10 | ||||||||||
| (0.011) | (436.80) | (-1.89) | (1.26) | (0.68) | (0.043) | (1.16) | (7.83) | (-4.98) | (1.12) |
| Name | log | /dof | ||||||
|---|---|---|---|---|---|---|---|---|
| (M⊙) | (ms) | ( G) | ( cm s-1) | cm2 g-1 | ( K) | (days) | ||
| SN 2008fz | 8.01 | |||||||
| SN 2010hy | – | |||||||
| SN 2012aa | 0.76 | |||||||
| SN 2018cow | 191.64 |
| SN | MJD | (mag) | (mag) | (mag) | (mag) | (mag) |
|---|---|---|---|---|---|---|
| 2003gk | 52821.455 | — | — | — | — | 17.7170.061 |
| 2003gk | 52822.463 | — | — | — | — | 17.8280.051 |
| 2003gk | 52827.480 | — | — | — | — | 18.0160.068 |
| 2003gk | 52834.456 | — | — | — | — | 18.0910.124 |
| 2003gk | 52840.448 | — | — | — | — | 18.1140.145 |
| 2003gk | 52855.405 | — | — | — | — | 18.4170.072 |
| 2003gk | 52861.415 | — | — | — | — | 18.3990.113 |
| 2003gk | 52868.452 | — | — | — | — | 18.7180.155 |
| 2003gk | 52888.281 | — | — | — | — | 18.8170.143 |
| 2003gk | 52896.328 | — | — | — | — | 18.8320.188 |
| 2003gk | 52900.263 | — | — | — | — | 19.1310.207 |
| 2003gk | 52905.289 | — | — | — | — | 19.0180.148 |
| 2003gk | 52909.258 | — | — | — | — | 18.9870.112 |
| 2003gk | 52914.230 | — | — | — | — | 19.1870.141 |
| 2003gk | 52924.305 | — | — | — | — | 19.1260.236 |
| 2003gk | 52928.232 | — | — | — | — | 19.6160.238 |
| 2003gk | 52932.210 | — | — | — | — | 19.3340.239 |
| 2003gk | 52937.237 | — | — | — | — | 19.7840.265 |
| 2003gk | 52821.455 | — | — | — | — | 17.7170.061 |
| 2003gk | 52822.463 | — | — | — | — | 17.8280.051 |
| 2003gk | 52827.480 | — | — | — | — | 18.0160.068 |
| 2003gk | 52834.456 | — | — | — | — | 18.0910.124 |
| 2003gk | 52840.448 | — | — | — | — | 18.1140.145 |
| 2003gk | 52855.405 | — | — | — | — | 18.4170.072 |
| 2003gk | 52861.415 | — | — | — | — | 18.3990.113 |
| 2003gk | 52868.452 | — | — | — | — | 18.7180.155 |
| 2003gk | 52883.306 | — | — | — | — | 18.8550.133 |
| 2003gk | 52888.281 | — | — | — | — | 18.8170.143 |
| 2003gk | 52896.328 | — | — | — | — | 18.8320.188 |
| 2003gk | 52900.263 | — | — | — | — | 19.1310.207 |
| 2003gk | 52905.289 | — | — | — | — | 19.0180.148 |
| 2003gk | 52909.258 | — | — | — | — | 18.9870.112 |
| 2003gk | 52914.230 | — | — | — | — | 19.1870.141 |
| 2003gk | 52924.305 | — | — | — | — | 19.1260.236 |
| 2003gk | 52928.232 | — | — | — | — | 19.6160.238 |
| 2003gk | 52932.210 | — | — | — | — | 19.3340.239 |
| 2003gk | 52937.237 | — | — | — | — | 19.7840.265 |
| 2003gk | 52883.306 | — | — | — | — | 18.8550.133 |
| 2006el | 53965.324 | — | — | — | — | 19.8080.464 |
| 2006el | 53972.281 | — | — | — | — | 18.1530.250 |
| 2006el | 53973.007 | 18.9200.069 | 18.3350.050 | 18.0220.095 | 17.8460.121 | — |
| 2006el | 53973.304 | — | — | — | — | 17.9520.215 |
| 2006el | 53973.977 | 18.7820.057 | 18.2130.048 | 17.9220.067 | 17.6950.091 | — |
| 2006el | 53974.304 | — | — | — | — | 17.8650.175 |
| 2006el | 53981.255 | — | — | — | — | 17.3280.140 |
| 2006el | 53993.265 | — | — | — | — | 17.5630.215 |
| 2006el | 53993.957 | 19.0780.093 | 18.1180.181 | 17.5490.296 | 17.3670.301 | — |
| 2006el | 53994.925 | 19.3160.076 | 18.1630.059 | 17.6680.071 | 17.2870.084 | — |
| 2006el | 54001.269 | — | — | — | — | 17.8880.183 |
| 2006el | 54021.156 | — | — | — | — | 18.5610.462 |
| 2006el | 54028.887 | 20.7780.143 | 19.5480.079 | 18.8770.063 | 18.1710.056 | — |
| 2006el | 54030.193 | — | — | — | — | 18.6790.456 |
| 2006el | 54039.155 | — | — | — | — | 18.7720.341 |
| 2006el | 54047.126 | — | — | — | — | 18.7510.152 |
| 2006el | 54058.109 | — | — | — | — | 18.8280.284 |
| 2006el | 54071.111 | — | — | — | — | 18.9170.579 |
| SN | MJD | (mag) | (mag) | (mag) | (mag) | (mag) | System |
|---|---|---|---|---|---|---|---|
| 2003gk | 52821.455 | — | — | — | — | 17.7170.061 | kait2 |
| 2003gk | 52822.463 | — | — | — | — | 17.8280.051 | kait2 |
| 2003gk | 52827.480 | — | — | — | — | 18.0160.068 | kait2 |
| 2003gk | 52834.456 | — | — | — | — | 18.0910.124 | kait2 |
| 2003gk | 52840.448 | — | — | — | — | 18.1140.145 | kait2 |
| 2003gk | 52855.405 | — | — | — | — | 18.4170.072 | kait2 |
| 2003gk | 52861.415 | — | — | — | — | 18.3990.113 | kait2 |
| 2003gk | 52868.452 | — | — | — | — | 18.7180.155 | kait2 |
| 2003gk | 52883.306 | — | — | — | — | 18.8550.133 | kait2 |
| 2003gk | 52888.281 | — | — | — | — | 18.8170.143 | kait2 |
| 2003gk | 52896.328 | — | — | — | — | 18.8320.188 | kait2 |
| 2003gk | 52900.263 | — | — | — | — | 19.1310.207 | kait2 |
| 2003gk | 52905.289 | — | — | — | — | 19.0180.148 | kait2 |
| 2003gk | 52909.258 | — | — | — | — | 18.9870.112 | kait2 |
| 2003gk | 52914.230 | — | — | — | — | 19.1870.141 | kait2 |
| 2003gk | 52924.305 | — | — | — | — | 19.1260.236 | kait2 |
| 2003gk | 52928.232 | — | — | — | — | 19.6160.238 | kait2 |
| 2003gk | 52932.210 | — | — | — | — | 19.3340.239 | kait2 |
| 2003gk | 52937.237 | — | — | — | — | 19.7840.265 | kait2 |
| 2006el | 53965.324 | — | — | — | — | 19.8080.464 | kait3 |
| 2006el | 53972.281 | — | — | — | — | 18.1530.250 | kait3 |
| 2006el | 53973.007 | 18.8660.068 | 18.3660.050 | 18.0500.086 | 17.8250.126 | — | nickel1 |
| 2006el | 53973.304 | — | — | — | — | 17.9520.215 | kait3 |
| 2006el | 53973.977 | 18.7300.056 | 18.2430.048 | 17.9480.061 | 17.6720.095 | — | nickel1 |
| 2006el | 53974.304 | — | — | — | — | 17.8650.175 | kait3 |
| 2006el | 53981.255 | — | — | — | — | 17.3280.140 | kait3 |
| 2006el | 53993.265 | — | — | — | — | 17.5630.215 | kait3 |
| 2006el | 53993.957 | 18.9900.089 | 18.1690.180 | 17.6000.269 | 17.3340.314 | — | nickel1 |
| 2006el | 53994.925 | 19.2100.074 | 18.2240.058 | 17.7120.064 | 17.2480.087 | — | nickel1 |
| 2006el | 54001.269 | — | — | — | — | 17.8880.183 | kait3 |
| 2006el | 54021.156 | — | — | — | — | 18.5610.462 | kait3 |
| 2006el | 54028.887 | 20.6650.141 | 19.6130.078 | 18.9370.056 | 18.1100.057 | — | nickel1 |
| 2006el | 54030.193 | — | — | — | — | 18.6790.456 | kait3 |
| 2006el | 54039.155 | — | — | — | — | 18.7720.341 | kait3 |
| 2006el | 54047.126 | — | — | — | — | 18.7510.152 | kait3 |
| 2006el | 54058.109 | — | — | — | — | 18.8280.284 | kait3 |
| 2006el | 54071.111 | — | — | — | — | 18.9170.579 | kait3 |