Predicting conversion of mild cognitive impairment to Alzheimer’s disease by modelling healthy ageing trajectories††thanks: Under review
Abstract
Alzheimer’s disease (AD) is the most common age-related dementia. Mild cognitive impairment (MCI) is the early stage of cognitive decline before AD. It is crucial to predict the MCI-to-AD conversion for precise management, which remains challenging due to the diversity of patients. Previous evidence shows that the brain network generated from diffusion MRI promises to classify dementia using deep learning. However, the limited availability of diffusion MRI challenges the model training. In this study, we develop a self-supervised contrastive learning approach to generate structural brain networks from routine anatomical MRI under the guidance of diffusion MRI. The generated brain networks are applied to train a learning framework for predicting the MCI-to-AD conversion. Instead of directly modelling the AD brain networks, we train a graph encoder and a variational autoencoder to model the healthy ageing trajectories from brain networks of healthy controls. To predict the MCI-to-AD conversion, we further design a recurrent neural networks based approach to model the longitudinal deviation of patients’ brain networks from the healthy ageing trajectory. Numerical results show that the proposed methods outperform the benchmarks in the prediction task. We also visualize the model interpretation to explain the prediction and identify abnormal changes of white matter tracts.
Keywords:
Brain networks Graph neural networks Alzheimer’s disease.1 Introduction
1.1 Alzheimer’s disease and mild cognitive impairment
Alzheimer’s disease (AD) is the most common cause of dementia, characterized by continuous decline in cognition, memory and brain functions [17]. Mild cognitive impairment (MCI) is regarded as the intermediate stage of cognitive decline between healthy ageing and AD, where a proportion of MCI cases could be reversible. Further, although lacking curative treatment, earlier identification and intervention could modify the disease trajectory of AD progression and impact patient outcomes. Therefore, it is of crucial significance to accurately predict the conversion from MCI to AD, which remains a significant challenge due to the heterogeneous nature of AD[4].
1.2 Neuroimaging and brain networks
Magnetic resonance imaging (MRI) is a commonly-used noninvasive technique for managing neuropsychiatric conditions. Previous studies suggest that MRI can detect the structural change of the brain in dementia patients [9]. The MRI-derived biomarkers are reported significantly associated with cognitive decline, indicating the clinical value of MRI in dementia prediction[8]
The structural brain network, constructed from diffusion MRI (dMRI) or anatomical MRI, is promising to characterize the connectivity between cortical/subcortical regions defined according to prior knowledge of neuroanatomy. Specifically, dMRI-derived brain networks utilize tractography to quantify the connectivity strength of tracts that link brain regions. At the same time, anatomical MRI examines the possible associations among brain regions by calculating the covariance of the anatomical features (e.g., grey matter volume) among brain regions. Both types of structural brain networks are reported to effectively generate useful graph theoretical biomarkers associated with various neuropsychiatric conditions [12, 26, 25] including dementia [2]. Although dMRI provides more direct connectivity estimation than anatomical MRI, it is more difficult to acquire. In parallel to the efforts in developing data augmentation approaches [16, 6], there is a pressing need to generate robust brain networks from more commonly available anatomical MRI.
1.3 Deep learning for neuroimaging
Deep learning models demonstrate reasonable performance in classifying AD and predicting MCI-to-AD conversion based on neuroimaging [1]. However, the majority models are developed for computer vision tasks, which may not capture the connectomic properties of the brain. Therefore, the model performance could be limited for complex tasks involving domain knowledge, e.g., predicting disease trajectory of AD. Moreover, the interpretability of these models could be further improved to facilitate clinical translation. In parallel, the emerging graph neural network (GNN), designed for learning non-Euclidean data, is widely used in characterizing neuropsychiatric diseases [21], which has shown encouraging performance in AD research, e.g., tau spread networks, brain structure geometric, based on MRI-derived graph structure data [20, 22].
1.4 Related work
In general, the approaches of predicting the MCI-to-AD conversion are categorized as static models (based on single time point data) or dynamic models (based on longitudinal data). Static models predict whether the conversion will happen in 36 months solely based on the baseline images [1, 11], which, however, ignores the longitudinal changes along the disease trajectory. Therefore, although such approaches require fewer data, they could be sub-optimal due to the static nature of the predicting models. In contrast, dynamic models are emerging approaches to predict MCI-to-AD conversion, particularly with the availability of longitudinal datasets, e.g., the Alzheimer’s Disease Neuroimaging Initiative (ADNI). A recent study applies GNN and recurrent neural networks (RNN) to predict the patient outcomes in 18-month follow up by modeling the longitudinal brain networks from the baseline to 12-month as dynamic graphs [15]. However, this method showed limited performance, which might be due to its attempts to directly model the heterogeneous dementia population using the end-to-end training scheme. Moreover, the input brain networks are constructed solely from grey matter features, which ignores the common white matter abnormalities in AD.
1.5 Proposed framework
Previous studies show that anatomical MRI and dMRI share common features in reflecting brain structure [3, 13]. Hence, it could be feasible to generate brain networks from anatomical MRI with the guidance of dMRI that provides more specific information regarding white matter tracts. In this way, we could fully characterize both grey matter and white matter of the brain. In addition, accumulating research shows that AD patients demonstrate accelerated brain ageing compared to healthy controls (CN) and MCI patients [7, 11]. Therefore, we hypothesize that the MCI-to-AD conversion could be predicted by modelling the deviation of AD patients from the healthy ageing trajectory, which could mitigate the challenge of modelling brain networks in the heterogeneous AD population.
Here we propose a learning framework to model the healthy ageing trajectory of brain networks with a graph encoder and a variational autoencoder (VAE). In addition, we design an RNN based algorithm that predicts the MCI-to-AD conversion based on the past longitudinal deviations/residuals of patients from the predicted ageing trajectory. In order to generate brain networks from commonly available anatomical MRI, we propose a self-supervised approach that uses an autoencoder to extract node features from T1 images and a cross-modal contrastive representative learning approach to extract edge features guided by dMRI. Our contributions include:
-
•
A cross-modal learning approach to generate brain networks by extracting features from anatomical MRI under the guidance of dMRI.
-
•
A generative approach to predict the healthy ageing trajectories of brain network features using graph neural networks and variational autoencoders.
-
•
A recurrent learning algorithm that models longitudinal residuals between patient’s actual features and patient’s predicted features from the healthy ageing trajectory for future disease status prediction.
-
•
An interpretation approach that identifies the abnormality introduced from MCI-to-AD conversion by comparing the actual diseased brain networks and the predicted healthily aged brain networks from a customized graph decoder.
2 Methods
2.1 Data preparation
A longitudinal MRI dataset of AD, MCI and CN subjects is downloaded from ADNI website. Each subject has one T1 images at baseline, 6 months, 12 months and 18 months respectively. In total, the longitudinal dataset includes 191 stable CN, 126 stable MCI, and 91 converted MCI. Another independent baseline cohort including 113 CN and 96 AD with dMRI and T1 available are also downloaded from the ADNI website.
T1 images of all subjects are transformed to the standard MNI-152 space by coregistrating with MNI-152 standard T1 of the FMRIB Software Library (FSL) using Advanced normalization tools [5, 14]. For the dMRI of the independent baseline cohort, fractional anisotropy (FA) maps are derived using the FMRIB’s Diffusion Toolbox and transformed to the standard space by coregistrating with the standard FA map.
2.2 Brain network construction
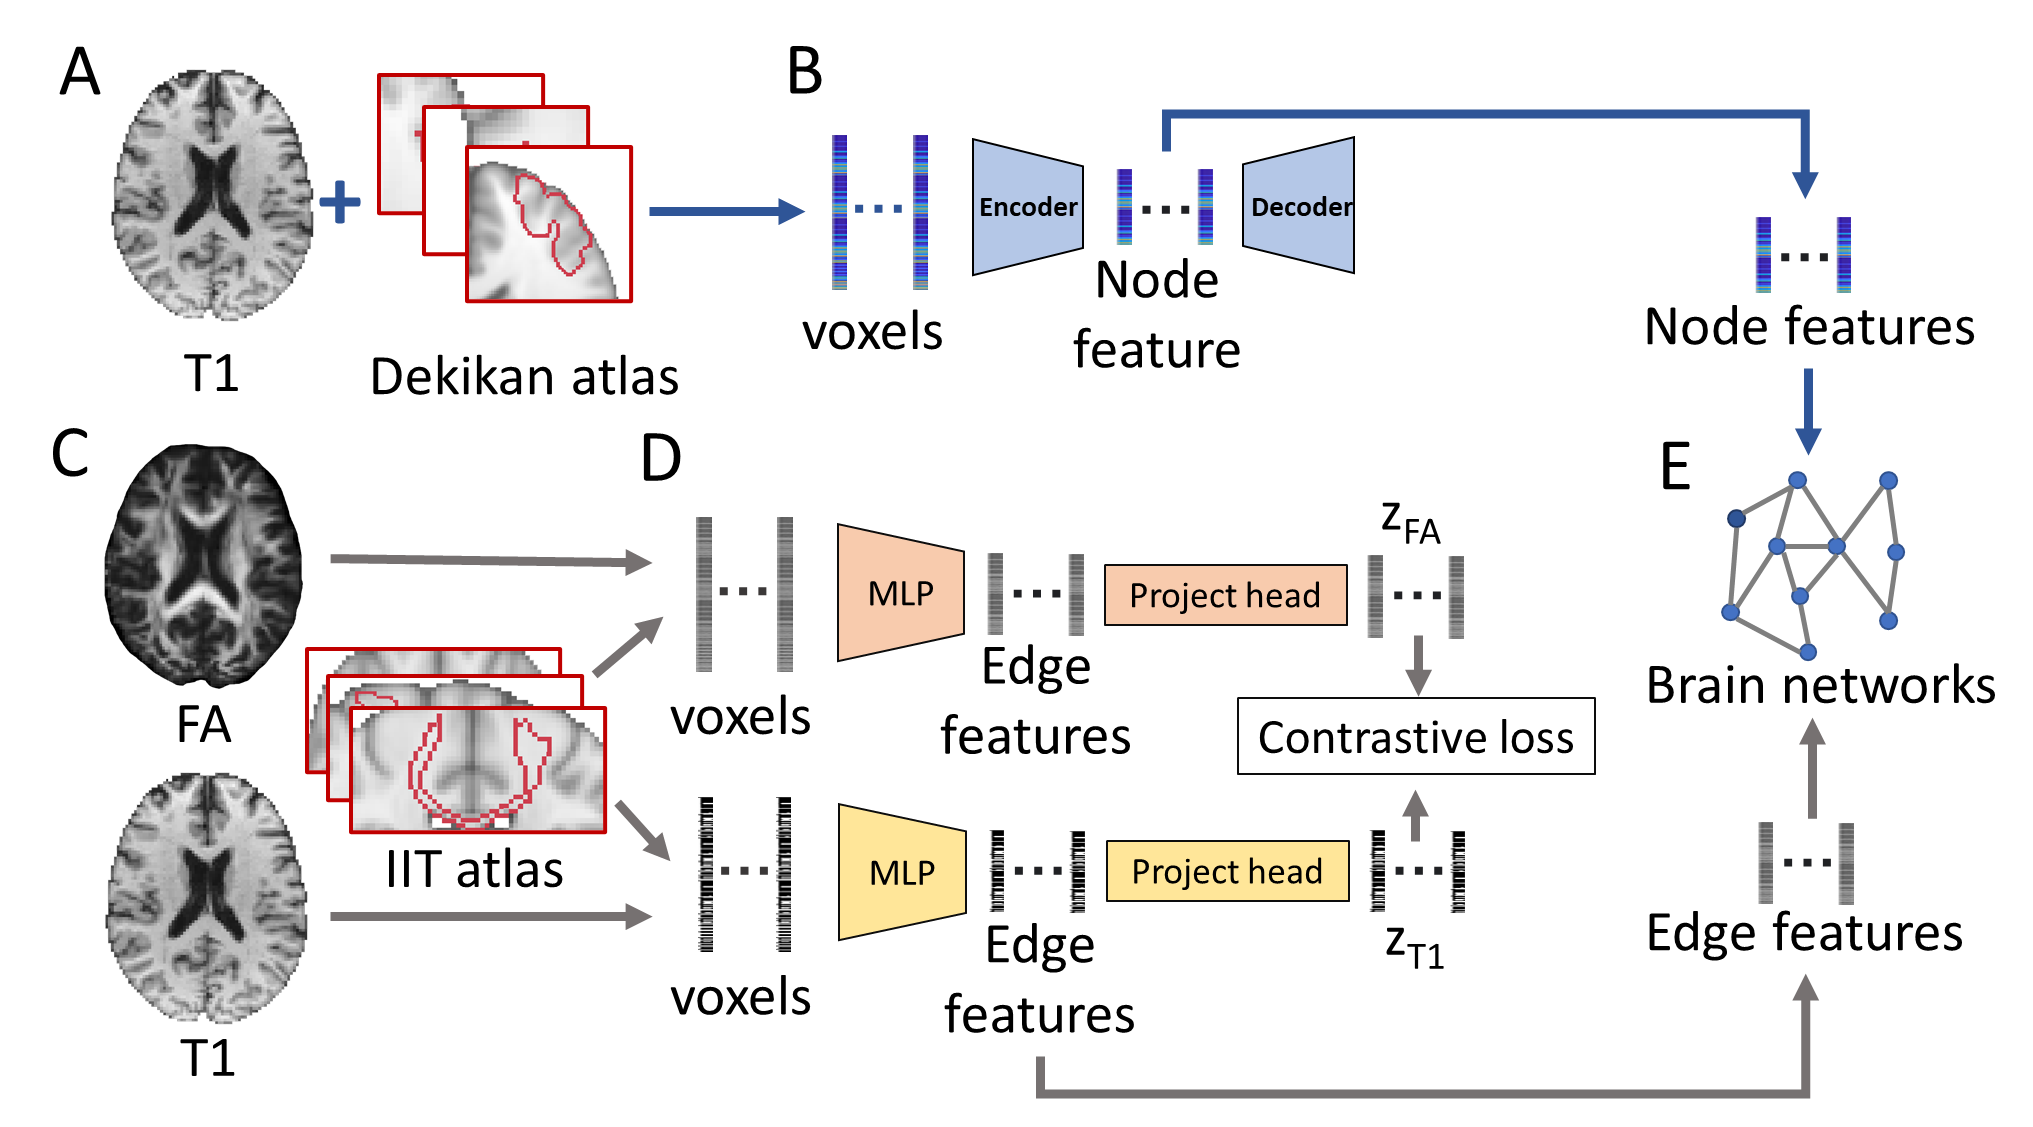
Node and edge features of brain networks are both learnt from the independent baseline data. (Fig 1). The Desikan grey matter atlas is used as the node atlas that divides cortical and sub-cortical regions into 68 separate areas with cerebellum excluded (Fig 1A). For each subject, the Desikan node atlas is transformed back to the native space of the subjects using the inverse coregistration file from data preparation. The voxels enclosed by the node atlas are extracted and fed into an autoencoder for dimension reduction (Fig 1B). All node voxels are sampled and zero-padded to 3000 as the input of the autoencoder, which consists of 4 layers with dimensions 1024, 512, 128, 32, respectively, and the output dimension is 32.
The IIT white matter atlas [19] is a tractography atlas that indicates the path of 2227 the white matter tracts/edges connecting 68 regions of the Desikan atlas (Fig 1C). Similar to nodes voxel extraction, the tract pathways of the IIT atlas are transformed back to the native space. Voxels of T1 and corresponding FA enclosed by IIT atlas are extracted and sampled as vectors (dimension 3000). Two multilayer perceptron (MLP, dimension: 3000, 1024, 512, 128, 32) respectively encode the voxel vectors of T1 and FA to features with a dimension of 32, and the project heads project the features to a common latent space (dimension = 128) where cross-modal contrastive representative learning are performed to align the features of T1 and FA (Fig 1D). As such, the most tract-related features from T1 can be extracted under the guidance of the FA map. The loss is defined as:
| (1) |
where and are latent features of T1 and FA features of the tract after the project head, respectively; is the cosine similarity; is the temperature parameter (set to 0.01) ; is the size of the minibatch, is the index of other tracts in the minibatch, .
Finally, the node and edge features extracted from the trained models are reformatted into a graph for the downstream tasks (Fig 1E).
2.3 Learning framework
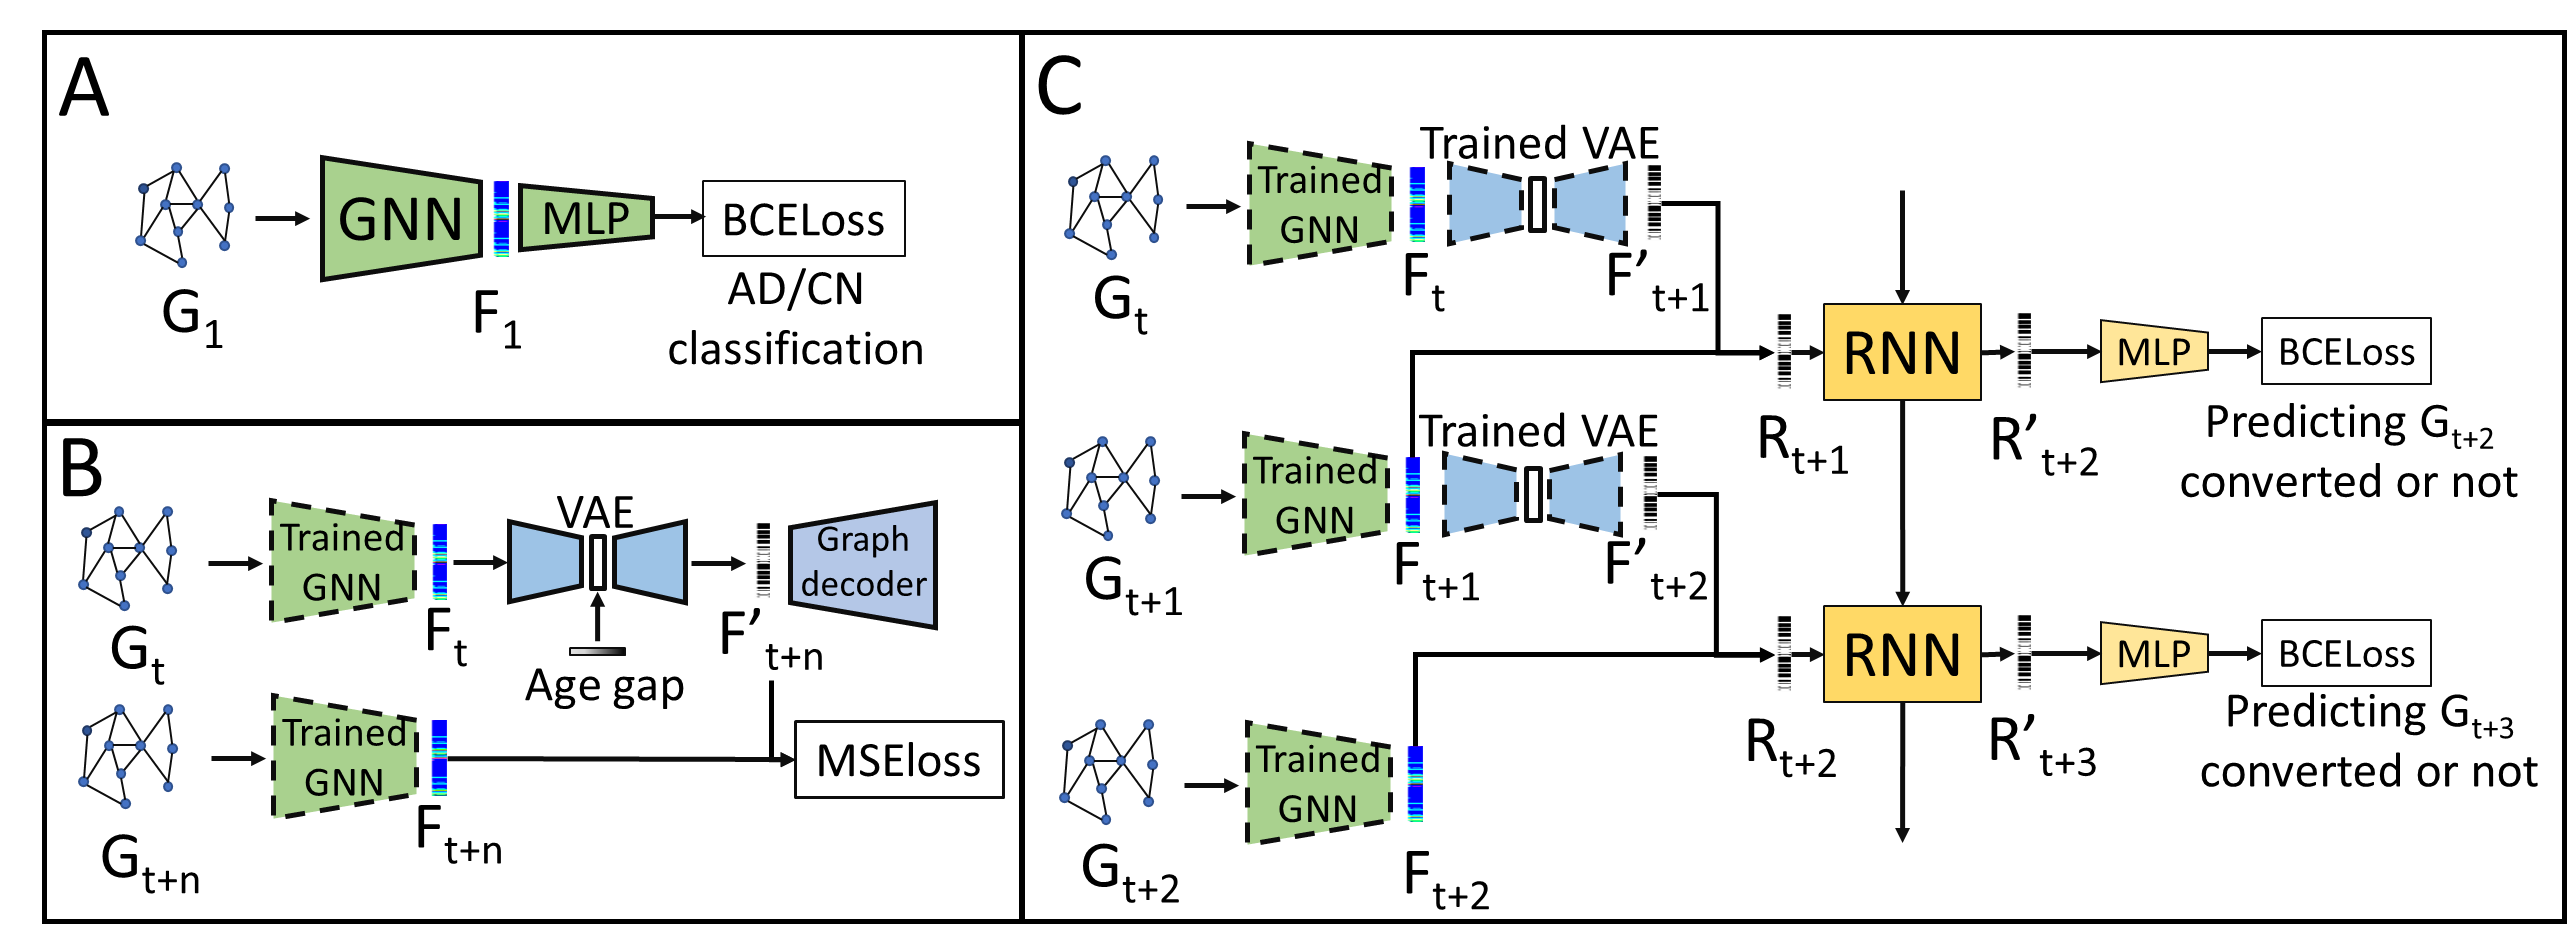
The learning framework for predicting MCI-to-AD conversion consists of three models that are trained separately.
A GNN consisting of three GATConv [24] layers and one global pooling layer is pre-trained as graph encoder to extract dementia-related features from the brain networks by performing AD/CN classification on the independent baseline cohort with BCELoss (binary cross-entropy loss) (Fig 2A). The dimension of the output graph feature is 256.
A VAE with a 3-layer (dimension: 256,64,16) MLP encoder and a 3-layer (dimension: 256,64,32) MLP decoder is trained to model the healthy ageing trajectories of the longitudinal stable CN cohort (Fig 2B). The task of the VAE is to predict the future features of brain networks by inputting a starting feature and age gap . Specifically, the encoder projects the to a latent space which the age gap is fed into as a one-hot vector (dimension: 16). Then the decoder predicts the after the age-gap by training with the mean squared error loss (MSELoss) between predicted features and the actual features .
An RNN with long short-term memory (LSTM) kernel is trained to predict the MCI-to-AD conversion based on the longitudinal cohort containing both stable and converted MCI cohorts (Fig 2C). Briefly, the RNN predicts whether the conversion will happen in based on the brain networks of and . The recurrent training details are explained in Algorithm 1.
For interpretation purposes, a graph decoder with two MLP is trained with VAE: the first MLP (dimension: 256, 512, 1024, (68*32)) decodes node embedding from the brain network feature , and the second MLP (dimension: (32*2):64:128:64:32) decodes features of connecting edges between two nodes from the concatenated node embedding. The residual between the predicted and actual graph features of brain networks represents the patient’s deviation from the healthy ageing trajectories during the MCI-to-AD conversion. By comparing the predicted and actual brain networks that converted to AD, we could identify the abnormal changes that cannot be explained by the healthy ageing effect.
2.4 Benchmarks
To evaluate the performance of brain networks generated using our approach, we constructed traditional diffusion MRI and T1 based structural brain networks, respectively for comparison. For dMRI based brain networks (white matter connectivity), we performed whole-brain tractography on independent baseline CN cohort using the Anatomically-Constrained Tractography of MRtrix [23]. The mean FA value of the tract fiber and the fiber counts is calculated as the edge weight among the nodes on the Desikan node atlas. For T1 based edge matrices (grey matter association), we measured the grey matter volumes constrained by the node atlas using FreeSurfer [10]. We calculated a covariance matrix to characterize the connectivity between brain regions. All benchmark networks and our proposed networks were utilized in the classification of AD/CN of independent baseline cohort for evaluation using the graph encoder of the learning framework.
For the task of predicting MCI-to-AD conversion, we included two benchmarks representing static modal and dynamic model, respectively. The static prediction benchmark is a residual neural network (ResNet) proposed in [1]. Note that the original study predicted the conversion in 36 months, while we are predicting the conversion in 18 months. The interpretable temporal graph neural network (referred to as ITGNN) proposed in [15] was selected as the dynamic model benchmark, which consists of a GNN and an RNN. Briefly, the GNN encodes graph features of brain networks, and a LSTM learns from the graph feature to predict patients’ outcomes (AD/CN/MCI). For benchmark purposes, we only included the longitudinal stable and converting MCI patients for training/testing and predict the patient status in 18 months. In addition, we input both the grey matter covariance networks and our proposed brain networks to produce two benchmark results.
All above models are implemented using Pytorch 1.10.0 [18]. Five-fold cross validation, Adam optimiser, 0.0005 learning rate and 1000 training epochs and early convergence stopping are applied to all models.
3 Results
Results in table 1 show that our proposed method of generating brain networks achieved the highest performance for classifying AD/CN. Results in table 2 show that our proposed method achieved highest prediction accuracy for the MCI-to-AD conversion in 18 months .
| Models | Accuracy | Sensitivity | Specificity |
|---|---|---|---|
| Fibre Counts networks | 0.818 | 0.841 | 0.792 |
| FA networks | 0.828 | 0.850 | 0.802 |
| Cortical volume networks | 0.761 | 0.770 | 0.750 |
| Proposed networks (edge) | 0.842 | 0.858 | 0.822 |
| Proposed networks (edge + node) | 0.861 | 0.885 | 0.833 |
| Models | Accuracy | Sensitivity | Specificity |
|---|---|---|---|
| ResNet + baseline MRI | 0.802 | 0.813 | 0.794 |
| ITGNN+ cortical networks | 0.641 | 0.670 | 0.619 |
| ITGNN + proposed networks | 0.659 | 0.681 | 0.643 |
| Proposed + cortical networks | 0.779 | 0.791 | 0.770 |
| Proposed + proposed networks | 0.839 | 0.868 | 0.818 |
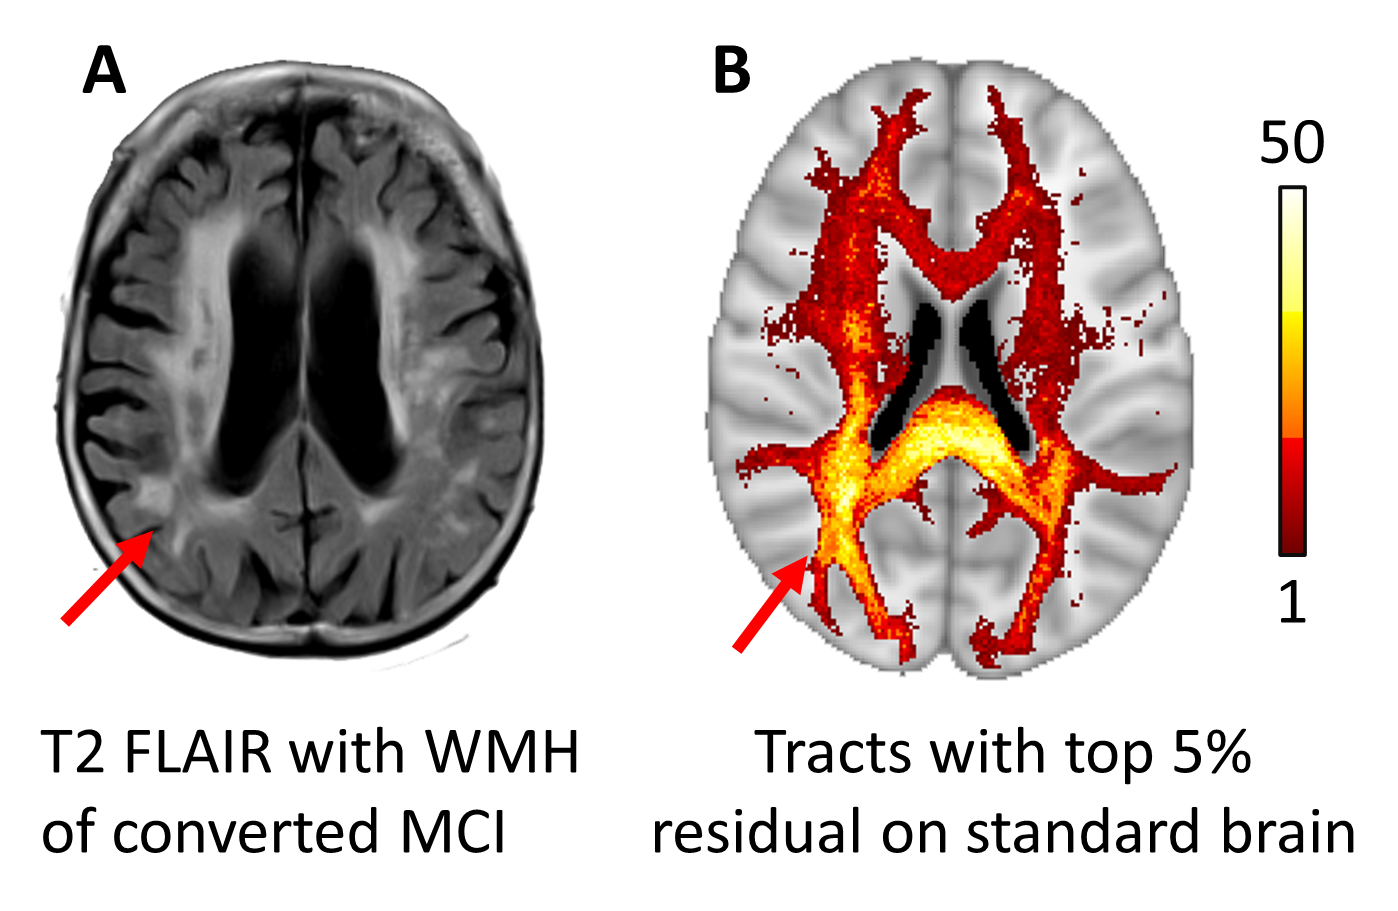
The interpretation approach produces a residual brain network with high dimensional features. For visualization purposes, we average the residuals of edge features, retain the edges with top 5 highest residuals, and present one case example in Fig 3. The interpretation results suggest that the proposed methodology is capable of capturing the abnormalities in brain networks from MCI-to-AD conversion, particularly the white matter hyperintensities related to cognitive decline.rticularly the white matter hyperintensities related with cognitive decline.
4 Discussion and conclusion
This study proposes an approach to construct structural brain networks with imaging representation as the node and edge features and an approach to predict MCI-to-AD conversion based on the neuroscience knowledge that AD patients tend to deviate from healthy ageing trajectories. The proposed method outperforms benchmark methods. In addition, interpretation suggests that the proposed method is sensitive to abnormal structural changes in the brain. Future possible improvements include integrating separate training stages and introducing a quantitative model interpretation. Overall, the proposed method shows promise to aid prognosis and risk assessment.
References
- [1] Abrol, A., Bhattarai, M., Fedorov, A., Du, Y., Plis, S., Calhoun, V., Initiative, A.D.N., et al.: Deep residual learning for neuroimaging: an application to predict progression to alzheimer’s disease. Journal of neuroscience methods 339, 108701 (2020)
- [2] Ajilore, O., Lamar, M., Kumar, A.: Association of brain network efficiency with aging, depression, and cognition. The American Journal of Geriatric Psychiatry 22(2), 102–110 (2014)
- [3] Alexander-Bloch, A., Raznahan, A., Bullmore, E., Giedd, J.: The convergence of maturational change and structural covariance in human cortical networks. Journal of Neuroscience 33(7), 2889–2899 (2013)
- [4] Au, R., Piers, R.J., Lancashire, L.: Back to the future: Alzheimer’s disease heterogeneity revisited. Alzheimer’s & Dementia: Diagnosis, Assessment & Disease Monitoring 1(3), 368 (2015)
- [5] Avants, B.B., Tustison, N., Song, G.: Advanced normalization tools (ants). Insight j 2(365), 1–35 (2009)
- [6] Barile, B., Marzullo, A., Stamile, C., Durand-Dubief, F., Sappey-Marinier, D.: Data augmentation using generative adversarial neural networks on brain structural connectivity in multiple sclerosis. Computer methods and programs in biomedicine 206, 106113 (2021)
- [7] Cole, J.H., Ritchie, S.J., Bastin, M.E., Hernández, V., Muñoz Maniega, S., Royle, N., Corley, J., Pattie, A., Harris, S.E., Zhang, Q., et al.: Brain age predicts mortality. Molecular psychiatry 23(5), 1385–1392 (2018)
- [8] Cox, S., Ritchie, S., Fawns-Ritchie, C., Tucker-Drob, E., Deary, I.: Structural brain imaging correlates of general intelligence in uk biobank. Intelligence 76, 101376 (2019)
- [9] Elliott, M.L.: Mri-based biomarkers of accelerated aging and dementia risk in midlife: How close are we? Ageing research reviews p. 101075 (2020)
- [10] Fischl, B.: Freesurfer. Neuroimage 62(2), 774–781 (2012)
- [11] Gao, F., Yoon, H., Xu, Y., Goradia, D., Luo, J., Wu, T., Su, Y., Initiative, A.D.N., et al.: Ad-net: Age-adjust neural network for improved mci to ad conversion prediction. NeuroImage: Clinical 27, 102290 (2020)
- [12] Griffa, A., Baumann, P.S., Thiran, J.P., Hagmann, P.: Structural connectomics in brain diseases. Neuroimage 80, 515–526 (2013)
- [13] Gu, X., Knutsson, H., Nilsson, M., Eklund, A.: Generating diffusion mri scalar maps from t1 weighted images using generative adversarial networks. In: Scandinavian Conference on Image Analysis. pp. 489–498. Springer (2019)
- [14] Jenkinson, M., Beckmann, C.F., Behrens, T.E., Woolrich, M.W., Smith, S.M.: Fsl. Neuroimage 62(2), 782–790 (2012)
- [15] Kim, M., Kim, J., Qu, J., Huang, H., Long, Q., Sohn, K.A., Kim, D., Shen, L.: Interpretable temporal graph neural network for prognostic prediction of alzheimer’s disease using longitudinal neuroimaging data. In: 2021 IEEE International Conference on Bioinformatics and Biomedicine (BIBM). pp. 1381–1384. IEEE (2021)
- [16] Li, C., Wei, Y., Chen, X., Schönlieb, C.B.: Brainnetgan: Data augmentation of brain connectivity using generative adversarial network for dementia classification. In: Deep Generative Models, and Data Augmentation, Labelling, and Imperfections, pp. 103–111. Springer (2021)
- [17] Mattson, M.P.: Pathways towards and away from alzheimer’s disease. Nature 430(7000), 631–639 (2004)
- [18] Paszke, A., Gross, S., Massa, F., Lerer, A., Bradbury, J., Chanan, G., Killeen, T., Lin, Z., Gimelshein, N., Antiga, L., et al.: Pytorch: An imperative style, high-performance deep learning library. Advances in neural information processing systems 32 (2019)
- [19] Qi, X., Arfanakis, K.: Regionconnect: Rapidly extracting standardized brain connectivity information in voxel-wise neuroimaging studies. Neuroimage 225, 117462 (2021)
- [20] Sarasua, I., Pölsterl, S., Wachinger, C., Neuroimaging, A.D., et al.: Transformesh: A transformer network for longitudinal modeling of anatomical meshes. In: International Workshop on Machine Learning in Medical Imaging. pp. 209–218. Springer (2021)
- [21] Schirmer, M.D., Venkataraman, A., Rekik, I., Kim, M., Mostofsky, S.H., Nebel, M.B., Rosch, K., Seymour, K., Crocetti, D., Irzan, H., et al.: Neuropsychiatric disease classification using functional connectomics-results of the connectomics in neuroimaging transfer learning challenge. Medical image analysis 70, 101972 (2021)
- [22] Song, T.A., Chowdhury, S.R., Yang, F., Jacobs, H.I., Sepulcre, J., Wedeen, V.J., Johnson, K.A., Dutta, J.: A physics-informed geometric learning model for pathological tau spread in alzheimer’s disease. In: International Conference on Medical Image Computing and Computer-Assisted Intervention. pp. 418–427. Springer (2020)
- [23] Tournier, J.D., Smith, R., Raffelt, D., Tabbara, R., Dhollander, T., Pietsch, M., Christiaens, D., Jeurissen, B., Yeh, C.H., Connelly, A.: Mrtrix3: A fast, flexible and open software framework for medical image processing and visualisation. Neuroimage 202, 116137 (2019)
- [24] Veličković, P., Cucurull, G., Casanova, A., Romero, A., Lio, P., Bengio, Y.: Graph attention networks. arXiv preprint arXiv:1710.10903 (2017)
- [25] Wei, Y., Li, C., Cui, Z., Mayrand, R.C., Zou, J., Wong, A.L., Sinha, R., Matys, T., Schönlieb, C.B., Price, S.J.: Structural connectome quantifies tumor invasion and predicts survival in glioblastoma patients. bioRxiv (2021)
- [26] Wei, Y., Li, C., Price, S.J.: Quantifying structural connectivity in brain tumor patients. In: International Conference on Medical Image Computing and Computer-Assisted Intervention. pp. 519–529. Springer (2021)