:
\theoremsep
Downstream Fairness Caveats with Synthetic Healthcare Data
Abstract
This paper evaluates synthetically generated healthcare data for biases and investigates the effect of fairness mitigation techniques on utility-fairness. Privacy laws limit access to health data such as Electronic Medical Records (EMRs) to preserve patient privacy. Albeit essential, these laws hinder research reproducibility. Synthetic data is a viable solution that can enable access to data similar to real healthcare data without privacy risks. Healthcare datasets may have biases in which certain protected groups might experience worse outcomes than others. With the real data having biases, the fairness of synthetically generated health data comes into question. In this paper, we evaluate the fairness of models generated on two healthcare datasets for gender and race biases. We generate synthetic versions of the dataset using a Generative Adversarial Network called HealthGAN, and compare the real and synthetic model’s balanced accuracy and fairness scores. We find that synthetic data has different fairness properties compared to real data and fairness mitigation techniques perform differently, highlighting that synthetic data is not bias free.
1 Introduction
Accessing healthcare data can lead to real-world solutions such as using Electronic Medical Records (EMRs) for better patient care and improve clinical research (Cowie et al., 2017), analyse and model diseases (Chakraborty and Farooq, 2019) and more. Even though healthcare data is abundant, access to it is often restricted by privacy laws such as Health Insurance Portability and Accountability Act (HIPAA) in the United States (for Disease Control and Prevention, 2018) and General Data Protection Regulation (GDPR) in the European Union (European Parliament and of the Council (2016), 2016, Apr. 27). Albeit essential, these laws hinder reproducibility and limit research. As a result, access to healthcare data records requires data de-identification (e.g. Stanford OMOP (Observational Medical Outcomes Partnership, 2017)), contracts and other methods to protect private information. Even so, there are risks of information loss, data breaches and leaks, with over 40 million individuals impacted due to data breaches just in 2021 as reported to United States Department of Health and Human Services (HHS) (McKeon, 2021). These can lead to huge penalties with an average healthcare data breach cost of $9.42 million per incident (HIPAA Journal, 2021).
Synthetic healthcare data addresses the problem of limited access by generating data which resembles the real data while preserving patient privacy and thus, can be disseminated without restriction. Synthetically generated data can be released with published research, enabling the community to reproduce existing research and conduct new research using these datasets. Synthetic data has been used across many applications, such as in the use of synthetic “difference in differences” in place of conventional estimators (Arkhangelsky et al., 2021), generating Monte-Carlo simulations (Athey et al., 2021), etc. Within the healthcare domain, current research has evaluated synthetic data for resemblance, privacy, and utility (Yale, 2020; Yale et al., 2020a), showing it to be effective for categorical, binary and continuous datasets (Yale et al., 2020a) and time-series datasets (Dash et al., 2020). This can be especially impactful during pandemics such as COVID-19 where widespread research can help but data access may be limited, for example, a study found that synthetic COVID-19 data had similar characteristics to the real data and could be used as a good proxy (El Emam et al., 2021). However, healthcare datasets can have biases themselves. For example, certain groups defined by protected attributes may experience worse outcomes than others. In (Sondik et al., 2010), the study found that American Indians or Alaska Natives fared worst as a group in terms of relative health disparities when compared with other groups.
With real healthcare data being potentially biased, the fairness of synthetic healthcare data also comes into question. In healthcare, we want the synthetic data to be an accurate representation of the real data while preserving patient privacy, such that any analysis on the synthetic data is replicable on the real data. This implies that the synthetic data should capture the characteristics of the real data, having similar utility and fairness, even when the data may be biased. Further, application of any fairness mitigation should ideally resemble if it were to be applied on the real data. This shall make the use of synthetic data as a proxy of the real data robust.
Synthetic data is considered to have good “utility” when a ML model generated on it performs similar to if the same ML model was generated on the real data. While any classification metric can be used to measure utility, such as accuracy and f1_score, we use balanced accuracy to measure the performance of the models for all possible class predictions. Simultaneously, while fairness can take many forms, we define “fairness” as measured using group fairness metrics including equal opportunity difference, average odds difference and equalized odds on the generated ML models. These fairness metrics measure the performance of the model using True Positive Rate (TPR) and False Positive Rate (FPR) difference between the sub groups of a protected attribute such as gender, ethnicity, age etc.
In this paper, we measure the utility-fairness trade-off between real and privacy-preserving synthetic healthcare datasets by generating Machine Learning (ML) models. To provide a comprehensive analysis, we measure two biases: (a) “gender bias” as defined as the Female vs Male bias problem and (b) “race bias” as defined as the Black vs White bias problem. We evaluate the gender bias in the Cardiovascular dataset (Ulianova, 2019) and the race bias in the MIMIC-3 dataset (Johnson et al., 2016) as measured by fairness metrics on Random Forest (RF) models. We also apply three fairness mitigation techniques to understand if unfairness can be mitigated similarly for the models on the real and synthetic datasets. This paper specifically aims to answer the following questions:
-
•
Is synthetic data similar to the real data as measured by utility and fairness?
-
•
Do fairness mitigation techniques work similarly on the real and synthetic data?
-
•
What is the utility-fairness trade-off between real and synthetic datasets?
2 Related work
While there are several ways to generate synthetic data, Generative Adversarial Networks (GANs) (Goodfellow et al., 2014) have been effective in the synthetic generation of many datasets, and are one of the most promising solutions. They have been used for image generation (Karras et al., 2019), image-to-image translation (Huang et al., 2018; Zhu et al., 2017), text generation (Kurup et al., 2021), image generation based on text descriptions (Zhang et al., 2017), music generation (Briot, 2021), and financial time-series generation (Wiese et al., 2020). Advanced versions of GANs have been compared with other generative methods such as stacked Restricted Boltzmann Machines (RBMs), Variational Autoencoders and have demonstrated better performance (Choi et al., 2017).
It has been shown with experiments on Boundary Equilibrium GAN (BEGAN), Deep Convolutional GAN (DCGAN) and DCGAN with Variational AutoEncoders (DCGAN-VAE) that attackers can perform membership inference attacks on GANs (Hayes et al., 2019). This is worsened in the collaborative environment, where one study was able to use an inference attack to identify/generate samples of the training data (Hitaj et al., 2017). In the healthcare domain, privacy of the patients is of the utmost importance and hence, synthetic data generators must be privacy preserving. Such models include DPGAN (Xie et al., 2018), medGAN (Choi et al., 2017), HealthGAN (Yale et al., 2020a, b) etc. DPGAN provides theoretical guarantees on privacy preservation but the observed results show reduced utility. medGAN measured the privacy preservation but is only limited to count and binary datasets. HealthGAN is a model which has shown promising results on both public and private healthcare datasets catering to wide range of data types and thus, is our candidate model for fairness evaluation.
Synthetic data generators are not free from biases. In Kenfack et al. (2021), the authors demonstrate the biases that exist in data generated by GANs by evaluating the distributions of generated images. An in-depth comparison of representativeness between real and synthetic data, some based on time-series metrics for synthetic data introduced earlier (Bhanot et al., 2021a), has shown that synthetic data represents different sub-groups unfairly (Bhanot et al., 2021b). While this work studied and quantified representative unfairness, the effect of synthetic data on utility and associated fairness in downstream tasks was not addressed. (Cheng et al., 2021) studied image datasets and found that differentially private GANs led to lower utility but showed inconclusive trends in group fairness metrics. Another study on census data observed variable biases in different synthetic models using several fairness metrics (Gupta et al., 2021) but its results were restricted to non-healthcare datasets. In contrast, our work focuses on tabular healthcare data, discusses real vs. synthetic fairness-utility trade-offs and also investigates how fairness mitigation techniques affect these trade-offs.
3 Methodology
3.1 Synthetic Data Generation
Synthetic healthcare data involves the generation of data that imitates real data without revealing real patient details. Synthetic data generated by Generative Adversarial Networks (GANs) have shown promising results. HealthGAN has especially been shown to produce high utility and resemblance patient data while preserving patient information across a number of research studies (Yale et al., 2020b; Dash et al., 2020). Motivated by the high-quality results, we decided to use the HealthGAN model for synthetic data generation using the official repository (Bhanot and Yale, 2020).
We generated the synthetic datasets for two healthcare datasets. The first dataset is the Cardiovascular dataset (Ulianova, 2019) which includes information collected during medical examination of patients such as age, gender, blood pressure, blood pressure etc and has been studied before (Torfi et al., 2022). The dataset includes information about whether the patient has a cardiovascular disease or not and is used as the label for ML models. We use gender as the protected attribute with values as Female or Male. The second dataset is an excerpt of the Multiparameter Intelligent Monitoring in Intensive Care (MIMIC)-3 dataset (Johnson et al., 2016) derived based on a previous study to explore how 30-day mortality is affected by race and the associated synthetic datasets (Mundkur et al., 2017; Yale, 2020). Race is considered as the protected attribute in this data which can take five values: Asian, Black, Other, Unknown and White.
fig:experiment_structure
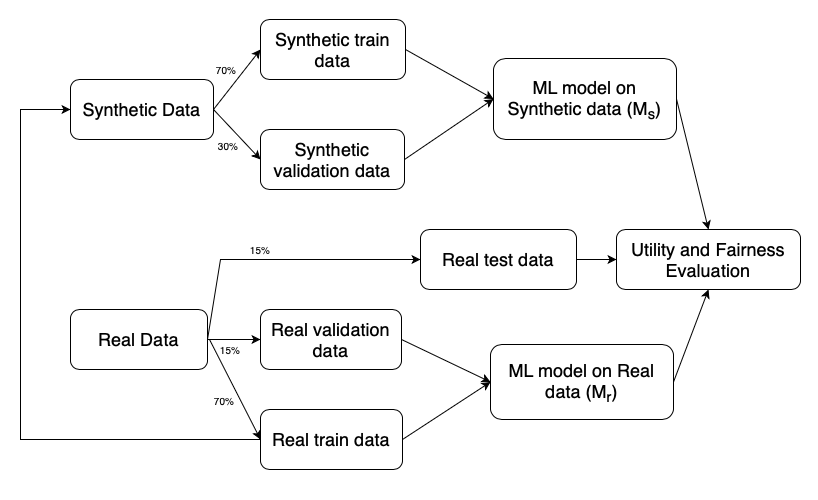
We performed a train-test split with 70-30 ratio of the real data and used the training part of the real data to generate and evaluate the synthetic data. The schematic is shown in Figure LABEL:fig:experiment_structure. Each data generation includes generation of 100,000 records. To accommodate variations across different train-test splits, we repeat the experiment for 10 runs. Each time a seed value from 1 to 10 (based on the experiment run) is selected to split the real data, and the resultant training data is used for synthetic data generation. The generator was tested for different epochs for best resemblance and privacy scores: 50K, 100K and 200K. We set epochs to 100K for Cardiovascular dataset and 200K for MIMIC-3 dataset, selected to achieve the best resemblance and privacy scores as defined by the nearest neighbors Adversarial Accuracy (nnAA) metric (Yale et al., 2020b).
3.2 Machine Learning (ML) model training
In the Cardiovascular dataset, there are outliers which are highly unlikely to occur. Thus, these are removed after data generation but before model training. Firstly, the age is in days so it is converted to years by diving by 365.25 followed by one-hot encoding of the gender column. Next, blood pressure values greater than 360 and less than 20 are also removed which led to better classification results. Random Forest (RF) models was trained on the datasets. The model was searched across a range of possible values using grid search for best balanced accuracy. The RF model achieved the best validation balanced accuracy with 100 trees and maximum features set to 10 with maximum depth set to auto.
In the MIMIC-3 dataset, the data is one-hot encoded for all columns as they are all categorical. We again train RF models on the datasets, with parameters identified using grid search to achieve best validation balanced accuracy. RF is trained with 20 trees, each with a maximum depth of 5 and maximum features automatically identified by the algorithm.
The models are trained using the scikit-learn library (Pedregosa et al., 2011) in Python. The models trained on real and synthetic data are denoted and respectively. For identifying the best results in terms of balanced accuracy scores, we traverse a range of threshold values, 0.01 to 0.50 with 0.01 step, to determine the threshold that achieves the highest balanced accuracy (utility). We repeat the experiment 10 times, each time changing the split by updating the seed and present the results across all splits. The models and are evaluated on the real-test data with the complete experiment structure described in Figure LABEL:fig:experiment_structure. We refer to these models designed for achieving the best balanced accuracy as the “baseline” models.
We also trained Logistic Regression (LR) models for the two datasets, identified using grid search for best validation accuracy scores. However, we found that due to the complex nature of the datasets, LR models did not always converge. Thus, the LR model was not able to learn the patterns in the datasets well, especially during the application of fairness mitigation techniques. Hence, the results based on the RF model provide the best understand on the results for the considered datasets and will be the focus of this paper.
3.3 Fairness metrics
For the trained models, we measure three ML fairness metrics: Equal Opportunity Difference, Average Odds Difference and Equalized Odds, to evaluate if the models perform equally well across sub-groups of protected attributes between real and synthetic data. We use the AI Fairness 360 (AIF360) library (Bellamy et al., 2018) by IBM to evaluate the fairness of the models. We briefly define each metric below with their mathematical definitions made available in \appendixrefapd:fairness_metrics.
Equal Opportunity Difference measures the difference in the True Positive Rate (TPR) between the subgroups of a protected attribute (Bellamy et al., 2018). The model is considered fair within a range -0.1 to 0.1 (AI, 2018).
Average Odds Difference measures the average of the differences in the False Positive Rate (FPR) and the True Positive Rate (TPR) between the subgroups of the protected attribute (Bellamy et al., 2018). The model is considered fair within a range -0.1 to 0.1 (AI, 2018).
Equalized Odds measures the maximum of the absolute value of the differences in the False Positive Rate (FPR) and the True Positive Rate (TPR) between the subgroups of the protected attribute (Hardt et al., 2016) with a fair value at 0. Similar to the two metrics above, we define the fairness of a model based on equalized odds to be between 0 and 0.1
In healthcare datasets, it is possible that sub-groups of protected attributes experience different rates of diagnosis and mortality. For example, Turner syndrome is a sex chromosome condition found only in females (Sutton et al., 2005). As a result, mortality due to it can be non-zero only for females but not for males. As a result, fairness metrics such as demographic parity that aim for equal rates across sub-groups do not always work for evaluating the ML models. Thus, in this paper, we selected the metrics to measure how well do the models perform based on their predictions for various subgroups, measured using both TPR and FPR. TPR is important as correctly identifying the individuals who have high probability of mortality or being diagnosed with a disease, can enable healthcare practitioners to direct appropriate resources to these patients. Similarly, FPR ensures that we do not provide excessive care to patients who don’t need it, at the cost of other patients when resources are limited. The three metrics provide outlook at TPR and FPR from different perspectives.
3.4 Fairness mitigation techniques
We apply fairness mitigation techniques to see whether and by how much unfairness in synthetic healthcare data can be mitigated as compared to the real data. The following mitigation techniques are used to combat unfairness.
EO Thresholding tunes the classification threshold to achieve better equalized odds, similar to traversing the thresholds for achieving the highest balanced accuracy. Thus, as the first mitigation technique, we traverse the threshold values to achieve the lowest Equalized Odds (EO) with the condition that the balanced accuracy is at least 58%. This ensures that, even while striving for better fairness, we do not compromise by considerably dropping utility.
Reweighing is a pre-processing technique that modifies the weights of various samples such that the data is more fair before generating a ML model (Kamiran and Calders, 2012). We apply reweighing to the training dataset before the LR model is trained, using the implementation in AIF360 (Bellamy et al., 2018). During the model training, we include the weights identified using reweighing with the instance_weights parameter provided for models in scikit-learn.
Reduction is an in-processing technique that reduces a fair classification problem into a sequence of cost-sensitive classification problems (Agarwal et al., 2018). To better allow the prediction of probabilities and not just binary-valued predictions, we use the Grid Search Reduction method available in Microsoft’s Fairlearn library (Bird et al., 2020).
HPS is the acronym we use (based on the authors’ names) to refer to the post-processing technique introduced at the same time as the equalized odds fairness criteria (Hardt et al., 2016). HPS proposes an optimization that minimizes equalized odds difference while also minimizing classification loss. We used the open-source implementation available in AIF360 (Bellamy et al., 2018).
We trained ML models and applied these techniques for both real and synthetic data. As both reweighing and reduction allow for the choice of threshold, we use the EO thresholding criteria above to further improve fairness scores. We then compare results from all models for fairness metrics and balanced accuracy scores.
4 Results
4.1 Real vs. Synthetic Prevalence Rates
Prevalence rates measures the proportions of individuals who belong to that sub-group in comparison to the whole population. We calculate the prevalence rates for the protected attributes in the two datasets and average the rates across 10 runs. The percentage change from real to synthetic data is also calculated and all results are shown in Table LABEL:tab:prevalence_rates_cardio and Table LABEL:tab:prevalence_rates_mimic3 for Cardiovascular and MIMIC-3 datasets respectively. We applied the paired t-test (Ross and Willson, 2017) using the scipy package (Virtanen et al., 2020) between the rates in the real and synthetic data. The test has a null hypothesis that the mean difference within the pairs (each split gives rise to a pair) is zero while the alternative hypothesis states otherwise.
tab:prevalence_rates_cardio Sub-group Real Synthetic Change T-test rate rate p-value Female 65.04 65.54 0.78% 2.12e-02* Male 34.96 34.46 -1.45% 2.12e-02*
tab:prevalence_rates_mimic3 Sub-group Real Synthetic Change T-test rate rate p-value Female 48.48 48.64 0.32% 2.00e-01 Male 51.52 51.36 -0.3% 2.00e-01 Asian 2.76 3.30 19.53% 2.43e-02* Black 9.89 6.53 -34.02% 6.04e-12* Other 6.86 7.16 4.37% 6.30e-02 Unknown 9.32 7.53 -19.17% 5.40e-05* White 71.17 75.48 6.06% 7.01e-09*
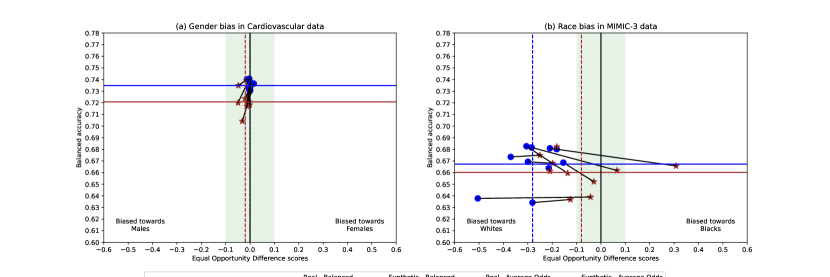
fig:real_vs_synth_eq_opp_diff
The results underscore that certain sub-groups might be under-represented and others might be over-represented in the synthetic data, indicating a shift in the distribution of the data. We find that the change in gender prevalence rates between real and synthetic data is significant (p-value 0.05) for the Cardiovascular data but not for MIMIC-3 (p-value 0.05). However, all race subgroups in MIMIC-3, except Other, had p-value 0.05. This means the difference is significant and we can reject the null hypothesis. We find that Black and Unknown ethnic sub-groups are under-represented in the synthetic data, Blacks being the most affected by over 30%. This is in contrast to the White, Asian and Other sub-groups which have all seen an over-representation. Thus, for a comprehensive analysis, we compare the utility and fairness scores for gender bias in the Cardiovascular data and race bias in the MIMIC-3 data. We select the Black vs White problem for race bias as they create a highly skewed data with more than 70% population being White while Blacks experiencing the worst change in prevalence in synthetic data.
4.2 Real vs Synthetic Fairness-Utility
Figure LABEL:fig:real_vs_synth_eq_opp_diff compares the equal opportunity difference and balanced accuracy scores between the real and synthetic data for the RF models. The subplot on the left highlights the gender bias in the Cardiovascular dataset while the subplot on the right shows the race bias in the MIMIC-3 data. Here, the balanced accuracy and fairness are measured only on the sub-groups selected for the comparison rather than the whole dataset.
In the Cardiovascular data, the real data as measured for gender bias is quite fair with the mean equal opportunity difference value very close to 0. However, as we move from the real data to the synthetic data, we note that the unfairness increases as indicated by the dashed vertical maroon line being farther away from 0. The average balanced accuracy also decreases with some synthetic data models experiencing worse drops than others. While visually the differences are not extreme, statistically the difference in equal opportunity difference values () and balanced accuracy () between real and synthetic data are significant. Overall, there is a decrease in both utility and fairness of the data.
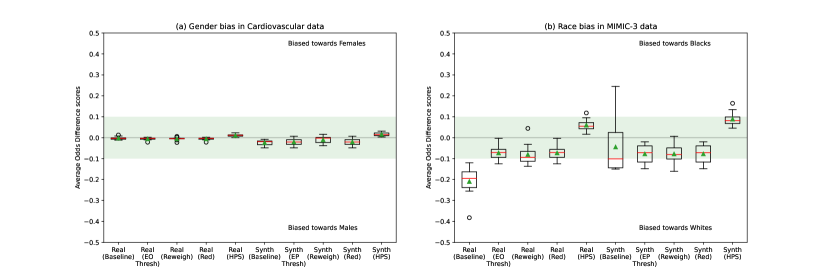
fig:fairness_mitigation_avg_odds_diff
In the MIMIC-3 data, we observe that the real data is quite biased towards the White population as indicated by the dashed blue vertical line. In synthetic data models, we observe that there is an improvement in fairness in almost all cases, moving from region of unfairness to fairness. However, in some cases, the fairness points moved from a region of being biased towards Whites to a region biased towards Blacks. Although synthetic data makes the results fairer as indicated by the maroon dashed vertical line, it actually introduced bias non-existent in the real data. Thus, even when the fairness is improved, the synthetic data is not useful. These differences are also statistically significant (). Even though the average balanced accuracy decreased, the differences are not statistically significant (). Thus, we conclude that the race bias present in the real data is not replicated in the synthetic data, rather synthetic data introduced new biases.
Similar plots for average odds difference and equalized odds along with a table of paired t-test results are included in \appendixrefapd:real_synthetic_fairness. These scores between real and synthetic data are also statistically significant. The results underscore that synthetic data has fairness different from the real data. Thus, if this synthetic data is used as is for conducting research, we might see results which are different from the real data. Even though the results are fairer than the real data when evaluating race bias in MIMIC-3, introducing biases in the opposite direction is not the ideal goal and thus, needs to be identified and rectified before this synthetic data is released for widespread use.
4.3 Fairness Mitigation
We apply four fairness mitigation techniques: EO thresholding, reweighing, reduction and HPS, on both the real and synthetic data to understand how they would improve the fairness of the models. These are then compared by generating box plots for the 10 runs of the experiment. The results for equal opportunity difference for the RF models are described in Figure LABEL:fig:fairness_mitigation_avg_odds_diff. The left subplot shows the range of equal opportunity difference scores between females and males while measuring gender bias in Cardiovascular data. The right subplot shows the range of equal opportunity difference scores between blacks and whites while measuring race bias in MIMIC-3 data. While the fairness mitigation techniques target for equalized odds, we discuss the average odds difference results as the existence of positive and negatives values shows if and how any improvements are compromising fairness towards a specific subgroup.
For gender bias in Cardiovascular data, we find that fairness mitigation techniques lead to small changes in the real data. Reduction () and HPS ()lead to statistically significant results than the real baseline. In synthetic data, we find that the variance is much more than the real data. EO thresholding, reweighing and reduction all lead to increased variance with only reweighing leading to better mean and median fairness scores with statistically significant difference (). HPS on synthetic data changes the bias from males to females while also being statistically significant () compared with its synthetic baseline. Thus, we find that the mitigation techniques do not work equally well on both the real and synthetic data, sometimes introducing non-existent biases.
For race bias in MIMIC-3 data, we clearly see the difference in the real and synthetic data baselines as discussed in the previous subsection. The real data is biased towards Whites while the synthetic data, even though fairer, is biased towards Whites in some cases and Blacks in others, introducing new biases. Fortunately, application of fairness mitigation techniques lead to improvements on both the real and synthetic data. EO thresholding, reweighing and reduction improve fairness while HPS reverses the direction of fairness on the real data. These differences are also statistically significant, indicating a definite change in fairness. Similar results are also observed in the synthetic data as well, however, the results are not statistically significant except for HPS () compared to the synthetic baseline.
We observe similar results for equal opportunity difference and equalized odds with their corresponding results included in \appendixrefapd:fairness_mitigation_results. We find that fairness mitigation techniques do lead to improvements in fairness scores for both the real and synthetic datasets. However, the extent of improvement varies and is sometimes not significant. Thus, we observe that different mitigation techniques work for real and synthetic dataset in the two cases considered. Furthermore, similar technique when applied on real and synthetic data does not result in similar improvements.
4.4 Utility-Fairness Trade-off
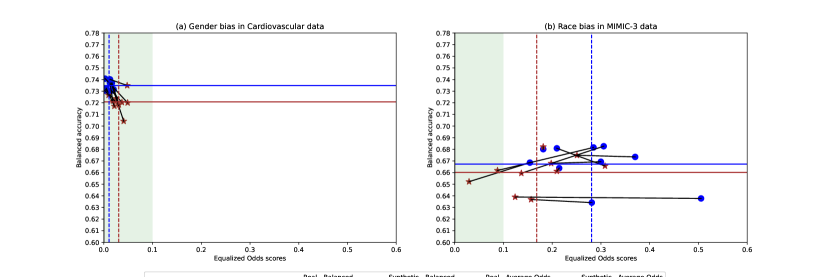
To understand the effect of fairness mitigation techniques on utility as measured by balanced accuracy, we created scatter plots between the fairness metrics and balanced accuracy. Figure LABEL:fig:mitigation_fairness_vs_utility_eq_odds shows the equalized odds and balanced accuracy plots. The plot is split into 4 subplots, the first two corresponding to gender bias in Cardiovascular data while the last two corresponding to the race bias in MIMIC-3 data for the RF models.
fig:mitigation_fairness_vs_utility_eq_odds

For gender bias in Cardiovascular dataset, we observe that application of all fairness mitigation techniques on the real data led to a decrease in equalized odds and balanced accuracy. The furthest drop was observed in reweighing, indicating that it not only led to increased unfairness but also worsened the performance of the model in terms of utility. However, these differences are not statistically significant as measured by paired t-test except for balanced accuracy difference observed in HPS (). In synthetic data, even though all mitigation techniques led to lower balanced accuracy scores, they did so for improving the fairness of the model. Reweighing led to improvements in fairness but at the cost of the most drop in balanced accuracy. This is not ideal as the difference in equalized odds are not significant while the reduced balanced accuracy is statistically significant (). On the other hand, HPS improved fairness with statistical significance () in comparison to the synthetic baseline while also not compromising on utility excessively. This difference in balanced accuracy of HPS in comparison to its synthetic baseline is also found to be statistically significant ().
For race bias in MIMIC-3 data, we observe that the fairness mitigation techniques perform significantly well across both the real and synthetic data. In the real data, HPS led to the most improvement in fairness while reducing the balanced accuracy the least. However, as seen through the results in the previous subsection, it introduces undesirable biases towards the black subgroup. On the other hand, EO thresholding, reweighing and reduction bring considerable improvements to fairness, however, at the cost of balanced accuracy. All these differences as measured for equalized odds and balanced accuracy scores are also statistically significant, indicating an actual improvement in fairness and simultaneous reduction in balanced accuracy. In the synthetic data, we find results similar to the real data. All fairness mitigation techniques led to improvements in fairness compared to both the real and synthetic baselines, however, at the cost of balanced accuracy. However, the relative improvements were minor in the synthetic data than the real data. The equalized odds improvements across all mitigation techniques are not statistically significant but the drop in balanced accuracies are.
Similar plots with average odds difference and equal opportunity difference are included in \appendixrefapd:fairness_mitigation_results. From the results, we make two observations. In gender bias evaluation, application of fairness mitigation techniques did not lead to improvements in fairness for the real data but did so for synthetic data. In race bias evaluation, while all techniques led to improvements in both the real and synthetic data, the improvements in synthetic data were less (mean values are horizontally compressed). Thus, we observe that application of fairness mitigation techniques do not always guarantee an improvement in fairness. In cases when we do observe improvements, it is at the cost of reduced utility. Thus, we conclude that the utility-fairness trade-off is quite evident in these datasets, often influenced by the choice of protected attribute and real vs. synthetic data.
5 Discussion
5.1 Synthetic data has variable fairness
To be useful in the real world, synthetic data should effectively capture the same degree of fairness or unfairness as in real data.
On analysing the prevalence rates for the various sub-groups in the two datasets, we found that synthetic data was over-representing certain groups and under-representing others. On measuring the utility and fairness for specific sub-groups of protected attributes, we found variable results between real and synthetic data. While evaluating gender bias in Cardiovascular dataset, we found that synthetic data had poorer fairness and utility. When evaluating race bias in MIMIC-3 dataset, even though the fairness improved in the synthetic data, the results were not ideal. In some models generated on synthetically generated data, there were high biases towards the female population which do not exist in the real data. Further, the mean balanced accuracy was lower too.
We conclude that the utility of the synthetic data is almost always lower than the real data. However, this does not lead to any guaranteed improvements in fairness. The results highlight that synthetic data generated for these datasets have less predictable movements in fairness and may create new biases. Thus, usage of these synthetic data without proper fairness evaluation can lead to solutions with unknown and undesired biases, rendering the results less than ideal for the real-world.
5.2 Real vs Synthetic fairness mitigation is not same
We conclude that application of fairness mitigation techniques often lead to improvements on both the real and synthetic data when the original data is unfair. However, the extent of observed improvements are often different.
As noted in gender bias analysis in Figure LABEL:fig:fairness_mitigation_avg_odds_diff, reduction and HPS led to statistically significant differences with the baseline for real data but reweighing and HPS had statistically significant differences with the baseline in the synthetic data. In contrast, all fairness improvements were significant for the real data but none for synthetic data in race bias analysis.
The fairness mitigation results highlight an important observation: Not only may synthetic data have undesired biases which are not present in the real data, but fairness mitigation techniques may be less effective as well. This implies that the same technique results in lower improvements on synthetic data, making it less ideal for current real-world use.
5.3 Utility reduction does not mean fairness improvement
From the results in Figure LABEL:fig:mitigation_fairness_vs_utility_eq_odds, we clearly see that application of any fairness mitigation technique leads to a reduction in balanced accuracy. However, such a reduction does not always lead to better fairness scores. Furthermore, a higher reduction in utility also does not guarantee a more fairer model.
The mitigation results suggest a trade-off between utility-fairness which is often exacerbated by synthetic data. Achieving higher fairness by using fairness mitigation techniques on these dataset often comes at the cost of reduced utility. These observations and discussions are specific to the patient cohorts considered but highlight that synthetic datasets are not bias free. Thus, based on the healthcare application and the required trade-offs, fairness metrics and mitigation techniques should be evaluated before data release.
6 Conclusion
Previously, synthetic healthcare data has been evaluated for utility, resemblance and privacy (Yale, 2020). However, as healthcare data is often biased, it is important to evaluate the synthetic data for fairness as well. In this paper, we generate synthetic data for two healthcare datasets and measure balanced accuracy and ML fairness metrics. To understand how unfairness can be mitigated, we also experiment with fairness mitigation techniques.
We find that synthetic data suffers from poorer utility in comparison to the real data while also having variable movements in fairness, sometimes leading to undesired biases. Application of fairness mitigation techniques generally lead to improvements in fairness but their effect on real and synthetic data is different. Some improvements in synthetic data from its baseline are also not statistically significant to be useful for fairness improvement. Further, these mitigation techniques often lead to reduced utility without guaranteeing an improved fairness environment.
We conclude that the synthetic data must be evaluated for fairness such that its real-world applicability can be identified. This suggests that data generation need to be improved. Data generators could incorporate a controlled way to handle fairness, such that the generated data is generated with known biases. Models similar to the representative and fair synthetic data generator (Tiwald et al., 2021) can be extended to the healthcare domain to generate fair data with high utility and resemblance, and controlled fairness and privacy. This future direction of work can lead to the development of data generators which can capture the real data fairness well and use it as a means for controlled fair healthcare data generation.
References
- Agarwal et al. (2018) Alekh Agarwal, Alina Beygelzimer, Miroslav Dudik, John Langford, and Hanna Wallach. A reductions approach to fair classification. In Jennifer Dy and Andreas Krause, editors, Proceedings of the 35th International Conference on Machine Learning, volume 80 of Proceedings of Machine Learning Research, pages 60–69. PMLR, 10–15 Jul 2018. URL https://proceedings.mlr.press/v80/agarwal18a.html.
- AI (2018) IBM Research Trusted AI. Ai fairness 360 - demo. https://aif360.mybluemix.net/check, 2018. Accessed: 2022-03-06.
- Arkhangelsky et al. (2021) Dmitry Arkhangelsky, Susan Athey, David A. Hirshberg, Guido W. Imbens, and Stefan Wager. Synthetic difference in differences, 2021.
- Athey et al. (2021) Susan Athey, Guido W. Imbens, Jonas Metzger, and Evan Munro. Using wasserstein generative adversarial networks for the design of monte carlo simulations. Journal of Econometrics, 2021. ISSN 0304-4076. https://doi.org/10.1016/j.jeconom.2020.09.013. URL https://www.sciencedirect.com/science/article/pii/S0304407621000440.
- Bellamy et al. (2018) Rachel KE Bellamy, Kuntal Dey, Michael Hind, Samuel C Hoffman, Stephanie Houde, Kalapriya Kannan, Pranay Lohia, Jacquelyn Martino, Sameep Mehta, Aleksandra Mojsilovic, et al. Ai fairness 360: An extensible toolkit for detecting, understanding, and mitigating unwanted algorithmic bias. arXiv preprint arXiv:1810.01943, 2018.
- Bhanot and Yale (2020) Karan Bhanot and Andrew Yale. synthetic_data. https://github.com/TheRensselaerIDEA/synthetic_data, 2020. Accessed: 2021-06-24.
- Bhanot et al. (2021a) Karan Bhanot, Saloni Dash, Joe Pedersen, Isabelle Guyon, and Kristin Bennett. Quantifying resemblance of synthetic medical time-series. In ESANN 2021 proceedings, European Symposium on Artificial Neural Networks, Computational Intelligence and Machine Learning., 2021a.
- Bhanot et al. (2021b) Karan Bhanot, Miao Qi, John S Erickson, Isabelle Guyon, and Kristin P Bennett. The problem of fairness in synthetic healthcare data. Entropy, 23(9):1165, 2021b.
- Bird et al. (2020) Sarah Bird, Miro Dudík, Richard Edgar, Brandon Horn, Roman Lutz, Vanessa Milan, Mehrnoosh Sameki, Hanna Wallach, and Kathleen Walker. Fairlearn: A toolkit for assessing and improving fairness in ai. Microsoft, Tech. Rep. MSR-TR-2020-32, 2020.
- Briot (2021) Jean-Pierre Briot. From artificial neural networks to deep learning for music generation: history, concepts and trends. Neural Computing and Applications, 33(1):39–65, 2021.
- Chakraborty and Farooq (2019) Prithwish Chakraborty and Faisal Farooq. A robust framework for accelerated outcome-driven risk factor identification from ehr. In Proceedings of the 25th ACM SIGKDD International Conference on Knowledge Discovery and Data Mining, KDD ’19, page 1800–1808, New York, NY, USA, 2019. Association for Computing Machinery. ISBN 9781450362016. 10.1145/3292500.3330718. URL https://doi.org/10.1145/3292500.3330718.
- Cheng et al. (2021) Victoria Cheng, Vinith M. Suriyakumar, Natalie Dullerud, Shalmali Joshi, and Marzyeh Ghassemi. Can you fake it until you make it? impacts of differentially private synthetic data on downstream classification fairness. In Proceedings of the 2021 ACM Conference on Fairness, Accountability, and Transparency, FAccT ’21, page 149–160, New York, NY, USA, 2021. Association for Computing Machinery. ISBN 9781450383097. 10.1145/3442188.3445879. URL https://doi.org/10.1145/3442188.3445879.
- Choi et al. (2017) Edward Choi, Siddharth Biswal, Bradley Malin, Jon Duke, Walter F Stewart, and Jimeng Sun. Generating multi-label discrete patient records using generative adversarial networks. In Machine learning for healthcare conference, pages 286–305. PMLR, 2017.
- Cowie et al. (2017) Martin R Cowie, Juuso I Blomster, Lesley H Curtis, Sylvie Duclaux, Ian Ford, Fleur Fritz, Samantha Goldman, Salim Janmohamed, Jörg Kreuzer, Mark Leenay, et al. Electronic health records to facilitate clinical research. Clinical Research in Cardiology, 106(1):1–9, 2017.
- Dash et al. (2020) Saloni Dash, Andrew Yale, Isabelle Guyon, and Kristin P Bennett. Medical time-series data generation using generative adversarial networks. In International Conference on Artificial Intelligence in Medicine, pages 382–391. Springer, 2020.
- El Emam et al. (2021) Khaled El Emam, Lucy Mosquera, Elizabeth Jonker, and Harpreet Sood. Evaluating the utility of synthetic covid-19 case data. JAMIA open, 4(1):ooab012, 2021.
- European Parliament and of the Council (2016) (2016, Apr. 27) European Parliament and of the Council (2016, Apr. 27). Directive 95/46/ec (general data protection regulation). L119, pages 1–88, 2016.
- for Disease Control and Prevention (2018) Centers for Disease Control and Prevention. Health insurance portability and accountability act of 1996 (hipaa), Sep 2018. URL https://www.cdc.gov/phlp/publications/topic/hipaa.html. Accessed: 2021-06-24.
- Goodfellow et al. (2014) Ian J. Goodfellow, Jean Pouget-Abadie, Mehdi Mirza, Bing Xu, David Warde-Farley, Sherjil Ozair, Aaron Courville, and Yoshua Bengio. Generative adversarial nets. In Proceedings of the 27th International Conference on Neural Information Processing Systems - Volume 2, NIPS’14, page 2672–2680, Cambridge, MA, USA, 2014. MIT Press. URL https://dl.acm.org/doi/10.5555/2969033.2969125.
- Gupta et al. (2021) Aman Gupta, Deepak Bhatt, and Anubha Pandey. Transitioning from real to synthetic data: Quantifying the bias in model, 2021.
- Hardt et al. (2016) Moritz Hardt, Eric Price, Eric Price, and Nati Srebro. Equality of opportunity in supervised learning. In D. Lee, M. Sugiyama, U. Luxburg, I. Guyon, and R. Garnett, editors, Advances in Neural Information Processing Systems, volume 29. Curran Associates, Inc., 2016. URL https://proceedings.neurips.cc/paper/2016/file/9d2682367c3935defcb1f9e247a97c0d-Paper.pdf.
- Hayes et al. (2019) Jamie Hayes, Luca Melis, George Danezis, and Emiliano De Cristofaro. Logan: Membership inference attacks against generative models. Proceedings on Privacy Enhancing Technologies, 2019(1):133–152, 2019. doi:10.2478/popets-2019-0008. URL https://doi.org/10.2478/popets-2019-0008.
- HIPAA Journal (2021) HIPAA Journal. The average cost of a healthcare data breach is now $9.42 million, Jul 2021. Accessed: 2022-01-13.
- Hitaj et al. (2017) Briland Hitaj, Giuseppe Ateniese, and Fernando Pérez-Cruz. Deep models under the GAN: information leakage from collaborative deep learning. CoRR, abs/1702.07464, 2017. URL http://arxiv.org/abs/1702.07464.
- Huang et al. (2018) Xun Huang, Ming-Yu Liu, Serge Belongie, and Jan Kautz. Multimodal unsupervised image-to-image translation. In Proceedings of the European Conference on Computer Vision (ECCV), September 2018.
- Johnson et al. (2016) Alistair EW Johnson, Tom J Pollard, Lu Shen, H Lehman Li-Wei, Mengling Feng, Mohammad Ghassemi, Benjamin Moody, Peter Szolovits, Leo Anthony Celi, and Roger G Mark. Mimic-iii, a freely accessible critical care database. Scientific data, 3(1):1–9, 2016.
- Kamiran and Calders (2012) Faisal Kamiran and Toon Calders. Data preprocessing techniques for classification without discrimination. Knowledge and Information Systems, 33(1):1–33, 2012.
- Karras et al. (2019) Tero Karras, Samuli Laine, and Timo Aila. A style-based generator architecture for generative adversarial networks. In Proceedings of the IEEE/CVF Conference on Computer Vision and Pattern Recognition (CVPR), June 2019.
- Kenfack et al. (2021) Patrik Joslin Kenfack, Daniil Dmitrievich Arapov, Rasheed Hussain, S.M. Ahsan Kazmi, and Adil Khan. On the fairness of generative adversarial networks (gans). In 2021 International Conference ”Nonlinearity, Information and Robotics” (NIR), pages 1–7, 2021. 10.1109/NIR52917.2021.9666131.
- Kurup et al. (2021) Lakshmi Kurup, Meera Narvekar, Rahil Sarvaiya, and Aditya Shah. Evolution of neural text generation: Comparative analysis. In Sanjiv K. Bhatia, Shailesh Tiwari, Su Ruidan, Munesh Chandra Trivedi, and K. K. Mishra, editors, Advances in Computer, Communication and Computational Sciences, pages 795–804, Singapore, 2021. Springer Singapore.
- McKeon (2021) Jill McKeon. This year’s largest healthcare data breaches, Dec 2021. Accessed: 2022-01-13.
- Mundkur et al. (2017) Mallika L Mundkur, Fiona M Callaghan, Swapna Abhyankar, and Clement J McDonald. Use of electronic health record data to evaluate the impact of race on 30-day mortality in patients admitted to the intensive care unit. Journal of racial and ethnic health disparities, 4(4):539–548, 2017.
- Observational Medical Outcomes Partnership (2017) Observational Medical Outcomes Partnership. Starr omop, 2017. URL https://med.stanford.edu/starr-omop.html. Accessed: 2022-01-13.
- Pedregosa et al. (2011) F. Pedregosa, G. Varoquaux, A. Gramfort, V. Michel, B. Thirion, O. Grisel, M. Blondel, P. Prettenhofer, R. Weiss, V. Dubourg, J. Vanderplas, A. Passos, D. Cournapeau, M. Brucher, M. Perrot, and E. Duchesnay. Scikit-learn: Machine learning in Python. Journal of Machine Learning Research, 12:2825–2830, 2011.
- Ross and Willson (2017) Amanda Ross and Victor L. Willson. Paired Samples T-Test, pages 17–19. SensePublishers, Rotterdam, 2017. ISBN 978-94-6351-086-8. 10.1007/978-94-6351-086-8_4. URL https://doi.org/10.1007/978-94-6351-086-8_4.
- Sondik et al. (2010) Edward J. Sondik, David T. Huang, Richard J. Klein, and David Satcher. Progress toward the healthy people 2010 goals and objectives. Annual Review of Public Health, 31(1):271–281, 2010. 10.1146/annurev.publhealth.012809.103613. URL https://doi.org/10.1146/annurev.publhealth.012809.103613. PMID: 20070194.
- Sutton et al. (2005) Erica J Sutton, Aideen McInerney-Leo, Carolyn A Bondy, Sarah E Gollust, Donnice King, and Barbara Biesecker. Turner syndrome: four challenges across the lifespan. American journal of medical genetics Part A, 139(2):57–66, 2005.
- Tiwald et al. (2021) Paul Tiwald, Alexandra Ebert, and Daniel T. Soukup. Representative & Fair Synthetic Data, 2021.
- Torfi et al. (2022) Amirsina Torfi, Edward A. Fox, and Chandan K. Reddy. Differentially private synthetic medical data generation using convolutional gans. Information Sciences, 586:485–500, 2022. ISSN 0020-0255. https://doi.org/10.1016/j.ins.2021.12.018. URL https://www.sciencedirect.com/science/article/pii/S0020025521012391.
- Ulianova (2019) Svetlana Ulianova. Cardiovascular disease dataset. https://www.kaggle.com/sulianova/cardiovascular-disease-dataset/metadata, 2019. Accessed: 2022-02-24.
- Virtanen et al. (2020) Pauli Virtanen, Ralf Gommers, Travis E. Oliphant, Matt Haberland, Tyler Reddy, David Cournapeau, Evgeni Burovski, Pearu Peterson, Warren Weckesser, Jonathan Bright, Stéfan J. van der Walt, Matthew Brett, Joshua Wilson, K. Jarrod Millman, Nikolay Mayorov, Andrew R. J. Nelson, Eric Jones, Robert Kern, Eric Larson, C J Carey, İlhan Polat, Yu Feng, Eric W. Moore, Jake VanderPlas, Denis Laxalde, Josef Perktold, Robert Cimrman, Ian Henriksen, E. A. Quintero, Charles R. Harris, Anne M. Archibald, Antônio H. Ribeiro, Fabian Pedregosa, Paul van Mulbregt, and SciPy 1.0 Contributors. SciPy 1.0: Fundamental Algorithms for Scientific Computing in Python. Nature Methods, 17:261–272, 2020. 10.1038/s41592-019-0686-2.
- Wiese et al. (2020) Magnus Wiese, Robert Knobloch, Ralf Korn, and Peter Kretschmer. Quant gans: deep generation of financial time series. Quantitative Finance, 20(9):1419–1440, 2020. 10.1080/14697688.2020.1730426. URL https://doi.org/10.1080/14697688.2020.1730426.
- Xie et al. (2018) Liyang Xie, Kaixiang Lin, Shu Wang, Fei Wang, and Jiayu Zhou. Differentially private generative adversarial network. CoRR, abs/1802.06739, 2018. URL http://arxiv.org/abs/1802.06739.
- Yale et al. (2020a) Andrew Yale, Saloni Dash, Karan Bhanot, Isabelle Guyon, John S. Erickson, and Kristin P. Bennett. Synthesizing quality open data assets from private health research studies. In Witold Abramowicz and Gary Klein, editors, Business Information Systems Workshops, pages 324–335, Cham, 2020a. Springer International Publishing. ISBN 978-3-030-61146-0.
- Yale et al. (2020b) Andrew Yale, Saloni Dash, Ritik Dutta, Isabelle Guyon, Adrien Pavao, and Kristin P Bennett. Generation and evaluation of privacy preserving synthetic health data. Neurocomputing, 416:244–255, 2020b.
- Yale (2020) Andrew Jonathan Yale. Privacy Preserving Synthetic Health Data Generation and Evaluation. Rensselaer Polytechnic Institute, 2020.
- Zhang et al. (2017) Han Zhang, Tao Xu, Hongsheng Li, Shaoting Zhang, Xiaogang Wang, Xiaolei Huang, and Dimitris N. Metaxas. Stackgan: Text to photo-realistic image synthesis with stacked generative adversarial networks. In Proceedings of the IEEE International Conference on Computer Vision (ICCV), Oct 2017.
- Zhu et al. (2017) Jun-Yan Zhu, Taesung Park, Phillip Isola, and Alexei A. Efros. Unpaired image-to-image translation using cycle-consistent adversarial networks. In Proceedings of the IEEE International Conference on Computer Vision (ICCV), Oct 2017.
Appendix A Fairness Metrics
Below are the mathematical definitions of the three Machine Learning (ML) fairness metrics used in the paper: Equal Opportunity Difference (Equation A), Average Odds Difference (Equation A), and Equalized Odds (Equation A). In the three definitions, True Positive Rate (TPR) is the ratio of correct predictions in the total predictions of the positive class and False Positive Rate (FPR) is the ratio of incorrect predictions of the positive class. In our study, a positive prediction (1) is when the model predicts that the patient died or has a cardiovascular disease. We define the two subgroups of a protected attribute as and .
| (1) |
| (2) |
| (3) |
Appendix B Real vs. Synthetic Fairness
We generate scatter plots comparing the balanced accuracy with fairness metrics for real and synthetic data across subgroups of gender in Cardiovascular dataset and race in MIMIC-3 dataset. Figure LABEL:fig:avg_odds_diff_real_vs_synth and LABEL:fig:eq_odds_real_vs_synthetic show the change in average odds difference and equalized odds for the 10 runs of the experiment as we move from real data to the corresponding synthetic data.
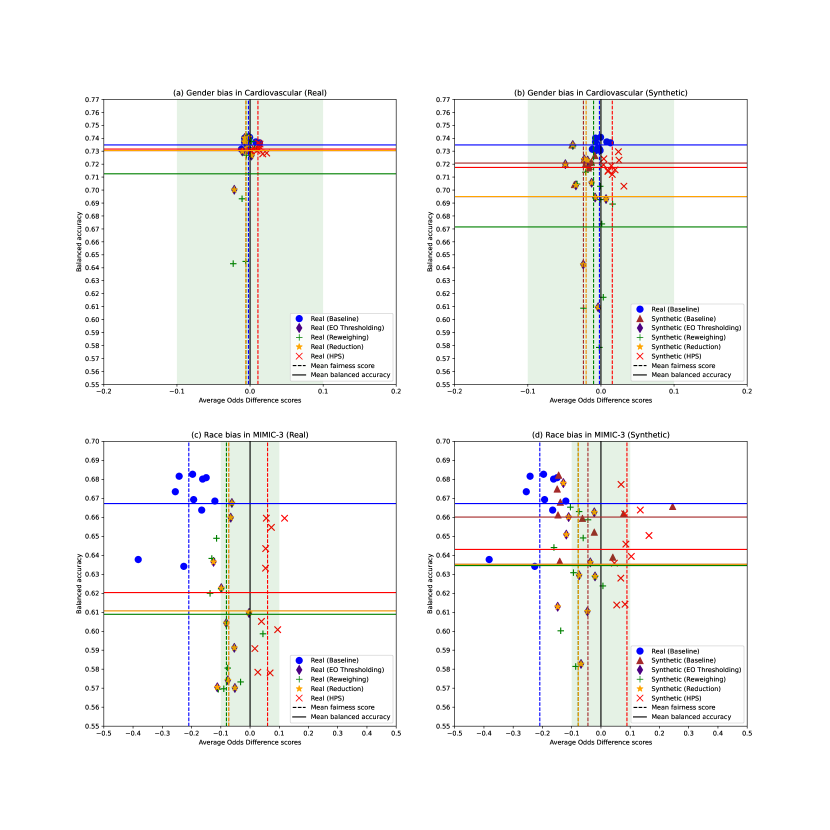
fig:avg_odds_diff_real_vs_synth

From Figure LABEL:fig:avg_odds_diff_real_vs_synth, we observe that the results are similar to equal opportunity difference plots. The mean fairness and balanced accuracy for synthetic data are lower than the real data for gender bias. However, there are undesired biases in the direction of the black subgroup in the synthetic MIMIC-3 data being evaluated for race bias.
fig:eq_odds_real_vs_synthetic
From Figure LABEL:fig:eq_odds_real_vs_synthetic, we observe a similar trend in equalized odds. Fairness is worse for gender bias in Cardiovascular synthetic datasets while it is better for race bias in MIMIC-3 synthetic dataset compared to the real datasets.
Appendix C Fairness Mitigation Results
The four mitigation techniques are applied on the real and synthetic datasets resulting in variable changes to utility and fairness. The fairness scores for equal opportunity difference are shown in Figure LABEL:fig:fairness_mitigation_eq_opp_diff and the scores for equalized odds are shown in Figure LABEL:fig:fairness_mitigation_eq_odds. The comparison of fairness scores with balanced accuracy values are shown in Figure LABEL:fig:mitigation_fairness_vs_utility_eq_opp_diff and Figure LABEL:fig:mitigation_fairness_vs_utility_avg_odds_diff. The Table LABEL:tab:fairness_mitigation_p_values shows the p-values for various fairness and utility comparisons with respect to their corresponding baselines.
fig:fairness_mitigation_eq_opp_diff
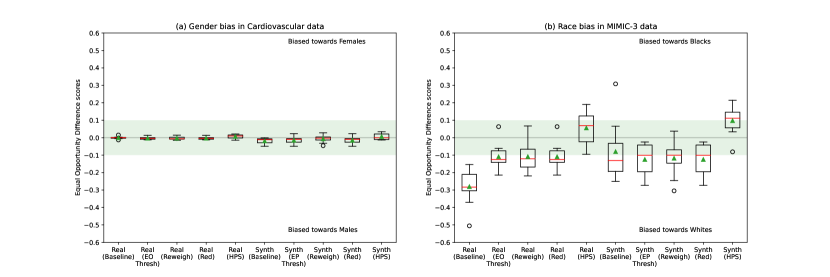
fig:fairness_mitigation_eq_odds
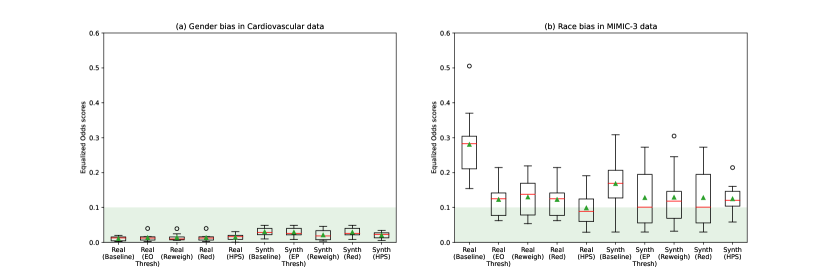
fig:mitigation_fairness_vs_utility_eq_opp_diff
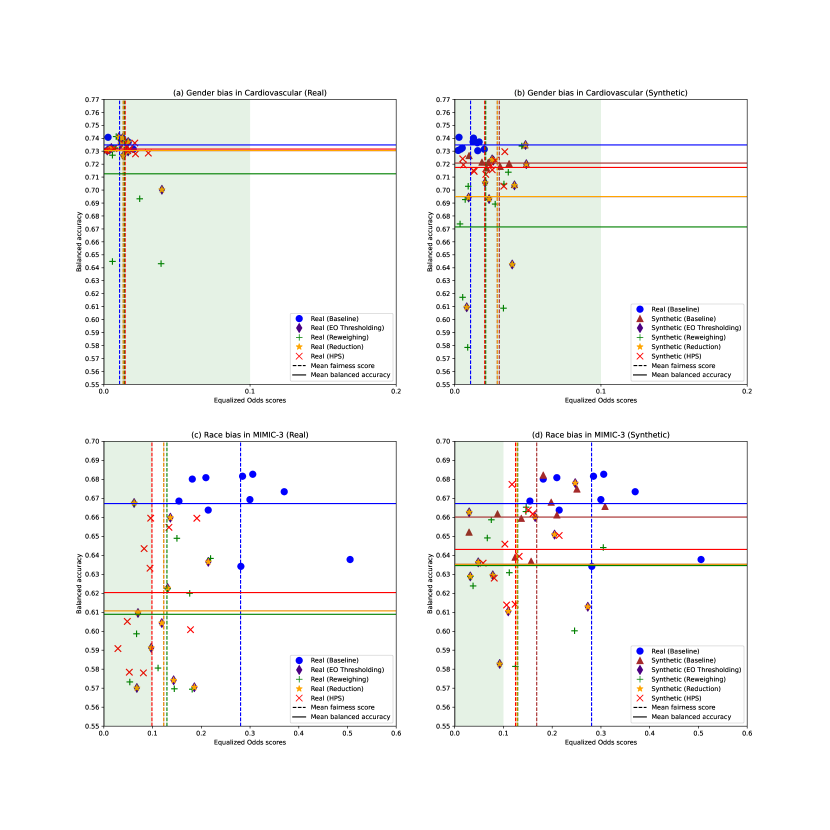
fig:mitigation_fairness_vs_utility_avg_odds_diff
tab:fairness_mitigation_p_values Bias Fairness Mitigation Bal Acc Avg Odds Equal Opp Eq Odds Gender EO Thresholding (Real) 0.2034 0.0955 0.0461* 0.2571 (Cardiovascular) Reweighing (Real) 0.0934 0.4935 0.2867 0.2054 Reduction (Real) 0.2034 0.0955 0.0461* 0.2571 HPS (Real) 0.0028* 0.187 0.0071* 0.0584 EO Thresholding (Synthetic) 0.0702 0.1561 0.3418 0.7863 Reweighing (Synthetic) 0.0156* 0.0192* 0.0336* 0.1516 Reduction (Synthetic) 0.0702 0.1561 0.3418 0.7863 HPS (Synthetic) 0.0015* 0.0485* 0.0002* 0.011* Race EO Thresholding (Real) 0.0019* 0.0001* 0.0000* 0.0001* (MIMIC-3) Reweighing (Real) 0.0022* 0.0000* 0.0001* 0.0002* Reduction (Real) 0.0019* 0.0001* 0.0000* 0.0001* HPS (Real) 0.0041* 0.0001* 0.0000* 0.0004* EO Thresholding (Synthetic) 0.0076* 0.4248 0.4485 0.3415 Reweighing (Synthetic) 0.0038* 0.544 0.4668 0.3223 Reduction (Synthetic) 0.0076* 0.4248 0.4485 0.3415 HPS (Synthetic) 0.0022* 0.0431* 0.0224* 0.1229