Unsupervised learning of two-component nematicity from STM data on magic angle bilayer graphene
Abstract
Moiré materials such as magic angle twisted bilayer graphene (MATBG) exhibit remarkable phenomenology, but present significant challenges for certain experimental methods, particularly scanning probes such as scanning tunneling microscopy (STM). Typical STM studies that can image tens of thousands of atomic unit cells can image roughly ten moiré cells, making data analysis statistically fraught. Here, we propose a method to mitigate this problem by aggregating STM conductance data from several bias voltages, and then using the unsupervised machine learning method of gaussian mixture model clustering to draw maximal insight from the resulting dataset. We apply this method, using as input coarse-grained bond variables respecting the point group symmetry, to investigate nematic ordering tendencies in MATBG for both charge neutral and hole-doped samples. For the charge-neutral dataset, the clustering reveals the surprising coexistence of multiple types of nematicity that are unrelated by symmetry, and therefore generically nondegenerate. By contrast, the clustering in the hole doped data is consistent with long range order of a single type. Beyond its value in analyzing nematicity in MATBG, our method has the potential to enhance understanding of symmetry breaking and its spatial variation in a variety of moiré materials.
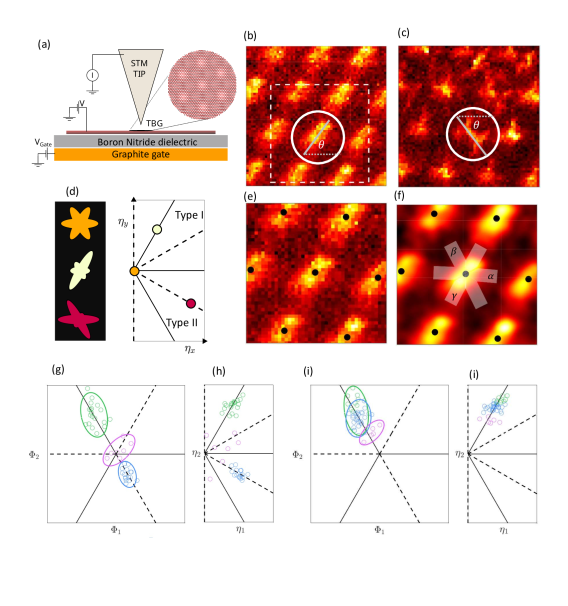
Magic angle twisted bilayer graphene (MATBG) and other moiré systems have emerged as highly tunable platforms for the experimental investigation of strongly correlated quantum matterAndrei and MacDonald (2020); Andrei et al. (2021). Rapid developments in multilayer graphitic systems have discovered rich phenomenology, including correlated insulating behavior Cao et al. (2018a), topological phasesNuckolls et al. (2020); Serlin et al. (2020); Choi et al. (2021); Saito et al. (2021); Das et al. (2021), superconductivityCao et al. (2018b); Park et al. (2021), and symmetry breaking such as orbital ferromagnetismSharpe et al. (2019); Lu et al. (2019) and other forms of flavor symmetry breakingZondiner et al. (2020); Wong et al. (2020), as well as nematicityJiang et al. (2019); Kerelsky et al. (2019); Choi et al. (2019); Cao et al. (2021); Rubio-Verdú et al. (2022); Samajdar et al. (2021). By virtue of its surface sensitivity and its spatial and energy resolution, scanning tunneling microscopy (STM) is one of the tools best suited to explore this physics. Indeed, STM studies have led to remarkable insights into local symmetry breaking tendencies in other materialsFischer et al. (2007). However, STM studies of moiré systems are challenging due to the large parameter space (the gate voltage, i.e. doping, being a new tuning parameter), as well as the large effective lattice constant, sketched in Fig. 1a . Because the lattice constant is so large, only a few unit cells are contained in a typical STM field of view (Figs. 1b,c), making edge effects significant. As a result, previous STM imaging studies on moiré systems have not explored spatial variations of symmetry breaking tendencies.
STM studies of moiré materials frequently observe the breaking of the rotational symmetry of the moiré lattice, as is strikingly illustrated in the STM conductance image of Fig. 1b. Rotational symmetry breaking, known as nematicity, is widely observed in correlated materials and increasingly provides a unifying thread among them Fradkin et al. (2010); Fernandes et al. (2019). While the symmetry broken in the most commonly studied materials is a rotation, the rotational symmetry of the moiré lattice introduces new aspects to the theoretical understanding of nematic orderXu et al. (2020); Fernandes and Venderbos (2020); Samajdar et al. (2021). Specifically, the nematic order parameter for symmetry breaking transforms under a two-dimensional representation of the point group. Hence, two inequivalent types of nematic order can develop: type-I, with one strong direction, and type-II, with one weak direction, as shown in Fig. 1d (see supplementary material section II). While the existence of these two types is guaranteed by symmetry, little is known about the microscopic conditions that favor each type. Moreover, no experimental studies to date have explored this additional nematic degree of freedom in moiré materials.
Here, we propose an unsupervised machine learning approach to detect the two types of nematicity and their spatial fluctuations from STM data on moiré materials. Lately, the community has made rapid progress in applying machine learningCarrasquilla (2020); Carleo et al. (2019) to experimental data on quantum matter from bulk probes such as resonant ultrasoundGhosh et al. (2020), neutron scatteringSamarakoon et al. (2020), and X-ray scatteringVenderley et al. (2022) and microscopic probes such as STMZiatdinov et al. (2016); Zhang et al. (2019); Cheung et al. (2020), electron microscopyCao et al. (2020), and quantum gas microscopyRem et al. (2019); Bohrdt et al. (2019); Miles et al. (2021). However, much of the literature has focused on supervised machine learning. One advantage of our technique is that, because it is unsupervised, it requires no training data, which is a significant advantage given the extraordinary difficulty of STM experiments. In previous work, this difficulty has been overcome using synthetic training data Zhang et al. (2019), but generating these data inevitably introduces bias. Unsupervised learning approaches look for naturally occurring clusters in the distribution of dataVenderley et al. (2022) and enable unbiased discoveries. A key challenge in a successful implementation of an unsupervised learning method is defining the feature space for clustering. Since we are interested in phenomena at the moire lattice scale, we introduce coarse-grained features centered at each moire lattice cite (see Fig. 1f). We then study spatial variations in type-I and type-II nematic tendencies by clustering the features.
The STM data used in this work have been obtained in the same experimental run as in Ref. Choi et al. (2019). MATBG is placed on an atomically smooth hexagonal boron nitride dielectric with the graphene gate underneath, Fig. 1a. In this configuration, MATBG can be doped electrostatically i.e., by simply changing the gate voltage. The spectroscopic maps used for investigating potential nematic phases were obtained at various doping levels and in close vicinity ( meV) of the Fermi level.
Our unsupervised learning approach consists of two steps: feature selection and clustering. The goal of the feature selection step is to define a nematic order parameter centered at each moiré lattice site. There are two complementary ways to describe nematic order in this setting, one borrowed from the physics of liquid crystals and the other from the theory of finite groups. Nematic liquid crystals are described using a headless vector, the director field , specifying the orientation of the long axis of the constituent molecules. For electronic liquid crystals on a lattice with symmetry, specifies an analogous elongation of local properties, and would naturally fall along high-symmetry lines–either along bond directions or mid-way between them. We dub these scenarios type I and type II nematicity respectively, as illustrated in Fig. 1d. From the group theory perspective, electronic nematicity can be described using a two-component order parameter transforming under the (or, informally, ) representation of . These perspectives are equivalent, according to
| (1) |
We extract a local nematic order parameter from the STM data by defining three coarse-grained bond variables as shown in Fig 1f, and constructing the order parameter as
| (2) | ||||
| (3) |
See supplementary material section 2 for further details.
Once we have collected the values of for each moiré lattice site and each bias voltage, we proceed to the clustering step. We combine order parameter values from selected voltage windows into a larger dataset for improved statistics, and then quantify the distribution of these data using gaussian mixture modeling (GMM)Bishop (2006). In GMM, each data point is assumed to have been drawn, with some probability (or “weight”) from one of several gaussians. The means and variances of the conjectured gaussian distributions, as well as their weights, are learned by maximizing the likelihood of the dataset being drawn from the model. The clustering can quantify two distinct phenomena regarding local nematicity: spatial coexistence of different nematic tendencies, be it orientation or type, and long-range correlation of one nematic tendency. Separation between different clusters will signify multiple nematic tendencies coexisting within the field of view (see Fig. 1g-h). The spatial distribution of each cluster will establish correlation length of each nematic tendency. On the other hand, overlap among the clusters will signify long-range (limited by the field-of-view) correlation of one nematic tendency (see Fig. 1i-j).
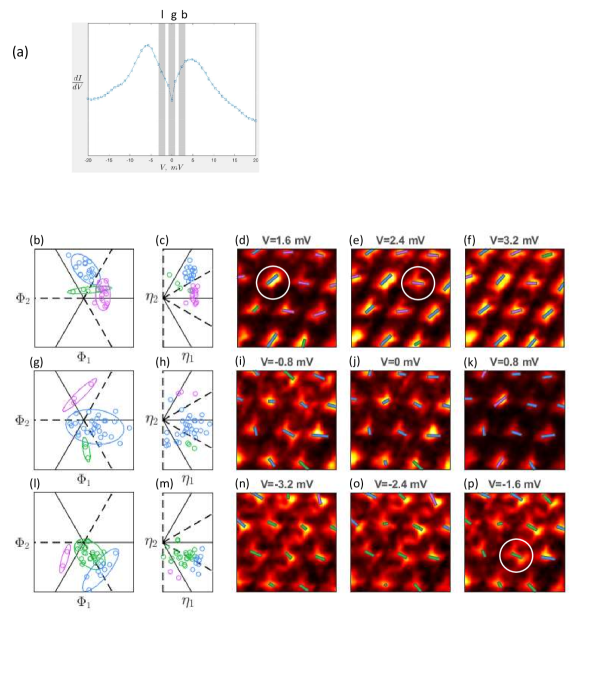
We first apply our analysis to data at charge neutrality point, with results shown in Fig. 2. We focus on the vicinity of zero bias, specifically, the regions marked by gray strips in Fig. 2a, which shows the field-of-view averaged conductance as a function of bias voltage. In this region the sample exhibits the coexistence of different types of nematicity, as well as rapid variation of nematicity with bias voltage. At small positive voltages (rightmost strip of Fig. 2a) the clustering in the two-component order parameter space (Fig. 2b) yields results similar to the clustering of the synthetic data of Fig. 1g,h: the two clusters with appreciable populations (in magenta and cyan) are well separated both from the origin and from each other. Fig. 2 plots these data in the plane, and shows that the magenta cluster corresponds to type I nematicity while the blue cluster is of type II. This is borne out visually in the conductance images of panels (d)-(f), in which the two major clusters form spatially separated regions. The data show phase separation between type I, typified by the the circled site of panel (e), and type II, typified by the circled site of panel (d).
The coexistence of the two types, which are not related by any symmetry, is unexpected on theoretical grounds. Note that, because of the near equal population of data points in the two main clusters, a simple average of the data set shown would not yield a result along a high-symmetry axis, and would therefore miss this mesoscale spatial variation of well-developed nematicity.
Near zero bias (Fig. 2g,h), the clustering assigns nearly all of the data points to a single broad cluster (blue). The corresponding values of (Fig. 2h) are also very broadly distributed, as would be expected in a disorded nematic phase with spatial fluctuations of large amplitude but extremely small correlation length. At small negative voltages there are again two significant clusters, in blue and green, but both of type II character, with typical director near , apparently modeling amplitude variation of a single type. This is consistent with the predominance of x-shaped motifs (similar to the illustration in the bottom left of Fig. 1d) in the conductance images of (n)-(p), such as the site circled in (p). The dramatic bias voltage dependence of both the effective number of clusters and their underlying distributions indicates strong correlation effects among low energy excitations.
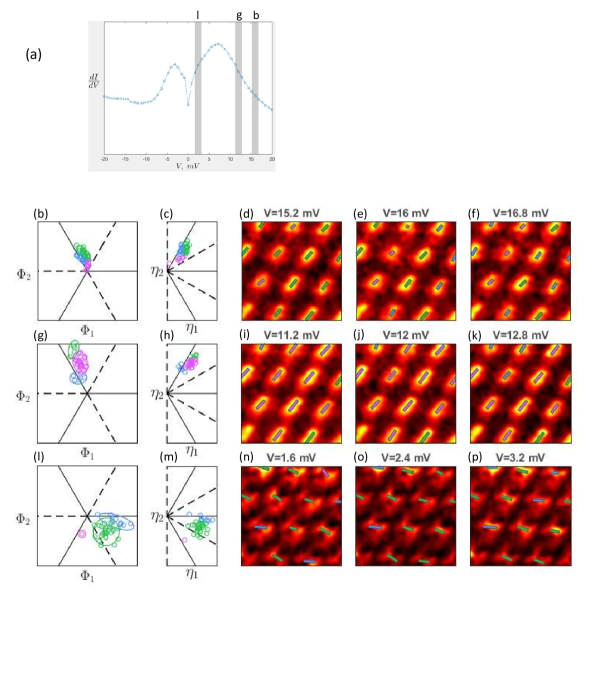
Under hole doping, shown in Fig. 3, the sample exhibits dramatically different behavior. In contrast to the results above, the clusters are generally contiguous, covering a range of variation of either the amplitude of the nematic order parameter or its angle. As the bias is lowered, weak type I nematicity gives way to strong, and eventually to a continuous distribution of angles with no well defined type. For large positive bias (rightmost strip in panel (a), with data plotted in panel (b)), the GMM fit finds three clusters that all have values of near the high-symmetry axis at . Equivalently, as shown in panel (c), points near for each cluster, indicative of the nearly homogenous type I behavior obvious to the eye from the rod-like motifs in the conductance images of (d)-(f). Data for slightly smaller voltages, plotted in panels (g) and (h), exhibit similar behavior but with larger amplitude, with three clusters which, while clearly separated, all lie along the same high-symmetry line. This is consistent with a picture of long range order with spatial variation of the order parameter amplitude, as is evident in the varying intensity of the rods of (i)-(k).
At small positive bias voltage, panels (l),(m), the nematicity is of a completely different character, with the directions of and much more broadly distributed, but always far from . Here, there are only two clusters of significant population, both meaningfully separated from the origin, and spread between the high-symmetry directions of and . The associated distributions overlap, and the nematic director varies continuously in angle, as can be seen in the conductance distributions in (n)-(p). Remarkably, however, this nematicity (which is of comparable strength to that exhibited at higher bias voltages), has angle completely different angle than the order parameter of the apparent long range order at larger bias. As such, we find evidence of long range order that manifests itself in a strongly bias-dependent fashion.
The variety of phenomenology encountered in these results is quite striking considering that they are all taken within the exact same same field of view (at multiple dopings and bias voltages). Among the bias voltage windows considered, some suggest strong nematic fluctuations without any order, others suggest well-established order of type I, others of type II, and still others the coexistence of both types. This coexistence is unexpected from a theoretical perspective–the two types are not related by symmetry, and therefore in general are not degenerate. An external symmetry breaking field such as strain, which would have some fixed set of principal axes, and would be expected to definitively prefer one type over the other. This fact, as well as the broader profusion of nematic behavior, may indicate that nematicity (whether long-range ordered or not) is an intrinsic correlation effect within this region of the sample.
To summarize, we have developed a new set of tools for the analysis of STM data on moiré materials that can help overcome the challenges posed by the large size of the unit cell, and have applied these tools to analyze nematic order in MATBG. The first tool uses coarse graining of conductance images to define a local nematic order parameter at each site that accords with the rotational symmetry breaking readily observable by eye. This order parameter transforms under the correct two dimensional representation of the point group, and therefore it can be used both to make contact with theoretical analysis and to capture the previously unexplored physics of the two qualitatively distinct types of nematicity. The second tool consists of the application of gaussian mixture model clustering to data sets aggregated from order parameter values at multiple sites and bias voltages. This aggregation mitigates the problem of the small number of moiré unit cells within the field of view, and the clustering can reveal the coexistence of multiple qualitative types of nematicity where present. Applying these tools to data from hole-doped and charge-neutral MATBG, we find indications of both types of nematic order as well as coexistence thereof, suggesting strong intrinsic nematic tendencies in this material.
We expect both steps of our method to have broader applicability. First, the local order parameter we define can be applied to any image generated by STM (or other imaging techniques), and by virtue of its symmetry can describe any “universal” nematic physics contained therein. Further, the coarse graining procedures we have developed can easily be applied to other forms of symmetry breaking, or in other materialsLi et al. (2021). Second, our aggregation and clustering procedure will be generally helpful when data are limited by experimental conditions, and constitutes an objective method for discovery of a range of nematic (or other symmetry breaking) behavior.
Acknowledgements. SL,PI, AGW, and E-AK acknowledge NSF, Institutes for Data-Intensive Research in Science and Engineering – Frameworks (OAC-19347141934714). SL is supported by the U.S. Department of Energy, Office of Science, National Quantum Information Science Research Centers, Quantum Systems Accelerator (QSA). S.N-P. acknowledges support from the NSF (grant DMR-2005129) and the Sloan Foundation (grant FG-2020-13716).
References
- Andrei and MacDonald (2020) E. Y. Andrei and A. H. MacDonald, Graphene bilayers with a twist, Nature Materials 19, 1265–1275 (2020).
- Andrei et al. (2021) E. Y. Andrei, D. K. Efetov, P. Jarillo-Herrero, A. H. MacDonald, K. F. Mak, T. Senthil, E. Tutuc, A. Yazdani, and A. F. Young, The marvels of moirématerials, Nature Reviews Materials 6, 201–206 (2021).
- Cao et al. (2018a) Y. Cao, V. Fatemi, A. Demir, S. Fang, S. L. Tomarken, J. Y. Luo, J. D. Sanchez-Yamagishi, K. Watanabe, T. Taniguchi, E. Kaxiras, R. C. Ashoori, and P. Jarillo-Herrero, Correlated insulator behaviour at half-filling in magic-angle graphene superlattices, Nature 556, 80–84 (2018a).
- Nuckolls et al. (2020) K. P. Nuckolls, M. Oh, D. Wong, B. Lian, K. Watanabe, T. Taniguchi, B. A. Bernevig, and A. Yazdani, Strongly correlated chern insulators in magic-angle twisted bilayer graphene, Nature 588, 610–615 (2020).
- Serlin et al. (2020) M. Serlin, C. L. Tschirhart, H. Polshyn, Y. Zhang, J. Zhu, K. Watanabe, T. Taniguchi, L. Balents, and A. F. Young, Intrinsic quantized anomalous hall effect in a moiré heterostructure, Science 367, 900–903 (2020).
- Choi et al. (2021) Y. Choi, H. Kim, Y. Peng, A. Thomson, C. Lewandowski, R. Polski, Y. Zhang, H. S. Arora, K. Watanabe, T. Taniguchi, J. Alicea, and S. Nadj-Perge, Correlation-driven topological phases in magic-angle twisted bilayer graphene, Nature 589, 536–541 (2021).
- Saito et al. (2021) Y. Saito, J. Ge, L. Rademaker, K. Watanabe, T. Taniguchi, D. A. Abanin, and A. F. Young, Hofstadter subband ferromagnetism and symmetry-broken chern insulators in twisted bilayer graphene, Nature Physics 17, 478–481 (2021).
- Das et al. (2021) I. Das, X. Lu, J. Herzog-Arbeitman, Z.-D. Song, K. Watanabe, T. Taniguchi, B. A. Bernevig, and D. K. Efetov, Symmetry-broken chern insulators and rashba-like landau-level crossings in magic-angle bilayer graphene, Nature Physics 17, 710–714 (2021).
- Cao et al. (2018b) Y. Cao, V. Fatemi, S. Fang, K. Watanabe, T. Taniguchi, E. Kaxiras, and P. Jarillo-Herrero, Unconventional superconductivity in magic-angle graphene superlattices, Nature 556, 43–50 (2018b).
- Park et al. (2021) J. M. Park, Y. Cao, K. Watanabe, T. Taniguchi, and P. Jarillo-Herrero, Tunable strongly coupled superconductivity in magic-angle twisted trilayer graphene, Nature 590, 249–255 (2021).
- Sharpe et al. (2019) A. L. Sharpe, E. J. Fox, A. W. Barnard, J. Finney, K. Watanabe, T. Taniguchi, M. A. Kastner, and D. Goldhaber-Gordon, Emergent ferromagnetism near three-quarters filling in twisted bilayer graphene, Science 365, 605–608 (2019).
- Lu et al. (2019) X. Lu, P. Stepanov, W. Yang, M. Xie, M. A. Aamir, I. Das, C. Urgell, K. Watanabe, T. Taniguchi, G. Zhang, A. Bachtold, A. H. MacDonald, and D. K. Efetov, Superconductors, orbital magnets and correlated states in magic-angle bilayer graphene, Nature 574, 653–657 (2019).
- Zondiner et al. (2020) U. Zondiner, A. Rozen, D. Rodan-Legrain, Y. Cao, R. Queiroz, T. Taniguchi, K. Watanabe, Y. Oreg, F. von Oppen, A. Stern, E. Berg, P. Jarillo-Herrero, and S. Ilani, Cascade of phase transitions and dirac revivals in magic-angle graphene, Nature 582, 203–208 (2020).
- Wong et al. (2020) D. Wong, K. P. Nuckolls, M. Oh, B. Lian, Y. Xie, S. Jeon, K. Watanabe, T. Taniguchi, B. A. Bernevig, and A. Yazdani, Cascade of electronic transitions in magic-angle twisted bilayer graphene, Nature 582, 198–202 (2020).
- Jiang et al. (2019) Y. Jiang, X. Lai, K. Watanabe, T. Taniguchi, K. Haule, J. Mao, and E. Y. Andrei, Charge order and broken rotational symmetry in magic-angle twisted bilayer graphene, Nature 573, 91–95 (2019).
- Kerelsky et al. (2019) A. Kerelsky, L. J. McGilly, D. M. Kennes, L. Xian, M. Yankowitz, S. Chen, K. Watanabe, T. Taniguchi, J. Hone, C. Dean, A. Rubio, and A. N. Pasupathy, Maximized electron interactions at the magic angle in twisted bilayer graphene, Nature 572, 95–100 (2019).
- Choi et al. (2019) Y. Choi, J. Kemmer, Y. Peng, A. Thomson, H. Arora, R. Polski, Y. Zhang, H. Ren, J. Alicea, G. Refael, F. von Oppen, K. Watanabe, T. Taniguchi, and S. Nadj-Perge, Electronic correlations in twisted bilayer graphene near the magic angle, Nature Physics 15, 1174–1180 (2019).
- Cao et al. (2021) Y. Cao, D. Rodan-Legrain, J. M. Park, N. F. Q. Yuan, K. Watanabe, T. Taniguchi, R. M. Fernandes, L. Fu, and P. Jarillo-Herrero, Nematicity and competing orders in superconducting magic-angle graphene, Science 372, 264–271 (2021).
- Rubio-Verdú et al. (2022) C. Rubio-Verdú, S. Turkel, Y. Song, L. Klebl, R. Samajdar, M. S. Scheurer, J. W. F. Venderbos, K. Watanabe, T. Taniguchi, H. Ochoa, L. Xian, D. M. Kennes, R. M. Fernandes, Á. Rubio, and A. N. Pasupathy, Moiré nematic phase in twisted double bilayer graphene, Nature Physics 18, 196–202 (2022).
- Samajdar et al. (2021) R. Samajdar, M. S. Scheurer, S. Turkel, C. Rubio-Verdú, A. N. Pasupathy, J. W. F. Venderbos, and R. M. Fernandes, Electric-field-tunable electronic nematic order in twisted double-bilayer graphene, 2D Materials 8, 034005 (2021).
- Fischer et al. (2007) O. Fischer, M. Kugler, I. Maggio-Aprile, C. Berthod, and C. Renner, Scanning tunneling spectroscopy of high-temperature superconductors, Rev. Mod. Phys. 79, 353–419 (2007).
- Fradkin et al. (2010) E. Fradkin, S. A. Kivelson, M. J. Lawler, J. P. Eisenstein, and A. P. Mackenzie, Nematic fermi fluids in condensed matter physics, Annual Review of Condensed Matter Physics 1, 153–178 (2010).
- Fernandes et al. (2019) R. M. Fernandes, P. P. Orth, and J. Schmalian, Intertwined vestigial order in quantum materials: Nematicity and beyond, Annual Review of Condensed Matter Physics 10, 133–154 (2019).
- Xu et al. (2020) Y. Xu, X.-C. Wu, C.-M. Jian, and C. Xu, Orbital order and possible non-fermi liquid in moiré systems, Phys. Rev. B 101, 205426 (2020).
- Fernandes and Venderbos (2020) R. M. Fernandes and J. W. F. Venderbos, Nematicity with a twist: Rotational symmetry breaking in a moiré superlattice, Science Advances 6, eaba8834 (2020).
- Carrasquilla (2020) J. Carrasquilla, Machine learning for quantum matter, Advances in Physics: X 5, 1797528 (2020), https://doi.org/10.1080/23746149.2020.1797528 .
- Carleo et al. (2019) G. Carleo, I. Cirac, K. Cranmer, L. Daudet, M. Schuld, N. Tishby, L. Vogt-Maranto, and L. Zdeborová, Machine learning and the physical sciences, Rev. Mod. Phys. 91, 045002 (2019).
- Ghosh et al. (2020) S. Ghosh, M. Matty, R. Baumbach, E. D. Bauer, K. A. Modic, A. Shekhter, J. A. Mydosh, E.-A. Kim, and B. J. Ramshaw, One-component order parameter in uru¡sub¿2¡/sub¿si¡sub¿2¡/sub¿ uncovered by resonant ultrasound spectroscopy and machine learning, Science Advances 6, eaaz4074 (2020).
- Samarakoon et al. (2020) A. M. Samarakoon, K. Barros, Y. W. Li, M. Eisenbach, Q. Zhang, F. Ye, V. Sharma, Z. L. Dun, H. Zhou, S. A. Grigera, C. D. Batista, and D. A. Tennant, Machine-learning-assisted insight into spin ice dy2ti2o7, Nature Communications 11, 892 (2020).
- Venderley et al. (2022) J. Venderley, K. Mallayya, M. Matty, M. Krogstad, J. Ruff, G. Pleiss, V. Kishore, D. Mandrus, D. Phelan, L. Poudel, A. G. Wilson, K. Weinberger, P. Upreti, M. Norman, S. Rosenkranz, R. Osborn, and E.-A. Kim, Harnessing interpretable and unsupervised machine learning to address big data from modern x-ray diffraction, Proceedings of the National Academy of Sciences 119, e2109665119 (2022).
- Ziatdinov et al. (2016) M. Ziatdinov, A. Maksov, L. Li, A. S. Sefat, P. Maksymovych, and S. V. Kalinin, Deep data mining in a real space: separation of intertwined electronic responses in a lightly doped BaFe2as2, Nanotechnology 27, 475706 (2016).
- Zhang et al. (2019) Y. Zhang, A. Mesaros, K. Fujita, S. D. Edkins, M. H. Hamidian, K. Ch’ng, H. Eisaki, S. Uchida, J. C. S. Davis, E. Khatami, and E.-A. Kim, Machine learning in electronic-quantum-matter imaging experiments, Nature 570, 484–490 (2019).
- Cheung et al. (2020) S. C. Cheung, J. Y. Shin, Y. Lau, Z. Chen, J. Sun, Y. Zhang, M. A. Müller, I. M. Eremin, J. N. Wright, and A. N. Pasupathy, Dictionary learning in fourier-transform scanning tunneling spectroscopy, Nature Communications 11, 1081 (2020).
- Cao et al. (2020) M. Cao, M. Matty, Z. Chen, L. Li, E.-A. Kim, and D. Muller, Machine learning for phase retrieval from 4d-stem data, Microscopy and Microanalysis 26, 8–9 (2020).
- Rem et al. (2019) B. S. Rem, N. Käming, M. Tarnowski, L. Asteria, N. Fläschner, C. Becker, K. Sengstock, and C. Weitenberg, Identifying quantum phase transitions using artificial neural networks on experimental data, Nature Physics 15, 917–920 (2019).
- Bohrdt et al. (2019) A. Bohrdt, C. S. Chiu, G. Ji, M. Xu, D. Greif, M. Greiner, E. Demler, F. Grusdt, and M. Knap, Classifying snapshots of the doped hubbard model with machine learning, Nature Physics 15, 921–924 (2019).
- Miles et al. (2021) C. Miles, A. Bohrdt, R. Wu, C. Chiu, M. Xu, G. Ji, M. Greiner, K. Q. Weinberger, E. Demler, and E.-A. Kim, Correlator convolutional neural networks as an interpretable architecture for image-like quantum matter data, Nature Communications 12, 3905 (2021).
- Bishop (2006) C. M. Bishop, Pattern Recognition and Machine Learning (Information Science and Statistics) (Springer-Verlag, Berlin, Heidelberg, 2006).
- Li et al. (2021) H. Li, S. Li, E. C. Regan, D. Wang, W. Zhao, S. Kahn, K. Yumigeta, M. Blei, T. Taniguchi, K. Watanabe, S. Tongay, A. Zettl, M. F. Crommie, and F. Wang, Imaging two-dimensional generalized wigner crystals, Nature 597, 650–654 (2021).