The Circumstellar Environments of Double-Peaked, Calcium-strong Supernovae 2021gno and 2021inl
Abstract
We present panchromatic observations and modeling of calcium-strong supernovae (SNe) 2021gno in the star-forming host galaxy NGC 4165 and 2021inl in the outskirts of elliptical galaxy NGC 4923, both monitored through the Young Supernova Experiment (YSE) transient survey. The light curves of both SNe show two peaks, the former peak being derived from shock cooling emission (SCE) and/or shock interaction with circumstellar material (CSM). The primary peak in SN 2021gno is coincident with luminous, rapidly decaying X-ray emission ( erg s-1) detected by Swift-XRT at day after explosion, this observation being the second ever detection of X-rays from a calcium-strong transient. We interpret the X-ray emission in the context of shock interaction with CSM that extends to cm. Based on X-ray modeling, we calculate a CSM mass M⊙ and density cm-3. Radio non-detections indicate a low-density environment at larger radii ( cm) and mass loss rate of M⊙ yr-1. SCE modeling of both primary light curve peaks indicates an extended progenitor envelope mass M⊙ and radius R⊙. The explosion properties suggest progenitor systems containing either a low-mass massive star or a white dwarf (WD), the former being unlikely given the lack of local star formation. Furthermore, the environments of both SNe are consistent with low-mass hybrid He/C/O WD + C/O WD mergers.
tablenum \restoresymbolSIXtablenum
1 Introduction
Calcium-rich (Ca-rich) transients are a peculiar class of stellar explosions whose progenitor system remains ambiguous (Filippenko et al., 2003; Perets et al., 2010a; Kasliwal et al., 2012). These SNe are defined primarily based on an observed integrated emission line flux ratio of [Ca ii]/[O i] ¿ 2 when the explosion has reached its nebular phase (Milisavljevic et al., 2017) and the current sample consists of confirmed objects. Consequently, these SNe are labeled as “Ca-rich” compared to other transients when observed in their optically thin regime. However, because modeling of these SNe has indicated that they do not in fact produce more Ca in abundance relative to O (Milisavljevic et al., 2017; Jacobson-Galán et al., 2020a; Jacobson-Galán et al., 2021), but rather are simply “rich” in Ca ii emission, we choose to adopt an alternative naming convention and refer to these as “Ca-strong transients” (CaSTs) from this point forward (Shen et al., 2019).
Beyond their prominent Ca ii emission, CaSTs have other observational characteristics that make them a well-defined explosion class. Firstly, these SNe are typically low-luminosity explosions ( mag) that have a fast photometric evolution (e.g., rise-times days) (Taubenberger, 2017). Physically, CaSTs are typically low energy explosions ( erg) that produce small amounts of ejecta () and (); the latter being the dominant radioactive isotope that dictates their peak light curve luminosities. Spectroscopically, most CaSTs exhibit type I spectra with prominent He i transitions at early-times and then experience an expedited transition to nebular phases where [Ca ii] dominates. Lastly, the explosion environments of early samples of CaSTs showed a strong preference towards the outskirts of early-type galaxies where no star formation was detected, indicating a compact progenitor star e.g., a white dwarf (WD) system (Perets et al., 2010a, 2011; Kasliwal et al., 2012; Lyman et al., 2014; Foley, 2015; Lunnan et al., 2017; Dong et al., 2022). However, as the sample of confirmed CaSTs has grown, there has been increased diversity in the host environments of new objects. For example, CaSTs such as iPTF15eqv (Milisavljevic et al., 2017), iPTF16hgs (De et al., 2018a), SN 2016hnk (Galbany et al., 2019; Jacobson-Galán et al., 2020b) and SN 2019ehk (Jacobson-Galán et al., 2020a; Nakaoka et al., 2021) were all discovered in star-forming host galaxies, while a number of CaSTs reported in a recent sample by De et al. (2020a) continued to show a preference towards early-type hosts.
Many of these SNe were found at relatively large offsets from their host galaxy nuclei (Perets & Beniamini, 2021, and references therein), showing a different offset distribution than type Ia SNe (Kasliwal et al., 2012), which prompts suggestions of the progenitors residing in globular clusters or ejected at high velocities from their original formation closer to the host galaxy nuclei (Perets et al., 2010a; Foley, 2015; Shen et al., 2019). However, a more detailed study (Perets & Beniamini, 2021) showed that the large offsets originate from the SNe in early-type galaxies (also consistent with the two new SNe we discuss here), where a large fraction of the CaST SNe are found. In such galaxies the old stellar population extend to large distances, and the overall large offset distribution is consistent with the distribution of the old stellar populations in such galaxies, further supporting an old stellar progenitors for likely the majority of the CaST SNe (Perets, 2014a; Perets & Beniamini, 2021).
While the heterogeneous environments of CaSTs make it difficult to constrain a single progenitor channel, there have been significant constraints made to the parameter space of viable CaST progenitor systems. Firstly, the discovery of multiple CaSTs with double-peaked light curves (e.g., iPTF16hgs, SN 2018lqo, SN 2019ehk; De et al. 2018a, 2020a; Jacobson-Galán et al. 2020a) has indicated that the progenitors of at least some of these transients must arise from stars surrounded by either extended envelopes or confined CSM. Another major breakthrough in the study of these objects came from the discovery of the closest CaST to date, SN 2019ehk, which exploded in the spiral host galaxy M100 at Mpc (Jacobson-Galán et al., 2020a; Nakaoka et al., 2021; De et al., 2021). SN 2019ehk was detected within 10 hours of explosion and produced luminous X-ray emission, coincident with shock-ionized spectral emission lines and a double-peaked light curve (Jacobson-Galán et al. 2020a, hereafter WJG20a). The combination of these observations (X-ray to radio) revealed that the SN 2019ehk progenitor star exploded into a confined shell of H- and He-rich CSM with mass of . Furthermore, SN 2019ehk is the first CaST with pre-explosion HST imaging, which revealed no detectable progenitor, but did constrain the possible progenitor channels to a low-mass massive star () or a WD system. Lastly, given its close proximity, SN 2019ehk was imaged out to 400 days post-explosion, which allowed for the tightest constraints to date to be made on the total amount of synthesized radioactive decay isotopes and in a CaST; the isotope mass ratio suggesting a progenitor channel involving the merger of low-mass WDs (Jacobson-Galán et al., 2021).
In this paper, we present, analyze and model multi-wavelength observations (X-ray to radio) of two new CaSTs, SNe 2021gno and 2021inl, both with double-peaked optical light curves. SN 2021gno was discovered with an apparent magnitude of 18.2 mag by the Zwicky Transient Facility (ZTF) on 20 March 2021 (MJD 59293.2) and is located at , (Bruch et al., 2021). While SN 2021gno was originally classified as both a type II and type IIb SN (Hung et al., 2021), the spectral time series, coupled with its light curve evolution, indicates that it belongs in the CaST class. SN 2021inl was discovered by ZTF on 07 April 2021 (MJD 59311.2) with a detection magnitude of 19.5 mag and is located at , (Munoz-Arancibia et al., 2021). SN 2021inl was classified as a type Ib-peculiar and was noted to be spectroscopically consistent with the “Ca-rich” transient class (Taggart et al., 2021).
| Host Galaxy | NGC 4165 | |||||
| Galaxy Type | SAB(r)a | |||||
| Galactic Offset | ||||||
| Redshift | ||||||
| Distance | Mpc111Theureau et al. (2007) | |||||
| Distance Modulus, | mag | |||||
| Time of Explosion (MJD) | 59292.7 0.6 | |||||
| 0.030 0.001 mag | ||||||
| 0.0222No host reddening detected at explosion site. | ||||||
| mag | ||||||
| mag333Extinction correction applied.444Relative to second -band light curve peak |
| Host Galaxy | NGC 4923 | |||||
| Galaxy Type | E/S0 | |||||
| Galactic Offset | ||||||
| Redshift | 555Albareti et al. (2017) | |||||
| Distance | Mpc | |||||
| Distance Modulus, | mag | |||||
| Time of Explosion (MJD) | 59309.4 0.1 | |||||
| 0.008 0.001 mag | ||||||
| 0.0666No host reddening detected at explosion site. | ||||||
| mag | ||||||
| mag777Extinction correction applied.888Relative to second -band light curve peak |
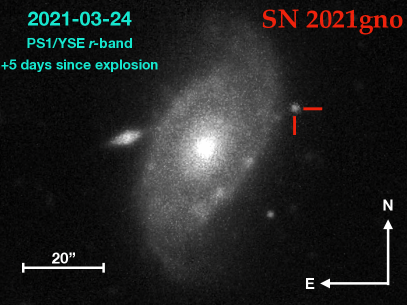
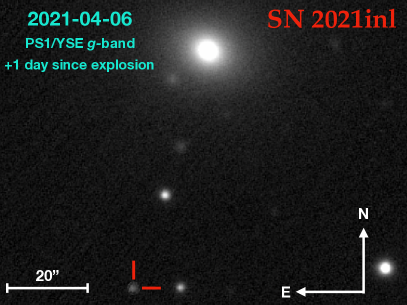
SN 2021gno is located 23.3′′ NW of the nucleus of the SABa galaxy NGC 4165. For SN 2021gno, we use the redshift-independent distance of Mpc, which was calculated using the Tully-Fisher relation (Theureau et al., 2007). For SN 2021inl, we use a redshift (Albareti et al., 2017), which corresponds to a distance of Mpc for standard CDM cosmology ( = 70 km s-1 Mpc-1, , ); unfortunately no redshift-independent distance is available. Possible uncertainties on the SN 2021inl distance could be the choice of and/or peculiar velocities of the host galaxy, the uncertainty on the former can, for example, contribute to % uncertainty of the SN luminosity. For each SN, we define the time of explosion as the mean phase between last non-detection and first detection. This results in a time of explosion of MJD days (19 March 2021) for SN 2021gno and MJD days (05 April 2021) for SN 2021inl. The main parameters of SNe 2021gno and 2021inl and their host-galaxies are displayed in Tables 1 and 2, respectively.
2 Observations
2.1 UV/Optical/NIR Photometry
SN 2021gno was observed with the Ultraviolet Optical Telescope (UVOT; Roming et al. 2005) onboard the Neil Gehrels Swift Observatory (Gehrels et al., 2004) from 20 March 2021 until 21 April 2021 ( 0.84 – 33.0 days since explosion). We performed aperture photometry with a 5′′ region with uvotsource within HEAsoft v6.26999We used the calibration database (CALDB) version 20201008., following the standard guidelines from Brown et al. (2014). In order to remove contamination from the host galaxy, we employed images acquired at days after explosion, assuming that the SN contribution is negligible at this phase. This is supported by visual inspection in which we found no flux associated with SN 2021gno. We subtracted the measured count rate at the location of the SN from the count rates in the SN images following the prescriptions of Brown et al. (2014). Consequently, we detect bright UV emission from the SN directly after explosion (Figure 2) until maximum light. Subsequent non-detections in bands indicate significant cooling of the photosphere and/or Fe-group line blanketing.
Additional -band imaging of SN 2021gno and SN 2021inl was obtained through the Young Supernova Experiment (YSE) (Jones et al., 2021) with the Pan-STARRS telescope (PS1; Kaiser et al., 2002) between 24 March 2021 and 21 July 2021 ( days since explosion) and 06 April 2021 and 10 June 2021 ( days since explosion), respectively. PS1 images of SNe 2021gno and 2021inl are presented in Figure 1. Furthermore, SN 2021gno was observed with the DECam Extension survey of YSE between 22 March 2021 and 09 January 2022 ( days) on the Cerro Tololo Inter-American Observatory Blanco 4-m telescope (Rest et al., 2022). The YSE photometric pipeline is based on photpipe (Rest et al., 2005). Each image template was taken from stacked PS1 exposures, with most of the input data from the PS1 3 survey. All images and templates are resampled and astrometrically aligned to match a skycell in the PS1 sky tessellation. An image zero-point is determined by comparing PSF photometry of the stars to updated stellar catalogs of PS1 observations (Chambers et al., 2017). The PS1 templates are convolved with a three-Gaussian kernel to match the PSF of the nightly images, and the convolved templates are subtracted from the nightly images with HOTPANTS (Becker, 2015). Finally, a flux-weighted centroid is found for each SN position and PSF photometry is performed using “forced photometry”: the centroid of the PSF is forced to be at the SN position. The nightly zero-point is applied to the photometry to determine the brightness of the SN for that epoch.
Both SNe 2021gno and 2021inl were observed with ATLAS ( and days since explosion, respectively), a twin 0.5m telescope system installed on Haleakala and Mauna Loa in the Hawai’ian islands that robotically surveys the sky in cyan (c) and orange (o) filters (Tonry et al., 2018a). The survey images are processed as described in Tonry et al. (2018a) and photometrically and astrometrically calibrated immediately (using the RefCat2 catalogue; Tonry et al., 2018b). Template generation, image subtraction procedures and identification of transient objects are described in Smith et al. (2020). Point-spread-function photometry is carried out on the difference images and all sources greater than 5 are recorded and all sources go through an automatic validation process that removes spurious objects (Smith et al., 2020). Photometry on the difference images (both forced and non-forced) is from automated point-spread-function fitting as documented in Tonry et al. (2018a). The photometry presented here are weighted averages of the nightly individual 30 sec exposures, carried out with forced photometry at the position of the SNe.
The complete light curves of SNe 2021gno and 2021inl are presented in Figures 2 and 3, respectively, and all photometric observations are listed in Appendix Table A13. In addition to our observations, we include band photometry of SNe 2021gno and 2021inl from the Zwicky Transient Facility (ZTF; Bellm et al. 2019; Graham et al. 2019) forced-photometry service (Masci et al., 2019), which span from 20 March 2021 to 15 June 2021 ( days since explosion) and 07 April 2021 to 08 May 2021 ( days since explosion).
The Milky Way (MW) -band extinction and color excess along the SN 2021gno line of sight is mag and E(B-V) = 0.03 mag (Schlegel et al., 1998; Schlafly & Finkbeiner, 2011), respectively, which we correct for using a standard Fitzpatrick (1999) reddening law ( = 3.1). Additionally, the MW -band extinction and color excess along the SN 2021inl line of sight is mag and E(B-V) = 0.008 mag (Schlegel et al., 1998; Schlafly & Finkbeiner, 2011). For both SNe, we do not correct for host-galaxy contamination given the absence of Na I D absorption in all spectra at the host redshift.
2.2 Optical/NIR spectroscopy
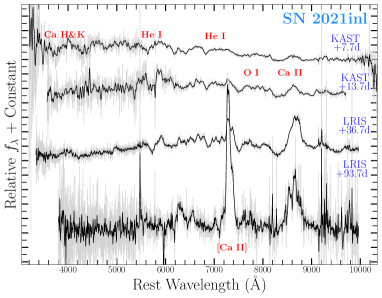
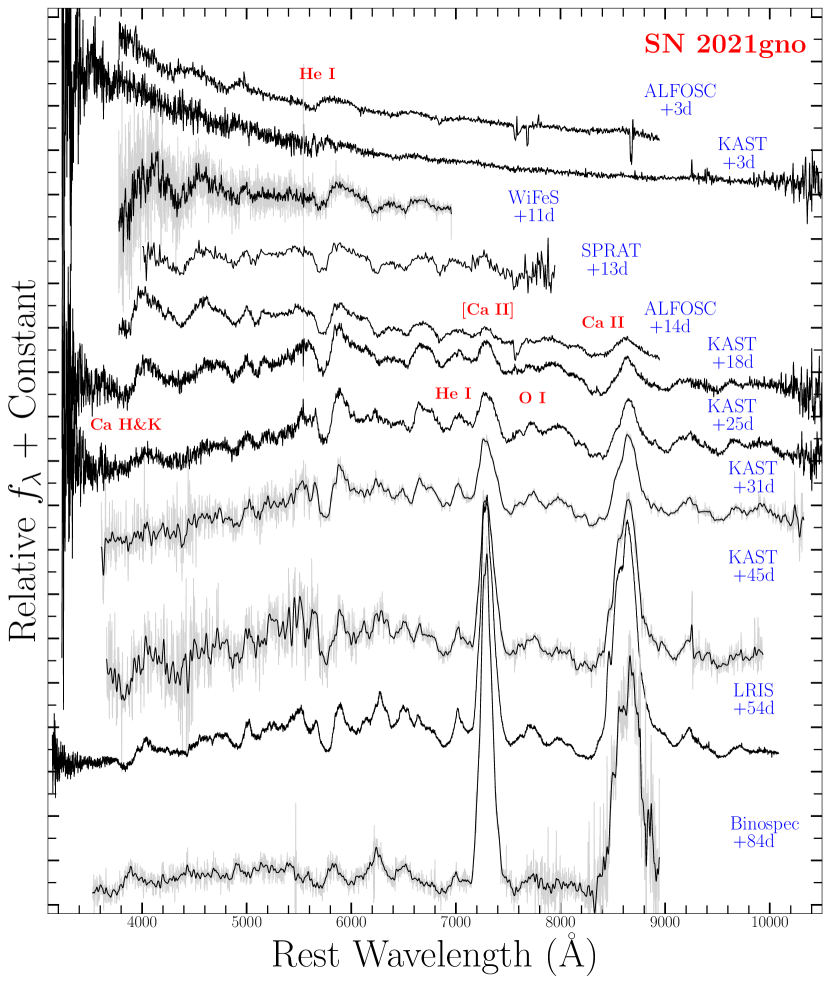
In Figures 4 and 3(b), we present the complete series of optical spectroscopic observations of SN 2021gno and SN 2021inl from days and days relative to explosion, respectively. A full log of spectroscopic observations is presented in Appendix Tables A2 and A3.
SNe 2021gno and 2021inl were observed with Shane/Kast (Miller & Stone, 1993) and Keck/LRIS (Oke et al., 1995) between days and days relative to explosion, respectively. For all these spectroscopic observations, standard CCD processing and spectrum extraction were accomplished with IRAF101010https://github.com/msiebert1/UCSC_spectral_pipeline. The data were extracted using the optimal algorithm of Horne (1986). Low-order polynomial fits to calibration-lamp spectra were used to establish the wavelength scale and small adjustments derived from night-sky lines in the object frames were applied. We employed custom IDL routines to flux calibrate the data and remove telluric lines using the well-exposed continua of the spectrophotometric standard stars (Wade & Horne, 1988; Foley et al., 2003). Details of these spectroscopic reduction techniques are described in Silverman et al. (2012).
Spectra of SN 2021gno were also obtained with the Alhambra Faint Object Spectrograph (ALFOSC) on The Nordic Optical Telescope (NOT), as well as Binospec on MMT, and SpeX at the NASA Infrared Telescope Facility (IRTF). All of the spectra were reduced using standard techniques, which included correction for bias, overscan, and flat-field. Spectra of comparison lamps and standard stars acquired during the same night and with the same instrumental setting have been used for the wavelength and flux calibrations, respectively. When possible, we further removed the telluric bands using standard stars. Given the various instruments employed, the data-reduction steps described above have been applied using several instrument-specific routines. We used standard IRAF commands to extract all spectra.
2.3 X-ray observations with Swift-XRT
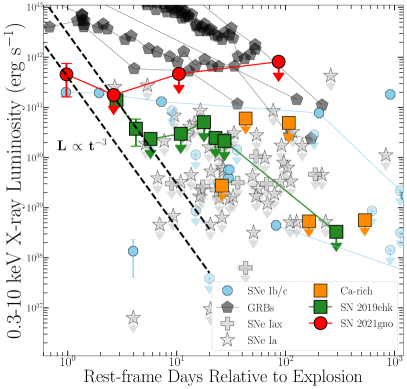
The X-Ray Telescope (XRT, Burrows et al. 2005) on board the Swift spacecraft (Gehrels et al., 2004) started observing the field of SN 2021gno from 20 March 2021 to 06 Nov. 2021 ( days since explosion with a total exposure time of 28.8 ks, IDs 14199 and 14214). We analyzed the data using HEAsoft v6.26 and followed the prescriptions detailed in Margutti et al. (2013), applying standard filtering and screening. A bright source of X-ray emission is clearly detected in each individual observation with significance of against the background in the first two epochs ( days; total exposure time of 4.73 ks) and count rates of and c s-1, respectively. Given how close in time the first XRT observations are to one another, we chose to merge the two event files and use the combined epoch for analysis of the X-ray spectrum.
To test the validity of the X-ray emission observed in SN 2021gno, we first employ a binomial test to understand the likelihood that the fading X-ray emission was a chance coincidence. In this test, we compared the observed counts in the combined early-time epoch to a late-time, template XRT image (3.6 ks) of the explosion site at days. We find a probability of chance fading X-ray emission of only , further indicating that the observed X-ray photons were in fact derived from the SN at early-times. Furthermore, in the template image, no X-ray emission is detected above the background level at later phases. The complete X-ray light curve is presented in Figure 5(a).
From the merged event file at days, we extracted a spectrum using a 15′′ region centered at the location of SN 2021gno. We find that the X-ray spectrum of the SN emission has a best-fitting photon index ( error) corresponding to an unabsorbed 0.3-10 keV flux of . No evidence for intrinsic neutral hydrogen absorption is found (). The Galactic neutral hydrogen column density along our line of sight is (Kalberla et al., 2005), which is used to account for the contribution of the host galaxy in modeling the X-ray excess. We then use the best-fitting spectral parameters inferred from the merged observations to flux-calibrate the count-rate upper limits derived for the following epochs (Table A1). Given the distance to SN 2021gno, these measurements indicate a steeply decaying, large X-ray luminosity of at days (Figure 5), rivaling even the gamma-ray burst SN, 1998bw (Kouveliotou et al., 2004). This very early-time observation represents only the second X-ray detection in a CaST, the first being SN 2019ehk, which showed luminous rapidly fading X-ray emission at days since explosion (WJG20a). Furthermore, SN 2021gno’s decay in X-ray luminosity is consistent with the steep light curve slope of found in SN 2019ehk.
The hard 0.3-10 keV X-ray spectrum of SN 2019ehk is suggestive of thermal bremsstrahlung emission with temperature keV. Consequently, we fit the SN 2021gno contribution with a bremsstrahlung spectral model with keV and find an inferred emission measure of is (at d), where and are the number densities of electrons and ions, respectively. Furthermore, in §7, we apply the estimated from the XRT detections to derive parameters of the CSM surrounding the progenitor system of SN 2021gno .
2.4 Radio observations
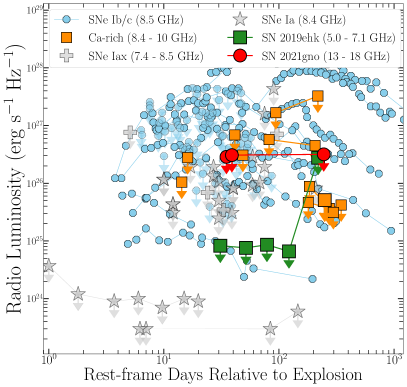
We observed SN 2021gno with the Arcminute Microkelvin Imager Large Array (AMI-LA; Zwart et al. 2008; Hickish et al. 2018) on 21, 25 April and 19 Nov. 2021 ( days since explosion) and found no evidence for radio emission from the SN. These data were all taken at a central frequency of 15.5 GHz across a 5 GHz bandwidth consisting of 4096 channels, which we average down to 8 for imaging. Radio frequency interference (RFI) flagging and bandpass and phase reference calibration were performed using a custom reduction pipeline (Perrott et al., 2013). Additional flagging and imaging was performed in the Common Astronomy Software Applications (CASA; McMullin et al. 2007) package. For imaging we use natural weighting with a clean gain of 0.1. To measure the source flux density we use the CASA task IMFIT. The resolution of the AMI-LA (characteristic beam dimensions 400 x 3000) when observing at the declination of J1820 means that the source is unresolved in all epochs. Details of each observation are presented in Appendix Table A4 and the derived radio luminosity limits for SN 2021gno are plotted in Figure 5(b).
3 Host Galaxy and Explosion Site
SN 2021gno is located 3.6 kpc in projection from the nucleus in the outer arm of its SBa type host galaxy NGC 4165 (Fig. 1a). We determine the host galaxy oxygen abundance 12 + log(O/H) by using an SDSS spectroscopic observation taken on 20 April 2004 of the galactic core; given the SN location, the metallicity at the explosion site is likely lower. Using a combination of line flux ratios ([O iii] / H and [N ii]/H) in Equations 1 & 3 of Pettini & Pagel (2004), we determine a range of host metallicities of 12 + log(O/H) = dex ( Z⊙). Using the same spectrum, we find an H emission line luminosity of erg s-1, which corresponds to a star formation rate of SFR = yr-1 (Kennicutt, 1998).
In order to understand the SFR and metallicity at the exact location of SN 2021gno, we acquired an additional host spectrum at the explosion site using the Goodman spectrograph on SOAR on 27 January 2021, when the SN emission is not expected to be detected given its brightness at this phase and the S/N of the spectrum. We find no detectable host galaxy emission lines at the SN location and perform a manual, optimal Gaussian extraction with a region, on each side of the SN location, which translates to distance of 0.22 kpc. We then derive a limit on the H emission line luminosity by simulating a marginal detection as a Gaussian profile (FWHM = 100 ) with a peak flux of three times the spectrum’s root-mean-square (RMS) flux. We then calculate erg s-1 and a local SFR of yr-1. This estimate is consistent with the low SFR of yr-1 inferred from the explosion site of SN 2019ehk (WJG20a) and suggests that SN 2021gno is more likely to have originated from an older progenitor system (e.g., low-mass massive star or WD binary). Furthermore, the H luminosity at the explosion site of SN 2019ehk is only consistent with the H ii region luminosity at the location of of H-stripped SNe (Galbany et al., 2018; Kuncarayakti et al., 2018).
Similar to many other CaSTs, SN 2021inl is located at a large projected offset (23 kpc) from early-type, E/S0 host galaxy NGC 4923 (Fig. 1b). While the explosion site indicates no star formation at the SN location, we also use an SDSS spectroscopic observation taken on 22 Feb. 2007 of the galactic core to infer properties of NGC 4923. To derive properties of the host galaxy, we model the SDSS spectrum as well as GALEX All-Sky Survey Source Catalog (GASC; Seibert et al. 2012) UV, SDSS ugriz, and NIR Two Micron All Sky Survey (2MASS; Jarrett et al. 2000) JHKs photometry with the Fitting and Assessment of Synthetic Templates code (FAST; Kriek et al. 2009). Our model grid includes stellar initial mass functions by Salpeter (1955) and Chabrier (2003), star-formation history that is exponentially decreasing and a delayed function, and stellar population libraries presented by Bruzual & Charlot (2003) and Conroy et al. (2009). For models without host galaxy dust reddening, we find a total stellar mass of , metallicity of and SFR yr-1. We also find consistent and measurements within a grid of models that included dust (), but all models found an SFR = 0. Overall, these models indicate that SN 2021inl, given its large offset from a host with no apparent star formation, is not from a massive star progenitor.
4 Optical Light Curve Analysis
4.1 Photometric Properties
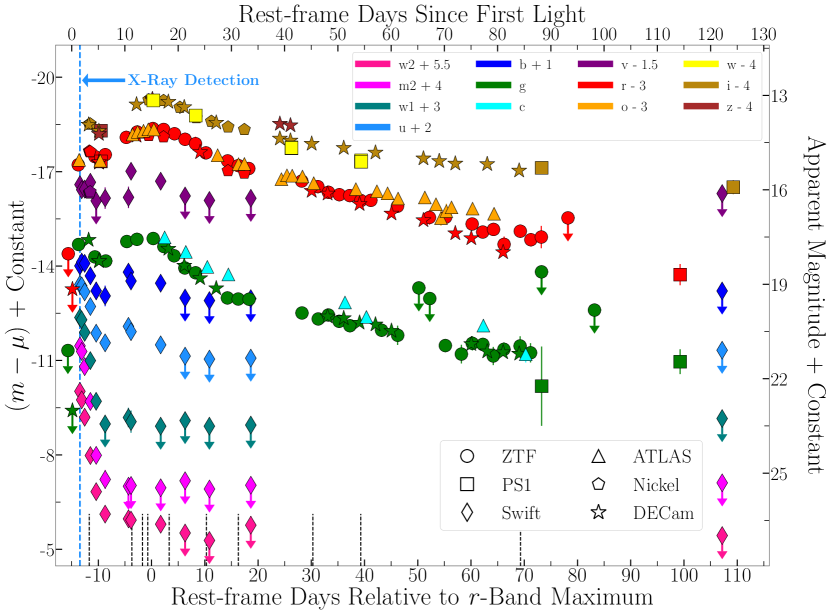
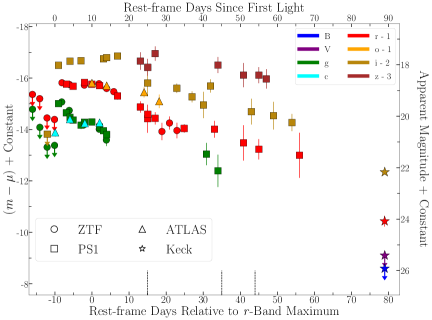
SNe 2021gno and 2021inl are the fourth and fifth confirmed CaSTs with clearly defined double-peaked light curves as shown in Figure 2 & 3(a), respectively. The other double-peaked objects in the present CaST sample are iPTF16hgs (De et al., 2018a), SN 2018lqo (De et al., 2020b), and SN 2019ehk (Jacobson-Galán et al., 2020a; Nakaoka et al., 2021; De et al., 2021). Similar to other double-peaked SNe, we define the phase of these SNe relative to both the secondary, “Nickel-powered” peak and to explosion as defined at the end of §1. For both CaSTs, we calculate the time of maximum by fitting a third-order polynomial to and band photometry. For SN 2021gno, we find best-fit - and -band peak absolute magnitudes of mag at MJD and mag at MJD , respectively, resulting in an -band rise-time of days. For SN 2021inl, we find best-fit - and -band peak absolute magnitudes of mag at MJD and mag at MJD , respectively, resulting in an band rise-time of days.
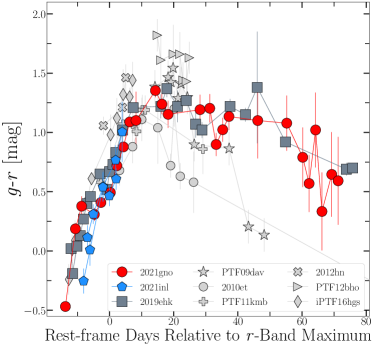
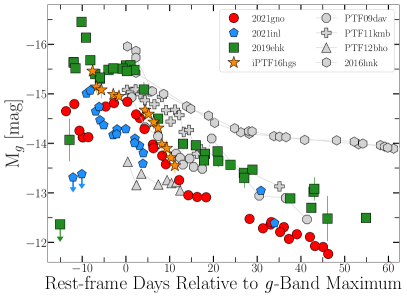
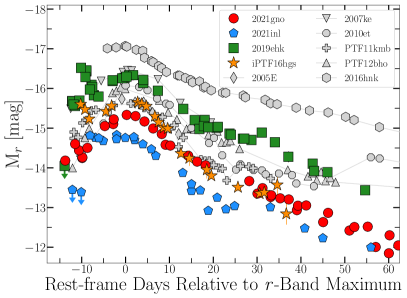
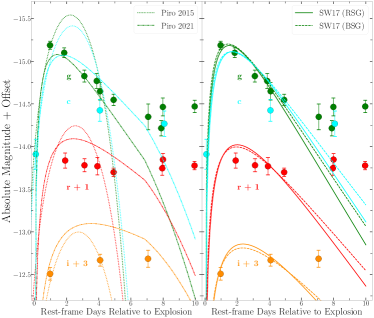
In Figure 7, we present and band light curve comparisons of SNe 2021gno and 2021inl to a sample of confirmed CaSTs. Overall, both objects have a consistent light curve evolution to other CaSTs e.g., days, mag, and fast-decaying post-maximum photometry. Both SNe are amongst the lowest luminosity events compared to other CaSTs, with SN 2021inl being 1 mag fainter than SNe 2005E (Perets et al., 2010a) and 2019ehk (Jacobson-Galán et al., 2020a; Nakaoka et al., 2021) and 2 mag less luminous than the peculiar ”Calcium-strong” SN 2016hnk (Galbany et al., 2019; Jacobson-Galán et al., 2020b). Despite being intrinsically fainter, SN 2021gno’s overall photometric evolution is most similar to SN 2019ehk and iPTF16hgs (De et al., 2018a); all three objects contain double-peaked light curves, as well as consistent rise-times and post-peak decline rates in both and bands. SN 2021inl’s post-maximum decline is also consistent with SNe 2019ehk, 2021gno and iPTF16hgs, with all objects exhibiting a relatively rapid decay in band flux following the Ni-powered SN peak. Additionally, we compare the colors of SNe 2021gno and 2021inl to a CaST sample in Figure 6. Same as the photometric evolution, the overall color evolution of these two objects at days post-peak is quite consistent with the colors typically observed in other CaSTs. Similar to other objects observed early and with high cadence observations (e.g., iPTF16hgs, SN 2019ehk), SNe 2021gno and 2021inl display blue colors at the start of their evolution ( mag), but quickly transform into instrinsically red explosions ( mag) following SN peak.
4.2 Bolometric Light Curve
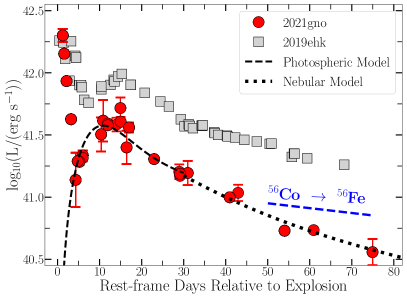
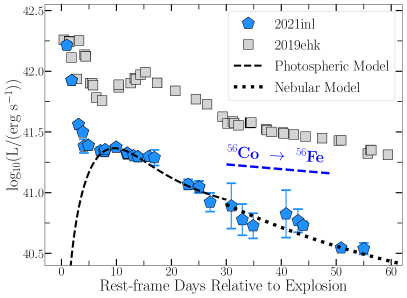
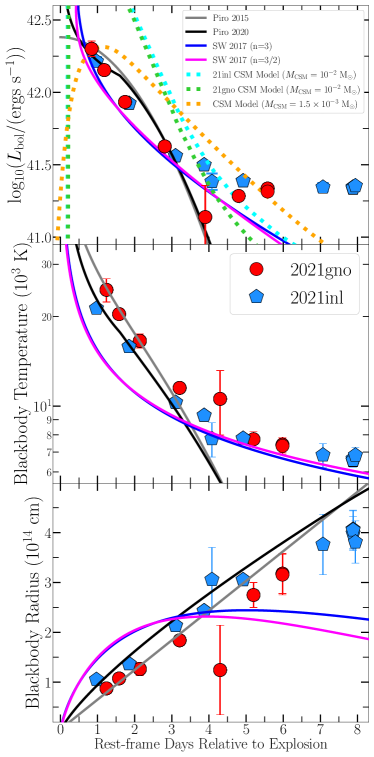
For SN 2021gno, we construct a bolometric light curve by fitting the ZTF, PS1, Nickel, ATLAS and Swift photometry with a blackbody model that is dependent on radius and temperature. The extremely blue UV colors and early-time color evolution of SN 2021gno during its first light peak impose non-negligible deviations from the standard Swift-UVOT count-to-flux conversion factors. We account for this effect following the prescriptions by Brown et al. (2010). Each spectral energy distribution (SED) of SN 2021gno was generated from the combination of multi-color UV/optical/NIR photometry in the , , , , , , , , , , , and bands (1500–10000 Å). Similarly, for SN 2021inl, we construct a bolometric light curve by fitting the ZTF, PS1, Nickel, and ATLAS photometry with the same blackbody model to multi-band , , , , , and bands (3000–10000 Å). For both SNe, we extrapolated between light curve data points using a low-order polynomial spline in regions without complete color information. All uncertainties on blackbody radii and temperature were calculated using the co-variance matrix generated by the SED fits. For the secondary, Nickel-powered light curve peak, we find peak bolometric luminosities of and for SN 2021gno and SN 2021inl, respectively.
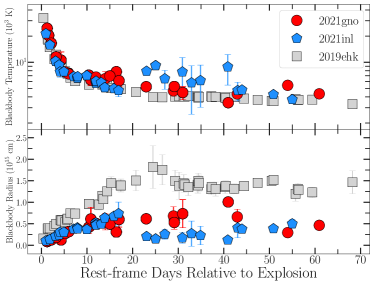
In Figures 8(a)/(b), we present the bolometric light curves of SNe 2021gno and 2021inl, in addition to their blackbody radius and temperature evolution in Figure 9. In both figures, we also present the bolometric luminosities, blackbody radii and temperatures of CaST SN 2019ehk (WJG20a). Overall, both SNe are less luminous than SN 2019ehk throughout all of their bolometric evolution except the very first data point of the first light curve peak where the luminosities are comparable. However, the post-peak bolometric decline in SNe 2021gno and 2021inl is consistent with the rate observed in SN 2019ehk; all of these objects declining faster than the typical decay of that assumes complete trapping of -rays. Furthermore, as shown in Figure 9, the blackbody temperature of SNe 2019ehk, 2021gno, and 2021inl are all nearly identical throughout the early-time evolution, days since explosion. However, the blackbody radius of SN 2019ehk is larger than both SNe throughout their evolution, while SN 2021gno and SN 2021inl are consistent with one another for most early-time epochs. Additionally, it should be noted that the blackbody approximation may not be appropriate when emission lines (e.g., Ca ii) begin to dominate the spectrum of SNe 2021gno and 2021inl, which occurs days after explosion. Consequently, a blackbody assumption for these objects in those phases is most likely an over-simplification and could result in additional uncertainty on the presented bolometric luminosities.
For SN 2021gno, the earliest inferred blackbody radius is cm (1300 ) at days since explosion. This suggests a compact progenitor star with radius , which allows for the first detected blackbody radius to be reached given a shock velocity of . Similarly, the first blackbody radius of cm (1400 ) in SN 2021inl at days also allows for a compact progenitor radius of for . Similar inferences we made for SN 2019ehk whose initial blackbody radius at days after explosion rules out an extended progenitor. Furthermore, in all three SNe, WD progenitors are still permitted given the time it would take the SN shock to reach the first blackbody radii from a much smaller initial stellar radius.
To determine physical parameters of both SNe such as ejecta mass (), kinetic energy (), and mass (), we model both bolometric light curves with the analytic expressions presented in Appendix A of Valenti et al. (2008) and in Wheeler et al. (2015). Same as in SN 2019ehk, we exclude the first light curve peak and model two distinct phases of the light curve: photospheric ( days; Arnett 1982) and nebular ( days; Sutherland & Wheeler 1984; Cappellaro et al. 1997). The analytic formalism applied in this modeling self-consistently implements the possibility of incomplete -ray trapping and a typical opacity of cm2 g-1 is applied in each model. Furthermore, we correct for the known degeneracy between kinetic energy and ejecta mass (e.g., see Eqn. 1 in WJG20a) by applying photospheric velocities of for SN 2021gno and for SN 2021inl, both of which are derived from Si ii absorption features in the SN spectra. For SN 2021gno, we find an ejecta mass of , kinetic energy of erg, and mass of . For SN 2021inl, we calculate an ejecta mass of , kinetic energy of erg, and mass of . In both SNe, the photospheric and nebular model fits (shown in Fig. 8) return consistent parameter values. Overall, the explosion parameters in SN 2021gno are very consistent with those derived for SN 2019ehk (WJG20a) despite a slightly lower , which explains the larger luminosities observed in SN 2019ehk. However, SN 2021inl’s explosion parameters are all lower than that observed in SNe 2019ehk and 2021gno, but are consistent with the values generally found in the CaST class (De et al., 2020b).
5 Optical/NIR Spectral Analysis
5.1 Spectroscopic Properties
The complete spectral series of SNe 2021gno and 2021inl are presented in Figures 4 and 3(b), both of which include obvious ion identifications for both SNe. During their photospheric phase, both SNe display prominent He i, O i, Ca ii, Si ii and Fe-group element transitions; neither SNe showing evidence for detectable H i. In the first spectrum of SN 2021gno at +3 days post-explosion, we find that all the broad features can be identified as fast-moving He i 4471, 5016, 5876, 6678 profiles and find a consistent expansion velocity of from the minimum of the absorption profile. Based on the absorption profiles in the SN 2021gno maximum light spectrum, we find characteristic ejecta velocities of for He i, for Si ii, and for Ca ii. We find similar expansion velocities in SN 2021inl, such as for He i, for Si ii, and for Ca ii. Overall, the ejecta velocities estimated for both SNe are consistent with ion velocities found for SN 2019ehk (WJG20a) and other CaSTs (Kasliwal et al., 2012; Lunnan et al., 2017; De et al., 2020a).
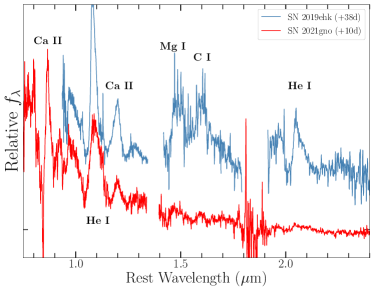
In Figure 10, we present the IR spectra of SN 2021gno at +10 days after second maximum compared to SN 2019ehk at +38 days; these two observations being the only confirmed IR spectra of a CaST during the photospheric phase. The IR spectrum of SN 2021gno shows nearby identical transitions to SN 2019ehk, both objects showing clear P-Cygni profiles of Ca ii, He i, C i, and Mg i. Furthermore, the expansion velocities of these transitions are consistent with the ejecta velocities derived from optical spectra e.g., for He i and for Ca ii.
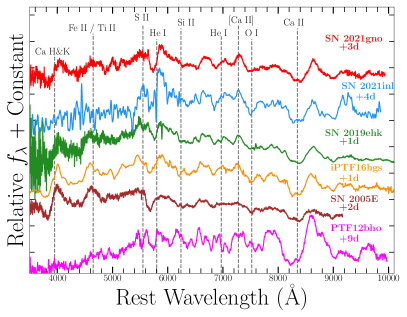
In Figure 11(a), we present early-time spectral comparisons of SNe 2021gno and 2021inl to other CaSTs near (second) maximum light. Overall, both SNe show consistent spectral features to all plotted CaSTs, but are most similar to SN 2019ehk and iPTF16hgs at this phase. All four objects show prominent He i and Ca ii transitions as well as the fast emergence of a [Ca ii] emission profile relative to peak. Furthermore, we compare the mid-time spectra of SN 2021gno at +19 days to SNe 2005E, 2007ke, and 2019ehk in Figure 11(b). At this phase, SN 2021gno shows nearly identical transitions to these CaSTs such as prominent [Ca ii] and marginal [O i]. These spectral comparisons are further indication that both SNe 2021gno and 2021inl are clear members of the CaST class.
5.2 Inferences from Nebular Phase Spectroscopy
Similar to other CaSTs, SNe 2021gno and 2021inl show a fast transition from the photospheric to the optically thin regime where their spectra become dominated by forbidden emission lines such as [Ca ii] and [O i] (Fig. 12). For SN 2021gno, the transition to the nebular regime occurs at 13-18 days after explosion, which is evident from the presence of [Ca ii] emission in the early-time spectra; this transition then comes to dominate the spectra at later phases (Fig. 4). Despite lower cadence spectroscopic observations, a similar behavior is observed in SN 2021inl, whose first spectrum at +8 days shows marginal evidence for [Ca ii] emission, which later becomes the dominant transition by +94 days (Fig. 3b).
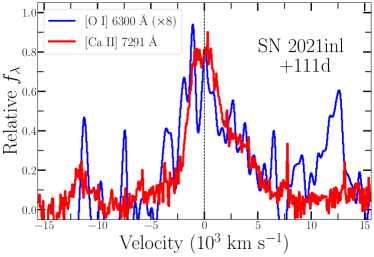
Once in the optically thin regime, we calculate [Ca ii]/[O i] line flux ratio, which, if greater than 2, is a common classifier of CaSTs and present this quantity in Figure 13(a) for both SNe. Based on this metric, we find that both objects are significantly “rich” in [Ca ii] emission as shown by a maximum line flux ratio of [Ca ii]/[O i] . These flux ratios are consistent with other CaSTs presented in Figure 13(a), but neither SN has as large of a [Ca ii]/[O i] ratio as SN 2019ehk, which remains the member of CaST with largest [Ca ii] flux relative to [O i] at all phases. Furthermore, in Figures 13(b)/(c), we present the velocity profiles [Ca ii] and [O i] of SNe 2021gno and 2021inl, respectively, with the O emission scaled to match the Ca feature. We find that in both objects, these forbidden line transitions are consistent in shape and indicate [Ca ii] and [O i] expansion velocities of based on the FWHM of the emission profiles.
In order to understand the Ca and O abundance in each explosion, we apply a similar analysis to that outlined in Section 6.3 of WJG20a where the observed luminosities of [Ca ii] and [O i] are related to the populations of the excited states, ion number densities ( cm-3), and Einstein A coefficient values of each ion:
| (1) |
| (2) |
where is the photon energy, is the ion number density, s-1, , the exponentials are the Boltzmann factors ( is in K), and the numerical factors are statistical weights. To find the ion number densities and subsequent masses in each SN, we first estimate the forbidden line luminosities to be erg s-1 and erg s-1 for SN 2021gno ( days since explosion), and erg s-1 and erg s-1 for SN 2021inl ( days since explosion). In the analytic relations above, we choose to calculate Ca and O masses for a range of temperatures K, for completeness.
For SN 2021gno, we calculate O and Ca masses of and , for temperatures K. Similarly, for SN 2021inl, we find O and Ca masses of and , for K. These abundances are lower overall, but still somewhat consistent, to those found by WJG20a for SN 2019ehk e.g., and . However, it should be noted that at these phases both SNe are not fully nebular and therefore the derived masses may be lower than the true elemental masses in the explosion. Nevertheless, these mass estimates continue to prove that the “richness” of Ca emission in CaSTs is not due to a larger intrinsic amount of Ca relative to O, but rather it is likely the result of relative abundances and ionization temperatures in the inner, low density ejecta.
6 Early-time Flux Excess
6.1 Observational Properties
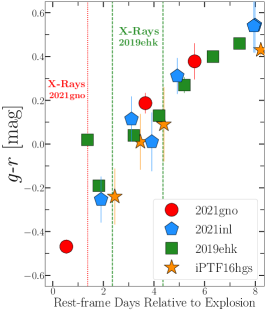
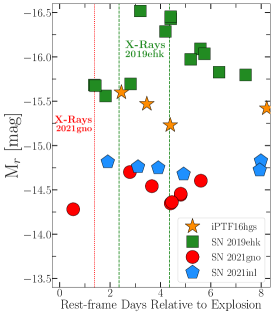
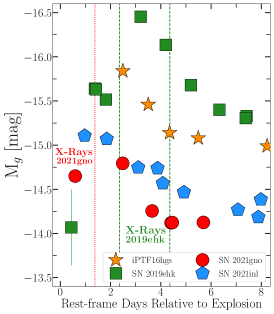
Similar to other double-peaked CaSTs, the early-time excess in flux above the -powered continuum is observed in all available UV/optical/NIR filters used to observe SNe 2021gno and 2021inl. Additionally, these very early-time observations of both SNe represent the only other instances where the initial rise of the primary light curve peak was recorded in a CaST, the first being in SN 2019ehk. In Figure 14, we present the colors, as well as and band light curves of SNe 2019ehk, 2021gno, 2021inl, and iPTF16hgs during their primary light curve phase.
For all four double-peaked CaSTs in Figure 14(a), the color evolution during the flux excess follows a consistent trend: all objects show a linear increase in color following first detection and all begin with quite blue colors e.g., mag. Seemingly, the physical process behind this early-time flux excess is responsible for a retention of high blackbody temperatures and, consequently, blue colors until the SN emission becomes dominated by energy injection from decay.
As shown in Figures 14(b)/(c), SN 2019ehk remains the most luminous double-peaked CaST, with its flux excess peaking at mag in and bands. SNe 2021gno and 2021inl are lower luminosity events than SN 2019ehk and iPTF16hgs, with their primary and band light curves peaking at mag and mag, respectively. Furthermore, the light curve slopes during this phase varies between all CaSTs. SN 2021gno shows a band decline rate of mag during the 5 day primary peak duration while SN 2021inl has a decline rate of mag. Additionally, SN 2019ehk has a very fast decline rate of mag during its largest flare in early-time flux, while iPTF16hgs has a similarly rapid decline of mag.
6.2 Shock Breakout and Envelope Cooling Model
For stellar progenitors with an extended envelope, the energy deposited by the passage of a shock through their envelopes manifests in detectable shock cooling emission (SCE) on a timescale of days after shock breakout. This process has been modeled both analytically (e.g., Nakar & Piro 2014; Piro 2015) and numerically (e.g., Sapir & Waxman 2017; Piro et al. 2017, 2021), these models being highly effective at reproducing the early time double-peaked light curves of SNe IIb (e.g., SNe 1993J, 2011dh, 2016gkg, 2017jgh; Wheeler et al. 1993; Arcavi et al. 2011, 2017; Piro et al. 2017; Armstrong et al. 2021), super-luminous SNe (e.g., DES14X3taz; Smith et al. 2016), SNe Ic (e.g., SNe 2014ft, 2020bvc, 2020oi; De et al. 2018b; Ho et al. 2020; Gagliano et al. 2022), fast-risers (e.g., 2019dge; Yao et al. 2020 and CaSTs (e.g., iPTF16hgs, SN 2019ehk; De et al. 2018a; Nakaoka et al. 2021; Jacobson-Galán et al. 2020a). Furthermore, by fitting the primary light curve peaks of these double-peaked SNe, information about the extended material around the progenitor star at the time of explosion can be derived, such as the envelope mass and radius, as well as the shock velocity.
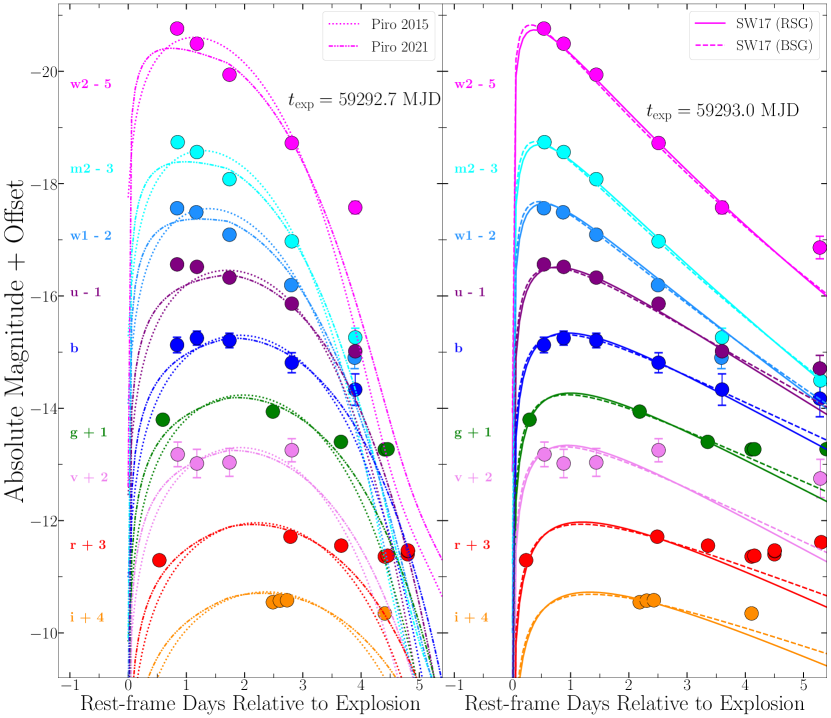
In order to understand the physical origin of their early-time flux excess, we fit the primary light curve peaks of SNe 2021gno and 2021inl with models for SCE of extended material. We apply four models to fit the SN light curves: the original SCE model by Piro (2015) as well as the revised two-component formalism presented in Piro et al. (2021), in addition to the models of Sapir & Waxman (2017) who numerically model SCE from both red and blue supergiant, H-rich envelopes (polytropic index of n = 3/2 and n = 3, respectively). Presentation of the analytic expressions behind these models can be found in Arcavi et al. (2017) or Section 7.3 of WJG20a. Following shock breakout, each model produces constraints on the envelope mass, , envelope radius, , the velocity of the envelope, , and the time offset from explosion (consistent with our explosion time estimate). In this analysis, we use emcee, a Python-based application of an affine invariant MCMC with an ensemble sampler (Foreman-Mackey et al., 2013). We compile the best fit parameter estimates from each model in Table A5.
In Figures 15 & 16, we present the best-fitting multi-color light curves of the aforementioned models for SNe 2021gno and 2021inl, respectively. We also present model bolometric light curves, as well as their blackbody temperatures and radii, in Figure 17 with respect to the SNe 2021gno and 2021inl data. In general, we find that SCE can accurately reproduce the early-time flux excess in both objects, with the models of Sapir & Waxman (2017) providing the best fit and lowest value overall. From all four model fits, the SN 2021gno light curve is best reproduced by an extended mass with radius and shock velocity . Furthermore, we find two best fitting times of explosions: 59292.3 MJD for Piro (2015); Piro et al. (2021) models and 59293.01 MJD for Sapir & Waxman (2017) models, both values being consistent with the model-independent estimate of MJD. Additionally, for SN 2021inl, we find best fitting SCE model parameters of , and ; there is no change to the original explosion date estimate. Lastly, we caution against using the derived from the blue supergiant SCE model by Sapir & Waxman (2017) to best understand the progenitor environments of these CaSTs given that the estimated envelope mass is larger than the ejecta mass in SN 2021inl and a significant fraction of the mass of SN 2021gno, both scenarios being unphysical in nature. We therefore conclude that the most physical range of best fitting extended masses for both objects are for SN 2021gno and for SN 2021inl; only the Piro (2015) model returned a mass that was not comparable in size, and consequently unphysical, to SN 2021inl’s total ejecta mass.
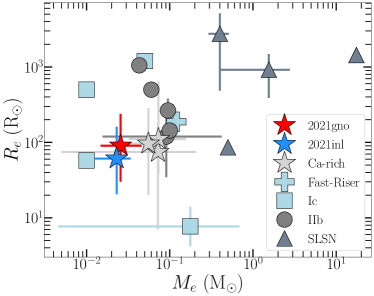
In Figure 18, we attempt to compare the radius and mass of the extended material estimated from the SCE modeling of SNe 2021gno and 2021inl to other double-peaked events whose primary light curve peak was modeled in a similar fashion. As shown in the plot, the SCE parameter space of all five double-peaked CaSTs is highly consistent: on average, these objects can be modeled with SCE from extended material that has a compact radius of 50-120 and mass of 0.05-0.1 . Compared to SCE model parameters presented in the literature, CaSTs show a similar extended mass to fast-rising events such as SN 2019dge (Yao et al., 2020) and SNe IIb (Wheeler et al., 1993; Arcavi et al., 2011, 2017; Piro et al., 2017; Armstrong et al., 2021), the latter typically exhibiting larger extended radii, likely indicating a more massive progenitor star than what produces CaSTs. Furthermore, the SCE parameter space of CaSTs is unlike that of SNe Ic (De et al., 2018b; Ho et al., 2020; Gagliano et al., 2022) and super-luminous SNe (Smith et al., 2016), the former showing a much larger range of radii and smaller masses, while the latter is best fit by a much larger extended material mass and radius. However, we note that the parameters derived for all CaSTs presented were done using four separate SCE models (e.g., Piro 2015; Piro et al. 2021; Sapir & Waxman 2017, while other objects shown were only modeled with one of these formalisms. Therefore, direct comparison of the SCE parameters may not be completely accurate.
6.3 CSM Interaction Model
In addition to the SCE model, we explore interaction of the explosion’s shock with a circumstellar medium as a mechanism to explain the primary light curve peaks of SNe 2021gno and 2021inl. We model the interaction as homologously expanding ejecta interacting with a detached CSM shell. In this picture, the CSM is sufficiently optically thick that the radiation becomes visible only after shock breakout from the outer edge of the CSM. The light curve is then powered by the resulting shock cooling emission of the swept up CSM and ejecta.
In this model, we assume a broken power-law ejecta with density profile and in the inner and outer ejecta, respectively; and assume the ejecta is expanding homologously with a kinetic energy of . The CSM of mass extends from an inner radius with a width of . The density profile follows a profile out to +.
We run numerical simulations using the radiation hydrodynamics code Sedona (Kasen et al., 2006). The equations of radiation hydrodynamics are solved in one-dimensional spherical symmetry using implicit Monte Carlo radiative transfer (Roth & Kasen, 2015) coupled to a moving mesh hydrodynamics code based off of Duffell (2016). We assume a grey electron scattering opacity of cm2 g-1 and an absorptive opacity of , with to account for Compton thermalization. We assume (i.e., for SN 2021gno and SN 2021inl, respectively) , erg s-1 (i.e., for SN 2021gno and SN 2021inl, respectively), , cm, cm. These CSM properties are based on SCE model parameters (§6.2) and X-ray/radio observations (§7), and allow us to create a fiducial model for both comparison to observations as well as rough estimation of CSM properties in both objects.
These models are presented with respect to both object’s bolometric luminosity during the early-time flux excess in Figure 17. As shown in the plot, both model light curves over-estimate the total luminosity in the primary light curve peak for both SNe; this indicates that the CSM mass is likely lower than that used in the simulations i.e., . For reference, we also plot the CSM interaction model designed for SN 2019ehk’s early-time excess (, cm), which yields a better match to the light curve peak in SNe 2021gno and 2021inl. Furthermore, based on these model comparisons, the inferred CSM properties in SN 2021gno are consistent with the CSM mass independently inferred from X-ray modeling in §7.
7 CSM Constraints from X-ray/Radio Emission in SN 2021gno
SN 2021gno is the second CaST, after SN 2019ehk (WJG20a), to show luminous X-ray emission ( erg s-1) at very early-time phases ( days), as shown in Figure 5(a). Given the consistency with a rapidly-decaying X-ray emission () and the hard spectrum (§2.3), we suggest that, like SN 2019ehk, the X-ray luminosity observed in SN 2021gno is most likely derived from thermal bremsstrahlung emission from shocked CSM gas in adiabatic expansion. Emission measure goes as and we can derive properties of the local CSM density in SN 2021gno by the following relation:
| (3) |
where are the electron and ion molecular weights, respectively, is the radius of the CSM, is the CSM thickness, and is the filling factor (i.e., how homogeneous the shell of CSM is around the progenitor). For the expression above, we use an emission measure of cm-3, filling factor , assuming H-rich CSM, and that the CSM thickness goes as . Because the exact CSM extent is unknown, we calculate multiple possible particle densities based on different CSM geometries. For a shock travelling with speed , the location of the blastwave at the time of X-ray emission ( day) gives cm and thus a particle density of cm-3. Assuming a H-rich CSM composition, this yields a CSM density of g cm-3 and mass of , assuming a spherical geometry. If the CSM radius is in fact comparable to the blackbody radius at day (e.g., cm), as was done for the X-ray analysis of SN 2019ehk (WJG20a), we find a CSM density and mass of g cm-3 and , respectively.
At larger distances from the progenitor, we interpret the radio upper limits discussed in §2.4 ( days) in the context of synchrotron emission from electrons accelerated to relativistic speeds at the explosion’s forward shock, as the SN shock expands into the medium. To derive parameters of the medium, we adopt the synchrotron self-absorption (SSA) formalism by Chevalier (1998) and we self-consistently account for free-free absorption (FFA) following Weiler et al. (2002) (however, see Terreran et al. (2021) and Jacobson-Galán et al. (2022) for application and additional details on these derivations). For the calculation of the free-free optical depth , we adopt a wind-like density profile in front of the shock, and we conservatively assume a gas temperature (higher gas temperatures would lead to tighter density constraints). The resulting SSA+FFA synchrotron spectral energy distribution depends on the radius of the emitting region, the magnetic field, the environment density and on the shock microphysical parameters and (i.e. the fraction of post-shock energy density in magnetic fields and relativistic electrons, respectively).
At the time of the latest radio non-detection in SN 2021gno, the shock will have probed distances of cm for ; however this distance could vary based on the chosen shock speed. We find that, for typical microphysical parameters and (same as for CaST SN 2019ehk; WJG20a), the lack of radio emission indicates a low density medium that corresponds to a progenitor mass loss rate of , for an adopted wind speed of . This value is the same as in SN 2019ehk, which had direct detections of CSM velocity based on shock-ionized emission lines in the early-time spectra (WJG20a). Overall, the mass loss limits of both SNe 2021gno and 2019ehk are consistent with one another, the latter being more constraining given the depth of the radio observations.
8 Discussion
8.1 A Physical Progenitor Model
The high-cadence, multi-wavelength follow-up of SNe 2021gno and 2021inl allows for some of the best constraints to be made on CaST progenitor systems to date. For SN 2021gno, modeling of the bolometric light curve has revealed that the explosion was low energy ( erg), which produced 0.6 of ejecta and synthesized 0.012 of . Furthermore, the multi-band light curve revealed a flux excess above the radioactive decay powered continuum emission that lasted days post-explosion. Modeling of this primary light curve peak (e.g., §6.2) suggests that the progenitor star could have had an extended envelope of material with radius and mass . Additionally, modeling of the luminous X-ray emission detected in SN 2021gno at 1 day after explosion indicates that the progenitor system also contained a shell of CSM that extended to cm and was comprised of of H- and/or He-rich gas, if the CSM composition is similar to SN 2019ehk. In Figure 17, we show that this amount of CSM can also be the power-source behind the multi-band primary light curve peak; this material being ejected by the progenitor star in the final months before explosion for a possible wind velocity of . Lastly, radio non-detections at late-times suggest a relatively clean progenitor environment at distances of cm and a progenitor mass loss rate in the final year(s) before explosion of .
The above information allows for decent constraints to be made on the potential progenitor star(s) responsible for SN 2021gno. One progenitor scenario is that SN 2021gno resulted from a low-mass, massive star (8-11 ) that experienced enough enhanced mass loss prior to explosion to remove all stellar H-rich material as well as to place of extended material/envelope at distances 230 and/or CSM at cm. A massive star progenitor is also consistent with the location of SN 2021gno in the spiral arm of a star-forming host galaxy. However, increased mass loss in such a progenitor could only have taken place in the final months before explosion given the low mass loss rate of in the progenitor’s final year(s). Compared to simulations, SN 2021gno’s ejecta mass is consistent with the collapse of a progenitor (Wanajo et al., 2018), but the total synthesized Ni mass is, on average, an order of magnitude lower in these models. Similarly, from BPASS library (Eldridge et al., 2017), all massive star explosions occurring in binary systems in the lowest mass bins (e.g., 8-11 ) produce ¿1.5 of ejecta and synthesize a total mass that is inconsistent with SN 2021gno. Furthermore, while ultra-stripped SN (USSN) progenitor models (e.g., Yoshida et al. 2017; Moriya et al. 2017) produce , they can reproduce the Ni yield observed in SN 2021gno, but it is unclear whether these progenitors can retain enough of a He-rich envelope to produce SCE as well as CSM capable of luminous X-ray emission via shock interaction. Lastly, a promising progenitor candidate is a He-star binary system capable of producing a type Ib-like explosion (e.g., see Yoon et al. 2017; Jung et al. 2021). Based on the models presented in Table A6 of WJG20a, the ejecta mass of SN 2021gno is consistent with a He-star with artificial envelope removal (e.g., models #2, 4) and a He-star + NS binary (models #7,8), both ending in O core burning. However, all of these models would be ruled out if the X-ray emission is derived from H-rich CSM. Furthermore, it is difficult to reconcile a massive star progenitor with the non-detection of a star forming region at the SN 2021gno explosion site (§3) and a SFR of yr-1. Given these constraints on a massive star progenitor for SN 2021gno, it may be the case that a WD system is better suited to reproduce the SN observables, as discussed below for SN 2021inl.
In terms of constraining the progenitor of SN 2021inl, the large offset of the SN from an early-type elliptical galaxy makes a massive star progenitor system very unlikely. Consequently, a more plausible scenario is one that involves the explosion of a WD in a binary system. However, such an explosion needs to produce 0.3 of ejecta and 0.012 of , as well as allow for either SCE from a confined (20-150 ) and low mass (0.02 ) extended envelope and/or of CSM. While such a SN is unable to be formed by typical SN Ia explosion channels, the formation of a confined, extended envelope can occur during the ejection of material in “tidal tails” that then “settles” around the primary WD prior to merger (Raskin & Kasen, 2013; Shen et al., 2012; Schwab et al., 2016).
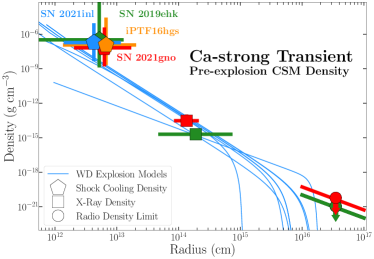
We explore the possibility that SN 2021inl resulted from a double degenerate system containing a hybrid and a CO WD, which was initially presented by WJG20a to explain SN 2019ehk. In this scenario, the tidal disruption of the hybrid HeCO WD by lower-mass CO WD (or another hybrid WD) can induce a He-detonation that can lead to CaST-like transient (Bobrick et al., 2017; Perets et al., 2019; Zenati et al., 2019b, a). Furthermore, prior to the disruption, significant mass transfer () will place CSM in the local environment, capable of powering the initial light curve peak observed in SN 2021inl. We note that such a system could also reproduce the observables in SN 2021gno such as and (e.g., see Table A4 of Jacobson-Galán et al. 2021), as well as X-ray emission from CSM interaction and the lack of detectable star formation at the explosion site. In Figure 19, we show the density profiles in the pre-explosion environments of SNe 2019ehk, 2021gno, 2021inl, and iPTF16hgs derived from SCE models as well as X-ray and radio modeling for SNe 2019ehk and 2021gno specifically. We show that the pre-explosion environments are consistent with the CSM density profiles of WD disruption models discussed above, further indicating that this scenario may be a plausible model to explain these CaSTs.
8.2 SNe 2021gno and 2021inl in the “Calcium-strong” Class
Based on the observational properties of both SNe 2021gno and 2021inl, it is evident that these objects fit within the confines of the CaST observational class. As discussed in §4.1, both SNe display low luminosity ( mag) and rapidly evolving ( days) light curves whose color evolution is consistent with other confirmed CaSTs (e.g., Fig. 6). Furthermore, the spectroscopic evolution of SNe 2021gno and 2021inl also solidifies their place in this observational class: both objects showing type I spectra near peak, which quickly transitions to an optically thin regime where all nebular emission is dominated by [Ca ii] emission and weak [O i] (e.g., [Ca ii]/[O i] ¿ 2; Fig. 13).
Nonetheless, these SNe do appear to deviate from normative CaST characteristics based on their double-peaked light curves and pre-explosion environments. With regards to the former, SNe 2021gno and 2021inl now represent the 4th and 5th confirmed CaSTs with an early-time flux excess, the other events being iPTF16hgs, SN 2018lqo, and SN 2019ehk. The observation of this primary light curve peak confirms the presence of an extended stellar envelope capable of producing SCE and/or a dense CSM that powers the initial flux excess through SN shock interaction in at least some CaST progenitor systems. Of the 9 CaSTs discovered 3 days after explosion and with 2 day photometric cadence, 5 () show a clear early-time flux excess: iPTF16hgs, SNe 2018lqo, 2019ehk, 2021gno and 2021inl. However, it is possible that of these objects show this signature given the marginal detections of a very early-time flux excess in the remaining sub-sample objects PTF11kmb, PTF12bho, SN 2018kyj and SN 2019hty, indicating that this feature is potentially ubiquitous to CaSTs.
In terms of their progenitor environments, both SNe exist in visibly different host galaxies, the large projected offset of SN 2021inl from its early-type host galaxy being most similar to the environments of many other CaSTs (Perets et al., 2010a, 2011; Kasliwal et al., 2012; Lyman et al., 2013, 2014; Perets, 2014a; Foley, 2015; Lunnan et al., 2017; De et al., 2020a; Perets & Beniamini, 2021). Additionally, despite the fact that SN 2021gno exploded in a star-forming, late-type galaxy, there is no evidence for star formation at the explosion site (similar to SN 2019ehk), which makes this event quite similar to other CaSTs in spite of the visibly different host galaxy type. However, a number of CaSTs have been discovered in spiral host galaxies with explosion site star formation (e.g., iPTF15eqv, iPTF16hgs, SN 2016hnk; Milisavljevic et al. 2017; De et al. 2018a; Galbany et al. 2019), as well as in, or offset from, disk galaxies (e.g., PTF09dav, SN 2001co, SN 2003H, SN 2003dr, SN 2003dg; Sullivan et al. 2011; Kasliwal et al. 2012; Perets 2014b; Foley 2015). This spread in CaST host environments continues to indicate that the progenitor systems responsible for these transients are likely heterogeneous, some arising from certain types of massive stars and others coming from the explosion of compact stars such as WDs.
Lastly, SN 2021gno is now the second confirmed CaST to be detected in X-rays, a novel observational probe for this explosion class. The X-ray emission in SN 2021gno was detected earlier than SN 2019ehk (WJG20a), in addition to being more luminous, but was nonetheless consistent with a rapid decline rate of . Now that this behavior has been confirmed in more than one CaST, it is more likely that X-ray emission from shock interaction in a dense, confined shell of CSM is a trait that could be more common to the CaST class as a whole. However, detecting future CaSTs at X-ray wavelengths requires the discovery of future objects at Mpc and the follow-up of these transients with X-ray telescopes in the first day after explosion. Given that X-rays were detected in both SNe 2019ehk and 2021gno, the only two CaSTs where Swift-XRT was re-pointed at very early phases ( days), it is highly likely that X-ray emission is present in all double-peaked, and possibly all single-peaked, CaSTs directly after explosion.
9 Conclusions
In this paper, we have presented multi-wavelength observations of two new CaSTs, SNe 2021gno and 2021inl. Despite their unique double-peaked light curves, both objects are photometrically and spectroscopically consistent with prototypical CaSTs throughout their evolution, which solidifies their place in this explosion class. Below we list the primary findings that make SNe 2021gno and 2021inl significant and novel additions to our understanding of these peculiar explosions:
-
•
SN 2021gno was first detected within 0.5 days of explosion and is located on the outer edge of the star-forming spiral host galaxy NGC 4165. SN 2021inl was first detected within 0.1 days of explosion and is located at a large offset from early-type host galaxy NGC 4923.
-
•
Based on their fast light curve evolution ( days), low overall luminosities ( mag), and dominant [Ca ii] emission lines (e.g., [Ca ii]/[O i] ), both SNe can be confidently classified as CaSTs. Furthermore, the ratio of ion masses derived for both SNe in §5.2 (e.g., ) continues to indicate that these explosions are not “rich” in Ca abundance but rather are “rich” in Ca emission i.e., “Calcium-strong.”
-
•
Despite visibly different host galaxies, modeling of the host spectra reveals that the explosion sites of both SNe had very little ( yr-1) or no recent star formation, which strongly suggests that neither SN came from a massive star progenitor.
-
•
SN 2021gno is the second CaST with confirmed, luminous X-ray emission ( erg s-1) as detected by Swift-XRT at days post-explosion. Based on the rapid fading and modeling of the X-ray spectrum, we conclude that this emission was derived from shocked CSM gas comprised of of shocked gas that extended to distances cm, possibly comprised of H- and/or He-rich material. At larger distances from the progenitor star (e.g., cm), modeling of SN 2021gno radio observations indicates a progenitor mass loss rate of () in the final year(s) before explosion.
-
•
SNe 2021gno and 2021inl are the fourth and fifth CaSTs with multi-color, double-peaked light curves. We model the initial flux excess using four analytic formalisms for shock cooling emission from extended material to derive best fit parameters of this material (§6.2). For SN 2021gno, we find that a radius and mass of extended material ranging from and , respectively, can reproduce the early-time emission. Similarly, for SN 2021inl, we derive radius and mass of extended material of and , respectively.
-
•
Given the direct evidence for CSM interaction in SN 2021gno, we also model the primary light curve peak in both SNe with numerical models for shock interaction with confined CSM (§6.3). We find that the observed flux excess in SN 2021gno can be fit with cm and , both properties being consistent with X-ray modeling. For SN 2021inl, we find a similar best fit CSM radius and mass.
-
•
Using a combination of shock cooling, shock interaction, X-ray, and radio modeling, as well as host galaxy SFR, we are able to place some of the tightest constraints to date on the density profile of the local CaST progenitor environment (Fig. 19). For both SNe 2021gno and 2021inl, as well as other double-peaked CaSTs SN 2019ehk and iPTF16hgs, the progenitor CSM density is consistent with models for the merger of low-mass, hybrid WDs. For SNe 2019ehk, 2021gno and 2021inl specifically, this is supported by the lack of host galaxy star formation at the explosion sites of these events.
Future multi-wavelength (X-ray to radio) observations of double-peaked CaSTs at very early-time phases will be instrumental in filling out the progenitor environment phase space and constraining the progenitor channel of these peculiar explosions. Multi-color transient surveys with higher limiting magnitudes ( mag) such as YSE currently and LSST in the future will greatly increase the number of CaSTs discovered within a day of explosion.
10 Acknowledgements
Research at UC Berkeley is conducted on the territory of Huichin, the ancestral and unceded land of the Chochenyo speaking Ohlone people, the successors of the sovereign Verona Band of Alameda County. Keck I/II, ATLAS, and PS1 observations were conducted on the stolen land of the kānaka ‘ōiwi people. We stand in solidarity with the Pu’uhonua o Pu’uhuluhulu Maunakea in their effort to preserve these sacred spaces for native Hawai‘ians. MMT observations were conducted on the stolen land of the Tohono O’odham and Hia-Ced O’odham nations; the Ak-Chin Indian Community, and Hohokam people. ZTF observations were conducted on the stolen land of the Pauma and Cupeño tribes; the Kumeyaay Nation and the Payómkawichum (Luiseño) people. Shane 3-m observations were conducted on the stolen land of the Ohlone (Costanoans), Tamyen and Muwekma Ohlone tribes.
The Young Supernova Experiment and its research infrastructure is supported by the European Research Council under the European Union’s Horizon 2020 research and innovation programme (ERC Grant Agreement No. 101002652, PI K. Mandel), the Heising-Simons Foundation (2018-0913, PI R. Foley; 2018-0911, PI R. Margutti), NASA (NNG17PX03C, PI R. Foley), NSF (AST-1720756, AST-1815935, PI R. Foley; AST-1909796, AST-1944985, PI R. Margutti), the David & Lucille Packard Foundation (PI R. Foley), VILLUM FONDEN (project number 16599, PI J. Hjorth), and the Center for AstroPhysical Surveys (CAPS) at the National Center for Supercomputing Applications (NCSA) and the University of Illinois Urbana-Champaign.
W.J-G is supported by the National Science Foundation Graduate Research Fellowship Program under Grant No. DGE-1842165. W.J-G acknowledges support through NASA grants in support of Hubble Space Telescope program GO-16075 and 16500. This research was supported in part by the National Science Foundation under Grant No. NSF PHY-1748958. R.M. acknowledges support by the National Science Foundation under Award No. AST-1909796 and AST-1944985. R.M. is a CIFAR Azrieli Global Scholar in the Gravity & the Extreme Universe Program, 2019. The Margutti’s team at Northwestern and UC Berkeley is partially funded by the Heising-Simons Foundation under grant # 2018-0911 and #2021-3248 (PI: Margutti).
V.A.V acknowledges support by the National Science Foundation under Award No.AST-2108676. C. R. A. was supported by grants from VILLUM FONDEN (project numbers 16599 and 25501). Parts of this research were supported by the Australian Research Council Centre of Excellence for All Sky Astrophysics in 3 Dimensions (ASTRO 3D), through project number CE170100013.
The UCSC team is supported in part by NASA grant 80NSSC20K0953, NSF grant AST–1815935, the Gordon & Betty Moore Foundation, the Heising-Simons Foundation, and by a fellowship from the David and Lucile Packard Foundation to R.J.F.
Some of the data presented herein were obtained at the W. M. Keck Observatory, which is operated as a scientific partnership among the California Institute of Technology, the University of California, and NASA. The Observatory was made possible by the generous financial support of the W. M. Keck Foundation. The authors wish to recognize and acknowledge the very significant cultural role and reverence that the summit of Maunakea has always had within the indigenous Hawaiian community. We are most fortunate to have the opportunity to conduct observations from this mountain.
A major upgrade of the Kast spectrograph on the Shane 3 m telescope at Lick Observatory was made possible through generous gifts from the Heising-Simons Foundation as well as William and Marina Kast. Research at Lick Observatory is partially supported by a generous gift from Google.
Based in part on observations obtained with the Samuel Oschin 48-inch Telescope at the Palomar Observatory as part of the Zwicky Transient Facility project. ZTF is supported by the NSF under grant AST-1440341 and a collaboration including Caltech, IPAC, the Weizmann Institute for Science, the Oskar Klein Center at Stockholm University, the University of Maryland, the University of Washington, Deutsches Elektronen-Synchrotron and Humboldt University, Los Alamos National Laboratories, the TANGO Consortium of Taiwan, the University of Wisconsin at Milwaukee, and the Lawrence Berkeley National Laboratory. Operations are conducted by the Caltech Optical Observatories (COO), the Infrared Processing and Analysis Center (IPAC), and the University of Washington (UW).
The Pan-STARRS1 Surveys (PS1) and the PS1 public science archive have been made possible through contributions by the Institute for Astronomy, the University of Hawaii, the Pan-STARRS Project Office, the Max-Planck Society and its participating institutes, the Max Planck Institute for Astronomy, Heidelberg and the Max Planck Institute for Extraterrestrial Physics, Garching, The Johns Hopkins University, Durham University, the University of Edinburgh, the Queen’s University Belfast, the Harvard-Smithsonian Center for Astrophysics, the Las Cumbres Observatory Global Telescope Network Incorporated, the National Central University of Taiwan, STScI, NASA under grant NNX08AR22G issued through the Planetary Science Division of the NASA Science Mission Directorate, NSF grant AST-1238877, the University of Maryland, Eotvos Lorand University (ELTE), the Los Alamos National Laboratory, and the Gordon and Betty Moore Foundation.
IRAF is distributed by NOAO, which is operated by AURA, Inc., under cooperative agreement with the National Science Foundation (NSF).
References
- Albareti et al. (2017) Albareti, F. D., Allende Prieto, C., Almeida, A., et al. 2017, ApJS, 233, 25, doi: 10.3847/1538-4365/aa8992
- Almgren et al. (2010) Almgren, A. S., Beckner, V. E., Bell, J. B., et al. 2010, ApJ, 715, 1221, doi: 10.1088/0004-637X/715/2/1221
- Arcavi et al. (2011) Arcavi, I., Gal-Yam, A., Yaron, O., et al. 2011, ApJ, 742, L18, doi: 10.1088/2041-8205/742/2/L18
- Arcavi et al. (2017) Arcavi, I., Hosseinzadeh, G., Brown, P. J., et al. 2017, ApJ, 837, L2, doi: 10.3847/2041-8213/aa5be1
- Armstrong et al. (2021) Armstrong, P., Tucker, B. E., Rest, A., et al. 2021, MNRAS, 507, 3125, doi: 10.1093/mnras/stab2138
- Arnett (1982) Arnett, W. D. 1982, ApJ, 253, 785, doi: 10.1086/159681
- Becker (2015) Becker, A. 2015, HOTPANTS: High Order Transform of PSF ANd Template Subtraction, Astrophysics Source Code Library. http://ascl.net/1504.004
- Bellm et al. (2019) Bellm, E. C., Kulkarni, S. R., Graham, M. J., et al. 2019, PASP, 131, 018002, doi: 10.1088/1538-3873/aaecbe
- Bobrick et al. (2017) Bobrick, A., Davies, M. B., & Church, R. P. 2017, MNRAS, 467, 3556, doi: 10.1093/mnras/stx312
- Brown et al. (2014) Brown, P. J., Breeveld, A. A., Holland, S., Kuin, P., & Pritchard, T. 2014, Ap&SS, 354, 89, doi: 10.1007/s10509-014-2059-8
- Brown et al. (2010) Brown, P. J., Roming, P. W. A., Milne, P., et al. 2010, ApJ, 721, 1608, doi: 10.1088/0004-637X/721/2/1608
- Bruch et al. (2021) Bruch, R., Zimmerman, E., & Johansson, J. 2021, Transient Name Server Discovery Report, 2021-843, 1
- Bruzual & Charlot (2003) Bruzual, G., & Charlot, S. 2003, MNRAS, 344, 1000, doi: 10.1046/j.1365-8711.2003.06897.x
- Burrows et al. (2005) Burrows, D. N., Hill, J. E., Nousek, J. A., et al. 2005, Space Sci. Rev., 120, 165, doi: 10.1007/s11214-005-5097-2
- Cappellaro et al. (1997) Cappellaro, E., Mazzali, P. A., Benetti, S., et al. 1997, A&A, 328, 203. https://arxiv.org/abs/astro-ph/9707016
- Chabrier (2003) Chabrier, G. 2003, in IAU Symposium, Vol. 221, IAU Symposium, P67
- Chambers et al. (2017) Chambers, K. C., Huber, M. E., Flewelling, H., et al. 2017, Transient Name Server Discovery Report, 2017-324, 1
- Chevalier (1998) Chevalier, R. A. 1998, ApJ, 499, 810, doi: 10.1086/305676
- Conroy et al. (2009) Conroy, C., Gunn, J. E., & White, M. 2009, ApJ, 699, 486, doi: 10.1088/0004-637X/699/1/486
- De et al. (2021) De, K., Fremling, U. C., Gal-Yam, A., et al. 2021, ApJ, 907, L18, doi: 10.3847/2041-8213/abd627
- De et al. (2018a) De, K., Kasliwal, M. M., Cantwell, T., et al. 2018a, ApJ, 866, 72, doi: 10.3847/1538-4357/aadf8e
- De et al. (2018b) De, K., Kasliwal, M. M., Ofek, E. O., et al. 2018b, Science, 362, 201, doi: 10.1126/science.aas8693
- De et al. (2020a) De, K., Kasliwal, M. M., Tzanidakis, A., et al. 2020a, ApJ, 905, 58, doi: 10.3847/1538-4357/abb45c
- De et al. (2020b) —. 2020b, arXiv e-prints, arXiv:2004.09029. https://arxiv.org/abs/2004.09029
- Dong et al. (2022) Dong, Y., Milisavljevic, D., Leja, J., et al. 2022, arXiv e-prints, arXiv:2202.03449. https://arxiv.org/abs/2202.03449
- Duffell (2016) Duffell, P. C. 2016, RT1D: 1D code for Rayleigh-Taylor instability. http://ascl.net/1607.015
- Eldridge et al. (2017) Eldridge, J. J., Stanway, E. R., Xiao, L., et al. 2017, PASA, 34, e058, doi: 10.1017/pasa.2017.51
- Filippenko et al. (2003) Filippenko, A. V., Chornock, R., Swift, B., et al. 2003, IAU Circ., 8159, 2
- Fitzpatrick (1999) Fitzpatrick, E. L. 1999, PASP, 111, 63, doi: 10.1086/316293
- Foley (2015) Foley, R. J. 2015, MNRAS, 452, 2463, doi: 10.1093/mnras/stv789
- Foley et al. (2003) Foley, R. J., Papenkova, M. S., Swift, B. J., et al. 2003, PASP, 115, 1220, doi: 10.1086/378242
- Foreman-Mackey et al. (2013) Foreman-Mackey, D., Hogg, D. W., Lang, D., & Goodman, J. 2013, PASP, 125, 306, doi: 10.1086/670067
- Gagliano et al. (2022) Gagliano, A., Izzo, L., Kilpatrick, C. D., et al. 2022, ApJ, 924, 55, doi: 10.3847/1538-4357/ac35ec
- Galbany et al. (2018) Galbany, L., Anderson, J. P., Sánchez, S. F., et al. 2018, ApJ, 855, 107, doi: 10.3847/1538-4357/aaaf20
- Galbany et al. (2019) Galbany, L., Ashall, C., Hoeflich, P., et al. 2019, arXiv e-prints, arXiv:1904.10034. https://arxiv.org/abs/1904.10034
- Gehrels et al. (2004) Gehrels, N., Chincarini, G., Giommi, P., et al. 2004, ApJ, 611, 1005, doi: 10.1086/422091
- Graham et al. (2019) Graham, M. J., Kulkarni, S. R., Bellm, E. C., et al. 2019, PASP, 131, 078001, doi: 10.1088/1538-3873/ab006c
- Hickish et al. (2018) Hickish, J., Razavi-Ghods, N., Perrott, Y. C., et al. 2018, MNRAS, 475, 5677, doi: 10.1093/mnras/sty074
- Ho et al. (2020) Ho, A. Y. Q., Kulkarni, S. R., Perley, D. A., et al. 2020, ApJ, 902, 86, doi: 10.3847/1538-4357/aba630
- Horne (1986) Horne, K. 1986, PASP, 98, 609, doi: 10.1086/131801
- Hung et al. (2021) Hung, T., Tinyanont, S., Dimitriadis, G., & Foley, R. J. 2021, Transient Name Server Classification Report, 2021-884, 1
- Jacobson-Galán et al. (2020a) Jacobson-Galán, W. V., Margutti, R., Kilpatrick, C. D., et al. 2020a, ApJ, 898, 166, doi: 10.3847/1538-4357/ab9e66
- Jacobson-Galán et al. (2020b) Jacobson-Galán, W. V., Polin, A., Foley, R. J., et al. 2020b, ApJ, 896, 165, doi: 10.3847/1538-4357/ab94b8
- Jacobson-Galán et al. (2021) Jacobson-Galán, W. V., Margutti, R., Kilpatrick, C. D., et al. 2021, ApJ, 908, L32, doi: 10.3847/2041-8213/abdebc
- Jacobson-Galán et al. (2022) Jacobson-Galán, W. V., Dessart, L., Jones, D. O., et al. 2022, ApJ, 924, 15, doi: 10.3847/1538-4357/ac3f3a
- Jarrett et al. (2000) Jarrett, T. H., Chester, T., Cutri, R., et al. 2000, AJ, 119, 2498, doi: 10.1086/301330
- Jones et al. (2021) Jones, D. O., Foley, R. J., Narayan, G., et al. 2021, ApJ, 908, 143, doi: 10.3847/1538-4357/abd7f5
- Jung et al. (2021) Jung, M.-K., Yoon, S.-C., & Kim, H.-J. 2021, arXiv e-prints, arXiv:2112.00272. https://arxiv.org/abs/2112.00272
- Kaiser et al. (2002) Kaiser, N., Aussel, H., Burke, B. E., et al. 2002, in Society of Photo-Optical Instrumentation Engineers (SPIE) Conference Series, Vol. 4836, Survey and Other Telescope Technologies and Discoveries, ed. J. A. Tyson & S. Wolff, 154–164, doi: 10.1117/12.457365
- Kalberla et al. (2005) Kalberla, P. M. W., Burton, W. B., Hartmann, D., et al. 2005, A&A, 440, 775, doi: 10.1051/0004-6361:20041864
- Kasen et al. (2006) Kasen, D., Thomas, R. C., & Nugent, P. 2006, ApJ, 651, 366, doi: 10.1086/506190
- Kasliwal et al. (2012) Kasliwal, M. M., Kulkarni, S. R., Gal-Yam, A., et al. 2012, ApJ, 755, 161, doi: 10.1088/0004-637X/755/2/161
- Kennicutt (1998) Kennicutt, Robert C., J. 1998, ARA&A, 36, 189, doi: 10.1146/annurev.astro.36.1.189
- Kouveliotou et al. (2004) Kouveliotou, C., Woosley, S. E., Patel, S. K., et al. 2004, ApJ, 608, 872, doi: 10.1086/420878
- Kriek et al. (2009) Kriek, M., van Dokkum, P. G., Labbé, I., et al. 2009, ApJ, 700, 221, doi: 10.1088/0004-637X/700/1/221
- Kuncarayakti et al. (2018) Kuncarayakti, H., Anderson, J. P., Galbany, L., et al. 2018, A&A, 613, A35, doi: 10.1051/0004-6361/201731923
- Lunnan et al. (2017) Lunnan, R., Kasliwal, M. M., Cao, Y., et al. 2017, ApJ, 836, 60, doi: 10.3847/1538-4357/836/1/60
- Lyman et al. (2013) Lyman, J. D., James, P. A., Perets, H. B., et al. 2013, MNRAS, 434, 527, doi: 10.1093/mnras/stt1038
- Lyman et al. (2014) Lyman, J. D., Levan, A. J., Church, R. P., Davies, M. B., & Tanvir, N. R. 2014, MNRAS, 444, 2157, doi: 10.1093/mnras/stu1574
- Margutti et al. (2013) Margutti, R., Zaninoni, E., Bernardini, M. G., et al. 2013, MNRAS, 428, 729, doi: 10.1093/mnras/sts066
- Masci et al. (2019) Masci, F. J., Laher, R. R., Rusholme, B., et al. 2019, PASP, 131, 018003, doi: 10.1088/1538-3873/aae8ac
- McMullin et al. (2007) McMullin, J. P., Waters, B., Schiebel, D., Young, W., & Golap, K. 2007, in Astronomical Society of the Pacific Conference Series, Vol. 376, Astronomical Data Analysis Software and Systems XVI, ed. R. A. Shaw, F. Hill, & D. J. Bell, 127
- Milisavljevic et al. (2017) Milisavljevic, D., Patnaude, D. J., Raymond, J. C., et al. 2017, ApJ, 846, 50, doi: 10.3847/1538-4357/aa7d9f
- Miller & Stone (1993) Miller, J. S., & Stone, R. P. S. 1993, LOTRM
- Moriya et al. (2017) Moriya, T. J., Mazzali, P. A., Tominaga, N., et al. 2017, MNRAS, 466, 2085, doi: 10.1093/mnras/stw3225
- Munoz-Arancibia et al. (2021) Munoz-Arancibia, A., Forster, F., Bauer, F. E., et al. 2021, Transient Name Server Discovery Report, 2021-1092, 1
- Nakaoka et al. (2021) Nakaoka, T., Maeda, K., Yamanaka, M., et al. 2021, ApJ, 912, 30, doi: 10.3847/1538-4357/abe765
- Nakar & Piro (2014) Nakar, E., & Piro, A. L. 2014, ApJ, 788, 193, doi: 10.1088/0004-637X/788/2/193
- Oke et al. (1995) Oke, J. B., Cohen, J. G., Carr, M., et al. 1995, PASP, 107, 375, doi: 10.1086/133562
- Perets (2014a) Perets, H. B. 2014a, arXiv e-prints, arXiv:1407.2254. https://arxiv.org/abs/1407.2254
- Perets (2014b) —. 2014b, arXiv e-prints, arXiv:1407.2254. https://arxiv.org/abs/1407.2254
- Perets et al. (2011) Perets, H. B., Badenes, C., Arcavi, I., Simon, J. D., & Gal-yam, A. 2011, ApJ, 730, 89, doi: 10.1088/0004-637X/730/2/89
- Perets & Beniamini (2021) Perets, H. B., & Beniamini, P. 2021, MNRAS, 503, 5997, doi: 10.1093/mnras/stab794
- Perets et al. (2019) Perets, H. B., Zenati, Y., Toonen, S., & Bobrick, A. 2019, arXiv e-prints, arXiv:1910.07532. https://arxiv.org/abs/1910.07532
- Perets et al. (2010a) Perets, H. B., Gal-Yam, A., Mazzali, P. A., et al. 2010a, Nature, 465, 322, doi: 10.1038/nature09056
- Perets et al. (2010b) —. 2010b, Nature, 465, 322, doi: 10.1038/nature09056
- Perrott et al. (2013) Perrott, Y. C., Scaife, A. M. M., Green, D. A., et al. 2013, MNRAS, 429, 3330, doi: 10.1093/mnras/sts589
- Pettini & Pagel (2004) Pettini, M., & Pagel, B. E. J. 2004, MNRAS, 348, L59, doi: 10.1111/j.1365-2966.2004.07591.x
- Piro (2015) Piro, A. L. 2015, ApJ, 808, L51, doi: 10.1088/2041-8205/808/2/L51
- Piro et al. (2021) Piro, A. L., Haynie, A., & Yao, Y. 2021, ApJ, 909, 209, doi: 10.3847/1538-4357/abe2b1
- Piro et al. (2017) Piro, A. L., Muhleisen, M., Arcavi, I., et al. 2017, ApJ, 846, 94, doi: 10.3847/1538-4357/aa8595
- Raskin & Kasen (2013) Raskin, C., & Kasen, D. 2013, ApJ, 772, 1, doi: 10.1088/0004-637X/772/1/1
- Rest et al. (2005) Rest, A., Stubbs, C., Becker, A. C., et al. 2005, ApJ, 634, 1103, doi: 10.1086/497060
- Rest et al. (2022) Rest, A., Dhawan, S., Mandel, K., et al. 2022, Transient Name Server AstroNote, 24, 1
- Roming et al. (2005) Roming, P. W. A., Kennedy, T. E., Mason, K. O., et al. 2005, Space Sci. Rev., 120, 95, doi: 10.1007/s11214-005-5095-4
- Roth & Kasen (2015) Roth, N., & Kasen, D. 2015, ApJS, 217, 9, doi: 10.1088/0067-0049/217/1/9
- Salpeter (1955) Salpeter, E. E. 1955, ApJ, 121, 161, doi: 10.1086/145971
- Sapir & Waxman (2017) Sapir, N., & Waxman, E. 2017, ApJ, 838, 130, doi: 10.3847/1538-4357/aa64df
- Schechter et al. (1993) Schechter, P. L., Mateo, M., & Saha, A. 1993, PASP, 105, 1342, doi: 10.1086/133316
- Schlafly & Finkbeiner (2011) Schlafly, E. F., & Finkbeiner, D. P. 2011, ApJ, 737, 103, doi: 10.1088/0004-637X/737/2/103
- Schlegel et al. (1998) Schlegel, D. J., Finkbeiner, D. P., & Davis, M. 1998, ApJ, 500, 525, doi: 10.1086/305772
- Schwab et al. (2016) Schwab, J., Quataert, E., & Kasen, D. 2016, MNRAS, 463, 3461, doi: 10.1093/mnras/stw2249
- Seibert et al. (2012) Seibert, M., Wyder, T., Neill, J., et al. 2012, in American Astronomical Society Meeting Abstracts, Vol. 219, American Astronomical Society Meeting Abstracts #219, 340.01
- Shen et al. (2012) Shen, K. J., Bildsten, L., Kasen, D., & Quataert, E. 2012, ApJ, 748, 35, doi: 10.1088/0004-637X/748/1/35
- Shen et al. (2019) Shen, K. J., Quataert, E., & Pakmor, R. 2019, ApJ, 887, 180, doi: 10.3847/1538-4357/ab5370
- Silverman et al. (2012) Silverman, J. M., Foley, R. J., Filippenko, A. V., et al. 2012, MNRAS, 425, 1789, doi: 10.1111/j.1365-2966.2012.21270.x
- Smith et al. (2020) Smith, K. W., Smartt, S. J., Young, D. R., et al. 2020, arXiv e-prints, arXiv:2003.09052. https://arxiv.org/abs/2003.09052
- Smith et al. (2016) Smith, M., Sullivan, M., D’Andrea, C. B., et al. 2016, ApJ, 818, L8, doi: 10.3847/2041-8205/818/1/L8
- Sullivan et al. (2011) Sullivan, M., Kasliwal, M. M., Nugent, P. E., et al. 2011, ApJ, 732, 118, doi: 10.1088/0004-637X/732/2/118
- Sutherland & Wheeler (1984) Sutherland, P. G., & Wheeler, J. C. 1984, ApJ, 280, 282, doi: 10.1086/161995
- Taggart et al. (2021) Taggart, K., Rojas-Bravo, C., Foley, R. J., & Angus, C. R. 2021, Transient Name Server Classification Report, 2021-1196, 1
- Taubenberger (2017) Taubenberger, S. 2017, The Extremes of Thermonuclear Supernovae, 317, doi: 10.1007/978-3-319-21846-5_37
- Terreran et al. (2021) Terreran, G., Jacobson-Galan, W. V., Groh, J. H., et al. 2021, arXiv e-prints, arXiv:2105.12296. https://arxiv.org/abs/2105.12296
- Theureau et al. (2007) Theureau, G., Hanski, M. O., Coudreau, N., Hallet, N., & Martin, J. M. 2007, A&A, 465, 71, doi: 10.1051/0004-6361:20066187
- Tonry et al. (2018a) Tonry, J. L., Denneau, L., Heinze, A. N., et al. 2018a, Publications of the Astronomical Society of the Pacific, 130, 064505, doi: 10.1088/1538-3873/aabadf
- Tonry et al. (2018b) Tonry, J. L., Denneau, L., Flewelling, H., et al. 2018b, ApJ, 867, 105, doi: 10.3847/1538-4357/aae386
- Valenti et al. (2008) Valenti, S., Benetti, S., Cappellaro, E., et al. 2008, MNRAS, 383, 1485, doi: 10.1111/j.1365-2966.2007.12647.x
- Wade & Horne (1988) Wade, R. A., & Horne, K. 1988, ApJ, 324, 411, doi: 10.1086/165905
- Wanajo et al. (2018) Wanajo, S., Müller, B., Janka, H.-T., & Heger, A. 2018, ApJ, 852, 40, doi: 10.3847/1538-4357/aa9d97
- Weiler et al. (2002) Weiler, K. W., Panagia, N., Montes, M. J., & Sramek, R. A. 2002, ARA&A, 40, 387, doi: 10.1146/annurev.astro.40.060401.093744
- Wheeler et al. (2015) Wheeler, J. C., Johnson, V., & Clocchiatti, A. 2015, MNRAS, 450, 1295, doi: 10.1093/mnras/stv650
- Wheeler et al. (1993) Wheeler, J. C., Barker, E., Benjamin, R., et al. 1993, ApJ, 417, L71, doi: 10.1086/187097
- Yao et al. (2020) Yao, Y., De, K., Kasliwal, M. M., et al. 2020, ApJ, 900, 46, doi: 10.3847/1538-4357/abaa3d
- Yoon et al. (2017) Yoon, S.-C., Dessart, L., & Clocchiatti, A. 2017, ApJ, 840, 10, doi: 10.3847/1538-4357/aa6afe
- Yoshida et al. (2017) Yoshida, T., Suwa, Y., Umeda, H., Shibata, M., & Takahashi, K. 2017, MNRAS, 471, 4275, doi: 10.1093/mnras/stx1738
- Zenati et al. (2019a) Zenati, Y., Perets, H. B., & Toonen, S. 2019a, MNRAS, 486, 1805, doi: 10.1093/mnras/stz316
- Zenati et al. (2019b) Zenati, Y., Toonen, S., & Perets, H. B. 2019b, MNRAS, 482, 1135, doi: 10.1093/mnras/sty2723
- Zwart et al. (2008) Zwart, J. T. L., Barker, R. W., Biddulph, P., et al. 2008, MNRAS, 391, 1545, doi: 10.1111/j.1365-2966.2008.13953.x
| MJDs | PhaseaaRelative to explosion (MJD 59292.7). | Photon Index | 0.3-10 keV Unabsorbed Flux | Instrument |
|---|---|---|---|---|
| (days) | () | ( erg s-1 cm-2) | ||
| 59293.51, 59293.84 | 0.81 – 1.14 | Swift-XRT | ||
| 59294.36, 59295.44, 59296.23 | 1.66 – 3.53 | – | Swift-XRT | |
| 59298.28, 59302.66, 59303.14, 59308.71 | 5.58 – 16.01 | – | Swift-XRT | |
| 59313.30, 59317.86, 59325.64, 59414.17, 59524.21 | 20.6 – 231.51 | – | Swift-XRT |
Note. — No extinction corrections have been applied to the presented apparent magnitudes.
Note. — No extinction corrections have been applied to the presented apparent magnitudes.
| UT Date | MJD | PhaseaaRelative to explosion (MJD 59292.7) | Telescope | Instrument | Wavelength Range |
|---|---|---|---|---|---|
| (days) | (Å) | ||||
| 2021-03-22 | 59295 | NOT | ALFOSC | 3600–9000 | |
| 2021-03-22 | 59295 | Shane | Kast | 3300–10200 | |
| 2021-03-30 | 59303 | ANU 2.3m | WiFES | 3800–7000 | |
| 2021-04-01 | 59305 | Livermore Telescope | SPRAT | 3800–8000 | |
| 2021-04-02 | 59306 | NOT | ALFOSC | 3600–9000 | |
| 2021-04-06 | 59310 | Shane | Kast | 3300–10200 | |
| 2021-04-10 | 59314 | IRTF | SpeX | 7000–25000 | |
| 2021-04-13 | 59317 | Shane | Kast | 3300–10200 | |
| 2021-04-19 | 59323 | Shane | Kast | 3300–10200 | |
| 2021-05-03 | 59337 | Shane | Kast | 3300–10200 | |
| 2021-05-12 | 59346 | Keck | LRIS | 3000–10000 | |
| 2021-04-09 | 59376 | MMT | Binospec | 3800–9200 |
| UT Date | MJD | PhaseaaRelative to explosion (MJD 59309.4) | Telescope | Instrument | Wavelength Range |
|---|---|---|---|---|---|
| (days) | (Å) | ||||
| 2021-04-13 | 59317 | Shane | Kast | 3300–10200 | |
| 2021-04-19 | 59323 | Shane | Kast | 3300–10200 | |
| 2021-05-12 | 59346 | Keck | LRIS | 3000–10000 | |
| 2021-07-08 | 59403 | Keck | LRIS | 3000–10000 |
| Start Date | Time111111Relative to explosion (MJD 59292.7) | Frequency | Bandwidth | Flux Density121212Upper-limits are quoted at . |
| (UT) | (days) | (GHz) | (GHz) | (Jy/beam) |
| 2021-04-21 | 35 | 15.5 | 5 | |
| 2021-04-25 | 39 | 15.5 | 5 | |
| 2021-11-19 | 245 | 15.5 | 5 |
| Model | SN | Phase Range | |||||
|---|---|---|---|---|---|---|---|
| days | days | ||||||
| Piro (2015) | 2021gno | 105 | |||||
| Piro et al. (2021) | 2021gno | 51.3 | |||||
| Sapir & Waxman (2017) [n=3/2] | 2021gno | 10.8 | |||||
| Sapir & Waxman (2017) [n=3] | 2021gno | 10.2 | |||||
| Piro (2015) | 2021inl | 40.1 | |||||
| Piro et al. (2021) | 2021inl | 7.91 | |||||
| Sapir & Waxman (2017) [n=3/2] | 2021inl | 5.57 | |||||
| Sapir & Waxman (2017) [n=3] | 2021inl | 3.71 |
| MJD | PhaseaaRelative to explosion (MJD 59309.4) | Filter | Magnitude | Uncertainty | Instrument |
|---|---|---|---|---|---|
| 59310.36 | +0.97 | 19.51 | 0.05 | PS1 | |
| 59312.49 | +3.10 | 19.87 | 0.07 | PS1 | |
| 59313.47 | +4.08 | 20.05 | 0.10 | PS1 | |
| 59314.31 | +4.92 | 20.15 | 0.07 | PS1 | |
| 59316.46 | +7.07 | 20.34 | 0.15 | PS1 | |
| 59317.37 | +7.98 | 20.23 | 0.10 | PS1 | |
| 59319.35 | +9.96 | 20.22 | 0.07 | PS1 | |
| 59321.45 | +12.06 | 20.42 | 0.08 | PS1 | |
| 59322.49 | +13.10 | 20.56 | 0.11 | PS1 | |
| 59323.36 | +13.97 | 20.71 | 0.17 | PS1 | |
| 59350.26 | +40.87 | 21.47 | 0.43 | PS1 | |
| 59353.37 | +43.98 | 22.12 | 0.63 | PS1 | |
| 59312.50 | +3.11 | 19.75 | 0.08 | PS1 | |
| 59314.31 | +4.92 | 19.84 | 0.05 | PS1 | |
| 59317.38 | +7.99 | 19.69 | 0.07 | PS1 | |
| 59319.34 | +9.95 | 19.76 | 0.05 | PS1 | |
| 59321.46 | +12.07 | 19.81 | 0.04 | PS1 | |
| 59326.30 | +16.91 | 20.21 | 0.14 | PS1 | |
| 59332.44 | +23.05 | 20.64 | 0.22 | PS1 | |
| 59334.43 | +25.04 | 21.09 | 0.55 | PS1 | |
| 59334.44 | +25.05 | 20.92 | 0.20 | PS1 | |
| 59336.44 | +27.05 | 21.08 | 0.24 | PS1 | |
| 59344.27 | +34.88 | 21.47 | 0.17 | PS1 | |
| 59352.43 | +43.04 | 21.50 | 0.33 | PS1 | |
| 59360.27 | +50.88 | 22.04 | 0.69 | PS1 | |
| 59364.40 | +55.01 | 22.28 | 0.39 | PS1 | |
| 59375.37 | +65.98 | 22.52 | 0.88 | PS1 | |
| 59414.28 | +104.89 | 22.37 | 0.87 | PS1 | |
| 59310.36 | +0.97 | 20.02 | 0.07 | PS1 | |
| 59313.47 | +4.08 | 19.86 | 0.07 | PS1 | |
| 59316.45 | +7.06 | 19.84 | 0.10 | PS1 | |
| 59322.49 | +13.10 | 19.77 | 0.05 | PS1 | |
| 59323.35 | +13.96 | 19.72 | 0.06 | PS1 | |
| 59326.30 | +16.91 | 19.66 | 0.10 | PS1 | |
| 59334.42 | +25.03 | 20.71 | 0.51 | PS1 | |
| 59342.27 | +32.88 | 20.91 | 0.18 | PS1 | |
| 59346.40 | +37.01 | 21.25 | 0.21 | PS1 | |
| 59349.45 | +40.06 | 21.56 | 0.51 | PS1 | |
| 59351.38 | +41.99 | 20.82 | 0.26 | PS1 | |
| 59362.39 | +53.00 | 21.82 | 0.50 | PS1 | |
| 59368.34 | +58.95 | 21.98 | 0.54 | PS1 | |
| 59373.33 | +63.94 | 22.25 | 0.33 | PS1 | |
| 59332.44 | +23.05 | 20.85 | 0.34 | PS1 | |
| 59334.44 | +25.05 | 21.10 | 0.33 | PS1 | |
| 59336.44 | +27.05 | 20.56 | 0.28 | PS1 | |
| 59353.37 | +43.98 | 21.01 | 0.31 | PS1 | |
| 59360.26 | +50.87 | 21.40 | 0.47 | PS1 | |
| 59364.41 | +55.02 | 21.40 | 0.31 | PS1 | |
| 59366.41 | +57.02 | 21.55 | 0.38 | PS1 | |
| 59414.28 | +104.89 | 21.79 | 0.66 | PS1 |
| MJD | PhaseaaRelative to explosion (MJD 59309.4) | Filter | Magnitude | Uncertainty | Instrument |
|---|---|---|---|---|---|
| 59311.24 | +1.85 | 19.44 | 0.06 | ZTF | |
| 59313.26 | +3.87 | 19.77 | 0.09 | ZTF | |
| 59317.27 | +7.88 | 20.33 | 0.09 | ZTF | |
| 59321.37 | +11.98 | 20.50 | 0.11 | ZTF | |
| 59323.27 | +13.88 | 20.92 | 0.24 | ZTF | |
| 59311.30 | +1.91 | 19.70 | 0.09 | ZTF | |
| 59313.30 | +3.91 | 19.76 | 0.10 | ZTF | |
| 59317.33 | +7.94 | 19.79 | 0.08 | ZTF | |
| 59321.30 | +11.91 | 19.74 | 0.06 | ZTF | |
| 59323.34 | +13.95 | 19.92 | 0.09 | ZTF | |
| 59325.27 | +15.88 | 20.04 | 0.12 | ZTF | |
| 59338.25 | +28.86 | 21.59 | 0.34 | ZTF | |
| 59340.30 | +30.91 | 21.26 | 0.25 | ZTF | |
| 59342.30 | +32.91 | 21.55 | 0.30 | ZTF | |
| 59309.48 | +0.09 | 20.63 | 0.18 | ATLAS | |
| 59313.46 | +4.07 | 20.11 | 0.13 | ATLAS | |
| 59317.46 | +8.07 | 20.27 | 0.15 | ATLAS | |
| 59321.45 | +12.06 | 20.25 | 0.14 | ATLAS | |
| 59343.35 | +33.96 | 22.36 | 1.02 | ATLAS | |
| 59347.40 | +38.01 | 21.17 | 0.37 | ATLAS | |
| 59373.36 | +63.97 | 22.41 | 0.95 | ATLAS | |
| 59319.39 | +10.00 | 19.71 | 0.11 | ATLAS | |
| 59323.37 | +13.98 | 19.81 | 0.14 | ATLAS | |
| 59327.32 | +17.93 | 20.29 | 0.49 | ATLAS | |
| 59333.46 | +24.07 | 20.07 | 0.20 | ATLAS | |
| 59335.40 | +26.01 | 21.17 | 0.60 | ATLAS | |
| 59337.53 | +28.14 | 20.42 | 0.26 | ATLAS | |
| 59339.53 | +30.14 | 20.92 | 0.45 | ATLAS | |
| 59341.53 | +32.14 | 21.21 | 0.54 | ATLAS | |
| 59345.38 | +35.99 | 20.98 | 0.38 | ATLAS | |
| 59349.34 | +39.95 | 20.71 | 0.29 | ATLAS | |
| 59351.34 | +41.95 | 21.09 | 0.51 | ATLAS | |
| 59353.36 | +43.97 | 21.30 | 0.47 | ATLAS | |
| 59357.34 | +47.95 | 20.30 | 0.38 | ATLAS | |
| 59359.32 | +49.93 | 21.11 | 0.90 | ATLAS | |
| 59371.35 | +61.96 | 21.17 | 0.45 | ATLAS | |
| 59398.34 | +88.95 | 25.92 | – | Keck | |
| 59398.34 | +88.95 | 25.41 | – | Keck | |
| 59398.34 | +88.95 | 24.08 | 0.21 | Keck | |
| 59398.34 | +88.95 | 22.17 | 0.09 | Keck |
| MJD | PhaseaaRelative to explosion (MJD 59292.7 ) | Filter | Magnitude | Uncertainty | Instrument |
|---|---|---|---|---|---|
| 59293.29 | +0.59 | 17.74 | 0.02 | ZTF | |
| 59296.35 | +3.65 | 18.13 | 0.03 | ZTF | |
| 59298.39 | +5.69 | 18.26 | 0.06 | ZTF | |
| 59302.35 | +9.65 | 17.64 | 0.04 | ZTF | |
| 59304.26 | +11.56 | 17.57 | 0.03 | ZTF | |
| 59307.31 | +14.61 | 17.55 | 0.01 | ZTF | |
| 59309.31 | +16.61 | 17.80 | 0.02 | ZTF | |
| 59311.23 | +18.53 | 18.10 | 0.02 | ZTF | |
| 59313.26 | +20.56 | 18.48 | 0.03 | ZTF | |
| 59315.28 | +22.58 | 18.64 | 0.10 | ZTF | |
| 59321.25 | +28.55 | 19.43 | 0.05 | ZTF | |
| 59323.28 | +30.58 | 19.47 | 0.08 | ZTF | |
| 59325.32 | +32.62 | 19.48 | 0.11 | ZTF | |
| 59335.25 | +42.55 | 19.91 | 0.12 | ZTF | |
| 59338.31 | +45.61 | 20.10 | 0.11 | ZTF | |
| 59340.21 | +47.51 | 19.98 | 0.08 | ZTF | |
| 59342.23 | +49.53 | 20.18 | 0.09 | ZTF | |
| 59344.26 | +51.56 | 20.32 | 0.11 | ZTF | |
| 59350.21 | +57.51 | 20.46 | 0.16 | ZTF | |
| 59353.23 | +60.53 | 20.62 | 0.31 | ZTF | |
| 59362.18 | +69.48 | 20.95 | 0.19 | ZTF | |
| 59365.19 | +72.49 | 21.22 | 0.30 | ZTF | |
| 59367.25 | +74.55 | 20.88 | 0.23 | ZTF | |
| 59369.23 | +76.53 | 20.91 | 0.20 | ZTF | |
| 59371.19 | +78.49 | 21.28 | 0.29 | ZTF | |
| 59373.18 | +80.48 | 21.07 | 0.22 | ZTF | |
| 59376.22 | +83.52 | 20.96 | 0.31 | ZTF | |
| 59378.19 | +85.49 | 21.18 | 0.31 | ZTF | |
| 59293.24 | +0.54 | 18.20 | 0.03 | ZTF | |
| 59296.36 | +3.66 | 17.94 | 0.03 | ZTF | |
| 59298.30 | +5.60 | 17.88 | 0.06 | ZTF | |
| 59302.26 | +9.56 | 17.33 | 0.03 | ZTF | |
| 59304.30 | +11.60 | 17.16 | 0.02 | ZTF | |
| 59307.25 | +14.55 | 17.05 | 0.01 | ZTF | |
| 59309.27 | +16.57 | 17.08 | 0.01 | ZTF | |
| 59311.31 | +18.61 | 17.22 | 0.01 | ZTF | |
| 59313.30 | +20.60 | 17.39 | 0.02 | ZTF | |
| 59315.25 | +22.55 | 17.53 | 0.22 | ZTF | |
| 59317.21 | +24.51 | 17.83 | 0.02 | ZTF | |
| 59321.29 | +28.59 | 18.08 | 0.02 | ZTF | |
| 59323.32 | +30.62 | 18.23 | 0.03 | ZTF | |
| 59325.26 | +32.56 | 18.32 | 0.03 | ZTF | |
| 59335.21 | +42.51 | 18.72 | 0.05 | ZTF | |
| 59338.23 | +45.53 | 18.90 | 0.04 | ZTF | |
| 59340.23 | +47.53 | 19.08 | 0.05 | ZTF | |
| 59342.28 | +49.58 | 19.15 | 0.05 | ZTF | |
| 59344.23 | +51.53 | 19.18 | 0.04 | ZTF | |
| 59346.31 | +53.61 | 19.34 | 0.07 | ZTF | |
| 59348.19 | +55.49 | 19.33 | 0.05 | ZTF |
| MJD | PhaseaaRelative to explosion (MJD 59292.7 ) | Filter | Magnitude | Uncertainty | Instrument |
|---|---|---|---|---|---|
| 59353.19 | +60.49 | 19.52 | 0.09 | ZTF | |
| 59359.19 | +66.49 | 19.88 | 0.23 | ZTF | |
| 59362.23 | +69.53 | 19.87 | 0.13 | ZTF | |
| 59367.22 | +74.52 | 20.09 | 0.11 | ZTF | |
| 59369.21 | +76.51 | 20.34 | 0.14 | ZTF | |
| 59371.23 | +78.53 | 20.26 | 0.13 | ZTF | |
| 59373.21 | +80.51 | 20.73 | 0.25 | ZTF | |
| 59376.26 | +83.56 | 20.31 | 0.18 | ZTF | |
| 59378.25 | +85.55 | 20.59 | 0.21 | ZTF | |
| 59380.21 | +87.51 | 20.50 | 0.35 | ZTF | |
| 59293.40 | +0.70 | 18.05 | 0.03 | ATLAS | |
| 59297.36 | +4.66 | 18.08 | 0.04 | ATLAS | |
| 59303.45 | +10.75 | 17.24 | 0.05 | ATLAS | |
| 59304.39 | +11.69 | 17.16 | 0.02 | ATLAS | |
| 59305.49 | +12.79 | 17.13 | 0.02 | ATLAS | |
| 59306.39 | +13.69 | 17.08 | 0.01 | ATLAS | |
| 59307.43 | +14.73 | 17.08 | 0.03 | ATLAS | |
| 59319.41 | +26.71 | 17.90 | 0.03 | ATLAS | |
| 59323.33 | +30.63 | 18.18 | 0.03 | ATLAS | |
| 59324.44 | +31.74 | 18.18 | 0.03 | ATLAS | |
| 59331.39 | +38.69 | 18.66 | 0.14 | ATLAS | |
| 59332.43 | +39.73 | 18.54 | 0.07 | ATLAS | |
| 59333.42 | +40.72 | 18.55 | 0.06 | ATLAS | |
| 59334.39 | +41.69 | 19.94 | 0.41 | ATLAS | |
| 59335.35 | +42.65 | 18.58 | 0.05 | ATLAS | |
| 59337.47 | +44.77 | 18.79 | 0.08 | ATLAS | |
| 59345.38 | +52.68 | 18.98 | 0.07 | ATLAS | |
| 59349.33 | +56.63 | 19.05 | 0.07 | ATLAS | |
| 59351.33 | +58.63 | 19.11 | 0.08 | ATLAS | |
| 59353.31 | +60.61 | 19.28 | 0.08 | ATLAS | |
| 59358.33 | +65.63 | 19.24 | 0.19 | ATLAS | |
| 59359.30 | +66.60 | 19.85 | 0.28 | ATLAS | |
| 59360.42 | +67.72 | 19.46 | 0.17 | ATLAS | |
| 59361.36 | +68.66 | 19.90 | 0.24 | ATLAS | |
| 59362.37 | +69.67 | 19.68 | 0.23 | ATLAS | |
| 59363.34 | +70.64 | 19.56 | 0.14 | ATLAS | |
| 59367.30 | +74.60 | 19.60 | 0.12 | ATLAS | |
| 59371.34 | +78.64 | 19.76 | 0.16 | ATLAS | |
| 59309.46 | +16.76 | 17.51 | 0.02 | ATLAS | |
| 59313.44 | +20.74 | 17.97 | 0.02 | ATLAS | |
| 59317.48 | +24.78 | 18.45 | 0.04 | ATLAS | |
| 59321.43 | +28.73 | 18.69 | 0.04 | ATLAS | |
| 59339.46 | +46.76 | 19.55 | 0.34 | ATLAS | |
| 59343.33 | +50.63 | 19.58 | 0.10 | ATLAS | |
| 59347.35 | +54.65 | 20.04 | 0.14 | ATLAS | |
| 59369.32 | +76.62 | 20.31 | 0.20 | ATLAS | |
| 59373.32 | +80.62 | 20.87 | 0.29 | ATLAS | |
| 59377.28 | +84.58 | 21.22 | 0.26 | ATLAS |
| MJD | PhaseaaRelative to explosion (MJD 59292.7 ) | Filter | Magnitude | Uncertainty | Instrument |
|---|---|---|---|---|---|
| 59295.18 | +2.48 | 17.59 | 0.01 | DECam | |
| 59297.11 | +4.41 | 18.27 | 0.02 | DECam | |
| 59297.16 | +4.46 | 18.26 | 0.01 | DECam | |
| 59310.16 | +17.46 | 17.88 | 0.01 | DECam | |
| 59313.14 | +20.44 | 18.41 | 0.01 | DECam | |
| 59316.13 | +23.43 | 18.81 | 0.02 | DECam | |
| 59319.15 | +26.45 | 19.13 | 0.04 | DECam | |
| 59340.07 | +47.37 | 20.02 | 0.02 | DECam | |
| 59343.10 | +50.40 | 20.08 | 0.02 | DECam | |
| 59346.07 | +53.37 | 20.22 | 0.02 | DECam | |
| 59349.06 | +56.36 | 20.28 | 0.02 | DECam | |
| 59352.06 | +59.36 | 20.48 | 0.02 | DECam | |
| 59367.06 | +74.36 | 20.90 | 0.02 | DECam | |
| 59370.05 | +77.35 | 21.14 | 0.02 | DECam | |
| 59373.04 | +80.34 | 21.16 | 0.02 | DECam | |
| 59376.05 | +83.35 | 21.21 | 0.02 | DECam | |
| 59579.34 | +286.64 | 25.03 | 0.02 | DECam | |
| 59582.34 | +289.64 | 23.46 | 0.02 | DECam | |
| 59592.34 | +299.64 | 25.79 | 0.02 | DECam | |
| 59595.35 | +302.65 | 24.26 | 0.02 | DECam | |
| 59297.11 | +4.41 | 18.14 | 0.06 | DECam | |
| 59297.16 | +4.46 | 18.12 | 0.03 | DECam | |
| 59304.18 | +11.48 | 17.28 | 0.01 | DECam | |
| 59316.13 | +23.43 | 17.81 | 0.01 | DECam | |
| 59337.08 | +44.38 | 19.03 | 0.02 | DECam | |
| 59340.07 | +47.37 | 19.12 | 0.02 | DECam | |
| 59346.07 | +53.37 | 19.45 | 0.02 | DECam | |
| 59352.06 | +59.36 | 19.75 | 0.02 | DECam | |
| 59358.07 | +65.37 | 19.97 | 0.02 | DECam | |
| 59364.05 | +71.35 | 20.38 | 0.02 | DECam | |
| 59367.06 | +74.36 | 20.54 | 0.02 | DECam | |
| 59373.04 | +80.34 | 20.98 | 0.02 | DECam | |
| 59295.19 | +2.49 | 17.93 | 0.01 | DECam | |
| 59297.11 | +4.41 | 18.13 | 0.01 | DECam | |
| 59304.18 | +11.48 | 17.29 | 0.01 | DECam | |
| 59307.16 | +14.46 | 17.16 | 0.01 | DECam | |
| 59310.16 | +17.46 | 17.21 | 0.01 | DECam | |
| 59313.14 | +20.44 | 17.38 | 0.01 | DECam | |
| 59319.16 | +26.46 | 17.87 | 0.01 | DECam | |
| 59331.10 | +38.40 | 18.37 | 0.01 | DECam | |
| 59333.09 | +40.39 | 18.43 | 0.01 | DECam | |
| 59337.08 | +44.38 | 18.54 | 0.01 | DECam | |
| 59343.10 | +50.40 | 18.67 | 0.01 | DECam | |
| 59349.06 | +56.36 | 18.82 | 0.01 | DECam | |
| 59358.07 | +65.37 | 19.00 | 0.01 | DECam | |
| 59361.03 | +68.33 | 19.09 | 0.01 | DECam | |
| 59364.05 | +71.35 | 19.17 | 0.01 | DECam | |
| 59370.04 | +77.34 | 19.18 | 0.03 | DECam |
| MJD | PhaseaaRelative to explosion (MJD 59292.7 ) | Filter | Magnitude | Uncertainty | Instrument |
|---|---|---|---|---|---|
| 59376.05 | +83.35 | 19.39 | 0.01 | DECam | |
| 59571.34 | +278.64 | 22.91 | 0.36 | DECam | |
| 59582.34 | +289.64 | 22.78 | 0.20 | DECam | |
| 59588.35 | +295.65 | 22.80 | 0.34 | DECam | |
| 59297.11 | +4.41 | 18.23 | 0.05 | DECam | |
| 59307.16 | +14.46 | 17.12 | 0.02 | DECam | |
| 59331.10 | +38.40 | 17.90 | 0.02 | DECam | |
| 59333.09 | +40.39 | 17.95 | 0.02 | DECam | |
| 59293.55 | +0.85 | 17.33 | 0.22 | Swift | |
| 59293.88 | +1.18 | 17.50 | 0.25 | Swift | |
| 59294.44 | +1.74 | 17.48 | 0.25 | Swift | |
| 59295.51 | +2.81 | 17.26 | 0.21 | Swift | |
| 59296.60 | +3.90 | 17.85 | – | Swift | |
| 59298.29 | +5.59 | 17.76 | 0.34 | Swift | |
| 59302.67 | +9.97 | 17.74 | 0.34 | Swift | |
| 59303.15 | +10.45 | 16.91 | 0.17 | Swift | |
| 59308.72 | +16.02 | 17.23 | 0.22 | Swift | |
| 59313.30 | +20.60 | 17.70 | – | Swift | |
| 59317.87 | +25.17 | 17.84 | – | Swift | |
| 59325.65 | +32.95 | 17.77 | – | Swift | |
| 59414.18 | +121.48 | 17.62 | – | Swift | |
| 59293.54 | +0.84 | 17.42 | 0.14 | Swift | |
| 59293.88 | +1.18 | 17.29 | 0.12 | Swift | |
| 59294.44 | +1.74 | 17.34 | 0.13 | Swift | |
| 59295.51 | +2.81 | 17.73 | 0.18 | Swift | |
| 59296.60 | +3.90 | 18.21 | 0.28 | Swift | |
| 59298.28 | +5.58 | 18.37 | 0.33 | Swift | |
| 59302.66 | +9.96 | 17.61 | 0.17 | Swift | |
| 59303.14 | +10.44 | 17.90 | 0.22 | Swift | |
| 59308.71 | +16.01 | 17.97 | 0.23 | Swift | |
| 59313.30 | +20.60 | 18.44 | – | Swift | |
| 59317.87 | +25.17 | 18.52 | – | Swift | |
| 59325.64 | +32.94 | 18.46 | – | Swift | |
| 59414.17 | +121.47 | 18.21 | – | Swift | |
| 59293.54 | +0.84 | 17.01 | 0.06 | Swift | |
| 59293.88 | +1.18 | 17.05 | 0.06 | Swift | |
| 59294.44 | +1.74 | 17.24 | 0.07 | Swift | |
| 59295.51 | +2.81 | 17.71 | 0.09 | Swift | |
| 59296.60 | +3.90 | 18.55 | 0.18 | Swift | |
| 59298.28 | +5.58 | 18.86 | 0.23 | Swift | |
| 59302.66 | +9.96 | 18.34 | 0.16 | Swift | |
| 59303.14 | +10.44 | 18.50 | 0.18 | Swift | |
| 59308.71 | +16.01 | 18.93 | 0.25 | Swift | |
| 59313.30 | +20.60 | 19.28 | – | Swift | |
| 59317.87 | +25.17 | 19.38 | – | Swift | |
| 59325.64 | +32.94 | 19.35 | – | Swift | |
| 59414.17 | +121.47 | 19.10 | – | Swift | |
| 59293.54 | +0.84 | 17.06 | 0.05 | Swift |
| MJD | PhaseaaRelative to explosion (MJD 59292.7 ) | Filter | Magnitude | Uncertainty | Instrument |
|---|---|---|---|---|---|
| 59293.87 | +1.17 | 17.13 | 0.05 | Swift | |
| 59294.44 | +1.74 | 17.53 | 0.05 | Swift | |
| 59295.50 | +2.80 | 18.43 | 0.08 | Swift | |
| 59296.59 | +3.89 | 19.72 | 0.20 | Swift | |
| 59298.28 | +5.58 | 20.44 | – | Swift | |
| 59302.66 | +9.96 | 20.23 | 0.31 | Swift | |
| 59303.14 | +10.44 | 20.36 | 0.35 | Swift | |
| 59308.71 | +16.01 | 20.51 | – | Swift | |
| 59313.30 | +20.60 | 20.33 | – | Swift | |
| 59317.86 | +25.16 | 20.51 | – | Swift | |
| 59325.64 | +32.94 | 20.47 | – | Swift | |
| 59414.17 | +121.47 | 20.27 | – | Swift | |
| 59293.55 | +0.85 | 16.96 | 0.04 | Swift | |
| 59293.88 | +1.18 | 17.13 | 0.04 | Swift | |
| 59294.44 | +1.74 | 17.62 | 0.04 | Swift | |
| 59295.51 | +2.81 | 18.72 | 0.06 | Swift | |
| 59296.60 | +3.90 | 20.43 | 0.17 | Swift | |
| 59298.29 | +5.59 | 21.20 | 0.30 | Swift | |
| 59302.67 | +9.97 | 21.42 | – | Swift | |
| 59303.15 | +10.45 | 21.39 | – | Swift | |
| 59308.72 | +16.02 | 21.47 | – | Swift | |
| 59313.30 | +20.60 | 21.24 | – | Swift | |
| 59317.88 | +25.18 | 21.50 | – | Swift | |
| 59325.65 | +32.95 | 21.39 | – | Swift | |
| 59414.18 | +121.48 | 21.31 | – | Swift | |
| 59293.54 | +0.84 | 16.90 | 0.04 | Swift | |
| 59293.88 | +1.18 | 17.17 | 0.04 | Swift | |
| 59294.44 | +1.74 | 17.72 | 0.04 | Swift | |
| 59295.51 | +2.81 | 18.94 | 0.06 | Swift | |
| 59296.60 | +3.90 | 20.09 | 0.11 | Swift | |
| 59298.28 | +5.58 | 20.80 | 0.20 | Swift | |
| 59302.67 | +9.97 | 20.95 | 0.22 | Swift | |
| 59303.14 | +10.44 | 20.99 | 0.23 | Swift | |
| 59308.72 | +16.02 | 21.12 | 0.25 | Swift | |
| 59313.30 | +20.60 | 21.40 | – | Swift | |
| 59317.87 | +25.17 | 21.64 | – | Swift | |
| 59325.64 | +32.94 | 21.15 | 0.29 | Swift | |
| 59414.18 | +121.48 | 21.48 | – | Swift |
| MJD | PhaseaaRelative to explosion (MJD 59292.7 ) | Filter | Magnitude | Uncertainty | Instrument |
|---|---|---|---|---|---|
| 59295.30 | +2.60 | 17.59 | 0.14 | Nickel | |
| 59295.42 | +2.72 | 17.60 | 0.17 | Nickel | |
| 59295.48 | +2.78 | 17.56 | 0.23 | Nickel | |
| 59295.30 | +2.60 | 17.77 | 0.11 | Nickel | |
| 59295.42 | +2.72 | 17.79 | 0.15 | Nickel | |
| 59295.49 | +2.79 | 17.78 | 0.22 | Nickel | |
| 59306.47 | +13.77 | 17.28 | 0.15 | Nickel | |
| 59309.25 | +16.55 | 17.32 | 0.11 | Nickel | |
| 59321.36 | +28.66 | 18.39 | 0.22 | Nickel | |
| 59324.42 | +31.72 | 18.47 | 0.28 | Nickel | |
| 59295.31 | +2.61 | 17.92 | 0.13 | Nickel | |
| 59295.43 | +2.73 | 17.91 | 0.12 | Nickel | |
| 59295.49 | +2.79 | 17.91 | 0.24 | Nickel | |
| 59306.48 | +13.78 | 17.14 | 0.11 | Nickel | |
| 59309.26 | +16.56 | 17.16 | 0.12 | Nickel | |
| 59312.32 | +19.62 | 17.38 | 0.10 | Nickel | |
| 59315.42 | +22.72 | 17.71 | 0.12 | Nickel | |
| 59318.24 | +25.54 | 17.82 | 0.14 | Nickel | |
| 59321.37 | +28.67 | 18.00 | 0.17 | Nickel | |
| 59324.43 | +31.73 | 18.09 | 0.25 | Nickel |