The Diffuse Gamma-Ray Flux from Clusters of Galaxies
Abstract
The origin of the diffuse gamma-ray background (DGRB), the one that remains after subtracting all individual sources from observed gamma-ray sky, is unknown. The DGRB possibly encompasses contributions from different source populations such as star-forming galaxies, starburst galaxies, active galactic nuclei, gamma-ray bursts, or galaxy clusters. Here, we combine cosmological magnetohydrodynamical simulations of clusters of galaxies with the propagation of cosmic rays (CRs) using Monte Carlo simulations, in the redshift range , and show that the integrated gamma-ray flux from clusters can contribute up to of the DGRB flux observed by Fermi-LAT above GeV, for CRs spectral indices and energy cutoffs eV. The flux is dominated by clusters with masses and redshift . Our results also predict the potential observation of high-energy gamma rays from clusters by experiments like the High Altitude Water Cherenkov (HAWC), the Large High Altitude Air Shower Observatory (LHAASO), and potentially the upcoming Cherenkov Telescope Array (CTA).
Introduction
The DGRB provides a unique glimpse into the high-energy universe. Its inherent links with high-energy CRs and neutrinos enable investigations of the most powerful cosmic accelerators in the Cosmos. The observed energy fluxes of these three components are all comparable [1, 2, 3], suggesting that they may have a common origin. Galaxy clusters are believed to be the result of very violent processes such as the accretion and merging of smaller structures into larger ones. These processes can release large amounts of energy (about ), part of which can accelerate CRs to very-high energies [4, 5, 6]. CRs with can be confined within clusters for a time comparable to the age of the universe due to the size of these structures (of the order of Mpc) and their magnetic-field strength () [7, 4]. Therefore, clusters are unique reservoirs of CRs that can produce high-energy photons through collisions with the gas in intracluster medium (ICM), or through processes involving energetic electron–positron pairs produced as secondaries of hadronic and/or leptonic interactions. CR interactions with the cosmic microwave background (CMB) and the extragalactic background light (EBL) are also promising channels for producing high-energy gamma rays, especially for CRs with energies .
Several analytical and semi-analytical models have been employed to estimate the fluxes of gamma rays and neutrinos stemming from CR interactions in the ICM [8, 9, 10, 11, 12, 2], but in all these studies the ICM is assumed to have spherically symmetric distributions of magnetic fields and gas.
Here, we explore the production of DGRB by galaxy clusters. We adopt a more rigorous numerical approach, employing cosmological three-dimensional magnetohydrodynamic (3D-MHD) simulations [7], taking into account the non-uniform distributions of the gas density, temperature, and magnetic field, as well as their dependence on the mass and redshift of the clusters. We did not make any approximations to constrain the background density, temperature, and magnetic fields of the ICM as they are directly obtained from the simulations. This extends our previous work in which we employed a similar approach to compute the diffuse neutrino emission from these structures [13]. Our cosmological simulations indicate that the magnetic field and gas density distributions in massive clusters (with ) are larger than in the lower-mass ones, and that massive clusters () are less abundant at high redshifts [14, 15, 16, 13]. The neutrino flux from clusters obtained in ref. [13] is comparable with observations by the IceCube Neutrino Observatory [2, 17]. Most of the contribution to the total flux comes from clusters at redshift with masses .
Results
We inject CRs with minimum energy of , such that we can study gamma-ray energies down to a few . The CRs can escape more easily from the regions with lower densities and magnetic-field strengths in the outskirts of the clusters, which decreases the gamma-ray flux. In Fig. S4 of the Supplementary Material, we show the gamma-ray flux collected at the edge of individual clusters, produced by CR sources in different locations inside them. We find that the flux is one-order of magnitude larger when the source is located in the central region than in the edge of the cluster. For this reason, in order to compute the integrated contribution from all clusters in different redshifts below, we consider only the dominant contribution, i.e. from CR sources in the central region of the clusters.
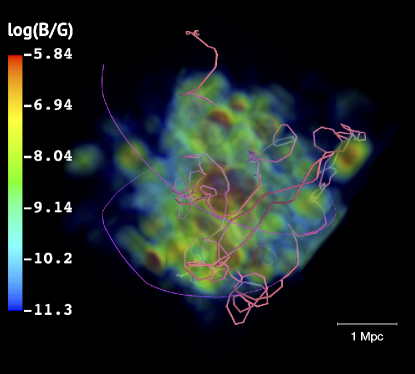
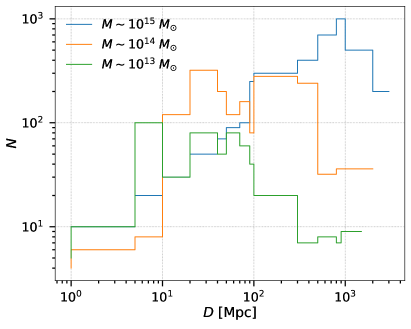
The mass range of clusters in our background simulation is and clusters with masses barely contribute to the high-energy gamma-ray flux. This occurs due to the lower interaction rate between CRs and the intracluster environment, which is a consequence of the interplay between the Larmor radius, determined by the magnetic field, and the cluster size (see Supplementary Material for a detailed discussion). Also, massive clusters () exist mostly at low redshifts , being rare at high redshifts. Therefore, the major contribution to the total flux comes from clusters in the mass range (see Fig. S5). Fig. 1 illustrates the propagation of two CRs within a cluster of our background simulation.
In Figs. 2 - 5 we present the integrated gamma-ray spectrum from all clusters for , propagated up to the Earth. The total flux () was computed as follows:
| (1) |
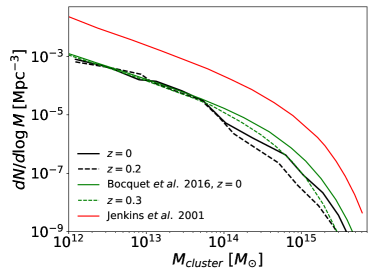
where the number of clusters per mass interval was calculated from our background simulation (see Fig. S1), accounts for the interactions of gamma rays with energy arriving with energy undergoing interactions during their propagation in the ICM and the intergalactic medium (IGM), is a function that describes the cosmological evolution of the emissivity of the CR sources (AGN, SFR, or none; see Equations E1 and E2 of the Supplementary Material), the quantity denotes the gamma-ray power computed from the simulation, is the luminosity distance, and is a factor of order unit that corrects the flux by the amount of gas that is removed from the clusters due to stellar and AGN feedback. We note that the number of clusters per mass interval we obtained from our MHD cosmological simulation at different redshifts is comparable with results from other large-scale cosmological simulations[14, 15, 16] and predictions from observations [18, 19] (see Fig. S1).
The universe is believed to be isotropic and homogeneous at very large scales. Therefore, for the propagation of gamma rays from the clusters to Earth, we assumed a nearly uniform distribution of sources in comoving coordinates.
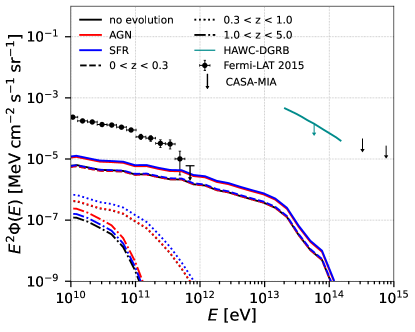
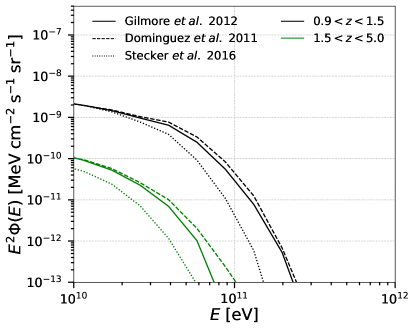
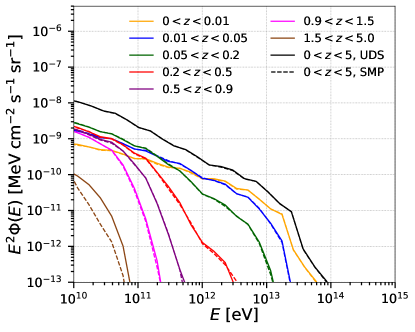
Fig. 2 depicts the total flux for different redshift intervals: , , and . A representative spectral index and a maximum energy eV are used for this evaluation (see also Figs. 3-4). The dominant contribution to the total flux of gamma rays comes from sources at low redshifts (), for which the effect of the EBL attenuation is less pronounced. This effect is more prominent at higher redshifts and also depends on the EBL model adopted [20, 21, 22] (see Fig. 3, and Fig. S7 of the Supplementary Material). Fig. 2 shows the results for the EBL model from ref. [20], which predicts a slightly larger gamma-ray cut-off energy for the flux. Also, our treatment of the pp-interactions [61, 24] is only an approximation and contains uncertainties due to the unknown pp cross-section at energies beyond the reach of the LHC [25].
Fig. 2 also highlights the effects of the evolution of the CR sources on the gamma-ray flux, distinguishing the separated contributions of AGN and SFR, following the same procedure as in refs. [26, 13]. We find that an AGN-type evolution enhances the diffuse gamma-ray flux at high redshifts () compared to scenarios wherein the sources evolve as the SFR (or without any evolution). On the other hand, these contributions are both comparable at low redshifts () which in turn, provide the dominant contribution to the total gamma-ray flux.
We further notice that the flux of gamma rays above energies eV can also be attenuated by interactions with the local optical and infrared photon fields of clusters, in addition to the EBL. Nevertheless, this effect is more dominant for sources at redshift as discussed in ref. [27]. In our case, the major contribution corresponds to sources at . Therefore, we expect that this interaction channel has likely a minor impact on our results.
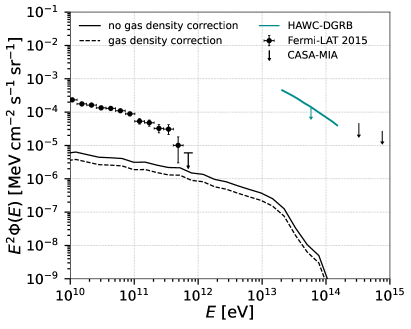
As remarked, our MHD simulations do not include radiative-cooling, or the amount of gas that is converted into stars or removed from the clusters due to stellar and AGN feedback. This implies a slight overestimation of the density in the structures, especially for clusters of mass (see refs. [28, 29]). Based on observational results [30], we have also estimated the total gamma-ray flux taking into account the expected decrease of the gas density as a function of the cluster mass. In Fig. 4 we recalculated the total diffuse gamma-ray flux (black dashed line) considering correction factors for clusters with , for , for , and for , following ref. [30]. A comparison between the dashed and solid black lines of Fig. 4 indicates a small reduction of the flux by at most a factor about .
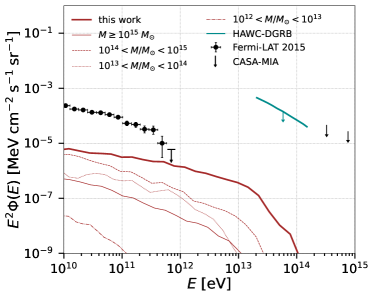
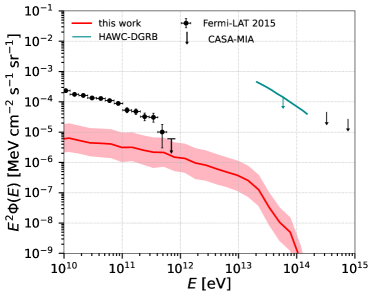
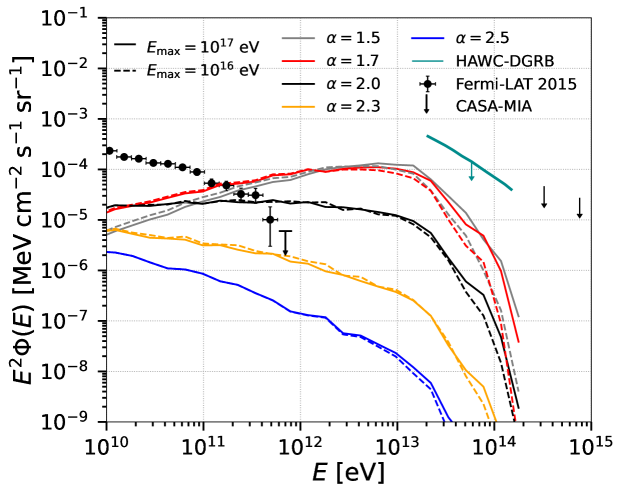
The results for different combinations of the CR cutoff energy and spectral index are presented in Fig. 5. The shaded region shows the total flux of gamma rays for all clusters from the entire redshift range , calculated for and , including feedback by AGN and SF, and CR source evolution. The observed DGRB flux by Fermi-LAT, and the upper limits obtained by the currently operating HAWC [32] and by the CASA-MIA experiment [33], are also shown. For energies greater than , our simulations indicate that galaxy clusters can contribute substantially to the DGRB measured or constrained by these experiments. This contribution amounts for up to 100% of the observed flux by Fermi-LAT, for spectral indices and maximum energy eV. This also clearly explains the apparent flatness of the spectrum up to about TeV (see also Figs. S8 and S9 of the Supplementary Material).
Discussion
The spectral indices considered here are consistent with the universal CR model [34] used by Fermi-LAT to explore the CR induced gamma-ray emission from clusters [35], and by H.E.S.S. for the Coma cluster () [36], while the range is compatible with the fact that the clusters can confine mainly CRs with energies eV [37, 13].
Note that the slope of the integrated gamma-ray flux is strongly influenced by the spectral parameters of the injected CRs. Therefore, when considering potential values for the CR spectral index, it is also important to discuss the corresponding particle acceleration mechanism(s). If CRs are accelerated by the same processes that produce ultra-high-energy CRs (UHECRs), phenomenological fits [38, 26, 39] to the UHECR data favor very hard spectra, with possible spectral indices extending as low as in some cases (for ). Such scenarios might seem surprising, at first, but there are sound explanations that include magnetic field effects, plasma instabilities, re-acceleration, magnetic reconnection, interactions in the sources, etc (see, e.g., [4, 40, 3, 41] for an overview on some of these mechanisms). Naturally, the spectral properties of CRs injected in the ICM in the PeV-EeV range do not need to be the same as the UHECRs, but it is reasonable to expect a connection. Therefore, even hard spectral indices are theoretically possible. Note that if the CRs responsible for producing the gamma rays are accelerated not by CR sources embedded in clusters but via accretion or merger shocks, for example, then softer spectra () are expected. In Fig. S8 of the Supplement Material, we show the gamma-ray flux for different combinations of the parameters .
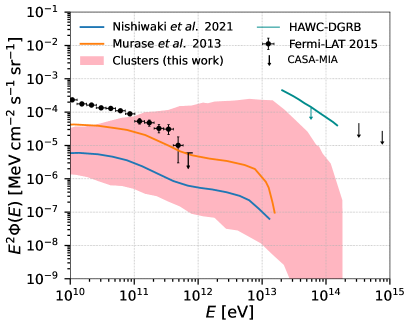
In Fig. 5, the gamma-ray flux we obtained from the entire population of clusters is also compared with the expected one from Coma-like clusters [6], and that obtained in ref. [42]. In ref. [42], they estimated the gamma-ray flux from clusters using a purely hadronuclear scenario (-interaction) claiming that these sources would contribute to the DGRB with at least , or even if the spectrum is soft (). In comparison with the estimated spectrum for Coma-like clusters[6], our gamma-ray flux is a little higher. In both studies [42, 6], besides the oversimplified ICM magnetic-field and density distributions, assumed to have radial profiles, they did not account for the contributions from clusters of mass . In Coma-like clusters [6], where masses are of the order of , the average density is , but it is for cluster masses of a few (as considered in refs. [6, 42]), and can be even larger for masses , as predicted by large scale cosmological simulations [14, 15, 16] and obtained in our own MHD simulations. Because we are considering here the entire mass range (), the density is higher by an order of magnitude, and this is the main difference between ours and these previous studies [42, 6].
Another study [43] estimated the flux using a simple relation between the gamma-ray luminosity and the cluster mass. They constrained the radio-loud cluster count from observations by the Radio Astronomy Observatory Very Large Array sky survey [18, 44] and also assumed that the radio luminosity scales linearly with the hadronic high-energy emission. Their results are also comparable with ours.
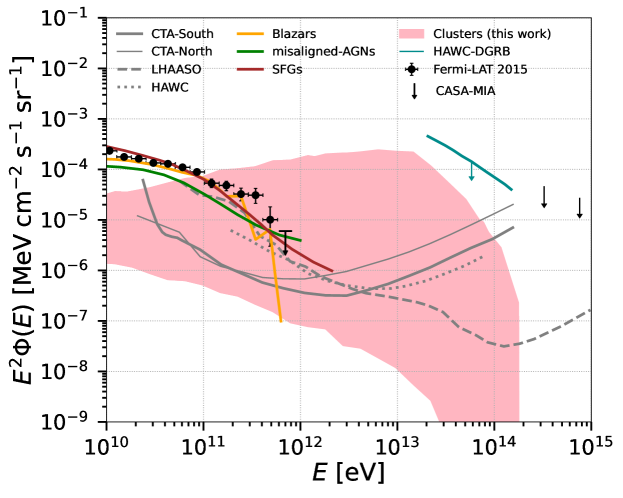
Though individual source populations such as blazars [45, 46], misaligned-AGNs [47] and star-forming galaxies (SFGs) [48] can contribute to a fairly large fraction to the DGRB for energies below TeV [49, 50] (see Fig. S9 of the Supplementary Material), our results demonstrate that the cumulative gamma-ray flux from clusters can dominate over the integrated contribution of individual classes of unresolved sources, at energies GeV. The implications of our calculations are extremely important considering that the contribution from clusters is guaranteed if high-energy CRs are present in the ICM.
As shown in Fig. 5, our results are compatible with upper limits evaluated by HAWC [32]. A similar estimate has yet to be performed by other facilities like the LHAASO [51] or the forthcoming CTA [52]. Nevertheless, considering the sensitivity curves for point sources obtained in both cases [51, 52], the gamma-ray flux we derived has likely the potential to be detected by these facilities too (see also Fig. S9 and the discussion therein).
Future more realistic MHD cosmological simulations that account directly for the CR sources distribution, evolution, and feedback [53, 55] may allow to constrain better the contribution of clusters to the DGRB. Furthermore, the effects of unknown magnetic fields of the diffuse IGM on the gamma-ray cascading may also change our results (see discussion in the Supplementary Material).
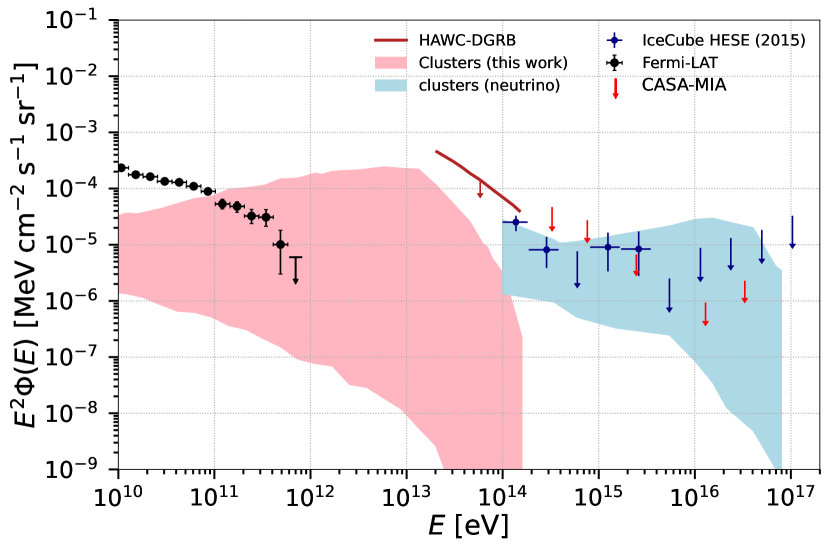
Fig. 6 summarizes our findings, together with those from ref. [13]. It shows both the high-energy gamma-ray and neutrino emission from the entire population of clusters up to redshift , assuming CR sources embedded in clusters. As we see, the neutrino flux we obtain is comparable with the diffuse neutrino background observed by IceCube for CR spectral index and maximum energy eV. A recent analysis by the IceCube Collaboration [17] found that less than of the total diffuse neutrino flux could be due to clusters. While this could, at first glance, seem in conflict with our results, we note that changes in the parameters of our analysis such as the total CR luminosity or the distribution of CR sources within the cluster could reduce our estimate. The same is true for the DGRB predictions. Therefore, the link established by Fig. 6 between the diffuse gamma-ray and the diffuse neutrino backgrounds, should be interpreted minding these caveats.
Our results were obtained through the most detailed simulations to date of three-dimensional particle transport in cosmological environments. Combined with the other known components of the DGRB, our results strongly constrain the fraction of the diffuse flux that could be ascribed to unknown components such as the elusive dark matter. Moreover, it establishes a clear connection between the fluxes of two messengers, neutrinos and gamma rays, which, combined, enables us to indirectly study CRs in clusters even if they are not directly observable.
Methods
We describe the ICM through 3D-MHD smoothed-particle-hydrodynamical (SPH) cosmological simulations employing the GADGET code [62, 63], within a sphere of radius Mpc around the Milky Way [7]. The simulations extend up to a redshift of and contain clusters with masses . We consider here seven snapshots at redshifts , , , , , , and . For clusters in this mass range, the corresponding luminosity interval is about [64]. These values are used to compute the gamma-ray fluxes shown throughout this work. The magnetic-field strength varies between and approximately, which is in reasonable agreement with the expected field strengths from observations of different clusters of galaxies [65]. Feedback from active galactic nuclei (AGN) and star formation (SF) are not directly included in these MHD cosmological simulations, but the evolution effects of these potential CR sources on the flux of gamma rays is accounted for with a redshift-dependent profile, as in refs. [13, 68, 26] (see equations E1 and E2 of the Supplementary Material). A flat CDM universe model is assumed, with the corresponding cosmological parameters given by , , , and the baryonic fraction . The maximum resolution in our SPH simulations is approximately (see refs. [13, 7] and also page 1 of the Supplementary Material for details).
We are interested in high-energy gamma rays with whose origin is more uncertain (see Fig. S9 of the Supplementary Material) and thus consider CRs with energies . The energy around eV can be achieved by primary sources inside a cluster, such as AGNs [2, 69]. For magnetic fields of , the Larmor radius of CRs with is , so that they cannot remain trapped within clusters for too long. On the other hand, CRs with lower energies remain confined, producing secondaries due to interactions with the ICM gas and the bremsstrahlung radiation, as well as with the CMB and the EBL [70, 69, 37, 13, 6].
We explore the propagation of CRs in the simulated background of clusters using the CRPropa code [71, 72]. The propagation has two steps and we assume that the CRs are predominantly composed by protons, since we expect much smaller contribution from heavier elements [12] (see page 4 of Supplementary Material). In the first step, we compute the gamma-ray flux produced by CR interactions in the clusters by considering all relevant interactions that generate both electrons and photons, namely: photopion production, Bethe-Heitler pair production, pair production, inverse Compton scattering, and proton-proton (pp) interactions. In addition, we take into account the energy losses due to the adiabatic expansion of the universe and due to synchrotron emission, although these only contribute to the electromagnetic flux at energies much lower than our energy of interest (. For more details on how CRs were propagated, see the Supplementary Materials (Figs. S2 and S3). We find that the interactions of the CRs with the cluster gas and the CMB are the dominant channels for producing the secondaries [13]. In the second step, we perform the propagation of the gamma rays collected at the boundary of the clusters to Earth. We consider the electromagnetic cascade process initiated by these gamma rays both in the ICM and in the intergalactic medium, including inverse Compton scattering, single, double, and triple pair production, with the CMB, the EBL [20], and the radio background [73] (see Fig. S3 in Supplementary Material). We did not consider the effects of intergalactic magnetic fields outside the cluster in this step, since they are highly uncertain [74] and are not expected to majorly affect the gamma-ray flux at energies above [75].
To compute the gamma-ray flux we have followed the same procedure given in ref. [13] and considered that of the cluster luminosity goes into CRs, which is consistent with Fermi-LAT predictions [35]. We only considered the contribution of CRs with energies above approximately, although we did consider the whole energy range, starting from 1 GeV, to normalize the total energy of the simulation to the cluster luminosity, as explained on page 4 in the Supplementary Material. Also, in Fig. S6 of the Supplementary Material, we compare the gamma-ray flux for different values of this luminosity fraction and the results indicate a variation much less than an order of magnitude.
Data availability
The datasets generated during and/or analysed during the current study are available from the corresponding author upon request.
Code availability
The numerical codes used to generate results that are reported in the current study are available upon request.
Acknowledgements
SH acknowledges support from the Brazilian funding agencies CNPq and FAPESP (grant 2013/10559-5). RAB is funded by “la Caixa” Foundation (ID 100010434) and European Union’s Horizon 2020 research and innovation program under the Marie Skłodowska-Curie grant agreement No 847648 (fellowship LCF/BQ/PI21/11830030); he was also supported by the grants PID2021-125331NB-I00 and CEX2020-001007-S funded by MCIN/AEI/10.13039/501100011033 and by “ERDF A way of making Europe”. EMdGDP also acknowledges support from the Brazilian agencies FAPESP (grant 2013/10559-5) and CNPq (grant 308643/2017-8). KD acknowledges support by Deutsche Forschungsgemeinschaft (DFG, German Research Foundation) under Germany’s Excellence Strategy – EXC-2094 – 390783311 and by funding for the COMPLEX project from the European Research Council (ERC) under the European Union’s Horizon 2020 research and innovation program (grant ERC-2019-AdG 882679). The numerical simulations presented here were performed in the cluster GAPAE of IAG/USP (FAPESP grant 2013/10559-5).
Author contributions
SH performed the calculations, analysis and writing of the manuscript. RAB conceived the work, helped with the Monte Carlo simulations, performed analysis and writing. EMGDP coordinated the project and performed analysis and writing. KD performed the MHD simulations.
Competing interests
The authors declare no competing interests.
References
- [1] Ahlers, M. & Halzen, F. Opening a new window onto the universe with IceCube. \JournalTitleProgress in Particle and Nuclear Physics 102, 73–88 (2018).
- [2] Fang, K. & Murase, K. Linking high-energy cosmic particles by black-hole jets embedded in large-scale structures. \JournalTitleNature Physics 14, 396–398 (2018).
- [3] Alves Batista, R. et al. Open questions in cosmic-ray research at ultrahigh energies. \JournalTitleFrontiers in Astronomy and Space Sciences 6, 23 (2019).
- [4] Brunetti, G. & Jones, T. W. Cosmic rays in galaxy clusters and their nonthermal emission. \JournalTitleInternational Journal of Modern Physics D 23, 1430007 (2014).
- [5] Bonafede, A. et al. The Coma Cluster at LOw Frequency ARray Frequencies. I. Insights into Particle Acceleration Mechanisms in the Radio Bridge. \JournalTitleAstrophysical Journal 907, 32 (2021).
- [6] Nishiwaki, K., Asano, K. & Murase, K. Particle Reacceleration by Turbulence and Radio Constraints on Multimessenger High-energy Emission from the Coma Cluster. \JournalTitleAstrophysical Journal 922, 190 (2021).
- [7] Dolag, K., Grasso, D., Springel, V. & Tkachev, I. Constrained simulations of the magnetic field in the local Universe and the propagation of ultrahigh energy cosmic rays. \JournalTitleJournal of Cosmology and Astroparticle Physics 0501, 009 (2005).
- [8] Berezinsky, V. S., Blasi, P. & Ptuskin, V. Clusters of galaxies as storage room for cosmic rays. \JournalTitleAstrophysical Journal 487, 529 (1997).
- [9] Colafrancesco, S. & Blasi, P. Clusters of galaxies and the diffuse gamma-ray background. \JournalTitleAstroparticle Physics 9, 227–246 (1998).
- [10] Rordorf, C., Grasso, D. & Dolag, K. Diffusion of ultra-high energy protons in galaxy clusters and secondary X-and gamma-ray emissions. \JournalTitleAstroparticle Physics 22, 167–181 (2004).
- [11] Blasi, P., Gabici, S. & Brunetti, G. Gamma rays from clusters of galaxies. \JournalTitleInternational Journal of Modern Physics A 22, 681–706 (2007).
- [12] Kotera, K. et al. Propagation of ultrahigh energy nuclei in clusters of galaxies: resulting composition and secondary emissions. \JournalTitleAstrophysical Journal 707, 370 (2009).
- [13] Hussain, S., Alves Batista, R., Pino, E. M. & Dolag, K. High-Energy Neutrino Production in Clusters of Galaxies. \JournalTitleMonthly Not. of the R. Astronomical Society 507, 1762–1774 (2021).
- [14] Jenkins, A. et al. The mass function of dark matter haloes. \JournalTitleMonthly Not. of the R. Astronomical Society 321, 372–384 (2001).
- [15] Rosati, P., Borgani, S. & Norman, C. The evolution of X-ray clusters of galaxies. \JournalTitleAnnual Review of Astronomy and Astrophysics 40, 539–577 (2002).
- [16] Bocquet, S., Saro, A., Dolag, K. & Mohr, J. J. Halo mass function: baryon impact, fitting formulae, and implications for cluster cosmology. \JournalTitleMonthly Not. of the R. Astronomical Society 456, 2361–2373 (2016).
- [17] Abbasi, R. et al. Searching for High-energy Neutrino Emission from Galaxy Clusters with IceCube. \JournalTitleAstrophysical Journal Letters 938, L11 (2022).
- [18] Giovannini, G., Tordi, M. & Feretti, L. Radio halo and relic candidates from the NRAO VLA Sky Survey. \JournalTitleNew Astronomy 4, 141–155 (1999).
- [19] Tinker, J. et al. Toward a halo mass function for precision cosmology: the limits of universality. \JournalTitleAstrophysical Journal 688, 709 (2008).
- [20] Gilmore, R. C., Somerville, R. S., Primack, J. R. & Domínguez, A. Semi-analytic modelling of the extragalactic background light and consequences for extragalactic gamma-ray spectra. \JournalTitleMonthly Not. of the R. Astronomical Society 422, 3189–3207 (2012).
- [21] Dominguez, A. et al. Extragalactic background light inferred from AEGIS galaxy-SED-type fractions. \JournalTitleMonthly Not. of the R. Astronomical Society 410, 2556–2578 (2011).
- [22] Stecker, F. W., Scully, S. T. & Malkan, M. A. An empirical determination of the intergalactic background light from UV to FIR wavelengths using FIR deep galaxy surveys and the gamma-ray opacity of the universe. \JournalTitleAstrophysical Journal 827, 6 (2016).
- [23] Kafexhiu, E., Aharonian, F., Taylor, A. M. & Vila, G. S. Parametrization of gamma-ray production cross sections for p p interactions in a broad proton energy range from the kinematic threshold to PeV energies. \JournalTitlePhysical Review D 90, 123014 (2014).
- [24] Kelner, S., Aharonian, F. A. & Bugayov, V. Energy spectra of gamma rays, electrons, and neutrinos produced at proton-proton interactions in the very high energy regime. \JournalTitlePhysical Review D 74, 034018 (2006).
- [25] Aaboud, M. et al. Measurement of the inelastic proton-proton cross section at tev with the ATLAS detector at the LHC. \JournalTitlePhysical Review Letters 117, 182002 (2016).
- [26] Alves Batista, R., de Almeida, R. M., Lago, B. & Kotera, K. Cosmogenic photon and neutrino fluxes in the Auger era. \JournalTitleJournal of Cosmology and Astroparticle Physics 1901, 002 (2019).
- [27] Murase, K. & Waxman, E. Constraining high-energy cosmic neutrino sources: implications and prospects. \JournalTitlePhysical Review D 94, 103006 (2016).
- [28] Fabjan, D. et al. Simulating the effect of active galactic nuclei feedback on the metal enrichment of galaxy clusters. \JournalTitleMonthly Not. of the R. Astronomical Society 401, 1670–1690 (2010).
- [29] Planelles, S. et al. On the role of AGN feedback on the thermal and chemodynamical properties of the hot intracluster medium. \JournalTitleMonthly Not. of the R. Astronomical Society 438, 195–216 (2014).
- [30] Lovisari, L., Reiprich, T. & Schellenberger, G. Scaling properties of a complete -ray selected galaxy group sample. \JournalTitleAstronomy & Astrophysics 573, A118 (2015).
- [31] Ackermann, M. et al. The spectrum of isotropic diffuse gamma-ray emission between 100 MeV and 820 GeV. \JournalTitleAstrophysical Journal 799, 86 (2015).
- [32] Harding, J. P. Constraints on the diffuse gamma-ray background with HAWC. \JournalTitlein Proc. Sci. (ICRC2017) 691 (2019).
- [33] Chantell, M. et al. Limits on the isotropic diffuse flux of ultrahigh energy radiation. \JournalTitlePhysical Review Letters 79, 1805 (1997).
- [34] Pinzke, A. & Pfrommer, C. Simulating the -ray emission from galaxy clusters: a universal cosmic ray spectrum and spatial distribution. \JournalTitleMonthly Not. of the R. Astronomical Society 409, 449–480 (2010).
- [35] Ackermann, M. et al. Search for cosmic-ray-induced gamma-ray emission in galaxy clusters. \JournalTitleAstrophysical Journal 787, 18 (2014).
- [36] Aharonian, F. et al. Constraints on the multi-TeV particle population in the Coma galaxy cluster with HESS observations. \JournalTitleAstronomy & Astrophysics 502, 437–443 (2009).
- [37] Fang, K. & Olinto, A. V. High-energy neutrinos from sources in clusters of galaxies. \JournalTitleAstrophysical Journal 828, 37 (2016).
- [38] Aab, A. & Pierre Auger Collaboration. Combined fit of spectrum and composition data as measured by the Pierre Auger Observatory. \JournalTitleJournal of Cosmology and Astroparticle Physics 04, 038 (2017).
- [39] Heinze, J., Fedynitch, A., Boncioli, D. & Winter, W. A New View on Auger Data and Cosmogenic Neutrinos in Light of Different Nuclear Disintegration and Air-shower Models. \JournalTitleAstrophysical Journal 873, 88 (2019).
- [40] Brunetti, G., Zimmer, S. & Zandanel, F. Relativistic protons in the Coma galaxy cluster: first gamma-ray constraints ever on turbulent reacceleration. \JournalTitleMonthly Not. of the R. Astronomical Society 472, 1506–1525 (2017).
- [41] Medina-Torrejón, T. E. et al. Particle Acceleration by Relativistic Magnetic Reconnection Driven by Kink Instability Turbulence in Poynting Flux–Dominated Jets. \JournalTitleAstrophysical Journal 908, 193 (2021).
- [42] Murase, K., Ahlers, M. & Lacki, B. C. Testing the hadronuclear origin of PeV neutrinos observed with IceCube. \JournalTitlePhysical Review D 88, 121301 (2013).
- [43] Zandanel, F., Tamborra, I., Gabici, S. & Ando, S. High-energy gamma-ray and neutrino backgrounds from clusters of galaxies and radio constraints. \JournalTitleAstronomy & Astrophysics 578, A32 (2015).
- [44] Cassano, R. et al. On the connection between giant radio halos and cluster mergers. \JournalTitleAstrophysical Journal Letters 721, L82 (2010).
- [45] Ajello, M. et al. The origin of the extragalactic gamma-ray background and implications for dark matter annihilation. \JournalTitleAstrophysical Journal Letters 800, L27 (2015).
- [46] de Menezes, R., D’Abrusco, R., Massaro, F. & Buson, S. The Isotropic -ray Emission above 100 GeV: Where Do Very High-energy -rays Come From? \JournalTitleAstrophysical Journal 933, 213 (2022).
- [47] Di Mauro, M., Calore, F., Donato, F., Ajello, M. & Latronico, L. Diffuse -ray emission from misaligned active galactic nuclei. \JournalTitleAstrophysical Journal 780, 161 (2013).
- [48] Roth, M. A., Krumholz, M. R., Crocker, R. M. & Celli, S. The diffuse -ray background is dominated by star-forming galaxies. \JournalTitleNature 597, 341–344 (2021).
- [49] Fornasa, M. & Sanchez-Conde, M. A. The nature of the diffuse gamma-ray background. \JournalTitlePhysics Reports 598, 1–58 (2015).
- [50] Ackermann, M. et al. Resolving the extragalactic -ray background above 50 GeV with the Fermi Large Area Telescope. \JournalTitlePhysical Review Letters 116, 151105 (2016).
- [51] Wang, X.-Y. et al. Extra-galactic gamma-ray sources. \JournalTitleChinese Physics C 46, 030003 (2022).
- [52] CTA-Consortium et al. Science with the Cherenkov Telescope Array (World Scientific, 2018).
- [53] Barai, P. & de Gouveia Dal Pino, E. M. Intermediate-mass black hole growth and feedback in dwarf galaxies at high redshifts. \JournalTitleMonthly Not. of the R. Astronomical Society 487, 5549–5563 (2019).
- [54] Ackermann, M. et al. Search for gamma-ray emission from the coma cluster with six years of fermi-lat data. \JournalTitleAstrophysical Journal 819, 149 (2016).
- [55] Hopkins, P. F. et al. First predicted cosmic ray spectra, primary-to-secondary ratios, and ionization rates from MHD galaxy formation simulations. \JournalTitleMonthly Not. of the R. Astronomical Society 516, 3470–3514 (2022).
- [56] Aartsen, M. G. et al. Evidence for astrophysical muon neutrinos from the northern sky with icecube. \JournalTitlePhysical Review Letters 115, 081102 (2015).
- [57] Inoue, S., Sigl, G., Miniati, F. & Armengaud, E. Ultrahigh energy cosmic rays as heavy nuclei from cluster accretion shocks. \JournalTitlearXiv preprint astro-ph/0701167 (2007).
- [58] Rodrígurez-Ramírez, J. C., de Gouveia Dal Pino, E. M. & Alves Batista, R. VHE Emission from Magnetic Reconnection in the Radiative-Inefficient Accretion Flow of SgrA*. \JournalTitleAstrophysical Journal 879, 6 (2019). 1904.05765.
- [59] Ahnen, M. L. et al. Deep observation of the ngc 1275 region with magic: search of diffuse -ray emission from cosmic rays in the perseus cluster. \JournalTitleAstronomy & Astrophysics 589, A33 (2016).
- [60] Alves Batista, R., de Gouveia Dal Pino, E., Dolag, K. & Hussain, S. Cosmic-ray propagation in the turbulent intergalactic medium. \JournalTitlearXiv preprint arXiv:1811.03062 (2018).
- [61] Kafexhiu, E., Aharonian, F., Taylor, A. M. & Vila, G. S. Parametrization of gamma-ray production cross sections for p p interactions in a broad proton energy range from the kinematic threshold to pev energies. \JournalTitlePhysical Review D 90, 123014 (2014).
- [62] Springel, V., Yoshida, N. & White, S. D. GADGET: a code for collisionless and gasdynamical cosmological simulations. \JournalTitleNew Astronomy 6, 79–117 (2001).
- [63] Springel, V. The cosmological simulation code GADGET-2. \JournalTitleMonthly Not. of the R. Astronomical Society 364, 1105–1134 (2005).
- [64] Schneider, P. Extragalactic Astronomy and Cosmology: An Introduction (Springer, 2014).
- [65] Böhringer, H., Chon, G. & Kronberg, P. P. The Cosmic Large-Scale Structure in -rays (CLASSIX) Cluster Survey-I. Probing galaxy cluster magnetic fields with line of sight rotation measures. \JournalTitleAstronomy & Astrophysics 596, A22 (2016).
- [66] Di Sciascio, G., Collaboration, L. et al. The lhaaso experiment: from gamma-ray astronomy to cosmic rays. \JournalTitleNuclear and Particle Physics Proceedings 279, 166–173 (2016).
- [67] Abeysekara, A. et al. Sensitivity of the high altitude water cherenkov detector to sources of multi-tev gamma rays. \JournalTitleAstroparticle Physics 50, 26–32 (2013).
- [68] Heinze, J., Boncioli, D., Bustamante, M. & Winter, W. Cosmogenic neutrinos challenge the cosmic-ray proton dip model. \JournalTitleAstrophysical Journal 825, 122 (2016).
- [69] Murase, K., Inoue, S. & Nagataki, S. Cosmic rays above the second knee from clusters of galaxies and associated high-energy neutrino emission. \JournalTitleAstrophysical Journal Letters 689, L105 (2008).
- [70] Pfrommer, C. Simulating cosmic rays in clusters of galaxies–III. Non-thermal scaling relations and comparison to observations. \JournalTitleMonthly Not. of the R. Astronomical Society 385, 1242–1256 (2008).
- [71] Alves Batista, R. et al. CRPropa 3—a public astrophysical simulation framework for propagating extraterrestrial ultra-high energy particles. \JournalTitleJournal of Cosmology and Astroparticle Physics 1605, 038 (2016).
- [72] Alves Batista, R. et al. CRPropa 3.2 - an advanced framework for high-energy particle propagation in extragalactic and galactic spaces. \JournalTitleJournal of Cosmology and Astroparticle Physics 09, 035 (2022).
- [73] Protheroe, R. & Biermann, P. A new estimate of the extragalactic radio background and implications for ultra-high-energy -ray propagation. \JournalTitleAstroparticle Physics 6, 45–54 (1996).
- [74] Vazza, F. et al. Simulations of extragalactic magnetic fields and of their observables. \JournalTitleClassical and Quantum Grav. 34, 234001 (2017).
- [75] Alves Batista, R. & Saveliev, A. The Gamma-Ray Window to Intergalactic Magnetism. \JournalTitleUniverse 7, 223 (2021).
Supplementary Material
Cosmological simulations.
To calculate the contribution of galaxy clusters to the diffuse gamma-ray background (DGRB), we employed three-dimensional cosmological MHD simulations [7] obtained with the GADGET code [62, 63]. They cover a large volume (a sphere of radius and a redshift range , and contain several clusters with masses . At , these simulations reproduce quite well the distribution of nearby clusters, including Virgo, Perseus, and Coma, which are within Mpc away from Earth approximately. The number of clusters per mass interval we obtained at different redshifts is comparable with results from other large-scale cosmological simulations [14, 15, 16] (see Fig. 7), and with predictions from observations [18, 19].
Cosmic-ray propagation in clusters.
Using the sample of individual clusters obtained from the cosmological simulations, we considered sources of high-energy cosmic rays (CRs) embedded in these structures to compute the associated gamma-ray fluxes. As explained in the Methods of the main text, we used the CRPropa code [71, 72] for these calculations considering all relevant CR interactions that generate both electrons and photons, namely: photopion production, Bethe-Heitler pair production, and proton-proton () interactions. The latter is not natively implemented in the code, so we employed an external CRPropa module described in ref. [58], which uses the cross section for interactions as parameterised in ref. [61], given by:
| (2) |
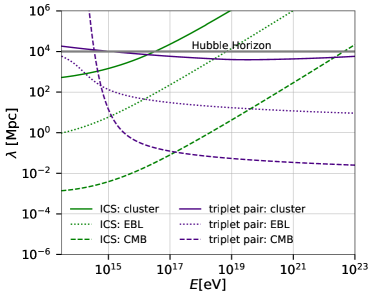
with denoting the kinetic energy for a threshold energy . Here denotes the mass of the corresponding pion, and the mass of a single proton. In addition, we have taken into account the energy losses due to the adiabatic expansion of the universe and synchrotron emission. We did not make any approximations to describe the properties of the ICM. Instead, we used the background density, temperature, and magnetic fields, directly from the MHD simulations. The temperature distribution in the clusters allowed us to derive the bremsstrahlung radiation field, which we used to extend CRPropa’s pre-computed tables of interaction rates to include interactions with the cluster environment. We also used the distributions provided in CRPropa for the other background photon fields, namely the extragalactic background light (EBL) [21, 20, 22] and the cosmic microwave background (CMB). The mean free paths (MFPs) for a CR undergoing the aforementioned processes are shown in Fig. 8, left panel. For reference, we also show the expected trajectory length of CRs propagating in individual clusters with different masses (Fig. 8, right panel).

Magnetic confinement of CRs.
The transport of CRs inside clusters is highly dependent on their masses. The more massive clusters can confine CRs of higher energy for a time longer than the less massive (and smaller) ones. This is consistent with the increase of the particle’s Larmor radius with energy while moving inside the cluster. As the cluster mass increases, the transport of CRs changes from diffusive to semi-diffusive or ballistic. This regime change depends on the diffusion coefficient which, in the simplest case, is , wherein is the displacement and the time. Considering a typical size of 1 Mpc and assuming the cluster to exist roughly for a time comparable to the age of the universe, it is possible to obtain an order-of-magnitude estimate of the diffusion coefficient associated to CR confinement/escape, which is . Comparing this with the Larmor radius of CRs with energy , we conclude that in the central regions of the cluster () propagation is diffusion-dominated, whereas in the outskirts CRs can escape the environment. Moreover, high-energy CRs ( eV) propagate (quasi-)balistically. These results agree with those obtained from a simple estimate of the confinement time of a CR, which can be obtained from the trajectory length (): , wherein denotes the speed of light. Note that this is comparable with the diffusive escape time found in other works [57, 60]. For instance, the acceleration time of a CR up to about eV in a magnetic field of the order of G for a shock in a cluster is of the order of Gyr [37], which is comparable with the diffusive escape time from the acceleration region [57].
Gamma-ray and electron propagation in clusters.
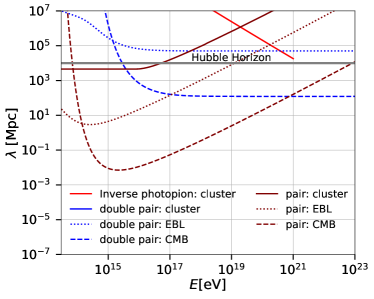
Electrons and photons produced through the processes described in the previous paragraph also undergo interactions, namely: pair production, inverse Compton scattering, double pair production, and triplet pair production. These interactions were taken into account assuming the omnipresent cosmological backgrounds (CMB and EBL), in addition to the ICM photon field due to the bremsstrahlung. The MFPs for these processes are shown in Fig. 9 for both electrons (left panel) and photons (right panel). Note that high-energy photons can, in principle, interact with the gas pervading the ICM, which could lead to “inverse photopion production”. Nevertheless, this channel of interaction is small, as shown on the right panel of Fig. 9, so it was thus neglected.
The effects of CR source evolution.
The evolutionary history of galaxy clusters implies a constantly changing ICM which, in turn, affects the propagation of CRs and its subsequent gamma-ray emission. For this reason, we have considered a few different scenarios for the evolution of the CR sources embedded in the cluster. This is parametrised through a redshift-dependent function . For CR sources following the star-formation rate (SFR), we employ the following expression [68, 26]:
| (3) |
Assuming the CR source emissivity is driven by AGNs, the parametrization reads [68, 26]:
| (4) |
Here and are normalization constants in Equations (4) and (3), respectively.
The effect of star formation and AGN feedback.
Our simulations are non-radiative and do not include the feedback by active galactic nuclei (AGNs) or star formation, which could reduce the gas density of the clusters and consequently, the gamma-ray flux. To investigate the relevance of these effects to our calculations we followed ref. [30], which evaluates how a density reduction factor (Equation in the main text) can be empirically constrained by observations of different clusters. We find that both effects above produce only minor modifications in the total flux, as shown in Figs. 2 and 5 of the main text.
The CR injection spectrum.
The injection spectrum of CRs () is defined as:
| (5) |
wherein is the spectral index, is the maximum rigidity attainable by the CRs, and is the atomic number of the CR nucleus ( here). To obtain the normalization constant, , we impose that the total CR energy must be a given fraction () of the cluster energy, i.e.:
| (6) |
where refers to the total energy of the cluster corresponding to a luminosity . Here the minimum and maximum energies, and , are essentially the rest mass of the CR and the maximum energy a CR could reach according to the model, respectively. The later, in particular, was conservatively chosen to be because already at much lower energies (about ) CRs can escape clusters without effectively interacting with the ICM.
A note on the composition of the CRs.
We assumed only proton composition of CRs, because we expect a much smaller contribution from heavier elements (see, e.g., [12]), especially if they are produced in large-scale shocks. If there are heavier nuclei in clusters, they should be subdominant with respect to protons because CR acceleration depends on rigidity (energy over charge). Nevertheless, CR sources within clusters such as starburst galaxies have high supernova rates, and compact objects such as magnetars wherein heavier energetic CRs can be accelerated, such that the gamma-ray flux may change. It is also worth mentioning that gamma rays (and neutrinos) in general tend to be produced more through processes involving protons than nuclei. This is because hadronic gamma rays are created mostly through the decay of pions, and in the case of heavier CR nuclei, photodisintegration tends to dominate over pion-producing mechanisms. Furthermore, photons produced, for instance, by electron/positrons generated via nuclear beta decays (in the photodisintegration chain, for example) are generally not sufficient to lead to appreciable fluxes of high-energy photons.
The injected energy range of CRs is , which leads to a peak of the integrated gamma-ray flux at energies around GeV as shown in Figs. 2 and 4 of the main text (see also Fig. 13).
The gamma-ray flux from individual clusters.
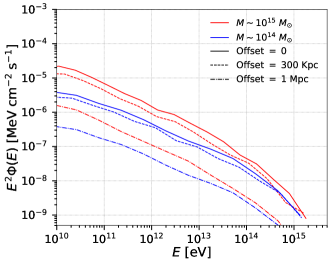
Our analysis involve computing first the gamma-ray flux emitted by individual clusters. This is shown in Fig. 10 for masses and . The figure also shows the dependence of the photon flux on the position of the CR sources inside the clusters. As expected, the photon production rate is smaller when the source is located farther away from the centre. Note that the central regions of clusters are more densely populated than the outskirts. Therefore, it is a reasonable approximation to consider all CR sources inside clusters to be at their centres, since the contribution of marginal sources is lower by nearly a ten-fold, as shown in Fig. 10. This implies that even under these assumptions the total gamma-ray flux would be overestimated by less than an order of magnitude.
A sanity check for our calculations is to compare the results for a few individual clusters selected from our simulations with observations. Fermi-LAT [35], for instance, obtained upper limits for the emission from three Abell clusters, A400, A1367, and A3112. At , the most stringent amongst these limits is . Although Fig. 10 is for the flux at the edge of the cluster, without intergalactic propagation, its total gamma-ray energy is , which is much less than the total energy inferred from observations, , considering the cluster A400, distant approximately from Earth. There is also a geometrical correction factor due to the fact that the simulated flux is divided by a solid angle, but this should not exceed one order of magnitude in the most conservative case. Therefore, this simple ballpark estimate confirms that our gamma-ray estimates for individual clusters are safely compatible with present-day observational constraints [35, 59, 54].
The integrated gamma-ray flux from different cluster mass ranges.
In Fig. 11, we present the dependence of the gamma-ray flux on the mass of the clusters. The major contribution comes from clusters in the mass range .
The CR luminosity.
Throughout this work, in order to compute the gamma-ray flux, we have considered that of the luminosity of a cluster goes into CRs, which is consistent with estimates from observations (see e.g. refs. [35, 34]), as stressed in the main text. However, to illustrate the relevance of this parameter, in Fig. 12, we show the gamma-ray flux spanning a range of values of this fraction, namely, of the luminosity of the clusters going into CRs. The results indicate that the variation is not substantial, i.e., it is at most of one order of magnitude, which is compatible with the linear dependence between flux and luminosity.
Integrated gamma-ray flux for different redshift intervals.
As indicated in Fig. 2 of the main text, the major contribution to the integrated flux comes from CR sources at low redshifts , whose flux is less attenuated by interactions with the EBL. This suggests that the resulting spectral hardening is due to this low redshift contribution mostly. This result is reassured by Fig. 13, which shows the gamma-ray flux for all redshift intervals, and is complementary to Fig. 2 of the main text.
Integrated gamma-ray flux for different CR spectral parameters.
In Fig. 14 we show the gamma-ray flux for different combinations of the parameters of the CRs. The choice of this parametric range is discussed in detail in the main text.
Integrated gamma-ray flux for entire parametric space.
As stressed previously, the CRs are injected with a minimum energy of GeV, and our analysis of the gamma-ray flux produced by them in the clusters extends down to GeV approximately. In any case, our main interest is the contribution of the clusters to the higher energies of the DGRB, whose origin is more uncertain, less constrained and, in principle, not explained by point sources or individual source populations, as shown in Fig. 15. We have also plotted in this figure point-like sensitivity curves of different gamma-ray observatories, which were rescaled by an appropriate angular factor. This is meant to be a reference only. There are experimental difficulties in measuring an all-sky flux with Cherenkov telescopes with relatively small fields of view such as CTA. The message intended is: if CTA could scan the whole sky and measure a diffuse flux of gamma rays, then the ideal curve obtained by a direct scaling of the point-source sensitivity would be the one shown. In fact, this figure evidences that the major contribution to the DGRB below about GeV most probably comes from individual sources [50] such as blazars [45], AGNs [47], and SFGs [48]. But for energies greater than GeV, our simulations indicate that galaxy clusters can also contribute substantially to the DGRB. This contribution could amount to up to observed flux by Fermi-LAT, for spectral indices and maximum energies eV.
Remarks on the interpretation of the results.
Our goal in this work was not to fit the data observed by Fermi-LAT. Instead, we calculated the high-energy gamma-ray flux that can be produced by the entire galaxy cluster population, considering a reasonable set of free parameters, and performing the most detailed treatment so far employing 3D simulations (in contrast, many studies until now adopted a semi-analytic approach and/or simplified 1D calculations). Uncertainties in such determinations are always expected. The question is whether they lead to order-of-magnitude changes in the results. To answer this question, we explored the parametric space of the potentially most influential quantities, i.e., we considered a fiducial range of the CR spectral parameters, which are all compatible with theoretical/observational expectations. Moreover, we employed a detailed treatment of intergalactic gamma-ray propagation, including EBL uncertainties (see Fig. 3 of the main text). Fermi observations and upper limits obtained from HAWC and CASA-MIA for the DGRB, depicted in Fig. 5 of the main text, and Fig. 14, clearly put constraints on the parametric space we swept. Our results turn out to be compatible with these constraints for spectral indices , considering our fiducial parameters. Therefore, though uncertainties remain, such as the determination of the effects of the still-unknown magnetic fields of the diffuse IGM on the gamma-ray cascading after emerging from individual clusters (as described in the main text), we believe we have covered most of the fundamental parametric space, thus constraining the uncertainties in the flux to less than one order of magnitude.