The resolved chemical abundance properties within the interstellar medium of star-forming galaxies at
1Cosmic Dawn Center (DAWN)
2DTU-Space, Technical University of Denmark, Elektrovej 327, DK-2800 Kgs. Lyngby, Denmark
3Centre for Extragalactic Astronomy, Department of Physics, Durham University, South Road, Durham, DH1 3LE UK
4Max-Planck-Institut für Astronomie, Königstuhl 17, D-69117, Heidelberg, Germany
5International Centre for Radio Astronomy Research, University of Western Australia, 35 Stirling Highway, Crawley, WA, Australia
6School of Mathematics, Statistics and Physics, Newcastle University, Newcastle upon Tyne NE1 7RU, UK
7Kavli Institute for Astronomy and Astrophysics, Peking University, Beijing 100871, China
8Centre for Advanced Instrumentation, Department of Physics, Durham University, South Road, Durham DH1 3LE UK
9Institute for Computational Cosmology, Department of Physics, Durham University, South Road, Durham DH1 3LE UK
10European Southern Observatory, Karl-Schwarzschild-Str 2, D-86748 Garching b. München, Germany
11Instituto de Física y Astronomía, Universidad de Valparaíso, Avda. Gran Bretaña 1111, Valparaíso, Chile
12Australian Research Council Centre of Excellence for All-Sky Astrophysics, 44 Rosehill Street Redfern, NSW 2016, Australia
Abstract
We exploit the unprecedented depth of integral field data from the KMOS Ultra-deep Rotational Velocity Survey (KURVS) to analyse the strong (H) and forbidden ([Nii], [Sii]) emission line ratios in 22 main-sequence galaxies at . Using the [Nii]/H emission-line ratio we confirm the presence of the stellar mass – gas-phase metallicity relation at this epoch, with galaxies exhibiting on average 0.13 0.04 dex lower gas-phase metallicity (12+log(O/H)M13 = 8.40 0.03) for a given stellar mass (([] = 10.1 0.1) than local main-sequence galaxies. We determine the galaxy-integrated [Sii] doublet ratio, with a median value of [Sii]6716/6731 = 1.26 0.14 equivalent to an electron density of log10([cm-3]) = 1.95 0.12. Utilising CANDELS HST multi-band imaging we define the pixel surface-mass and star-formation rate density in each galaxy and spatially resolve the fundamental metallicity relation at , finding an evolution of 0.05 0.01 dex compared to the local relation. We quantify the intrinsic gas-phase metallicity gradient within the galaxies using the [Nii]/H calibration, finding a median annuli-based gradient of Z/R = 0.015 0.005 dex kpc-1. Finally we examine the azimuthal variations in gas-phase metallicity, which show a negative correlation with the galaxy integrated star-formation rate surface density ( = 0.40, = 0.07) but no connection to the galaxies kinematic or morphological properties nor radial variations in stellar mass surface density or star formation rate surface density. This suggests both the radial and azimuthal variations in interstellar medium properties are connected to the galaxy integrated density of recent star formation.
keywords:
galaxies:abundances – galaxies:high-redshift – galaxies:ISM1 Introduction
The rest-frame optical morphology of main-sequence star-forming galaxies has evolved over cosmic time. From a clumpy, irregular high-redshift () population to the grand-design Hubble-type galaxies seen in the local Universe (e.g. Glazebrook et al., 1995; Abraham et al., 1996; Ilbert et al., 2010; Conselice, 2014; Sachdeva et al., 2019). This evolution has been defined in terms of the galaxy’s fundamental properties (e.g. star-formation rate, gas fraction, angular momentum and chemical abundance) with high-redshift galaxies exhibiting higher star-formation rates and gas fractions whilst having lower angular momentum and gas-phase metallicity at fixed stellar mass (e.g. Förster Schreiber et al., 2009; Whitaker et al., 2012; Tacconi et al., 2013; Swinbank et al., 2017; Gillman et al., 2021). Constraining the physical properties of the interstellar medium, and the role of the evolving baryon cycle, in high-redshift main-sequence galaxies is vital in order to fully explain the nature of these differences (see Maiolino & Mannucci, 2019; Tacconi et al., 2020; Förster Schreiber & Wuyts, 2020, for full reviews).
Observational studies have shown that the empirical scaling relations present in the local Universe that interconnect a galaxy’s fundamental properties are in place at high-redshift, but with variable normalisation and or intrinsic scatter (e.g. the star-formation main-sequence; Whitaker et al. 2012; Schreiber et al. 2015, angular momentum stellar mass relation; Burkert et al. 2016; Harrison et al. 2017, Tully-Fisher relation; Übler et al. 2017; Tiley et al. 2019). In particular the gas-phase metallicity stellar mass relation (MZR) has been observed up to a redshift of , with a normalisation that decreases with increasing redshift, at fixed stellar mass (e.g. Mannucci et al., 2010; Yabe et al., 2015; Steidel et al., 2014; Wuyts et al., 2016; Kashino et al., 2017; Sanders et al., 2020; Gillman et al., 2021).
The gas-phase metallicity of the interstellar medium in distant galaxies is quantified using strong-line calibrations of rest-frame optical emission lines (e.g. Pettini & Pagel, 2004; Kewley & Ellison, 2008; Marino et al., 2013; Dopita et al., 2016; Poetrodjojo et al., 2021). By using these locally derived calibrations, that convert an emission-line ratio (e.g. [Nii]/H, O3N2, R23) to an Oxygen abundance (12+(O/H)), the gas-phase metallicity in distant galaxies can be constrained. The decrease in normalisation of the MZR at higher redshifts is attributed to the higher star-formation rates and increased metal-poor gas inflows at earlier cosmic times as well as evolution in the outflow strength, gas fraction and star-formation efficiency of galaxies (e.g. Lilly et al., 2013; Lian et al., 2018; Sanders et al., 2020). Tracing the distribution of metallicity in galaxies across cosmic time provides empirical constraints for theoretical models aimed at describing the complex interplay between star formation, gas flows and feedback processes that drive a galaxy’s evolution (e.g. Trayford & Schaye, 2019; Belfiore et al., 2019; Sharda et al., 2021a; Yates et al., 2021).
However, a number of physical parameters appear to determine the strong optical emission-line fluxes produced in Hii regions. These include the chemical abundance of the gas but also the shape and normalisation of the ionising spectrum, the ionisation state of the gas and the gas density (e.g. Dopita & Evans, 1986; Kewley & Dopita, 2002; Dopita et al., 2006a, b; Kewley et al., 2019a; Kumari et al., 2021; Ji & Yan, 2021; Curti et al., 2021; Helton et al., 2022). These strong-line calibrations assume that the interstellar medium conditions at high-redshift are similar to those found in local galaxies, such that the variation in emission-line ratios is driven purely by changes in the chemical abundance (e.g. Bian et al., 2018; Bian et al., 2020; Hayden-Pawson et al., 2021). By defining the fundamental properties of the interstellar medium in distant galaxies, we can begin to constrain the origin of the variation in emission-line ratios.
In the local Universe spatially-resolved studies of galaxies have identified negative metallicity gradients in star-forming galaxies (e.g. Sánchez et al., 2014; Belfiore et al., 2017; Lutz et al., 2021) as well as the presence of the resolved mass - metallicity relation on sub-kpc scales (e.g. Barrera-Ballesteros et al., 2016; Erroz-Ferrer et al., 2019; Sánchez, 2020; Neumann et al., 2021). The secular evolution of local galaxies is well prescribed by ‘inside-out’ models of galaxy evolution that explain the higher metallicity in the central regions (e.g. Nelson et al., 2012).
In addition to robust measures of the chemical abundance properties, constraining the emission-line ratios of faint forbidden emission-lines (e.g. [Nii], [Sii]) in galaxies enables constraints on other interstellar medium properties such as electron density (e.g. Dopita et al., 2016; Maiolino & Mannucci, 2019; Kewley et al., 2019a, b). In distant galaxies however, measuring even integrated properties of faint emission-lines is challenging due to the low-surface brightness and signal to noise (S/N). Previous studies have overcome these issues by stacking galaxy spectra in order to measure sample averaged emission-line properties (e.g. Swinbank et al., 2019; Förster Schreiber et al., 2019; Davies et al., 2021; Henry et al., 2021) or utilised either space-based low-resolution grism spectroscopy (e.g. Jones et al., 2015; Wang et al., 2020; Simons et al., 2020; Backhaus et al., 2021) or gravitationally lensed galaxies (e.g. Curti et al., 2020b; Patrício et al., 2019; Florian et al., 2020; Hayden-Pawson et al., 2021).
To define the interstellar medium properties of high-redshift galaxies and establish whether the global scaling relations (e.g. mass – metallicity, star-formation rate main – sequence) originate from localised relations within individual galaxy’s requires us to go beyond stacks and even integrated emission-line ratios for individual distant galaxies. To this end, in this paper we present an analysis of the chemical abundance properties of the interstellar medium, using a variety of metallicity indicators, in 22 galaxies from the KMOS Ultra-deep Rotational Velocity Survey (KURVS; Puglisi et al. in preparation, hereafter P22) each observed for 70 hours on source with KMOS.
In Section 2 we present the observations and the main-sequence properties of KURVS galaxies. We then define the gas-phase metallicity properties and emission-line ratios in Section 3.1 before quantifying the electron density in Section 3.2. In Section 3.3.1 we derive the resolved fundamental metallicity relation before finally in section 3.3.2 quantifying the radial profiles of metallicity and electron density before giving our conclusions in Section 4.
A Nine-Year Wilkinson Microwave Anisotropy Probe (Hinshaw et al., 2013) cosmology is used throughout this work with = 0.721, = 0.279 and H0 = 70 km s-1 Mpc-1. In this cosmology a spatial resolution of 0.57 arcsecond (the median FWHM of the seeing in our data) corresponds to a physical scale of 4.9 kpc at a redshift of . All quoted magnitudes are on the AB system and stellar masses are calculated assuming a Chabrier initial mass function (IMF) (Chabrier, 2003).
| ID | RA(∘) | DEC(∘) | [M⊙] | SFR [M⊙yr-1] | Rh [kpc]c | [Nii]/Hd | [Sii]/He | [Nii]/[Sii]f | [Sii] | |
|---|---|---|---|---|---|---|---|---|---|---|
| KURVS 1 | 53.0723 | -27.8980 | 1.3591 | 9.76 | 30 1 | 1.08 0.05 | 0.24 0.01 | 0.11 0.01 | 2.18 0.19 | 0.97 0.12 |
| KURVS 2 | 53.0625 | -27.8840 | 1.3599 | 9.88 | 3 0 | 8.04 0.38 | 0.09 0.01 | |||
| KURVS 3 | 53.0921 | -27.8792 | 1.5411 | 10.64 | 11 2 | 4.20 0.08 | 0.36 0.02 | 0.16 0.02 | 2.22 0.30 | 1.53 0.21 |
| KURVS 4 | 53.0841 | -27.8773 | 1.5525 | 10.34 | 20 1 | 3.81 0.07 | 0.34 0.02 | 0.12 0.02 | 2.73 0.55 | 1.04 0.23 |
| KURVS 5 | 53.0574 | -27.8674 | 1.5183 | 10.12 | 13 1 | 3.17 0.04 | 0.17 0.02 | 0.24 0.02 | 0.70 0.09 | 0.48 0.08 |
| KURVS 6 | 53.0585 | -27.8568 | 1.2213 | 10.61 | 6 1 | 2.90 0.04 | 0.48 0.04 | 0.22 0.04 | 2.14 0.47 | 1.31 0.27 |
| KURVS 7 | 53.0468 | -27.8520 | 1.5183 | 10.24 | 6 0 | 4.51 0.08 | 0.19 0.02 | |||
| KURVS 8 | 53.0285 | -27.8487 | 1.5394 | 9.58 | 7 1 | 2.50 0.19 | 0.06† | 0.11 0.03 | 0.61 0.27 | 1.72 0.51 |
| KURVS 9 | 53.0897 | -27.8446 | 1.5402 | 10.12 | 3 0 | 5.03 0.08 | 0.22 0.02 | 0.12 0.02 | 1.81 0.40 | 1.77 0.35 |
| KURVS 10 | 53.1247 | -27.8422 | 1.3899 | 9.89 | 3 0 | 1.90 0.05 | 0.09 0.01 | 0.12 0.01 | 0.79 0.15 | 1.00 0.16 |
| KURVS 11 | 53.1418 | -27.8413 | 1.3837 | 10.68 | 65 3 | 5.94 0.03 | 0.22 0.01 | 0.07 0.01 | 3.11 0.31 | 2.47 0.25 |
| KURVS 12 | 53.1314 | -27.8413 | 1.6130 | 11.52 | 19 2 | 6.52 0.07 | 0.64 0.02 | 0.14 0.02 | 4.69 0.83 | 0.71 0.20 |
| KURVS 13 | 53.0521 | -27.8391 | 1.3338 | 9.62 | 14 1 | 3.41 0.04 | 0.12 0.02 | 0.08 0.02 | 1.54 1.09 | 1.72 0.52 |
| KURVS 14 | 53.1557 | -27.8371 | 1.3893 | 9.68 | 11 0 | 2.55 0.04 | 0.15 0.01 | 0.09 0.01 | 1.60 0.15 | 1.28 0.13 |
| KURVS 15 | 53.0706 | -27.8345 | 1.6134 | 10.07 | 28 1 | 3.75 0.05 | 0.17 0.01 | 0.13 0.01 | 1.27 0.07 | 1.18 0.07 |
| KURVS 16 | 53.1546 | -27.8280 | 1.5691 | 10.16 | 18 1 | 3.93 0.04 | 0.21 0.01 | 0.13 0.01 | 1.66 0.15 | 1.26 0.12 |
| KURVS 17 | 53.0463 | -27.8273 | 1.3528 | 9.55 | 7 0 | 2.43 0.04 | 0.07 0.01 | 0.17 0.01 | 0.43 0.06 | 0.58 0.07 |
| KURVS 18 | 53.1360 | -27.8135 | 1.3416 | 9.82 | 6 0 | 3.21 0.07 | 0.09 0.01 | 0.08 0.01 | 1.11 0.30 | 2.01 0.40 |
| KURVS 19 | 53.0825 | -27.8109 | 1.3573 | 10.23 | 9 0 | 2.07 0.03 | 0.15 0.01 | |||
| KURVS 20 | 53.1043 | -27.7884 | 1.3563 | 10.02 | 21 1 | 1.20 0.02 | 0.23 0.03 | 0.14 0.03 | 1.64 0.48 | 1.12 0.30 |
| KURVS 21 | 53.1310 | -27.8604 | 1.3822 | 10.17 | 15 1 | 2.85 0.05 | 0.17 0.01 | 0.12 0.01 | 1.46 0.15 | 1.40 0.14 |
| KURVS 22 | 53.1572 | -27.8334 | 1.6180 | 11.12 | 32 1 | 4.10 0.04 | 0.61 0.01 | 0.08 0.01 | 7.46 1.03 | 1.81 0.27 |
a) Homogeneous uncertainty of 0.2 dex to account for the uncertainties in magphys derived stellar mass (Mobasher
et al., 2015).
b) H SFR corrected for extinction
c) 1.6m half-light radius
d) [Nii]6584 / H
e) [Sii]6717+6731 / H
f) [Nii]6584 / [Sii]6717+6731
AGN candidate (see Section 2.2)
= upper limit on [Nii]
= S/N [Sii]2
2 Observations, Sample Galaxy Integrated Properties
The 44 galaxies in the KURVS sample (see P22) are -band selected main-sequence galaxies in the redshift range with existing H detections (F). In this paper we concentrate on the first half of the sample (KURVS-CDFS), which comprises sources in the CDFS field for which observations are complete.
The majority of galaxies (20/22) have previously been observed as part of the KMOS Galaxy Evolution Survey (KGES; Gillman et al., 2019; Tiley et al., 2021) with two galaxies (KURVS 21 and 22) selected from the KMOS3D survey (Wisnioski et al., 2019). The KURVS galaxies lie within the Cosmic Assembly Near-infrared Deep Extragalactic Legacy Survey (CANDELS; Grogin et al., 2011) HST fields. For each galaxy there is a wealth of ancillary multi-wavelength imaging data from the ultraviolet to mid-infrared from which we can construct the spectral energy distribution (SED) of the each galaxy. In this section we define the KMOS observations and quantify the main-sequence properties of the KURVS galaxies.
2.1 KMOS Observations
All the galaxies in the KURVS sample were observed using KMOS, a multi-object spectrograph mounted on the Nasmyth focus of the 8-m class UT1 telescope at the VLT, Chile. The spectrograph has 24 individual integral-field units that patrol a 7.2 arcmin diameter field, each with a 2.8 × 2.8 arcsec2 field of view and 0.2 × 0.2 arcsec2 spaxels.
The KMOS observations cover the rest-frame near-infrared -band spectrum from 1.45 – 1.87m and equating to 70h on-source per galaxy taken between October 2018 - December 2019. The average full width half maximum (FWHM) of the seeing of the observations is 0.57 arcseconds, as determined from the dedicated PSF star frames in the KMOS mask. Full details of the observations and data reduction are discussed in P22. In brief, the data were reduced using the European Southern Observatory (ESO) Recipe Execution Tool (ESO CPL Development Team, 2015) which extracts, wavelength calibrates and flat fields each of the spectra and forms a data cube from each observation.
In addition to the KURVS sample, throughout this paper we include observations from the KGES parent sample from which the KURVS galaxies were selected. The KGES survey is a KMOS large program of 288 band selected star-forming galaxies at . Of those with H detections (243/288) the median stellar mass and dust-corrected H star-formation rate is ([]) = 10.1 0.1, SFRHα[M⊙yr-1] = 17 2 respectively. The emission-line ratios of the KGES galaxies (see Gillman et al., 2021) used throughout this paper are derived using consistent methodology to our analysis of the KURVS sample.
For our parent sample comparison analysis, we select galaxies from the KGES survey with a galaxy-integrated [Nii] and [Sii] S/N3 to ensure robust measurements of their integrated gas-phase metallicity and electron density. In total the KGES sample used in this paper comprises of 71 galaxies with a medium redshift (and bootstrapped uncertainty) of = 1.48 0.01. The KGES sub-sample comprises of main-sequence galaxies with a median stellar mass of ([]) = 10.1 0.1 and H-derived extinction-corrected star-formation rate of SFRHα[M⊙yr-1] = 23 3, comparable to the full KGES H detected sample, with a preference towards higher star-formation rate galaxies, by selection.
2.2 Galaxy Spectra AGN Identification
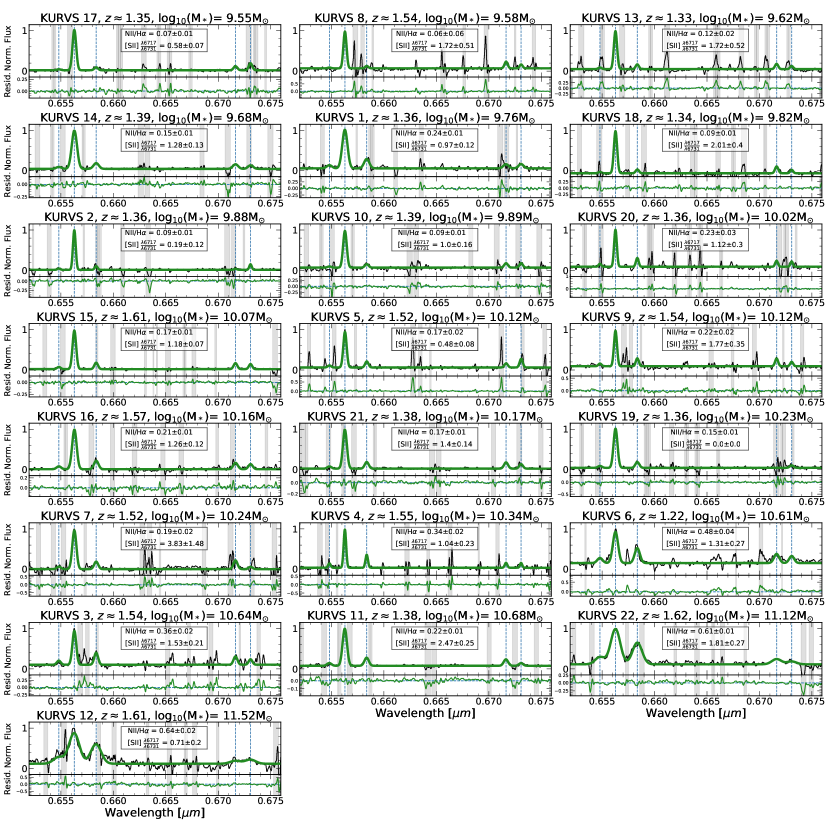
At the rest-frame optical nebula emission lines (e.g H, [Nii], and [Sii]) are redshifted into the near-infrared -band probed by KMOS. These emission lines, alongside a number of atmospheric OH airglow emission lines, are visible in the KMOS spectra. In Figure 1 we show the integrated spectra for the 22 galaxies in the KURVS sample, ranked by their stellar mass. We highlight (in grey) the strong OH emission lines present in each spectrum, and overlay a Gaussian profile fit (in green) to the H, [Nii], and [Sii] emission lines as well as showing the residuals. Each data cube has been de-redshifted and the velocity field removed. The integrated spectrum is a sum of the spaxels resolved in the H velocity map of the galaxy, as discussed in Section 3.1.
Figure 1 demonstrates the presence of the stellar mass – metallicity relation in the KURVS sample, with the increasing presence of forbidden emission lines with increasing stellar mass. It is important to understand whether the emission lines shown in Figure 1 originate from star formation or active galactic nuclei (AGN). The presence of an AGN would enhance the emission-line ratios of a galaxy and thus make them a unreliable tracer of the galaxies metallicity.
To determine the presence of AGN in the KURVS sample, we first utilise the AGN identification scheme employed by Tiley et al. (2021) for the full KGES sample. In short AGN are identified in our sample by criteria placed on their integrated [Nii]/H ratio, emission-line width and infrared colours following the Donley et al. (2012) and Stern et al. (2012) colour selection (see Tiley et al. (2021) for full details). We also exclude galaxies with bright X-ray counterparts by cross-matching our sample with the CDFS 7 Ms Source Catalog (Luo et al., 2017).
Of the 22 galaxies in the KURVS sample, we identify two candidates where an AGN may influence the line ratios. KURVS 11 and KURVS 12 have 111The All WISE Source Catalog (Cutri et al., 2013) colour W1[3.6]W2[4.5]0.8, whilst KURVS 12 is also highlighted in the Luo et al. (2017) catalogue as an AGN candidate with an intrinsic 0.5 – 7.0 kev luminosity of =5.0451042 ergs-1. KURVS 11 has an intrinsic 0.5 – 7.0 kev X-ray luminosity of =5.3121041 ergs-1, but this is below the AGN threshold of the Luo et al. (2017) catalogue (31042 ergs-1). Three other galaxies in the sample (KURVS 14, 15 and 22) have X-ray counterparts but luminosities that lie below the AGN threshold. None of the galaxies in the sample have a [Nii]/H0.8 or a in their integrated spectrum from a 1.2 arcsecond aperture.
In the following analysis we highlight KURVS 11 and 12 as candidate AGN in the relevant plots but do not omit them from our analysis. In total we have 20 star-forming main-sequence galaxies and 2 potential AGN. Having established the origin of the emission in Figure 1, we now focus on the main-sequence properties of the KURVS galaxies to establish whether they are typical star-forming galaxies at .
2.3 Main Sequence Properties
To quantity the position of the KURVS-CDFS galaxies relative to the main-sequence population at and determine whether they represent typical main-sequence galaxies at this epoch, we first need to measure the stellar mass, star-formation rate and stellar continuum half-light radii of the galaxies.
Gillman et al. (2020) measure the stellar masses of the KGES galaxies by fitting their UV – mid-infrared SEDs with the magphys software (da Cunha et al., 2008, 2015). For the two galaxies selected form the KMOS3D survey, we employ this process, deriving a median stellar mass (and bootstrapped uncertainty) for the KURVS-CDFS sample of ([]) = 10.1 0.1.
The deep CANDELS (Koekemoer et al., 2011) HST imaging data of the KURVS-CDFS galaxies can be used to quantify the stellar continuum half-light radius of the galaxies. Using the 1.6m (F160W) imaging van der Wel et al. (2014) derived the stellar-continuum size (), Sérsic index () and axis ratio of the CANDELS galaxies modelling the two-dimensional stellar-light profiles of the galaxies with the galfit (Peng et al., 2011) software. This analysis was independently verified in Gillman et al. (2020) for the KGES galaxies that lie within the CANDELS HST fields. The median F160W stellar continuum half-light radius of the KURVS-CDFS galaxies is [kpc] = 3.28 0.42. This places the KURVS-CDFS sample within 1 of the expected size ([kpc] = 3.48) from the van der Wel et al. (2014) mass-size relation at ([]) = 10.1.
The derivation of the H fluxes for the KURVS-CDFS objects is discussed in P22. The H flux is corrected for dust extinction using the V-band stellar attenuation () derived from magphys SED fitting and applying the methods of Wuyts et al. (2013) and assuming a Calzetti et al. (1994) extinction law such that,
| (1) |
as defined in Stott et al. (2016) where is the rest-frame stellar attenuation at the wavelength of H. The median rest-frame nebular attenuation at the wavelength of H () for the sample is . We derive a median H star-formation of SFRHα[M⊙yr-1] = 24 6, which is comparable to the KGES comparison sample. In Table 1 we summarise the main-sequence properties of the KURVS-CDFS sample.
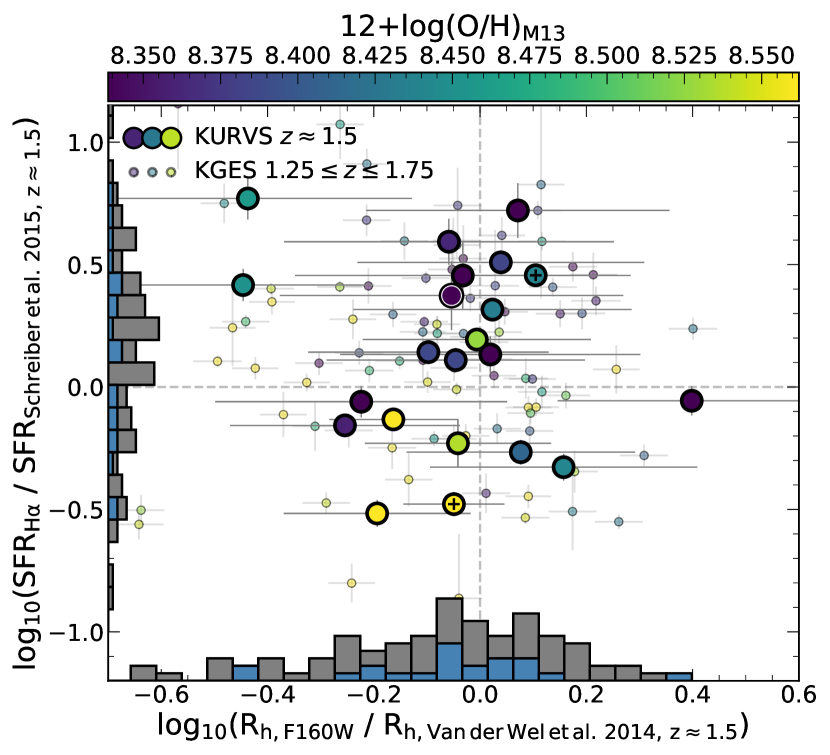
To establish the position of the KURVS-CDFS galaxies with respect to star-forming galaxy population at , we define the relation between stellar mass and star-formation rate (SFR) following Schreiber et al. (2015) and the relation between stellar continuum half-light radii and stellar mass () following van der Wel et al. (2014) at . In Figure 2 we show offset from the SFR relation as function of the offset from the median for the KURVS-CDFS sample. Galaxies from the KGES comparison sample are shown in the background, with histograms of each sample shown on each axis, indicating a similar distributions of stellar mass and star-formation rate in both the 71 selected KGES galaxies and the KURVS-CDFS sample. The two AGN (as defined in Section 2.2) are indicated by crosses and we colour the galaxies by their gas-phase metallicity as derived following the strong-line calibration of Marino et al. (2013) (Section 3.1).
Galaxies that exhibit smaller stellar continuum sizes tend to have lower H star-formation rates than ‘typical’ galaxies at of the same stellar mass. Figure 2 indicates that KURVS-CDFS galaxies represent main-sequence galaxies at with a small scatter about the SFR and relations at this epoch. By quantifying the properties of the emission lines in the KURVS-CDFS galaxies, as we go on to do in the next section, we can derive physical constraints on the chemical abundance and electron density properties of the interstellar medium in main-sequence galaxies 10 Gyr ago.
3 Analysis
In this section we measure the emission-line properties of the KURVS-CDFS galaxies. We first derive the galaxies integrated gas-phase Oxygen abundance, comparing different strong-line calibrations using the H, [Nii], and [Sii] emission lines and their correlations with galaxy properties. Using the [Sii]6716/6731 ratio we then measure the electron density in each galaxy before focusing on the spatially resolved emission-line properties of the sample.
3.1 Galaxy Integrated Metallicity
The metallicity of ionised gas in the interstellar medium, as traced by a particular element can be quantified from the elements emission line flux. For local galaxies this is achieved by directly measuring the electron temperature and density in high signal to noise spectra (see Maiolino & Mannucci, 2019; Kewley et al., 2019a, for full reviews). At high redshift this is not feasible and instead photoionization models are used to predict the relative strength of nebular emission lines.
To quantify the gas-phase metallicity of the galaxies in the KURVS-CDFS sample, we first de-redshift and remove the velocity field of the galaxies from the datacubes. To do so we normalize each spaxel’s spectra by the spectroscopic redshift of the galaxy, as determined from the H emission line. We then use the H velocity map of the galaxy, as derived in P22, to shift each spaxels spectrum by the mean velocity at that position. The result, as shown in Figure 1, is that the H emission line is centred at the rest-frame wavelength of 6563Å.
We note that the velocity field is derived using an adaptive binning technique on the datacube with a spaxel H signal-to-noise (S/N) threshold of S/N5 (see P22 for details). This velocity field thus defines the region in which we calculate the de-redshifted integrated spectrum of the galaxy. Any spaxels outside of the velocity map (i.e. S/N5) are excluded as we do not have a velocity correction for these spaxels and we do not expect faint lines beyond the extent of the H and [Nii] map. By transforming the spectrum to rest-frame, the rotational broadening of the emission lines are removed. We can then stack the spectra in individual spaxels to measure both the integrated and radial dependence of metallicity in each galaxy.
We apply this procedure to all 22 galaxies in the KURVS-CDFS sample. To quantify the emission-line properties of the KURVS-CDFS galaxies we define an integrated spectra for each galaxy by summing the spectra in the de-redshifted KMOS data cubes. We then fit an emission line model composed of five Gaussian profiles to the H, [Nii] and [Sii] emission lines present in each galaxies spectra. The Gaussian profile centers (redshift) and FWHM (velocity dispersion) are fixed to a common value and we set the flux ratio of the [Nii] doublet to be 2.8 following Osterbrock & Ferland (2006). To avoid erroneous fits, the fitting was performed using a minimisation method which weights against the wavelengths of the brightest OH skylines (as visible in Figure 1).
To ensure robust measurements of interstellar medium properties, we require the S/N of the 6583Å [Nii] emission-line and the weakest [Sii] emission-line to 2. For galaxies with a [Nii] S/N2, we define a 2 – limit, whilst for objects with a S/N2 in either [Sii] line we refrain from deriving interstellar medium properties from the [Sii] lines. In total 21/22 (95) have an integrated [Nii] S/N2222KURVS 8 has [Nii] S/N2 whilst 19/22 (86) galaxies have an [Sii] S/N333KURVS 2, 7 and 19 have [Sii] S/N2. For each galaxy we then extract the emission-line ratios as reported in Table 1. Using these values we can infer the chemical abundance and electron density within each galaxy.
3.1.1 N2 Index
A commonly used tracer of gas-phase metallicity at high-redshift is the [Nii]/H ratio. We use the [Nii]/H strong-line calibration from Marino et al. (2013) (hereafter M13) to derive the galaxies gas-phase metallicity. The calibration derived by M13 is more accurate at high metallicities (12+log(O/H)8.2) due to the inclusion of spectroscopic observations allowing the electron temperature to be constrained in this regime. This is opposed to the photoionization modelling originally used by Pettini & Pagel (2004).
The calibration is defined as;
| (2) |
and has an inherent uncertainty of 0.16 dex. The calibration is valid for an [Nii]/H ratio in the range or equivalently 12+(O/H)8. Poetrodjojo et al. (2021) demonstrate that the M13 calibration is in closer agreement with other metallicity indicators than the Pettini & Pagel (2004) calibration when inferring a galaxy’s gas-phase Oxygen abundance.
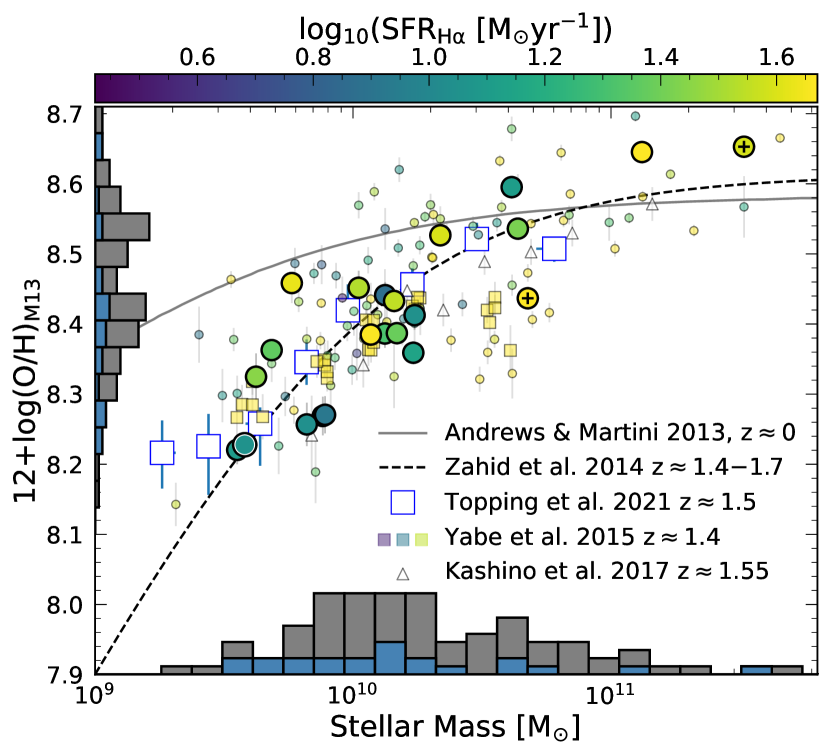
The median [Nii]/H ratio (and bootstrapped uncertainty) of the KURVS-CDFS sample is [Nii]/H = 0.18 0.03 which corresponds to median metallicity of 12+log(O/H)M13 = 8.40 0.03. In Figure 2 we show the mass–metallicity relation (MZR) for the KURVS-CDFS sample derived using the M13 calibration. We indicate the relations from Andrews & Martini (2013) at , Zahid et al. (2014) at and Topping et al. (2021) at as well as showing the KGES sample in the background. All comparison samples metallicities have been derived using the M13 calibration. The gas-phase metallicity of the KURVS-CDFS sample agrees with cosmic evolution of the MZR identified by other studies, with higher redshift galaxies having a lower gas-phase metallicity for a given stellar mass compared to galaxies.
In Figure 2 we colour the KGES and KURVS-CDFS samples by their H star-formation rates to highlight the presence of the fundamental mass–metallicity relation (FMR) between stellar mass, gas-phase metallicity and star-formation rate (e.g. Curti et al., 2020b; Gillman et al., 2021; Henry et al., 2021). Within the KURVS-CDFS sample the FMR is not prevalent due to the small dynamic range of star-formation rates but is visible in the KGES comparison sample.
To assess whether the KURVS-CDFS galaxies lie on the local FMR, we utilise the parameterisation of the plane by Curti et al. (2020a) in SDSS galaxies. The plane is defined as
| (3) |
where = +(SFR). Curti et al. (2020a) measured the best-fitting parameters are = 8.779 0.005, = 10.11 0.03, = 0.56 0.01, = 0.31 0.01 and = 2.1 0.4. Using the median stellar mass and star-formation rate of the KURVS-CDFS sample we can use Equation 3 to predict the gas-phase metallicity for galaxies on the FMR. At ([]) = 10.1 0.1 and SFRHα[M⊙yr-1] = 24 6, Equation 3 predicts Z = 8.53 0.01 whilst the median KURVS metallicity is ZM13 = 8.40 0.03. This indicates that the KURVS-CDFS galaxies lie 0.1 dex below the FMR, however we note this maybe be driven by differences in metallicity indicators (e.g. Kewley & Ellison, 2008; Andrews & Martini, 2013; Poetrodjojo et al., 2021).
3.1.2 N2S2H Index
The calibrations of Pettini & Pagel (2004); Marino et al. (2013) assume that the ionization parameter of the Hii region for which the calibration was derived, is the same as that being analysed. However, the [Nii]/H index varies strongly with the ionization parameter and hardness of the ionizing radiation field, as well as being dependent on the relation between (N/O) and (O/H). All three of these properties may vary at high redshift thus making the [Nii]/H strong-line calibration degenerate with other interstellar medium properties.
A recently developed strong-line calibration aimed to solve these metallicity degeneracy issues is the N2S2H calibration. Dopita et al. (2016) (hereafter D16) defined the new gas-phase metallicity calibration as,
| (4) |
where [Nii]/[Sii] is defined as [Nii]6584/[Sii]6717+6731. This calibration has an associated uncertanity of 0.12 dex and is expected to be less sensitive to the ionization parameter due to the [Nii]/[Sii] emission-line ratio whilst being equally unaffected by extinction due to the short wavelength separation. The [Nii]/H derived metallicity varies by 1 dex with ionization parameter (Kewley et al., 2019a). By combining the [Nii]/[Sii] ratio, that has a stronger dependence on the ionization parameter than [Nii]/[Oii] ratio, with the [Nii]/H ratio, the D16 calibration shown in Equation 4 becomes insensitive to the ionization parameter and interstellar medium pressure.
However, the calibration is still strongly dependent on the assumed (N/O) to (O/H) relation, as well as a constant Sulphur to Oxygen ratio, which is calibrated from a sample of local galaxies (e.g. Izotov et al., 2006; Maiolino & Mannucci, 2019). The median gas-phase metallicity derived using the D16 calibration for the KURVS-CDFS sample is 12+log(O/H)D16 = 8.43 0.07, which is comparable to the median M13 metallicity.
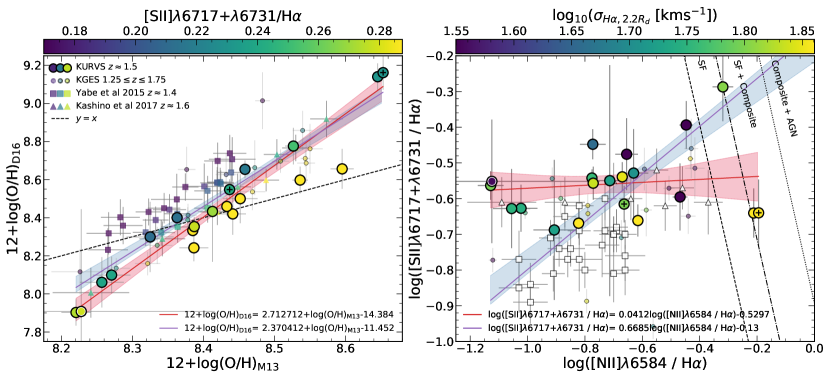
To analyse the conditions of the interstellar medium in the KURVS-CDFS galaxies, in Figure 3 we plot the gas-phase metallicity as derived from D16 calibration, as a function of the M13 derived metallicity. Differences between these two calibrations provide information on the ionization parameter and the hardness of the radiation field. We also show comparison samples from Yabe et al. (2015) at from the Subaru FMOS Galaxy Redshift survey and Kashino et al. (2017) at from the FMOS-COSMOS survey, as well as the KGES comparison sample. The emission-line ratios for both literature comparison samples are derived from stacked spectra which we convert to gas-phase Oxygen abundances for the samples using Equations 2 4.
The KURVS-CDFS galaxies and comparison samples indicate a comparable relationship between the D16 and M13 metallicity. There is good agreement between the two indicators for intermediate gas-phase metallicity galaxies, whilst at high (12+log(O/H)) and low (12+log(O/H)) M13 metallicity, the D16 calibration produces a higher (lower) gas-phase metallicity. We perform a linear orthogonal distance regression fit to the KURVS-CDFS galaxies of the form 12+log(O/H)D16 = (12+log(O/H)M13) + , deriving an , as indicated by the red line. Whilst the inclusion of the comparison samples results in a slope of , as indicated by the blue line.
In Figure 3 we colour the KURVS-CDFS galaxies, and comparison samples, by their [Sii]/H ratio. The [Sii]/H ratio is known to be a poor tracer of gas-phase metallicity due to its strong dependence on the ionization parameter (e.g. Maiolino & Mannucci, 2019). At higher metallicities, the galaxies with higher [Sii]/H ratios show closer agreement between the two indicators, whilst the low [Sii]/H ratio galaxies exhibit the largest discrepancy. At the lowest metallicities the lower [Sii]/H ratio galaxies have a smaller offset from the one to one relation. On average the KURVS-CDFS galaxies have higher [Sii]/H ratios (harder ionizing spectrum) with a median [Sii]/H = 0.27 0.02 compared to [Sii]/H = 0.20 0.01 for the comparison samples. The M13 calibration assumes fixed N/O - O/H relation whereas the D16 calibration ratio accounts for variation in this relation which may result in the offset between the two metallicity indicators. Furthermore, D16 is based on grids from the mappings photoionisation models, in contrast to the M13 calibration which is based on local HII regions. Thus the dynamic range in metallicity is different and hence the two calibrations differ the most in the low- and high metallicity regimes.
3.1.3 Emission-Line Diagnostics
To further understand the properties of the interstellar medium in KURVS-CDFS galaxies, we can compare different integrated emission-line ratios. High-redshift galaxies are offset to higher emission-line ratios compared to local main-sequence galaxies however the origin of this offset is disputed with indications of harder ionizing spectrum, higher ionization parameter, and/or variable N/O abundance ratio (e.g. Kewley et al., 2013; Steidel et al., 2014; Strom et al., 2017; Topping et al., 2020; Izotov et al., 2021; Runco et al., 2021) whilst other studies suggest the offset is purely an observational selection effect (e.g. Garg et al., 2022).
Sulfur is one of the elements, which include e.g. O, Ne, Si, produced primarily through nucleosynthesis in massive stars and supplied to the interstellar medium through type-II supernovae. In contrast, Nitrogen is generated through both the primary process and a secondary process where 12C and 16O initially contained in stars are converted into 14N via the CNO cycle. Therefore the [Nii]/[Sii] ratio is sensitive to the total chemical abundance, particularly in a regime where secondary nitrogen is predominant, while this ratio is almost constant if most nitrogen has a primary origin (e.g Strom et al., 2021). The [Sii]/[Nii] ratio has only a small effect by dust as the emission lines are separated by 140Å.
One useful diagnostic that also provides information on the origin of the ionizing radiation field and can distinguish between star-forming galaxies and active galactic nuclei (AGNs) is the correlation between [Sii]/H ratio and the [Nii]/H emission-line ratio (e.g. Sabbadin et al., 1977).
In the right-panel of Figure 3 we show the galaxy integrated [Sii]/H ratio as a function of [Nii]/H ratio, coloured by the galaxies velocity dispersion measured at 2.2Rd, as derived in P22, where Rd the stellar continuum disc scale length of the galaxy. We also show the comparison samples from Yabe et al. (2015) at and Kashino et al. (2017) at as well as the KGES comparison sample. We perform a linear orthogonal distance regression fit to the data of the form [Sii]/H= ([Nii]/H) +. The KURVS-CDFS galaxies indicate no strong correlation between the emission-line ratios with an , as indicated by the red line and spearman rank correlation () coefficents of . The inclusion of the full sample (KURVS-CDFS + literature samples) leads to a positive correlation with (blue line) and spearman rank coefficents of of .
Three KURVS-CDFS galaxies, KURVS 6, 12 and 22 lie at the boundary of the star-forming to star-forming and composite. KURVS 12 was identified in Section 2.2 as a candidate AGN, whilst KURVS 22 has an X-ray counterpart, but with a luminosity below the Luo et al. (2017) AGN threshold. KURVS 6 indicates no AGN spectral features, however the rest-frame optical morphology of this galaxy shows a clear bulge component which may result in higher emission-line ratios (e.g. Méndez-Abreu et al., 2019; Pak et al., 2021).
Law et al. (2021) identify strong positive correlations between the gas-phase velocity dispersion and emission-line ratios such as [Sii]/H, [Nii]/H in 9149 local () galaxies in the MANGA survey with a stellar mass range of = 9 – 11. They suggest the origin of the correlation is driven by the variation in ionizing source across the emission-line ratio parameter space. From Figure 3, we identify no correlation between the [Nii]/H ratio and of the KURVS-CDFS galaxies with a spearman rank coefficients of . Whilst the [Sii]/H and indicate a negative correlation with in contrast to Law et al. (2021) at . We note however we are comparing integrated emission-line ratios and velocity disperions as opposed to the spaxel-wise ratios compared in Law et al. (2021).
3.2 Galaxy Integrated Electron Density
As well as variations in the ionising source and the hardness of the radiation field, the density of electrons () in the interstellar medium of a galaxy can affect the inferred metallicity from emission-line ratios. At high-redshift an increased ionization parameter may be responsible for the higher emission-line ratios observed in main-sequence galaxies, in addition to the increased star-formation efficiency at earlier times. A possible driver of a higher ionization parameter is an elevated electron density (e.g. Brinchmann et al., 2008; Kashino et al., 2017; Kaasinen et al., 2017; Kewley et al., 2019b).
Local galaxies have electron densities in the range of log10([cm-3]) 1.5 – 2, which corresponds to variation in the ionization parameter of 0.06 dex. Recent high-redshift studies suggest an electron density of log10([cm-3]) 3 corresponding to a 0.5 dex increase in the ionization parameter (e.g. Sanders et al., 2016; Kewley et al., 2019b; Davies et al., 2021). In this section we quantify the electron density for individual galaxies in the KURVS-CDFS sample and analyse the correlations with the galaxy’s main sequence properties.
The electron density can be estimated from the ratio of collisionally-excited metal lines (e.g. [Oii]3726/3729, [Sii]6716/6731) (Osterbrock, 1974). These emission-line ratios weakly depend on electron temperature and are largely independent of metallicity. If we assume a constant nebula temperature of T = 104 K, the interstellar medium pressure is then directly proportional to the electron density. Doing so allows us to convert the [Sii]6716/6731 ratio to an electron density following the ionization models of Kewley et al. (2019b). The [Sii]6716/6731 line ratio is density sensitive in the range log10([cm-3]) 1.6 – 3.7 corresponding to [Sii]6716/6731 = 1.45 – 0.45 respectively.
We note however this is a simplification, as Hii regions contain temperature gradients and complex ionization structures (e.g. Wang et al., 2004; Dopita et al., 2006b; Kewley et al., 2019b). In addition the [Sii] lines cannot probe high densities because collisional de-excitation dominates above 104cm-3 where the ratio saturates at 0.45, its asymptotic value (e.g. Davies et al., 2020). To measure the integrated electron density for each galaxy, we take the [Sii]6716/6731 ratio as reported in Table 1 and apply the conversion to electron density. We detect the [Sii] lines in 19 KURVS-CDFS galaxies with [Sii] S/N2. The Kewley et al. (2019b) model places theoretical constraints on the emission-line ratios, requiring them to be between 0.45 [Sii]6716/6731 1.45. We therefore exclude the 10 galaxies that lie outside of these theoretical limits (8 with [Sii]6716/67311.45, 2 with [Sii]6716/67310.45444The [Sii] lines in KURVS 2 and 19 are heavily affected by OH skylines). The median of the remaining 12 KURVS-CDFS galaxies is log10([cm-3]) = 2.29 0.25 at a median redshift of = 1.39 0.07
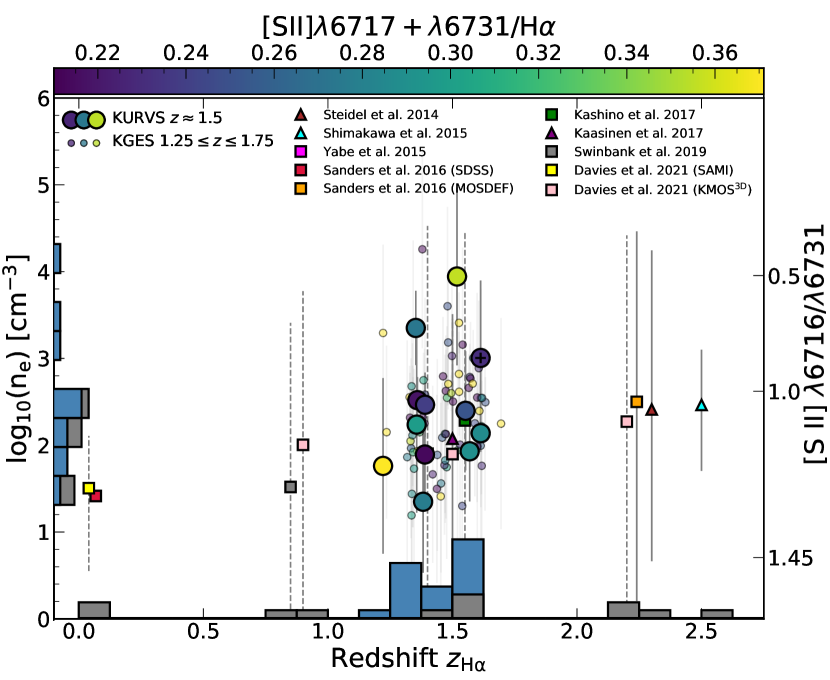
In Figure 4 we plot the electron density of the KURVS-CDFS galaxies as a function of their spectroscopic redshift as well the electron density measurements from individual galaxies in the KGES comparison sample. In addition to the KMOS samples we also include a number of comparison samples derived from either the [Oii]3726/3729 and [Sii]6716/6731 for both stacked and individual spectra, calibrated to the Kewley et al. (2019b) model by Davies et al. (2021). The electron density within the KURVS-CDFS galaxies agrees with comparison studies, with a higher electron density at than in the local Universe. The KMOS samples are coloured by their integrated [Sii]/H, a proxy for the ionization parameter, however no distinct trend with redshift or electron density is identified.
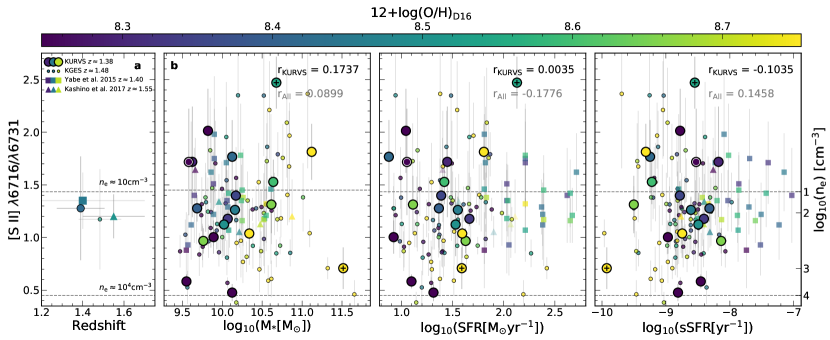
As well as a cosmic evolution in the electron density of the interstellar medium, studies have shown that the electron density may correlate with the galaxies main-sequence properties (e.g. Shimakawa et al., 2015; Kaasinen et al., 2017; Davies et al., 2021) whilst other studies conflict these results, finding no such correlations (e.g. Yabe et al., 2015; Onodera et al., 2016; Sanders et al., 2016). In Figure 5 we first plot the median [Sii]6716/6731 ratio of the KURVS-CDFS galaxies, and comparison samples, as a function of the median redshift, coloured by their gas-phase metalliciy derived using the D16 calibration. On average the KURVS-CDFS galaxies have similar electron density and gas-phase metallicity to the other comparison samples at this epoch (see Table 2).
We then correlate the individual galaxies [Sii]6716/6731 ratios with their their stellar mass, H star-formation rate and H specific star-formation rate. The galaxies are coloured by their integrated gas-phase metallicity following the D16 calibration. We include comparison samples from Kashino et al. (2017) FMOS-COSMOS and Yabe et al. (2015) the Subaru FMOS Galaxy Redshift Survey as well as the KGES comparison sample. The [Sii]6716/6731 is plotted as opposed to the to remove the theoretical constrains of the Kewley et al. (2019b) model, allowing more galaxies to be included in the sample. We note the electron density shown for the KMOS galaxies represents individual galaxy measurements, whilst both comparison samples are derived from spectra stacked in stellar mass bins.
For both the KURVS-CDFS sample and full sample (KURVS-CDFS + literature samples), we identify no significant correlations in all three panels as indicated by the black and grey spearman rank correlations shown in each panel respectively. We further identify no connection with between the integrated gas-phase metallicity and [Sii]6716/6731 ratio of the galaxies. However we note the KURVS sample does not cover a large range in stellar mass and star-formation rate, and thus may lead to a lack of correlation.
3.3 Resolved Gas-Phase Metallicity
To constrain the role of the baryon cycle within high-redshift star-forming galaxies it is crucial to spatially resolve the properties of the interstellar medium. The target selection of the KURVS-CDFS sample means all galaxies have deep ancillary multi-wavelength data, in addition to the unprecedented depth of the integral field KMOS observations, examples of which are shown in Figure 6. In this section we exploit this data to quantify the spatially resolved properties of the interstellar medium at .
3.3.1 Resolved Fundamental Metallicity Relation
The local galaxy population is well defined by a number of well studied scaling relations that interconnect the fundamental properties of galaxies (e.g. Fall & Romanowsky, 2013, 2018; Curti et al., 2020a). The fundamental metallicity relation (FMR) between galaxy stellar mass, gas-phase metallicity and star-formation rate prescribes the relation between the chemical abundance of the interstellar medium gas, ongoing star formation and stellar mass build up. The spatially resolved nature of the fundamental metallicity relation is less well defined especially at high redshift.
To resolve the FMR within the KURVS-CDFS sample, we require spatially resolved stellar mass, metallicity and star-formation maps. The metallicity and star-formation maps can be derived from the integral field KMOS data, whilst we derive the stellar mass maps from high-resolution CANDELS imaging of the KURVS-CDFS sample. Using the deep multi-wavelength broadband HST imaging from 0.43 – 1.6m, Dudzevičiūtė in. prep. perform pixel-to-pixel SED fitting. To do so we re-binned all of the HST data to 0.18 arcseconds, to approximately match the PSF FWHM of the longest wavelength (-band) data. From this matched-resolution imaging, the sextractor software was used to perform pixel photometry and stellar mass maps were constructed using using the magphys (da Cunha et al., 2015) SED fitting code (Dudzeviciute et al in prep). Dudzevičiūtė et al. (2019) confirmed that the spatially resolved stellar mass values of galaxies in the CANDELS field are consistent with integrated values.
To derive the gas-phase metallicity maps for each galaxy we convert the [Nii]/H ratio derived in each pixel (see Figure 6), following the adaptive binning emission-line fitting procedure (see P22), to a gas-phase Oxygen abundance using the M13 calibration. We opt for the M13 calibration as we do not have sufficient S/N in the [Sii] lines to spatially resolve them. The H star-formation rate map is derived by converting the observed H flux in each pixel to a extinction corrected H star-formation rate, following the same procedures as in Section 2 but using each pixels magphys derived to correct for dust-extinction.
In order to correlate the stellar mass in each pixel with the ionised gas properties (e.g. metallicity, star-formation rate) of the galaxies, we need to match the HST stellar mass map pixel scale and PSF size with that of the KMOS data. We re-bin the KMOS data, that is sampled at 0.10 arcseconds per pixel, to be 0.18 arcsecond per pixel. In doing so the flux in the KMOS data is conserved. To match the PSF size, we assume the PSFs are well modelled by a Gaussian and smooth the HST stellar mass maps with a Gaussian kernel of width,
| (5) |
where arcseconds and arcsecond. The KMOS PSF is derived from the standard star frames in the KMOS observations. Re-binning the KMOS data to a larger pixel scale results in the loss of pixels at the edges due to contamination with lower S/N pixels. We remove these contaminated pixels as well pixels from the stellar mass map with poorly constrained stellar masses due to uncertainties in the SED fitting.
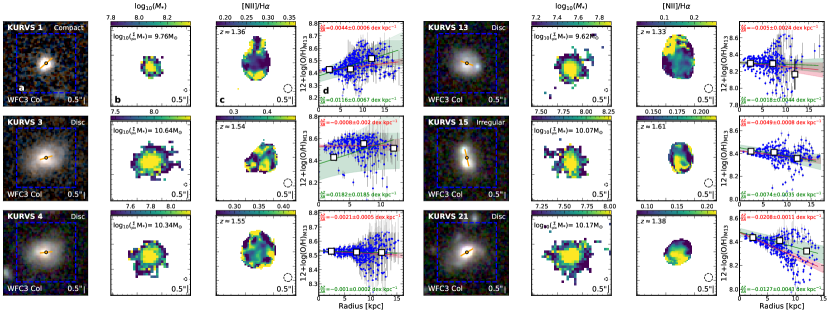
With the HST stellar mass maps of the galaxies on the same scale as the kinematic KMOS data, we align the HST data with the KMOS data using deep H-band continuum images. Having aligned and re-scaled the data to a homogeneous resolution, we can now analyse the spatially resolved correlations in the KURVS-CDFS sample. In Figure 6 we show examples of the HST multi-band imaging and spatially resolved KMOS data for the KURVS-CDFS galaxies. For each galaxy we show a WFC3 three-colour image composed of F105W, F125W and F160W images with the KMOS field of view (blue square) overlaid in panel a. The semi-major axis of the galaxy (orange line) and stellar continuum centre (black filled circle) are indicated, as well as the morphological classification from Huertas-Company et al. (2015). In panels b and c we show the spatially resolved stellar mass map and [Nii]/H map with the FWHM of the PSF in HST and KMOS observations (black dashed circle) respectively. We display the pixel-based gas-phase metallicity (blue points) as a function of radius and linear fit (crimson line) with reported slope and uncertainty in the final panel d. We also show the annuli-based metallicity (black squares) and corresponding annuli-based gradient (green line) with slope and uncertainty. The full KURVS-CDFS sample is shown in Appendix A
To convert the stellar mass and star-formation rate maps to a stellar mass surface density and star-formation rate surface density maps, we divide each pixels stellar mass (or star-formation rate) by the physical area of each pixel.
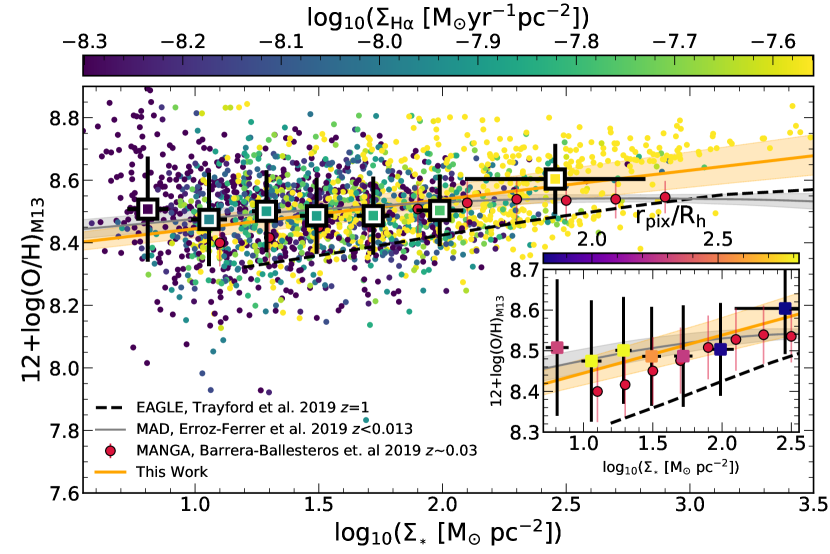
In Figure 7 we plot the gas-phase metallicity in each pixel as a function of the stellar mass surface density of the pixel coloured the pixels star-formation rate surface density. A running median (and standard deviation) in stellar mass surface density is shown by the black squares, where each bin contains 300 pixels. Each bin is coloured by the median star-formation rate surface density in that bin. We also perform a linear orthogonal distance regression fit to the resolved FMR of the form , deriving and . We note the choice of pixel scale does not influence the derived scaling relations with a consistent relation derived when using a pixel scale comparable to the KMOS PSF.
In addition we show the relations for the MUSE Atlas of Disks survey at from Erroz-Ferrer et al. (2019) (grey solid line and shaded region), the MANGA survey from Barrera-Ballesteros et al. (2018) at (red circles) and from the eagle hydrodynamical simulation at from Trayford & Schaye (2019) (black dashed line). We convert metallicity of Erroz-Ferrer et al. (2019) observational sample to the M13 calibration using the conversion of Scudder et al. (2021).
The derived relation for the KURVS-CDFS galaxies is in close agreement with the comparison samples, with higher stellar-mass surface density regions having higher gas-phase metallicity. We see no strong redshift evolution in the resolved FMR compared to the local Universe, with the low-redshift sample of Barrera-Ballesteros et al. (2018) having 0.05 dex lower gas-phase metallicity for a given stellar mass surface density. Trayford & Schaye (2019) note the normalisation of the relation for eagle is not necessarily accurate and has been adjusted to match observational metallicity calibrations, it is the shape of the relation, that indicates a weaker slope than our relation, that is important. The minimal evolution of the resolved FMR was also identified in Patrício et al. (2019) for three lensed galaxies at . However, the evolution of rMZR with redshift is in contrast to the evolution in the integrated MZR (Figure 2) for the KURVS-CDFS sample, where for a given stellar mass, high-redshift galaxies have a lower metallicity. Trayford & Schaye (2019) identified a strong evolution of 0.4 dex in metallicity at a stellar mass density of 102 between and . For the same range of stellar mass surface density, we identify an average offset to higher metallicity of 0.12 dex than that predicted by Trayford & Schaye (2019) at which may be driven by the choice of metallicity calibration.
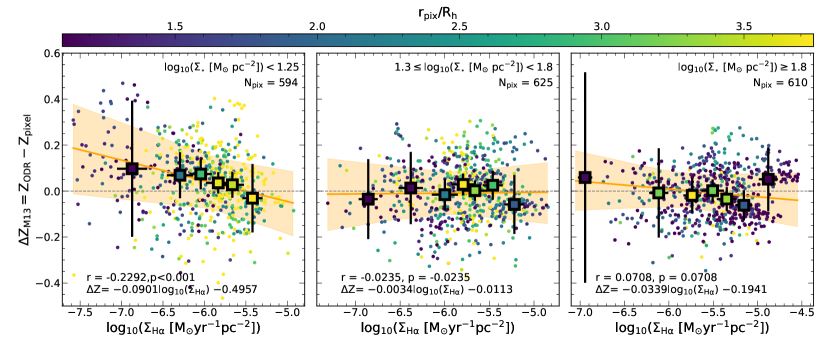
For a given stellar mass surface density in Figure 7, the higher star-formation rate surface density pixels appear to have a lower gas-phase metallicity. To investigate this correlation further, in Figure 8 we correlate the residuals to the orthogonal distance regression fit in Figure 7 with the star formation rate surface density of the pixels in different stellar mass surface density bins.
We perform a orthogonal distance regression fit to the relation identifying a slope of , , , and , , for the low, medium and high stellar mass surface density bins respectively. There is a weak negative correlation at high significance between the offset from parametric fit and the pixels star formation rate surface density in the lowest stellar mass surface density bin with , whereby higher star formation rate surface density pixels have a lower gas-phase metallicity for a given stellar mass surface density. This anti-correlation between star formation rate surface density and gas-phase metallicity residual is not present in the medium or higher stellar mass surface density bins, reflecting the predicted flattening in the rFMR. This is in agreement with that observed at low redshift (e.g. Cresci et al., 2019) and indicates the presence of the rFMR in the KURVS-CDFS sample, as shown in Figure 7. We colour the points in Figure 8, and running median, by their radial location in each galaxy (normalised by the galaxies stellar continuum half-light radii ()), indicating the radial variation in star formation rate surface density.
Furthermore, the inset panel in Figure 7 shows the running median of the rMZR coloured by the median normalised radius. There is an indication of a correlation between the radial location of the pixels and their metallicity, with highest metallicity located in the inner regions of the galaxies. This maybe due to the ‘inside-out’ secular evolution of the galaxies (e.g. Sánchez et al., 2014; Schönrich & McMillan, 2017; Zewdie et al., 2020; Wang & Lilly, 2021). However, this is averaged over the whole sample so in order to understand this relation further we now analyse the gas-phase metallicity gradients in individual galaxies. We note however this may also be driven by shocks and AGN contamination in the central regions.
3.3.2 Metallicity Gradients
A negative abundance gradient (metallicity decreasing with radius) has been commonly observed in low-redshift main-sequence star-forming galaxies (e.g. Belfiore et al., 2017; Sharda et al., 2021a; Lutz et al., 2021) and is theorised to be a clear signature of the ‘inside-out’ secular evolution of galaxies. The abundance gradients in high-redshift galaxies, however, are less well constrained with a studies reporting a range of abundance gradients (e.g. Cresci et al., 2010; Jones et al., 2013; Wuyts et al., 2016; Curti et al., 2020b).
The challenge at high-redshift is the lower S/N and surface brightness of the galaxies, making it difficult to accurately measure emission-line ratios. To achieve the required S/N, one common technique is to stack the spectra from integral field observations inside an annulus. The annuli are spaced apart by the PSF of the observations and aligned to galaxies kinematic position angle and morphological axis ratio (e.g. Wuyts et al., 2016; Curti et al., 2020a; Gillman et al., 2021). We can then measure the emission-line ratios from the stacked spectra in each annulus, giving two or three measurements of the gas-phase metallicity as a function of radius for each galaxy.
In this way large numbers of metallicity gradient measurements can be made in distant galaxies with lower S/N spectra. (e.g. Wuyts et al., 2016; Förster Schreiber et al., 2018; Gillman et al., 2021). For the KURVS-CDFS sample we measure the annuli-based metallicity gradients utilising the M13 strong-line calibration (Section 3.1) and the methods of Gillman et al. (2021). In short we sum the spectra in the velocity-subtracted data cubes from elliptical annuli whose semimajor axes are multiplies of the half-light radius of the KMOS PSF. If three measurements of the [Nii]/H ratio can be made with a H S/N3 in each annulus, the metallicity gradient is measured. We derive a median metallicity gradient of Z/R = 0.0052 0.0018 dex kpc-1. The PSF of the KMOS observations acts to flatten the observed metallicity gradients. To correct for this and attain an intrinsic metallicity gradient for each galaxy, we apply a beam-smearing correction to the gradients. The beam-smearing correction is a function of galaxy size (), relative to the FWHM of the observations, and galaxy axis ratio and was derived from modelling of mock galaxies with varying intrinsic gradients, continuum sizes and PSFs (see Gillman, 2020; Gillman et al., 2021). For the KURVS-CDFS sample we derive a median beam-smearing correction of = 0.32 0.05 and median intrinsic metallicity gradient of Z/R = 0.015 0.005 dex kpc-1.
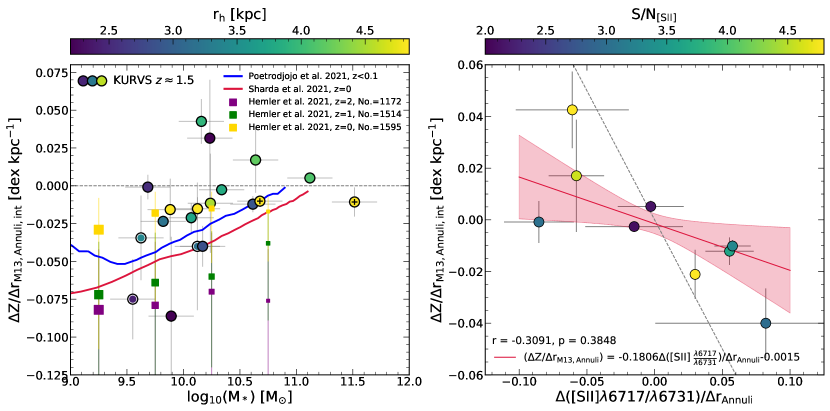
Recent studies have indicated connections between a galaxies gas-phase metallicity gradient and its fundamental properties such as stellar mass and stellar continuum half-light radius (e.g. Hemler et al., 2021; Sharda et al., 2021a, c, b; Boardman et al., 2021; Franchetto et al., 2021). To analyse this correlation in the KURVS-CDFS sample, in Figure 9 we correlate the intrinsic annuli-based metallicity gradients with the galaxies stellar mass. We also show comparison samples from the SAMI survey at (Poetrodjojo et al., 2021), the analytical model of Sharda et al. (2021a) and results from the TNG hydrodynamical simulations at redshift snapshots (Hemler et al., 2021). The intrinsic metallicity gradients of the KURVS-CDFS galaxies exhibit a similar correlation to the comparison samples, with flatter (or inverted) metallicity gradients at higher stellar mass. Sharda et al. (2021a) predict that the up turn to flatter gradients is driven by the galaxies transitioning from an advection-dominated evolution (i.e re-distribution of metals) to a accretion-dominated evolution at higher stellar masses.
Boardman et al. (2021) identify a variation in the metallicity gradient of galaxies across the stellar mass - stellar continuum half-light radii plane. They establish that smaller galaxies have flatter gradients than larger galaxies for a given stellar mass. In Figure 9 we colour the galaxies by their stellar continuum half-light radius () however in the KURVS-CDFS sample no clear trend with galaxy size is seen.
In addition to the radial variations in the gas-phase metallicity, other interstellar medium have been identified in local galaxies to correlate with radius. Studies have shown that galaxies have clumps or gradients in electron density (e.g. Binette et al., 2002; Phillips, 2007; Herrera-Camus et al., 2016) which brings into question the assumption of fixed electron density when inferring the properties of the interstellar medium (e.g. metallicity). To analyse the spatial variation in electron density in the KURVS-CDFS sample, we measure the [Sii]6716/6731 in annuli in order to increase the [Sii] S/N. Using the de-redshifted KMOS data cubes we apply the same method as for measuring the annuli-based metallicity gradients but this time measure [Sii]6716/6731 in each annulus. We require S/N2 for the weaker [Sii] in each annuli and derive a median intrinsic [Sii]6716/6731 gradient for the 11 galaxies that fulfil this criteria of ([Sii]6716/6731)/ = 0.007 0.034 dex kpc-1.
In Figure 9 we correlate the intrinsic [Sii]6716/6731 gradients with the intrinsic annuli-derived metallicity gradients using the M13 calibration. We perform an orthogonal distance regression fit (crimson line) of the form Z/R = ([Sii]6716/6731)/+ deriving = 0.18 0.08 and = 0.0015 0.004. A negative correlation with a spearman rank coefficient of = 0.31, = 0.39 is observed, suggesting an anti-correlation between the electron density and metallicity gradient. In this instance galaxies with negative abundance gradients have positive gradients in electron density. This brings into question the use of strong-line calibrations that assume a fixed electron density in the interstellar medium. Variations in electron density maybe caused by variations in star-formation rate, midplane and feedback pressures of the interstellar medium as well as variations in molecular hydrogen density (e.g. Kakkad et al., 2018; Davies et al., 2020, 2021). However larger samples are required to confirm this correlation at higher significance.
3.3.3 Evidence for non-uniform gradients
Main sequence high-redshift galaxies have been observed to have elevated velocity dispersions (e.g. Förster Schreiber et al., 2006; Wisnioski et al., 2015; Johnson et al., 2018) and non-uniform clumpy rest-frame optical morphologies (e.g. Glazebrook et al., 1995; Abraham et al., 1999; Conselice, 2014; Harrison et al., 2017). A linear metallicity gradient therefore appears as an over simplification of a much more complex abundance profile within these galaxies (see Figure 6).
Several studies have shown evidence for azimuthal variations in a galaxies gas-phase metallicity both at low redshift (e.g. Sánchez-Menguiano et al., 2018; Sánchez et al., 2021; Li et al., 2021; Metha et al., 2021) and at high-redshift (e.g. Förster Schreiber et al., 2018; Curti et al., 2020a) with connections to the galaxies morphology and kinematic state. To analyse the non-linearity of the abundance profiles in high-redshift star-forming galaxies we use the spatially resolved [Nii]/H emission-line maps derived in P22 (Figure 6). Correlating the metallicity of each pixel with its de-projected radius, we define a pixel-based metallicity gradient for each galaxy, deriving a median gradient of of Z/R = 0.0025 0.0010 dex kpc-1 for the sample.
For each galaxy we subtract off the linear pixel-based metallicity gradient and define the median absolute deviation (MAD) of the residuals; where a larger MAD indicates a larger derivation from the linear abundance profile. The median MAD from a linear abundance profile for KURVS-CDFS sample is MAD = 0.07 0.01 dex with a 16th – 84th percentile range of 0.04 – 0.10 dex. To analyse the correlation between the metallicity deviations from linearity and the galaxies properties we use the KMOS data to quantify the galaxies kinematic properties as well as the CANDELS HST imaging to constrain the morphological properties of the galaxies.
The shape of the stellar continuum light profile was quantified by van der Wel et al. (2014) who used the 1.6m HST imaging to constrain the Sérsic index of the CANDELS galaxies. Fitting Sérsic profiles with the galfit software to 10 arcsecond cutouts of the galaxies they established a median Sérsic index of = 1.23 0.21 for the KURVS-CDFS galaxies. In addition we have use the bulge to total (B/T) ratios for the KURVS-CDFS galaxies from Dimauro et al. (2018), who used the multi-wavelength HST data to decompose each galaxy into its bulge and disc components. From this sample, the KURVS-CDFS galaxies have a median bulge to total ratio of B/T = 0.27 0.12 i.e predominantly disc-dominated.
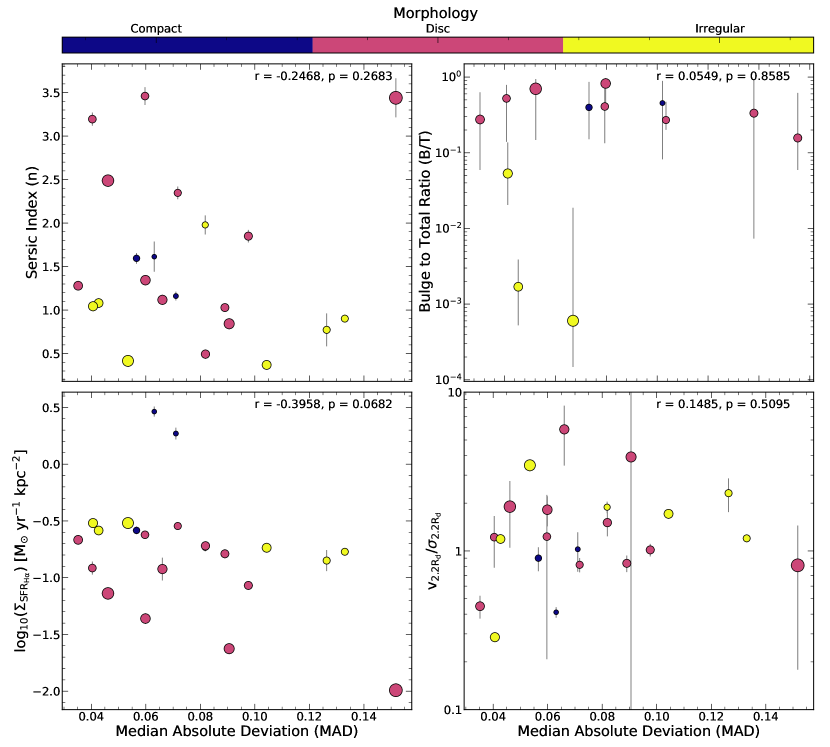
A visual classification of the galaxies was carried out by Huertas-Company et al. (2015), using machine learning to distinguish between Discs, Compact and Irregular galaxies. Following this classification the KURVS-CDFS sample is composed of 12 Discs, 9 Irregular and 3 Compact galaxies. In Figure 10 we correlate the MAD of the metallicity profiles with the Sérsic index, B/T, colouring the galaxies by their Hubble morphology (Compact, Disc, Irregular).
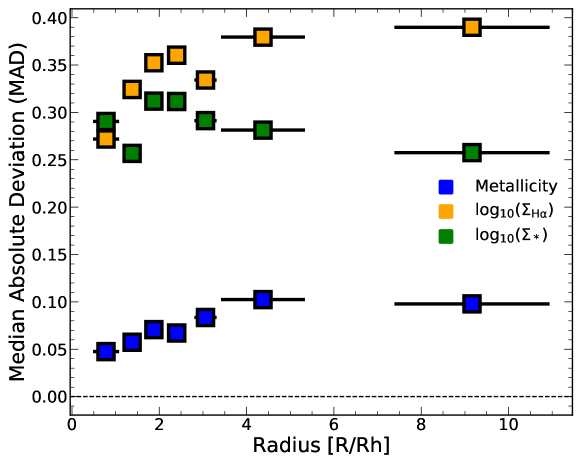
We also correlate the median absolute deviation of the residuals to the linear abundance profiles with the galaxies H star-formation rate surface density () and kinematic state () derived from the KMOS observations (see P22 for details). In Figure 10 we only identify a negative correlation between the deviation from a linear metallicity profile and the with spearman rank coefficients of = 0.40, = 0.07.
This implies that although there are clear azimuthal variations in the metallicity of the interstellar medium in high-redshift galaxies (Figure 6), they are not necessarily connected to the galaxies rest-frame optical morphology or kinematic properties of the galaxies but are more related to the concentration of ongoing star formation. At a fixed galaxy integrated SFRHα, larger galaxies have more deviation from a linear abundance gradient, whilst for a fixed size, galaxies with lower star-formation rates also have a larger deviation from a linear gradient. To visualise this in Figure 10, the size of the data points reflect the stellar continuum size of the galaxies. A similar connection between azimuthal variations in gas-phase metallicity and main-sequence properties was identified by Li et al. (2021) in the local Universe, with no correlation with galaxies kinematics or morphology. To investigate further, we derive the residuals in metallicity, stellar mass surface density and star formation rate surface density to their respective linear profiles as a function of radius for the KURVS-CDFS sample. We identify no correlation between the residuals of the metallicity profiles and the stellar mass surface density and star formation rate surface density residuals with , and respectively.
Defining the MAD at each radius we can construct the MAD radial profile for metallicity, stellar mass surface density and star formation rate surface density residuals. All three MAD profiles show an increase with radius (see Appendix B), indicating larger deviations from linear profiles at larger radii. However, the variations in the MAD of the residuals to the stellar mass surface density and star formation rate surface density profiles are not reflected in the MAD of the metallicity profile. This indicates that deviations from a linear metallicity gradient are not correlated with deviations from a linear stellar mass surface density or star formation rate surface density profile, at the same radius.
4 Conclusions
In this paper we have analysed the interstellar medium properties of 22 star-forming galaxies from the first half of the KMOS Ultra-deep Rotational Velocity Survey (KURVS) which comprises of sources in the CDFS field (KURVS-CDFS). KURVS-CDFS galaxies have a medium redshift of . We demonstrate the galaxies are representative of the galaxy main-sequence at this epoch with a median stellar mass, H derived star-formation rate and stellar continuum half-light radius of ([]) = 10.10 0.09, SFRHα[M⊙yr-1] = 24 6 and, [kpc] = 3.28 0.42 respectively. Our main conclusions are;
-
•
The stellar mass – gas-phase metallicity relation is in place in the sample with the galaxies exhibiting integrated gas-phase metallicity values expected for this epoch with a median value of 12+log(O/H)M13 = 8.40 0.03. We establish galaxies with higher [Sii]/H ratio show closer agreement between the Dopita et al. (2016) [Nii]/[Sii] based metallicity calibration and Marino et al. (2013) [Nii]/H calibration, especially at high metallicity (Figure 3). Whilst at low metallicity the integrated [Sii]/H ratio of the galaxies shows no correlation with the offset between the metallicity indicators.
-
•
We quantify the electron density in the galaxies using the [Sii]6716/6731 ratio. Of the 12 galaxies with 0.45 [Sii]6716/6731 1.45 we derive a median value of log10([cm-3]) = 2.29 0.25. We demonstrate the electron density within the sample is elevated in comparison to local galaxies in agreement with other high-redshift studies. However, we find no correlation with the ionization parameter (as traced by the integrated [Sii]/H ratio) (Figure 4) as well as no correlation between the galaxies main-sequence properties (e.g stellar mass, star-formation rate, specific star-formation rate) and electron density (Figure 5).
-
•
Exploiting the high S/N spatially resolved KMOS and HST data (Figure 6) we define the resolved fundamental metallicity relation (rFMR) at identifying the correlation between gas-phase metallicity, stellar mass surface density and H star-formation rate surface density (Figure 7). We find a 0.05 0.01 dex evolution in the normalisation of the relation compared to the local Universe as well as identifying variation in the gas-phase metallicity as a function of radial position.
-
•
We define stellar mass gas-phase metallicity gradient relation in the KURVS-CDFS sample, identifying flatter metallicity gradient at higher stellar masses as found by low redshift studies (Figure 9). We further define the relation between the [Sii]6716/6731 ratio (electron density) gradient and gas-phase metallicity gradient in the galaxies establishing a spearman rank coefficient of = 0.31, = 0.39, suggesting an anti-correlation between the electron density and metallicity gradient. In this instance galaxies with negative abundance gradients have positive gradients in electron density, however larger samples are required to confirmed this at higher significance.
-
•
Finally we examine the non-linearity of the abundance profiles using the spatially-resolved [Nii]/H maps, identifying evidence for azimuthal variations in metallicity which show a negative correlation with galaxy integrated star-formation rate surface density ( = 0.40, = 0.07). However, no correlation is identified with the galaxies morphological and kinematic properties (Figure 10) We further identify no connection between deviations from a linear metallicity profile and the deviations from a linear stellar mass surface density or star formation rate surface density profile (see Appendix B). Thus indicating that radial variations in metallicity are not connected to the radial variations in stellar mass or star formation but correlate with the global density of star-formation as traced by the H emission-line.
Overall we have shown that KURVS-CDFS sample at is composed of main-sequence galaxies which follow the galaxy-integrated scaling relations observed at low redshift, between stellar mass, stellar continuum size, star-formation rate and gas-phase metallicity. Whilst their spatially-resolved interstellar medium properties indicate both radial and azimuthal variations. Consequently, the prescriptions used to define the fundamental properties of low-redshift galaxies may not always be applicable at high-redshift due to variations in interstellar medium properties (e.g. electron density, ionisation parameter and variations in the ionising source) which can be quantified by future observations with JWST.
Acknowledgements
We thank D. Kashino and J.K. Barrera-Ballesteros for the availability of comparison sample emission-line ratios via private communication. We also thank the referee for a constructive review. SG acknowledges the support of the Cosmic Dawn Center of Excellence funded by the Danish National Research Foundation under then grant 140. AMS and AP gratefully acknowledges financial support from STFC through grants ST/T000244/1 and ST/P000541/1. UD acknowledges the support of STFC studentship ST/R504725/1. This work was supported by the National Science Foundation of China (11721303, 11991052) and the National Key R&D Program of China (2016YFA0400702). This research made use of Astropy555http://www.astropy.org a community-developed core Python package for Astronomy (Astropy Collaboration et al., 2013, 2018).
Data Availability
The inclusion of a Data Availability Statement is a requirement for articles published in MNRAS. Data Availability Statements provide a standardised format for readers to understand the availability of data underlying the research results described in the article. The statement may refer to original data generated in the course of the study or to third-party data analysed in the article. The statement should describe and provide means of access, where possible, by linking to the data or providing the required accession numbers for the relevant databases or DOIs.
References
- Abraham et al. (1996) Abraham R. G., van den Bergh S., Glazebrook K., Ellis R. S., Santiago B. X., Surma P., Griffiths R. E., 1996, ApJS, 107, 1
- Abraham et al. (1999) Abraham R. G., Ellis R. S., Fabian A. C., Tanvir N. R., Glazebrook K., 1999, MNRAS, 303, 641
- Andrews & Martini (2013) Andrews B. H., Martini P., 2013, ApJ, 765, 140
- Astropy Collaboration et al. (2013) Astropy Collaboration et al., 2013, A&A, 558, A33
- Astropy Collaboration et al. (2018) Astropy Collaboration et al., 2018, AJ, 156, 123
- Backhaus et al. (2021) Backhaus B. E., et al., 2021, arXiv e-prints, p. arXiv:2109.08147
- Barrera-Ballesteros et al. (2016) Barrera-Ballesteros J. K., et al., 2016, MNRAS, 463, 2513
- Barrera-Ballesteros et al. (2018) Barrera-Ballesteros J. K., et al., 2018, ApJ, 852, 74
- Belfiore et al. (2017) Belfiore F., et al., 2017, MNRAS, 469, 151
- Belfiore et al. (2019) Belfiore F., Vincenzo F., Maiolino R., Matteucci F., 2019, MNRAS, 487, 456
- Bian et al. (2018) Bian F., Kewley L. J., Dopita M. A., 2018, ApJ, 859, 175
- Bian et al. (2020) Bian F., Kewley L. J., Groves B., Dopita M. A., 2020, MNRAS, 493, 580
- Binette et al. (2002) Binette L., González-Gómez D. I., Mayya Y. D., 2002, Rev. Mex. Astron. Astrofis., 38, 279
- Boardman et al. (2021) Boardman N. F., Zasowski G., Newman J. A., Sanchez S. F., Schaefer A., Lian J., Bizyaev D., Drory N., 2021, MNRAS, 501, 948
- Brinchmann et al. (2008) Brinchmann J., Pettini M., Charlot S., 2008, MNRAS, 385, 769
- Burkert et al. (2016) Burkert A., et al., 2016, ApJ, 826, 214
- Calzetti et al. (1994) Calzetti D., Kinney A. L., Storchi-Bergmann T., 1994, ApJ, 429, 582
- Chabrier (2003) Chabrier G., 2003, PASP, 115, 763
- Conselice (2014) Conselice C. J., 2014, ARA&A, 52, 291
- Cresci et al. (2010) Cresci G., Mannucci F., Maiolino R., Marconi A., Gnerucci A., Magrini L., 2010, Nature, 467, 811
- Cresci et al. (2019) Cresci G., Mannucci F., Curti M., 2019, A&A, 627, A42
- Curti et al. (2020a) Curti M., Mannucci F., Cresci G., Maiolino R., 2020a, MNRAS, 491, 944
- Curti et al. (2020b) Curti M., et al., 2020b, MNRAS, 492, 821
- Curti et al. (2021) Curti M., et al., 2021, arXiv e-prints, p. arXiv:2110.11841
- Cutri et al. (2013) Cutri R. M., et al., 2013, Explanatory Supplement to the AllWISE Data Release Products, Explanatory Supplement to the AllWISE Data Release Products
- Davies et al. (2020) Davies R., et al., 2020, MNRAS, 498, 4150
- Davies et al. (2021) Davies R. L., et al., 2021, ApJ, 909, 78
- Dimauro et al. (2018) Dimauro P., et al., 2018, MNRAS, 478, 5410
- Donley et al. (2012) Donley J. L., et al., 2012, ApJ, 748, 142
- Dopita & Evans (1986) Dopita M. A., Evans I. N., 1986, ApJ, 307, 431
- Dopita et al. (2006a) Dopita M. A., et al., 2006a, ApJS, 167, 177
- Dopita et al. (2006b) Dopita M. A., et al., 2006b, ApJ, 647, 244
- Dopita et al. (2016) Dopita M. A., Kewley L. J., Sutherland R. S., Nicholls D. C., 2016, Ap&SS, 361, 61
- Dudzevičiūtė et al. (2019) Dudzevičiūtė U., et al., 2019, arXiv e-prints, p. arXiv:1910.07524
- ESO CPL Development Team (2015) ESO CPL Development Team 2015, EsoRex: ESO Recipe Execution Tool (ascl:1504.003)
- Erroz-Ferrer et al. (2019) Erroz-Ferrer S., et al., 2019, MNRAS, 484, 5009
- Fall & Romanowsky (2013) Fall S. M., Romanowsky A. J., 2013, ApJ, 769, L26
- Fall & Romanowsky (2018) Fall S. M., Romanowsky A. J., 2018, ApJ, 868, 133
- Florian et al. (2020) Florian M. K., et al., 2020, arXiv e-prints, p. arXiv:2006.11387
- Förster Schreiber & Wuyts (2020) Förster Schreiber N. M., Wuyts S., 2020, ARA&A, 58, 661
- Förster Schreiber et al. (2006) Förster Schreiber N. M., et al., 2006, ApJ, 645, 1062
- Förster Schreiber et al. (2009) Förster Schreiber N. M., et al., 2009, ApJ, 706, 1364
- Förster Schreiber et al. (2018) Förster Schreiber N. M., et al., 2018, ApJS, 238, 21
- Förster Schreiber et al. (2019) Förster Schreiber N. M., et al., 2019, ApJ, 875, 21
- Franchetto et al. (2021) Franchetto A., et al., 2021, arXiv e-prints, p. arXiv:2109.02656
- Garg et al. (2022) Garg P., et al., 2022, arXiv e-prints, p. arXiv:2201.03564
- Gillman (2020) Gillman S., 2020, PhD thesis, Durham University
- Gillman et al. (2019) Gillman S., et al., 2019, MNRAS, p. 727
- Gillman et al. (2020) Gillman S., et al., 2020, MNRAS, 492, 1492
- Gillman et al. (2021) Gillman S., et al., 2021, MNRAS, 500, 4229
- Glazebrook et al. (1995) Glazebrook K., Ellis R., Santiago B., Griffiths R., 1995, MNRAS, 275, L19
- Grogin et al. (2011) Grogin N. A., et al., 2011, ApJS, 197, 35
- Harrison et al. (2017) Harrison C. M., et al., 2017, MNRAS, 467, 1965
- Hayden-Pawson et al. (2021) Hayden-Pawson C., et al., 2021, arXiv e-prints, p. arXiv:2110.00033
- Helton et al. (2022) Helton J. M., Strom A. L., Greene J. E., Bezanson R., Beaton R., 2022, arXiv e-prints, p. arXiv:2201.02207
- Hemler et al. (2021) Hemler Z. S., et al., 2021, MNRAS, 506, 3024
- Henry et al. (2021) Henry A., et al., 2021, arXiv e-prints, p. arXiv:2107.00672
- Herrera-Camus et al. (2016) Herrera-Camus R., et al., 2016, ApJ, 826, 175
- Hinshaw et al. (2013) Hinshaw G., et al., 2013, ApJS, 208, 19
- Huertas-Company et al. (2015) Huertas-Company M., et al., 2015, AJ, 809, 95
- Ilbert et al. (2010) Ilbert O., et al., 2010, ApJ, 709, 644
- Izotov et al. (2006) Izotov Y. I., Stasińska G., Meynet G., Guseva N. G., Thuan T. X., 2006, A&A, 448, 955
- Izotov et al. (2021) Izotov Y. I., Guseva N. G., Fricke K. J., Henkel C., Schaerer D., Thuan T. X., 2021, A&A, 646, A138
- Ji & Yan (2021) Ji X., Yan R., 2021, arXiv e-prints, p. arXiv:2110.00612
- Johnson et al. (2018) Johnson H. L., et al., 2018, MNRAS, 474, 5076
- Jones et al. (2013) Jones T., Ellis R. S., Richard J., Jullo E., 2013, ApJ, 765, 48
- Jones et al. (2015) Jones T., et al., 2015, AJ, 149, 107
- Kaasinen et al. (2017) Kaasinen M., Bian F., Groves B., Kewley L. J., Gupta A., 2017, MNRAS, 465, 3220
- Kakkad et al. (2018) Kakkad D., et al., 2018, A&A, 618, A6
- Kashino et al. (2017) Kashino D., et al., 2017, ApJ, 835, 88
- Kewley & Dopita (2002) Kewley L. J., Dopita M. A., 2002, ApJS, 142, 35
- Kewley & Ellison (2008) Kewley L. J., Ellison S. L., 2008, ApJ, 681, 1183
- Kewley et al. (2013) Kewley L. J., Dopita M. A., Leitherer C., Davé R., Yuan T., Allen M., Groves B., Sutherland R., 2013, ApJ, 774, 100
- Kewley et al. (2019a) Kewley L. J., Nicholls D. C., Sutherland R. S., 2019a, ARA&A, 57, 511
- Kewley et al. (2019b) Kewley L. J., Nicholls D. C., Sutherland R., Rigby J. R., Acharya A., Dopita M. A., Bayliss M. B., 2019b, ApJ, 880, 16
- Koekemoer et al. (2011) Koekemoer A. M., et al., 2011, ApJS, 197, 36
- Kumari et al. (2021) Kumari N., Amorín R., Pérez-Montero E., Vílchez J., Maiolino R., 2021, MNRAS,
- Lara-López et al. (2010) Lara-López M. A., Bongiovanni A., Cepa J., Pérez García A. M., Sánchez-Portal M., Castañeda H. O., Fernández Lorenzo M., Pović M., 2010, A&A, 519, A31
- Law et al. (2021) Law D. R., et al., 2021, ApJ, 915, 35
- Li et al. (2021) Li Z., Krumholz M. R., Wisnioski E., Mendel J. T., Kewley L. J., Sánchez S. F., Galbany L., 2021, MNRAS, 504, 5496
- Lian et al. (2018) Lian J., Thomas D., Maraston C., Goddard D., Comparat J., Gonzalez-Perez V., Ventura P., 2018, MNRAS, 474, 1143
- Lilly et al. (2013) Lilly S. J., Carollo C. M., Pipino A., Renzini A., Peng Y., 2013, ApJ, 772, 119
- Luo et al. (2017) Luo B., et al., 2017, ApJS, 228, 2
- Lutz et al. (2021) Lutz K. A., et al., 2021, A&A, 649, A39
- Maiolino & Mannucci (2019) Maiolino R., Mannucci F., 2019, A&ARv, 27, 3
- Mannucci et al. (2010) Mannucci F., Cresci G., Maiolino R., Marconi A., Gnerucci A., 2010, MNRAS, 408, 2115
- Marino et al. (2013) Marino R. A., et al., 2013, A&A, 559, A114
- Méndez-Abreu et al. (2019) Méndez-Abreu J., Sánchez S. F., de Lorenzo-Cáceres A., 2019, MNRAS, 484, 4298
- Metha et al. (2021) Metha B., Trenti M., Chu T., 2021, arXiv e-prints, p. arXiv:2109.03390
- Mobasher et al. (2015) Mobasher B., et al., 2015, ApJ, 808, 101
- Nelson et al. (2012) Nelson E. J., et al., 2012, ApJ, 747, L28
- Neumann et al. (2021) Neumann J., et al., 2021, MNRAS,
- Onodera et al. (2016) Onodera M., et al., 2016, ApJ, 822, 42
- Osterbrock (1974) Osterbrock D. E., 1974, Astrophysics of gaseous nebulae
- Osterbrock & Ferland (2006) Osterbrock D. E., Ferland G. J., 2006, Astrophysics of gaseous nebulae and active galactic nuclei
- Pak et al. (2021) Pak M., Lee J. H., Oh S., D’Eugenio F., Colless M., Jeong H., Jeong W.-S., 2021, arXiv e-prints, p. arXiv:2108.05014
- Patrício et al. (2019) Patrício V., et al., 2019, MNRAS, 489, 224
- Peng et al. (2011) Peng C. Y., Ho L. C., Impey C. D., Rix H.-W., 2011, GALFIT: Detailed Structural Decomposition of Galaxy Images (ascl:1104.010)
- Pettini & Pagel (2004) Pettini M., Pagel B. E. J., 2004, MNRAS, 348, L59
- Phillips (2007) Phillips J. P., 2007, MNRAS, 380, 369
- Poetrodjojo et al. (2021) Poetrodjojo H., et al., 2021, MNRAS, 502, 3357
- Runco et al. (2021) Runco J. N., et al., 2021, MNRAS, 502, 2600
- Sabbadin et al. (1977) Sabbadin F., Minello S., Bianchini A., 1977, A&A, 60, 147
- Sachdeva et al. (2019) Sachdeva S., Gogoi R., Saha K., Kembhavi A., Raychaudhury S., 2019, MNRAS, 487, 1795
- Sánchez (2020) Sánchez S. F., 2020, ARA&A, 58, 99
- Sánchez-Menguiano et al. (2018) Sánchez-Menguiano L., et al., 2018, A&A, 609, A119
- Sánchez et al. (2014) Sánchez S. F., et al., 2014, A&A, 563, A49
- Sánchez et al. (2021) Sánchez S. F., Walcher C. J., Lopez-Cobá C., Barrera-Ballesteros J. K., Mejía-Narváez A., Espinosa-Ponce C., Camps-Fariña A., 2021, Rev. Mex. Astron. Astrofis., 57, 3
- Sanders et al. (2016) Sanders R. L., et al., 2016, ApJ, 825, L23
- Sanders et al. (2020) Sanders R. L., et al., 2020, arXiv e-prints, p. arXiv:2009.07292
- Schönrich & McMillan (2017) Schönrich R., McMillan P. J., 2017, MNRAS, 467, 1154
- Schreiber et al. (2015) Schreiber C., et al., 2015, A&A, 575, A74
- Scudder et al. (2021) Scudder J. M., Ellison S. L., El Meddah El Idrissi L., Poetrodjojo H., 2021, MNRAS, 507, 2468
- Sharda et al. (2021a) Sharda P., Krumholz M. R., Wisnioski E., Forbes J. C., Federrath C., Acharyya A., 2021a, MNRAS, 502, 5935
- Sharda et al. (2021b) Sharda P., Krumholz M. R., Wisnioski E., Acharyya A., Federrath C., Forbes J. C., 2021b, MNRAS, 504, 53
- Sharda et al. (2021c) Sharda P., Wisnioski E., Krumholz M. R., Federrath C., 2021c, MNRAS, 506, 1295
- Shimakawa et al. (2015) Shimakawa R., et al., 2015, MNRAS, 451, 1284
- Simons et al. (2020) Simons R. C., et al., 2020, arXiv e-prints, p. arXiv:2011.03553
- Steidel et al. (2014) Steidel C. C., et al., 2014, ApJ, 795, 165
- Stern et al. (2012) Stern D., et al., 2012, ApJ, 753, 30
- Stott et al. (2016) Stott J. P., et al., 2016, MNRAS, 457, 1888
- Strom et al. (2017) Strom A. L., Steidel C. C., Rudie G. C., Trainor R. F., Pettini M., Reddy N. A., 2017, ApJ, 836, 164
- Strom et al. (2021) Strom A. L., Rudie G. C., Steidel C. C., Trainor R. F., 2021, arXiv e-prints, p. arXiv:2111.06410
- Swinbank et al. (2017) Swinbank A. M., et al., 2017, MNRAS,
- Swinbank et al. (2019) Swinbank A. M., et al., 2019, MNRAS, 487, 381
- Tacconi et al. (2013) Tacconi L. J., et al., 2013, ApJ, 768, 74
- Tacconi et al. (2020) Tacconi L. J., Genzel R., Sternberg A., 2020, ARA&A, 58, 157
- Tiley et al. (2019) Tiley A. L., et al., 2019, MNRAS, 482, 2166
- Tiley et al. (2021) Tiley A. L., et al., 2021, arXiv e-prints, p. arXiv:2106.05511
- Topping et al. (2020) Topping M. W., Shapley A. E., Reddy N. A., Sanders R. L., Coil A. L., Kriek M., Mobasher B., Siana B., 2020, MNRAS, 495, 4430
- Topping et al. (2021) Topping M. W., et al., 2021, MNRAS,
- Trayford & Schaye (2019) Trayford J. W., Schaye J., 2019, MNRAS, 485, 5715
- Übler et al. (2017) Übler H., et al., 2017, ApJ, 842, 121
- Wang & Lilly (2021) Wang E., Lilly S. J., 2021, ApJ, 910, 137
- Wang et al. (2004) Wang W., Liu X. W., Zhang Y., Barlow M. J., 2004, A&A, 427, 873
- Wang et al. (2020) Wang X., et al., 2020, ApJ, 900, 183
- Whitaker et al. (2012) Whitaker K. E., van Dokkum P. G., Brammer G., Franx M., 2012, ApJ, 754, L29
- Wisnioski et al. (2015) Wisnioski E., Förster Schreiber N. M., Wuyts S. e. a., 2015, apj, 799, 209
- Wisnioski et al. (2019) Wisnioski E., et al., 2019, ApJ, 886, 124
- Wuyts et al. (2013) Wuyts S., et al., 2013, ApJ, 779, 135
- Wuyts et al. (2016) Wuyts E., et al., 2016, ApJ, 827, 74
- Yabe et al. (2015) Yabe K., et al., 2015, PASJ, 67, 102
- Yates et al. (2021) Yates R. M., Henriques B. M. B., Fu J., Kauffmann G., Thomas P. A., Guo Q., White S. D. M., Schady P., 2021, MNRAS, 503, 4474
- Zahid et al. (2014) Zahid H. J., et al., 2014, ApJ, 792, 75
- Zewdie et al. (2020) Zewdie D., Pović M., Aravena M., Assef R. J., Gaulle A., 2020, MNRAS, 498, 4345
- da Cunha et al. (2008) da Cunha E., Charlot S., Elbaz D., 2008, MNRAS, 388, 1595
- da Cunha et al. (2015) da Cunha E., et al., 2015, ApJ, 806, 110
- van der Wel et al. (2014) van der Wel A., et al., 2014, ApJ, 788, 28
Appendix A Spatially Resolved Properties
![[Uncaptioned image]](/html/2202.12304/assets/x12.png)
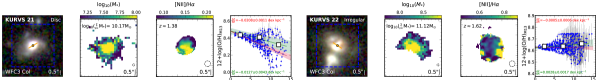
Appendix B Median Absolute Deviation (MAD) Profiles
To further investigate the deviations from a linear abundance profile in the KURVS-CDFS galaxies, we define the radial profiles in each galaxy for metallicity, stellar mass surface density and star formation rate surface density. Performing a linear profile to each profile, for each galaxy, we define the residuals to each profile. Taking the sample as we whole, we then define the MAD of the residuals as a function of radius.
In Figure 12 we show the MAD as function of radius for metallicity, stellar mass surface density and star formation rate surface density. All three MAD profiles show an increase with radius, indicating larger deviations from linear profiles at larger radii. However, the variations in the MAD of the residuals to the stellar mass surface density and star formation rate surface density profiles are not reflected in the MAD of the metallicity profile. This indicates that deviations from a linear metallicity gradient are not correlated with deviations from a linear stellar mass surface density or star formation rate surface density profile, at the same radius.