“splink” is happy and “phrouth” is scary:
Emotion Intensity Analysis for Nonsense Words
Abstract
People associate affective meanings to words – “death” is scary and sad while “party” is connotated with surprise and joy. This raises the question if the association is purely a product of the learned affective imports inherent to semantic meanings, or is also an effect of other features of words, e.g., morphological and phonological patterns. We approach this question with an annotation-based analysis leveraging nonsense words. Specifically, we conduct a best-worst scaling crowdsourcing study in which participants assign intensity scores for joy, sadness, anger, disgust, fear, and surprise to 272 nonsense words and, for comparison of the results to previous work, to 68 real words. Based on this resource, we develop character-level and phonology-based intensity regressors. We evaluate them on both nonsense words and real words (making use of the NRC emotion intensity lexicon of 7493 words), across six emotion categories. The analysis of our data reveals that some phonetic patterns show clear differences between emotion intensities. For instance, s as a first phoneme contributes to joy, sh to surprise, p as last phoneme more to disgust than to anger and fear. In the modelling experiments, a regressor trained on real words from the NRC emotion intensity lexicon shows a higher performance (r = 0.17) than regressors that aim at learning the emotion connotation purely from nonsense words. We conclude that humans do associate affective meaning to words based on surface patterns, but also based on similarities to existing words (“juy” to “joy”, or “flike” to “like”).
“splink” is happy and “phrouth” is scary:
Emotion Intensity Analysis for Nonsense Words
Valentino Sabbatino, Enrica Troiano, Antje Schweitzer, and Roman Klinger Institut fur Maschinelle Sprachverarbeitung, University of Stuttgart, Germany {firstname.lastname}@ims.uni-stuttgart.de
1 Introduction
With words come meanings, as well as a variety of associations such as emotional nuances. Emotions, feelings, and attitudes, which can be summarized under the umbrella term of “affect”, are in fact a core component for the meaning of large portions of a language vocabulary (Mohammad, 2018). In English, they encompass nouns, verbs, adjectives, and adverbs (Mohammad and Turney, 2013). For instance, dejected and wistful can be said to directly express an emotion, but there are also terms that do not describe a state of emotion and are still associated to one (e.g., failure and death111Examples from Mohammad (2018).), given an interpretation of an associated event.
Most computational studies of emotions in text deal with words in context, for instance in news headlines Strapparava and Mihalcea (2007); Bostan et al. (2020) or in Tweets Schuff et al. (2017); Mohammad (2012); Köper et al. (2017); Goel et al. (2017). Analyzing words in isolation, however, is equally important, as it can help to create lexical resources for use in applications Mohammad and Turney (2013); Mohammad (2018); Warriner et al. (2013), to investigate how words are processed in general (Traxler and Gernsbacher, 2006, Part 2), and more specifically, to obtain a better understanding of first language acquisition processes Bakhtiar et al. (2007).
When considering words in isolation, their meaning cannot be disambiguated by the surrounding text. This raises the question: can readers interpret an emotional load from unknown words, which are judged out of their context? We address this question by analyzing emotion associations of “nonsense” words – or nonwords, or pseudowords, i.e., terms which resemble real entries in the English vocabulary, but are actually not part of it (Keuleers and Brysbaert, 2010; Chuang et al., 2021). Our aim is to understand the degree to which nonsense words like fonk, knunk, or snusp can be associated to particular emotions. We model the problem as an emotion intensity analysis task with a set of basic emotions, namely fear, anger, joy, disgust, surprise, and sadness.
Other fields have provided evidence that some phonemes can be related to the affective dimension of valence Myers-Schulz et al. (2013); Adelman et al. (2018), but emotion analysis, and in particular word-based research, has not yet ventured this direction. Gaining insight on the emotional tone of non-existing expressions could be relevant for current computational emotion classification and intensity regression efforts, which have manifold applications across social media mining or digital humanities. As an example, when new product names are coined which do not have an established semantics, designers and marketing experts might want to be aware of the potential affective connections that these evoke, and avoid those with a negative impact.
Therefore, our main contributions are: (1) the creation of an emotion intensity lexicon of 272 nonsense words (with in addition 68 real words, for comparison to previous work), (2) the analysis of the phonemes present in them (if pronounced as English words) that aligns with emotion intensity studies across the Ekman (1999) basic emotions, and (3) experiments in which we develop intensity regressors on a large resource of real words, as well as on our nonsense words. Both regressors are evaluated on real and nonsense words.
2 Related Work
2.1 Emotion Analysis
Emotion analysis in text deals with the task of assigning (a set of) emotions to words, sentences, or documents (Bostan and Klinger, 2018; Schuff et al., 2017), and is conducted with various textual domains, including product reviews, tales, news, and (micro)blogs (Aman and Szpakowicz, 2007; Schuff et al., 2017). This task plays an important role in applications like dialog systems (e.g., chatbots), intelligent agents (Bostan and Klinger, 2018) and for identifying authors’ opinions, affective intentions, attitudes, evaluations, and inclinations (Aman and Szpakowicz, 2007). Its scope extends beyond computer science and is of great interest for many fields, like psychology, health care, and communication (Chaffar and Inkpen, 2011).
Computational studies build on top of emotion theories in psychology (Ekman, 1999; Plutchik, 2001; Scherer, 2005; Russell, 1980). While these theories by and large agree that emotions encompass expressive, behavioral, physiological, and phenomenological features, in emotion analysis they mainly serve as a reference system consisting of basic emotions (Ekman, 1999; Plutchik, 2001) or of a vector space within which emotions can be represented (Russell, 1980; Scherer, 2005).
With respect to basic emotion approaches, dimensional ones explain relations between emotions. The task of emotion intensity regression can be thought of as a combination of these two. There, the goal is not only to detect a categorical label, but also to recognize the strength with which such emotion is expressed. This idea motivated a set of shared tasks (Mohammad and Bravo-Marquez, 2017b; Mohammad et al., 2018), some lexical resources which assign emotion intensities to words (Mohammad, 2018) or to longer textual instances (Mohammad and Bravo-Marquez, 2017a), and automatic systems relying on deep learning and said resources (Goel et al., 2017; Köper et al., 2017; Duppada and Hiray, 2017, i.a.).
2.2 Nonsense Words and Emotional Sound Symbolism
Meaning in a language is conveyed in many different ways. At a phonetic level, for example, languages systematically use consonant voicing (/b/ vs. /p/, /d/ vs. /t/) to signal differences in mass, vowel quality to signal size, vowel lengthening to signal duration and intensity, reduplication to signal repetition, and in some languages vowel height or frontality to mark diminutives (Davis et al., 2019).
Semantics has also been studied with respect to non-existing words (i.e., terms without an established meaning). By investigating their lexical category, Cassani et al. (2020) explored the hypothesis that there is “(at least partially) a systematic relationship between word forms and their meanings, such that children can infer” the core semantics of a word from its sound alone. Also Chuang et al. (2019) found that nonwords are semantically loaded, and that their meanings co-determine lexical processing. Their results indicate that “non-word processing is influenced not only by form similarity [..] but also by nonword semantics”.
These “nonsense meanings” go beyond onomatopoeic connections: Cassani et al. (2020) showed that high vowels tend to evoke small forms, while low vowels tend to be associated with larger forms. As a matter of facts, research has unvealed many other links between visual and audio features of stimuli, besides the correspondences between verbal material and the size of non-speech percepts. The loudness of sounds and brightness of light have been shown to be perceived similarly, at various degrees of intensity Bond and Stevens (1969), and so are pitch and visual brightness – with higher pitched sounds being matched to bright stimuli both by adults Marks (1987) and children Mondloch and Maurer (2004). These findings are related to the so-called Bouba-Kiki effect (Köhler, 1970, p. 224) which describes a non-arbitrary mapping between speech sounds and the visual shape of objects: speakers in several languages pair nonsense words such as maluma or bouba with round shapes, and takete or kiki with spiky ones (D’Onofrio, 2014).
Previous work exists also on the emotional connotation of word sounds. Majid (2012) provide an extensive overview of how emotions saturate language at all levels, from prosody and the use of interjections, to morphology and metaphoric expressions. In phonetics, the relationship between acoustic and affective phenomena is based on the concept of sound symbolism. Adelman et al. (2018) hypothesized that individual phonemes are associated with negative and positive emotions and showed that both phonemes at the beginning of a word and phonemes that are pronounced fast convey negativity. They demonstrated that emotional sound symbolism is front-loaded, i.e., the first phoneme contributes the most to decide the valence of a word. Similarly, Myers-Schulz et al. (2013) showed that certain strings of English phonemes have an inherent valence that can be predicted based on dynamic changes in acoustic features.
In contrast to past research on emotional sound symbolism, ours focuses on written material. In particular, we address nonsense words, which are sequences of letters composing terms that do not exist in a language (Keuleers and Brysbaert, 2010; Chuang et al., 2021), but conform to its typical orthographic and phonological patterns (Keuleers and Brysbaert, 2010). For this reason, they are of particular interest in the psycholinguistics of language comprehension (Bakhtiar et al., 2007; Keuleers and Brysbaert, 2010; Chuang et al., 2021, 2019).
3 Data Acquisition and Annotation
We now describe the creation of our corpus of nonsense and real words, with their respective emotion intensity scores for the six emotions of joy, sadness, anger, fear, disgust, and surprise.222Our corpus is available base64 encoded in Appendix C, and at https://www.ims.uni-stuttgart.de/data/emotion We show an excerpt of our data in Appendix B.
3.1 Term Selection
Our corpus consists of 272 nonsense words and 68 real words. The nonsense words are taken from the ARC Nonword Database333http://www.cogsci.mq.edu.au/research/resources/nwdb/nwdb.html (Rastle et al., 2002), which consists of 358,534 monosyllabic nonwords, 48,534 pseudohomophones, and 310,000 non-pseudohomophonic nonwords. We randomly select nonsense words that have only orthographically existing onsets and bodies and only monomorphemic syllables, such as bleve, foathe, phlerm, and snusp.
In addition, for comparison to previous emotion intensity studies, we sample a small number of words that are only linked to one emotion from the NRC Emotion Lexicon (EmoLex, Mohammad and Turney, 2010). This resource contains a list of more than 10k English words and their associations with eight emotions: anger, fear, anticipation, trust, surprise, sadness, joy, and disgust. Its creators outlined some best practices to adopt in a crowdsourcing setup. They suggested to collect judgments by asking workers if a term is associated to an emotion, as to obtain more consistent judgments than could be collected by asking whether the term evokes an emotion. We hence align with such strategy in the design of our guidelines.
3.2 Annotation
To obtain continuous intensity scores for each of the six emotions for each word, we perform a best-worst scaling annotation (BWS, Louviere et al., 2015; Mohammad, 2018) via crowdsourcing.
Study Setup.
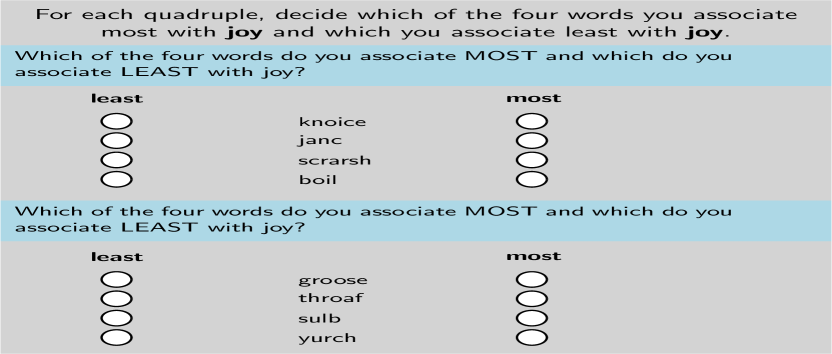
We follow the experimental setup described by Kiritchenko and Mohammad (2016). For each experiment (i.e., an annotation task performed by three different annotators), we select N words out of the pool of 340 collected items. With these N words, we randomly generate 2N distinct 4-tuples that comply with the constraints of a word appearing in eight different tuples and no word appearing in one tuple more than once. We do this for all six emotions. Therefore, each word occurs in 24 best-worst judgements (843). Figure 1 exemplifies the annotation task.
To aggregate the annotations to for word , we take the normalized difference between the frequency with which the word was labeled as best and as worst, i.e., (Kiritchenko and Mohammad, 2016). We linearly transform the score to 444We use an adaptation of the scripts from http://saifmohammad.com/WebPages/BestWorst.html.
Attention Checks.
To ensure annotation quality, we include attention checks. Each check consists of an additional 4-tuple of only real, manually selected words for the emotion in question. Two of the words are neutral with respect to such emotion, and two are, respectively, strongly related and opposite to it. For instance, we check attendance for joy with the words door, elbow, happiness, and depression. Annotations by participants who fail any attention check are discarded from our data.
| Round 1 | Round 2 | Total | |
| # Participants | 33 | 87 | 120 |
| male | 11 | 19 | 30 |
| female | 22 | 66 | 88 |
| other | 2 | 2 | |
| Age | 31 | 32 | 31.5 |
| min | 18 | 18 | 18 |
| max | 61 | 65 | 65 |
| # Words | 55 | 290 | 340 |
| non-words | 44 | 232 | 272 |
| real words | 11 | 58 | 68 |
| Avg. duration | 15 min | 25 min | 20 min |
| Overall cost | £90.09 | £395.85 | £485.94 |
3.2.1 Study Details
Table 1 summarizes the study details. We hosted it on the platform SoSci-Survey555https://www.soscisurvey.de/ and recruited participants via Prolific666https://www.prolific.co/, rewarding them with an hourly wage of £7.80. We performed the annotations in two iterations, the first of which was a small pretest to ensure the feasibility of the task. In the second round, we increased the amount of quadruples that one participant saw in one batch in each experiment, i.e. from five words (four nonsensical ones) to 10 (eight of which are nonsense).
Altogether, 120 participants worked on our 40 experiments, leading to a total of 340 annotated words777A mistake in the word selection process led to an overlap of words, therefore we did not achieve 345 words but 340 words. We ignore the annotations of the affected tuples.. We prescreened participants to be native English speakers and British citizens. Nevertheless, 19 participants indicated in the study that they have a language proficiency below a native speaker. All participants stated that they prefer British spelling over other variants. 58 participants have a high school degree or equivalent, 49 have a bachelor’s degree, 11 have a master’s degree and 2 have no formal qualification.
When asked for feedback regarding the study, participants remarked that words with k’s or v’s sounded harsher and unfriendlier than others, and expressed concern that assumptions about the pronunciation of the judged terms might vary from person to person. One participant noticed that some nonsense words included familiar and existing words, e.g., nice in snice, and this may have had an impact on their choices.
4 Corpus Analysis
We now discuss the reliability of the annotation process and then analyze the resulting resource.
| Nonsense | Real | NRC AIL | ||||
|---|---|---|---|---|---|---|
| Emotion | ||||||
| joy | .68 | .72 | .87 | .87 | .93 | .92 |
| sadness | .62 | .68 | .87 | .88 | .90 | .91 |
| anger | .69 | .71 | .81 | .82 | .91 | .91 |
| disgust | .68 | .72 | .83 | .85 | — | — |
| fear | .65 | .70 | .82 | .85 | .91 | .91 |
| surprise | .58 | .60 | .66 | .71 | — | — |
4.1 Reliability and Distribution
To assess the quality and reproducibility of our best-worst-scaling annotations, we calculate split-half reliability888We use available implementations from Kiritchenko and Mohammad (2016): http://saifmohammad.com/WebPages/BestWorst.html. (SHR) for each emotion and summarize the results in Table 2. We observe that Spearman’s correlation values for the nonsense words are consistently below our real word annotations, with differences between .08 and .25 points. Still, numbers indicate that annotations are strongly correlated.
Similar patterns hold for Pearson’s . Sadness shows the highest variation between the annotation of real and nonsense words (=.88 vs .68); the emotion surprise shows the smallest difference (=.71 vs .60), but the absolute values of such correlations also lower than those obtained for other emotions.
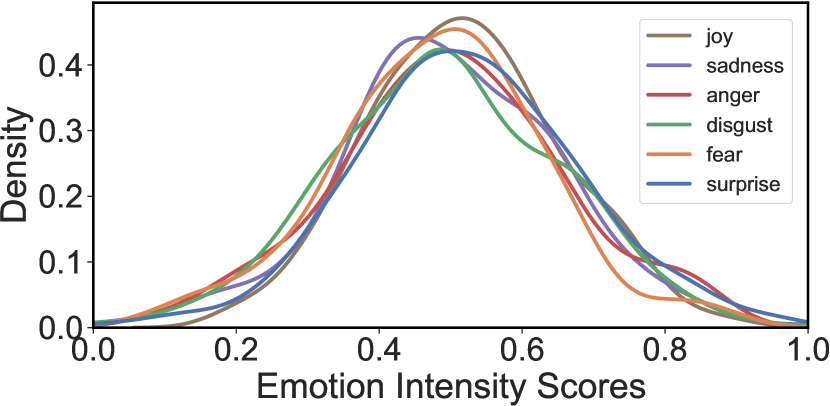
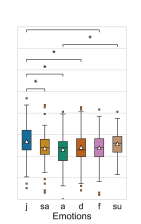
To compare these results to past research, we observe our real word reliability scores to those found in work describing the NRC lexicon (column NRC AIL in Table 2). Similar to such work, we also obtained highest results for joy than for emotions like anger and fear. However, their results are generally higher, which might be an effect of dataset size, and accordingly, a potentially better familiarization of their annotators with the task. Figure 2 shows the distribution of the emotion intensity values. The plots for all emotions are similar and follow a Gaussian distribution.
| Joy | Sadness | Anger | Disgust | Fear | Surprise | ||||||
|---|---|---|---|---|---|---|---|---|---|---|---|
| Word | Int. | Word | Int. | Word | Int. | Word | Int. | Word | Int. | Word | Int. |
| juy | .958 | vomp | .896 | terve | .938 | druss | .875 | phrouth | 1.0 | throoch | .896 |
| flike | .938 | phlump | .875 | shait | .875 | pheague | .865 | ghoothe | .875 | shrizz | .875 |
| splink | .938 | dis | .865 | phrouth | .854 | boarse | .854 | boarse | .854 | shrier | .833 |
| glaim | .875 | losh | .854 | broin | .813 | snulge | .854 | wrorgue | .854 | spreil | .813 |
| roice | .854 | drasque | .833 | psench | .813 | foathe | .833 | drasque | .833 | strem | .813 |
| shrizz | .854 | weathe | .833 | slanc | .813 | gneave | .833 | dwalt | .833 | swunt | .792 |
| spreece | .854 | dwaunt | .813 | straif | .813 | gream | .833 | keff | .813 | kease | .771 |
| snusp | .833 | phlerm | .792 | thwealt | .792 | phlerm | .833 | bange | .792 | purf | .771 |
| spirp | .833 | phreum | .792 | zorce | .792 | phlonch | .833 | frete | .792 | bange | .750 |
| drean | .813 | sout | .792 | boarse | .771 | vomp | .833 | psoathe | .771 | droosh | .750 |
In Table 3, we report the top ten nonsense words with the highest emotion intensity values for each emotion. These suggest some hypotheses relative to how annotators decide on the emotion intensity. Orthographical similarity to words with a clear emotional connotation might have led to the emotion association to the nonsense words. For instance, juy and flike resemble the words joy and like. Other nonwords might be interpreted by means of onomatopoeic associations that arguably evoke events, like throoch or shrizz for surprise and snulge or druss in disgust.
Some of these items exemplify the importance of the first phonemes, in agreement with earlier work (see Section 2.2). Surprise-bearing nonwords, for instance, tend to start with /s/ or /sh/, while the second or third phoneme is often an /r/ sound999We use ARPAbet for indicating phonemes.. Examples for this pattern are shrizz, shrier, spreil, and strem.
In addition, we observe that there is a relationship between the words for the emotions sadness, anger, disgust, and fear. For the emotion pairs sadness–disgust, anger–fear, and disgust–fear we have Pearson correlation values ranging from 0.57 to 0.60. For all the other different pairings of emotions the Pearson correlation value is in . Furthermore, we can observe that for these four emotions we have negative Pearson correlation values when comparing them with joy. The Pearson correlation values here lie between and , where the correlation is lowest for joy–sadness with a value of .
Details on BWS Reliability Calculation.
Our study has 2N (for N nonwords) BWS questions, that is, 4-tuples per emotion. Since each nonword occurs on average in eight 4-tuples, and three different annotators evaluate the same words, each word is involved in = 24 best-worst judgments. In contrast to the study design of Kiritchenko and Mohammad (2016), who ensure that the same tuple is evaluated by multiple annotators, in our setup the nonword are the unit being evaluated by the three annotators (but the tuples may differ for each of them). For us, one particular tuple might be annotated by less than three annotators.
Therefore, we compute the SHR by randomly placing one or two annotations per tuple in one bin and the remaining ones, if any exists, for the tuple in another bin. Then, two sets of intensity values (and rankings) are computed from the annotations in each of the two bins. This process is repeated 100 times, and the correlations between the two sets of rankings and intensity values are averaged per emotion (Mohammad and Bravo-Marquez, 2017b).
First Phoneme
 \foreach
ıin 2,…,7 
Last Phoneme
 \foreachıin 9,…,14
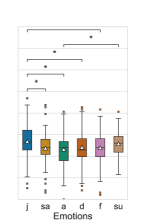
In General
 \foreachıin 16,…,21
4.2 Relation Between Phonemes and Emotion Intensities
Motivated by previous work on the emotional import of word sounds (e.g., Adelman et al., 2018), we now analyse the relation between specific phonemes and emotion intensities across our set of emotions in our 272 annotated nonsense words.
4.2.1 Experimental Setting
For the phoneme analysis, we consider pronunciation, as it is provided in the ARC Nonword Database. Pronounciation follows the DISC character set of 42 symbols to represent 42 phonemes.101010https://www.cogsci.mq.edu.au/research/resources/nwdb/phonemes.html We convert such representation to ARPAbet for consistency with real word representations that are required for computational modelling (see Section 5).
We focus on the three most frequent phonemes from each of the top 10 nonword lists in Table 3. The selection results in the eight phonemes /p/, /t/, /s/, /sh/, /f/, /m/, /l/, and /r/.111111Examples for these phonemes are /p/ as in pie, /t/ as in tie, /s/ as in sigh, /sh/ as in shy, /f/ as in fight, /m/ as in my, /l/ as in lie, and /r/ as in rye (https://en.wikipedia.org/w/index.php?title=ARPABET&oldid=1062602312). Next, we separate the words that have such phonemes in the first or last position, or contain them in any position, and we compare the distributions of their respective intensities for each emotion. We calculate the p-values for the differences between the distributions with Welch’s t-test. We perform the t-test on sets of emotion intensity scores that correspond to pairs of emotions, for the same phoneme and the same position.
4.2.2 Results
Figure 3 illustrates the distributions of emotion intensities for the chosen phonemes. The first row of plots corresponds to the distribution for the subset of words in which the phoneme appears in the first position of the nonword, the second row to the appearance as a last phoneme, and the third row relates to nonwords containing that phoneme at any possible position. Differences between emotions that have a p-value below 0.05 are denoted with a . We limit our discussion to these cases.
1st Phoneme.
For the phonemes /p/, /s/, /sh/, and /m/, certain emotion pairs show a p-value below 5%. For /p/ and /s/, joy has the highest median intensity (as in splink, spreece, snusp), and anger the lowest. Examples for low joy intensities which still have an /s/ at the beginning are slanc or scunch – but other parts of the nonword also seem to play an important role here. Surprise has a stronger intensity than all other emotions for items with /sh/ in first position, particularly in comparison to fear (p.05 only for joy/fear). Examples for strongly surprise-loaded words are shrizz, shrier, and shoach. Counterexamples are shogue and shuilt.
Another noteworthy pattern is observable with the phoneme /m/, for which joy is substantially higher than sadness. It should be noted, however, that there are only three instances in our dataset starting with /m/ (i.e., maut, marve, mauge).
An interesting case is the occurrence of /t/ and its relation to anger intensities. These values cover a wide interval: examples for high anger degrees are terve, trasque, and tource, low intensity ones are tish and twauve. We hypothesize that the combination of /t/ with /r/ might be relevant.
Last Phoneme.
Interestingly, and in contradiction to our expectations based on previous work, the occurrences of last phonemes of nonwords are related to a set of differences in emotion intensities. For /p/, disgust nonwords have the highest intensity, being clearly different from anger as well as fear, which are associated with comparably low values. /sh/, which showed interesting patterns in the first phoneme relative to surprise, contributes most to joy when found in the last position (as in tish), in contrast to instances that evoke negative emotions like anger.
General.
The analysis of phonemes independent of their positions leads more often to comparably low p-values due to larger numbers of words in each set. The patterns, however, by and large resemble the observations for the first and the last phonemes.
5 Modeling
Our analysis has revealed that particular phonemes are indeed related to high intensities for some emotions. In the following section, we aim at understanding if these findings are exploited by computational models that perform emotion intensity regression (i.e., if these models perform better when they observe specific character sequences or phoneme sequences), and if a model that is trained on real words can generalize the learned emotion associations to nonsense words (or the other way around).
5.1 Experimental Setting
As for our architecture, we build on top of the model proposed by Köper et al. (2017) for Tweets. This model is a combination of a convolutional neural network with a bidirectional long short-term memory model. We opt against using a pre-trained transfomer approach like BERT Devlin et al. (2019), to have full control over input sequences – we use character or phoneme sequences as input. These are represented as 300 dimensional embeddings, with the maximal sequence length being 16, which corresponds to the longest input sequence in our corpus (including real words from NRC-EIL, see below). We apply a dropout rate of 0.25, convolutions with window size of 3, followed by a max pooling layer of size 2 and a BiLSTM.
Train/Test Split.
We divide the 272 data points into a train set of 204 nonsense words and a test set of 68 nonsense words. We further use the NRC-EIL lexicon Mohammad (2018) with 1268 words for joy, 1298 for sadness, 1483 for anger, 1094 for disgust, 1765 for fear, and 585 for surprise. We also split this corpus into train/test set, with 75 % of the data for training.
Phoneme Representation.
We represent both nonsense words and real words as phoneme sequences following the ARPAbet representation. For the words from the NRC-EIL, we obtain the ARPAbet pronunciation from the Carnegie Mellon University (CMU) Pronouncing Dictionary (CMUdict). For words that are not included in CMUdict, we use the LOGIOS Lexicon Tool, which adds normalization heuristics on top of CMUdict.121212CMUdict: http://www.speech.cs.cmu.edu/cgi-bin/cmudict, LOGIOS: http://www.speech.cs.cmu.edu/tools/lextool.html. Both URLs are not available as of April 2022. The websites can be accessed via the Wayback Machine at https://web.archive.org/web/20211109084743/http://www.speech.cs.cmu.edu/tools/lextool.html and https://web.archive.org/web/20210815020323/http://www.speech.cs.cmu.edu/tools/lextool.html.
Input Embeddings.
We compare two input representations, character embeddings and phoneme embeddings. For the character representations, we use pretrained FastText embeddings, which provide character-level information. These embeddings are trained on 400 million Tweets Godin (2019). We train the phoneme embeddings on the established corpus of 7392 sentences by Synnaeve (2015) which is based on the DARPA TIMIT Acoustic-Phonetic Continuous Speech Corpus (Garofolo et al., 1993).

Model Variants.
We compare models that differ in the following parameters: (1) input representation (characters/phonemes), (2) n-grams length over characters/phonemes (1/2/3 grams), (3) input training data (real words from NRC-EIL, our nonsense words). The reason for considering different n-grams is that, in addition to the standard use of unigrams, we also want to investigate 2- and 3-grams under the assumption that the inter-word relationship can be better captured with n-grams. The FastText embeddings provide the capability to work with n-grams out-of-the-box. We do not fine-tune the pre-trained embeddings for the respective prediction task.
For each of the 12 models, we train a separate regressor per emotion, as an alternative to multi-task models. This choice prevents the output emotion labels from interacting in the intensity predictions. Furthermore, preliminary experiments helped us establish that joint multi-task models are inferior to single regressors for our task.
5.2 Results
Figure 4 summarizes the results of our 12 emotion intensity prediction models and presents the performance using Pearson correlation (). Numbers are average values over the results per emotion.
We first consider the models when tested on nonsense words (the left 12 bars in the figure). The phoneme-based models trained on nonsense words show slightly higher performance than the character-based models, but all these models are clearly outperformed by character-based models trained on real words. Therefore, we conclude that a model trained on real words does enable emotion intensity prediction on nonsense words, though to a limited degree (=0.17). This is in accordance with the fact that human annotators declared to relate some of their judgments to existing English terms.
On the other side, testing on real words reveals a low performance of the models that were trained on nonsense words: the meaning of real words seems to dominate over phonetic patterns to take emotion decisions, which is a type of information that cannot be relied upon when training on nonwords. We should acknowledge, however, that this setup provided the models with an exceptionally limited amount of data, thus making it difficult to conclude that phonetic patterns do not play any role in automatic emotion inferences.
6 Conclusion & Future Work
We addressed the question of whether humans associate emotion intensities with nonsense words and tested if machine learning-based regressors pick up phonetic patterns to make emotion intensity predictions. Our annotation study revealed that humans do indeed make such associations. Especially the first phoneme of a word influences the resulting emotion intensity judgement: /p/ and /s/ seem to increase the perception of joy, /sh/ of surprise, and /m/ is more likely related to sadness. Contrary to our assumptions, phonemes placed at the last position of a nonword also play an important role. The phoneme /p/, for instance, points towards an increased degree of disgust.
We found that our emotion intensity regressors do predict emotion intensity based on word form and pronunciation, although only to a limited degree for nonsense words. Training on nonsense items and testing on real vocabulary entries results in a low performance, thus indicating that the meaning of known words overrules patterns that can be deduced from nonsense ones. When learned the other way around, our computational models make use of patterns found in real words that, to some degree, allow the emotion intensity prediction on nonsense counterparts.
One limitation of this first study of written nonsense words and their emotion association is the comparably limited size of the corpus we compiled. Future work could perform the annotation study with more items and across more diverse sets of annotators. Furthermore, our analysis focused on single phonemes that we selected based on their frequency in the data. This way of selecting the phonemes under investigation neglects the dependence between their frequencies and their positions. It also disregards potential interactions between different phonemes, as well as the role of less frequent phonemes in emotion intensity decisions. Future work should take into account these types of considerations.
Acknowledgements
We thank Sebastian Padó for helpful discussions. This research is funded by the German Research Council (DFG), project “Computational Event Analysis based on Appraisal Theories for Emotion Analysis” (CEAT, project number KL 2869/1-2).
References
- Adelman et al. (2018) James S. Adelman, Zachary Estes, and Martina Cossu. 2018. Emotional sound symbolism: Languages rapidly signal valence via phonemes. Cognition, 175:122–130.
- Aman and Szpakowicz (2007) Saima Aman and Stan Szpakowicz. 2007. Identifying expressions of emotion in text. In Text, Speech and Dialogue, pages 196–205, Berlin, Heidelberg. Springer Berlin Heidelberg.
- Bakhtiar et al. (2007) Mehdi Bakhtiar, Dehqan Abad Ali, and Seif Sadegh. 2007. Nonword repetition ability of children who do and do not stutter and covert repair hypothesis. Indian Journal of Medical Sciences, 61(8):462–470.
- Bond and Stevens (1969) Barbara Bond and Stanley S Stevens. 1969. Cross-modality matching of brightness to loudness by 5-year-olds. Perception & Psychophysics, 6(6):337–339.
- Bostan et al. (2020) Laura Ana Maria Bostan, Evgeny Kim, and Roman Klinger. 2020. GoodNewsEveryone: A corpus of news headlines annotated with emotions, semantic roles, and reader perception. In Proceedings of the 12th Language Resources and Evaluation Conference, pages 1554–1566, Marseille, France. European Language Resources Association.
- Bostan and Klinger (2018) Laura-Ana-Maria Bostan and Roman Klinger. 2018. An analysis of annotated corpora for emotion classification in text. In Proceedings of the 27th International Conference on Computational Linguistics, pages 2104–2119, Santa Fe, New Mexico, USA. Association for Computational Linguistics.
- Cassani et al. (2020) Giovanni Cassani, Yu-Ying Chuang, and R Harald Baayen. 2020. On the Semantics of Nonwords and Their Lexical Category. Journal of Experimental Psychology: Learning, Memory, and Cognition, 46(4):621–637.
- Chaffar and Inkpen (2011) Soumaya Chaffar and Diana Inkpen. 2011. Using a heterogeneous dataset for emotion analysis in text. In Advances in Artificial Intelligence, pages 62–67, Berlin, Heidelberg. Springer Berlin Heidelberg.
- Chuang et al. (2019) Yu-Ying Chuang, Marie-lenka Vollmer, Elnaz Shafaei-Bajestan, Susanne Gahl, Peter Hendrix, and R Harald Baayen. 2019. On the processing of nonwords in word naming and auditory lexical decision. In Proceedings of the 19th International Congress of Phonetic Sciences, Melbourne, Australia 2019, pages 1233–1237. Australasian Speech Science and Technology Association Inc.
- Chuang et al. (2021) Yu-Ying Chuang, Marie Lenka Vollmer, Elnaz Shafaei-Bajestan, Susanne Gahl, Peter Hendrix, and R Harald Baayen. 2021. The processing of pseudoword form and meaning in production and comprehension: A computational modeling approach using linear discriminative learning. Behavior research methods, 53(3):945–976.
- Davis et al. (2019) Charles P. Davis, Hannah M. Morrow, and Gary Lupyan. 2019. What Does a Horgous Look Like? Nonsense Words Elicit Meaningful Drawings. Cognitive Science, 43(10):e12791.
- Devlin et al. (2019) Jacob Devlin, Ming-Wei Chang, Kenton Lee, and Kristina Toutanova. 2019. BERT: Pre-training of Deep Bidirectional Transformers for Language Understanding. In Proceedings of the 2019 Conference of the North American Chapter of the Association for Computational Linguistics: Human Language Technologies, Volume 1 (Long and Short Papers), pages 4171–4186, Minneapolis, Minnesota. Association for Computational Linguistics.
- Duppada and Hiray (2017) Venkatesh Duppada and Sushant Hiray. 2017. Seernet at EmoInt-2017: Tweet emotion intensity estimator. In Proceedings of the 8th Workshop on Computational Approaches to Subjectivity, Sentiment and Social Media Analysis, pages 205–211, Copenhagen, Denmark. Association for Computational Linguistics.
- D’Onofrio (2014) Annette D’Onofrio. 2014. Phonetic Detail and Dimensionality in Sound-shape Correspondences: Refining the Bouba-Kiki Paradigm. Language and Speech, 57(3):367–393.
- Ekman (1999) Paul Ekman. 1999. Basic Emotions, chapter 3. John Wiley & Sons, Ltd.
- Garofolo et al. (1993) John S. Garofolo, Lori F. Lamel, William M. Fisher, Jonathan G. Fiscus, David S. Pallett, Nancy L. Dahlgren, and Victor Zue. 1993. TIMIT acoustic-phonetic continuous speech corpus. Linguistic Data Consortium.
- Godin (2019) Fréderic Godin. 2019. Improving and Interpreting Neural Networks for Word-Level Prediction Tasks in Natural Language Processing. Ph.D. thesis, Ghent University, Belgium.
- Goel et al. (2017) Pranav Goel, Devang Kulshreshtha, Prayas Jain, and Kaushal Kumar Shukla. 2017. Prayas at EmoInt 2017: An Ensemble of Deep Neural Architectures for Emotion Intensity Prediction in Tweets. In Proceedings of the 8th Workshop on Computational Approaches to Subjectivity, Sentiment and Social Media Analysis, pages 58–65, Copenhagen, Denmark. Association for Computational Linguistics.
- Keuleers and Brysbaert (2010) Emmanuel Keuleers and Marc Brysbaert. 2010. Wuggy: A multilingual pseudoword generator. Behavior Research Methods, 42(3):627–633.
- Kiritchenko and Mohammad (2016) Svetlana Kiritchenko and Saif M. Mohammad. 2016. Capturing reliable fine-grained sentiment associations by crowdsourcing and best–worst scaling. In Proceedings of the 2016 Conference of the North American Chapter of the Association for Computational Linguistics: Human Language Technologies, pages 811–817, San Diego, California. Association for Computational Linguistics.
- Köhler (1970) Wolfgang Köhler. 1970. Gestalt Psychology. Liveright, New York.
- Köper et al. (2017) Maximilian Köper, Evgeny Kim, and Roman Klinger. 2017. IMS at EmoInt-2017: Emotion Intensity Prediction with Affective Norms, Automatically Extended Resources and Deep Learning. In Proceedings of the 8th Workshop on Computational Approaches to Subjectivity, Sentiment and Social Media Analysis, Copenhagen, Denmark. Workshop at Conference on Empirical Methods in Natural Language Processing, Association for Computational Linguistics.
- Louviere et al. (2015) Jordan J. Louviere, Terry N. Flynn, and A. A. J. Marley. 2015. Best-Worst Scaling: Theory, Methods and Applications. Cambridge University Press.
- Majid (2012) Asifa Majid. 2012. Current emotion research in the language sciences. Emotion Review, 4(4):432–443.
- Marks (1987) Lawrence E. Marks. 1987. On cross-modal similarity: Auditory–visual interactions in speeded discrimination. Journal of Experimental Psychology: Human Perception and Performance, 13(3):384.
- Mohammad (2012) Saif Mohammad. 2012. #emotional tweets. In *SEM 2012: The First Joint Conference on Lexical and Computational Semantics – Volume 1: Proceedings of the main conference and the shared task, and Volume 2: Proceedings of the Sixth International Workshop on Semantic Evaluation (SemEval 2012), pages 246–255, Montréal, Canada. Association for Computational Linguistics.
- Mohammad (2018) Saif Mohammad. 2018. Word affect intensities. In Proceedings of the Eleventh International Conference on Language Resources and Evaluation (LREC 2018), Miyazaki, Japan. European Language Resources Association (ELRA).
- Mohammad and Bravo-Marquez (2017a) Saif Mohammad and Felipe Bravo-Marquez. 2017a. Emotion intensities in tweets. In Proceedings of the 6th Joint Conference on Lexical and Computational Semantics (*SEM 2017), pages 65–77, Vancouver, Canada. Association for Computational Linguistics.
- Mohammad and Bravo-Marquez (2017b) Saif Mohammad and Felipe Bravo-Marquez. 2017b. WASSA-2017 shared task on emotion intensity. In Proceedings of the 8th Workshop on Computational Approaches to Subjectivity, Sentiment and Social Media Analysis, pages 34–49, Copenhagen, Denmark. Association for Computational Linguistics.
- Mohammad et al. (2018) Saif Mohammad, Felipe Bravo-Marquez, Mohammad Salameh, and Svetlana Kiritchenko. 2018. SemEval-2018 task 1: Affect in tweets. In Proceedings of The 12th International Workshop on Semantic Evaluation, pages 1–17, New Orleans, Louisiana. Association for Computational Linguistics.
- Mohammad and Turney (2010) Saif Mohammad and Peter Turney. 2010. Emotions Evoked by Common Words and Phrases: Using Mechanical Turk to Create an Emotion Lexicon. In Proceedings of the NAACL HLT 2010 Workshop on Computational Approaches to Analysis and Generation of Emotion in Text, pages 26–34, Los Angeles, CA. Association for Computational Linguistics.
- Mohammad and Turney (2013) Saif M. Mohammad and Peter D. Turney. 2013. Crowdsourcing a Word-Emotion Association Lexicon. Computational Intelligence, 29(3):436–465.
- Mondloch and Maurer (2004) Catherine J. Mondloch and Daphne Maurer. 2004. Do small white balls squeak? Pitch-object correspondences in young children. Cognitive, Affective, & Behavioral Neuroscience, 4(2):133–136.
- Myers-Schulz et al. (2013) Blake Myers-Schulz, Maia Pujara, Richard C Wolf, and Michael Koenigs. 2013. Inherent emotional quality of human speech sounds. Cognition and Emotion, 27(6):1105–1113.
- Plutchik (2001) Robert Plutchik. 2001. The nature of emotions: Human emotions have deep evolutionary roots, a fact that may explain their complexity and provide tools for clinical practice. American Scientist, 89(4):344–350.
- Rastle et al. (2002) Kathleen Rastle, Jonathan Harrington, and Max Coltheart. 2002. 358,534 nonwords: The ARC nonword database. The Quarterly Journal of Experimental Psychology Section A, 55(4):1339–1362.
- Russell (1980) James A. Russell. 1980. A Circumplex Model of Affect. Journal of Personality and Social Psychology, 39(6):1161–1178.
- Scherer (2005) Klaus R Scherer. 2005. What are emotions? And how can they be measured? Social Science Information, 44(4):695–729.
- Schuff et al. (2017) Hendrik Schuff, Jeremy Barnes, Julian Mohme, Sebastian Padó, and Roman Klinger. 2017. Annotation, Modelling and Analysis of Fine-Grained Emotions on a Stance and Sentiment Detection Corpus. In Proceedings of the 8th Workshop on Computational Approaches to Subjectivity, Sentiment and Social Media Analysis, pages 13–23, Copenhagen, Denmark. Association for Computational Linguistics.
- Strapparava and Mihalcea (2007) Carlo Strapparava and Rada Mihalcea. 2007. SemEval-2007 task 14: Affective text. In Proceedings of the Fourth International Workshop on Semantic Evaluations (SemEval-2007), pages 70–74, Prague, Czech Republic. Association for Computational Linguistics.
- Synnaeve (2015) Gabriel Synnaeve. 2015. Speech Embeddings. Github Repository at https://github.com/syhw/speech_embeddings.
- Traxler and Gernsbacher (2006) Matthew J. Traxler and Morton A. Gernsbacher, editors. 2006. Handbook of Psycholinguistics. Elsevier.
- Warriner et al. (2013) Amy Beth Warriner, Victor Kuperman, and Marc Brysbaert. 2013. Norms of valence, arousal, and dominance for 13,915 English lemmas. Behavior Research Methods, 45(4):1191–1207.
Appendix
Appendix A Best and Worst Predictions of Models on Nonwords
| joy | sadness | anger | disgust | fear | surprise | |
|---|---|---|---|---|---|---|
| Best Predictions | bange | gnirl | zunch | plert | phlump | scrare |
| groose | drusp | sout | twauve | cruck | twale | |
| cisp | shuilt | swetch | framn | cliege | gnewn | |
| gnirl | scrare | wholk | sout | purf | psoathe | |
| broin | throoch | chuile | gnirl | snoob | phreum | |
| chuile | prote | cisp | throoch | scrol | theight | |
| swetch | phrouth | framn | theph | chuwk | grulch | |
| shuilt | zunch | preak | purf | grulch | cliege | |
| kass | theight | yirp | cisp | twale | thwick | |
| throoch | flalf | dwull | zorce | ghuge | plert | |
| Worst Predictions | purf | hupe | snusp | ghuge | bange | blidge |
| snoob | snoob | broin | grulch | phreum | zel | |
| cruck | phype | shrote | slanc | gnirl | cheff | |
| plert | broin | blidge | shrote | snusp | dwull | |
| snusp | dwear | slanc | groose | psoathe | purf | |
| skief | wholk | phrouth | thwick | phrouth | ghuge | |
| yirp | skief | plert | hupe | broin | throoch | |
| slanc | slanc | scrol | cruck | pseach | snoob | |
| choff | sout | skief | fonk | slanc | cisp | |
| yourse | preak | shuilt | theight | chuile | pseach |
| joy | sadness | anger | disgust | fear | surprise | |
|---|---|---|---|---|---|---|
| Best Predictions | blidge | slanc | blour | phype | tource | sloarse |
| wholk | theph | drusp | twauve | twarp | preak | |
| yirp | zel | plert | twale | grulch | phrouth | |
| cheff | twauve | ghuge | phreum | yirp | gnewn | |
| hupe | bange | zant | fonk | sout | choff | |
| shrote | valf | wholk | yourse | swetch | phreum | |
| dwull | cliege | rhulch | zerge | cliege | glelve | |
| gnewn | grulch | cruck | scrare | scrol | cruck | |
| framn | phrouth | snoob | gnewn | sloarse | grulch | |
| yealt | gnirl | gnirl | scrush | dwull | psoathe | |
| Worst Predictions | snoob | ghuge | blidge | valf | phrouth | zel |
| theph | phlump | broin | shrote | prote | throoch | |
| thwick | chuick | valf | scrol | snusp | twale | |
| chymn | prote | chuile | phrouth | chuile | chymn | |
| snusp | chuile | swetch | skief | psoathe | scrare | |
| preak | zunch | snusp | dwull | cheff | purf | |
| swetch | purf | phrouth | zunch | shuilt | kass | |
| twale | yealt | zorce | prote | chymn | twauve | |
| yourse | swetch | sout | chymn | bange | bange | |
| cisp | choff | tource | ghuge | broin | snusp |
Appendix B Excerpt from our lexicon of nonsense words with emotion intensity annotations
| IDs | Word | ARPA Pron | Real | Joy | Sadness | Anger | Disgust | Fear | Surprise |
|---|---|---|---|---|---|---|---|---|---|
| 0 | afraid | ah f r ey d | 1 | 0.3125 | 0.8333 | 0.3333 | 0.1875 | 0.6875 | 0.3333 |
| 1 | alse | ae l s | 0 | 0.6875 | 0.4375 | 0.5625 | 0.4792 | 0.4375 | 0.5625 |
| 2 | apache | ah p ae ch iy | 1 | 0.2917 | 0.6458 | 0.7708 | 0.4792 | 0.5 | 0.5833 |
| 3 | aphid | ae f ih d | 1 | 0.3333 | 0.625 | 0.4792 | 0.5625 | 0.6042 | 0.3125 |
| 4 | bale | b ey l | 1 | 0.5 | 0.5208 | 0.4167 | 0.3542 | 0.4583 | 0.0833 |
| 5 | bange | b ae n jh | 0 | 0.375 | 0.4375 | 0.6458 | 0.6042 | 0.7917 | 0.75 |
| 6 | battle | b ae t ah l | 1 | 0.1667 | 1.0 | 0.9583 | 0.7083 | 0.7292 | 0.5417 |
| 7 | bias | b ay ah s | 1 | 0.2292 | 0.5625 | 0.5625 | 0.4167 | 0.5417 | 0.4375 |
| 8 | bizarre | b ah z aa r | 1 | 0.4583 | 0.625 | 0.6042 | 0.5417 | 0.4792 | 0.5833 |
| 9 | bleve | b l iy v | 0 | 0.4792 | 0.4167 | 0.3125 | 0.375 | 0.4167 | 0.5417 |
| 10 | blidge | b l ih jh | 0 | 0.6042 | 0.4375 | 0.7083 | 0.4583 | 0.6042 | 0.7292 |
| 11 | blister | b l ih s t er | 1 | 0.4375 | 0.625 | 0.4375 | 0.625 | 0.7083 | 0.4583 |
| 12 | blour | b l aw r | 0 | 0.4583 | 0.5833 | 0.4375 | 0.4167 | 0.3125 | 0.6042 |
| 13 | blurnt | b l er n t | 0 | 0.5 | 0.4375 | 0.3542 | 0.3958 | 0.3958 | 0.5 |
| 14 | blusp | b l ah s p | 0 | 0.5417 | 0.5417 | 0.6458 | 0.5208 | 0.4583 | 0.4792 |
| 15 | boarse | b ow r s | 0 | 0.2708 | 0.6875 | 0.7708 | 0.8542 | 0.8542 | 0.5417 |
| 16 | boil | b oy l | 1 | 0.2708 | 0.75 | 0.75 | 0.3958 | 0.3958 | 0.3333 |
| 17 | bowels | b aw ah l z | 1 | 0.0833 | 0.5208 | 0.4792 | 0.8333 | 0.5 | 0.4583 |
| 18 | break | b r ey k | 1 | 0.6875 | 0.7917 | 0.6458 | 0.3125 | 0.2917 | 0.4792 |
| 19 | broil | b r oy l | 1 | 0.25 | 0.7083 | 0.875 | 0.75 | 0.7917 | 0.3333 |
| 20 | broin | b r oy n | 0 | 0.375 | 0.6458 | 0.8125 | 0.5833 | 0.6875 | 0.5208 |
| … | |||||||||
| 319 | whalk | w ae l k | 0 | 0.6458 | 0.3333 | 0.2708 | 0.3125 | 0.5417 | 0.5625 |
| 320 | wheuth | w uw th | 0 | 0.6875 | 0.4375 | 0.5 | 0.5417 | 0.5208 | 0.625 |
| 321 | whoal | w ow l | 0 | 0.6458 | 0.4375 | 0.3333 | 0.375 | 0.3542 | 0.7292 |
| 322 | wholk | w aa l k | 0 | 0.3958 | 0.625 | 0.5 | 0.5417 | 0.5208 | 0.5833 |
| 323 | wrause | r ao s | 0 | 0.4792 | 0.4375 | 0.6875 | 0.625 | 0.5833 | 0.5208 |
| 324 | wrelt | r eh l t | 0 | 0.5833 | 0.5208 | 0.5 | 0.4375 | 0.4375 | 0.3125 |
| 325 | wrilge | r ih l jh | 0 | 0.625 | 0.5208 | 0.4792 | 0.5833 | 0.625 | 0.5 |
| 326 | wrorgue | r ao r g | 0 | 0.3125 | 0.5417 | 0.7083 | 0.625 | 0.8542 | 0.4375 |
| 327 | wruse | r uw s | 0 | 0.4792 | 0.6042 | 0.5417 | 0.5417 | 0.6042 | 0.625 |
| 328 | yage | y ey jh | 0 | 0.3542 | 0.625 | 0.625 | 0.5833 | 0.6667 | 0.4583 |
| 329 | yealt | y iy l t | 0 | 0.3542 | 0.5208 | 0.4583 | 0.4167 | 0.6458 | 0.4375 |
| 330 | yirp | y er p | 0 | 0.4375 | 0.5625 | 0.4167 | 0.5417 | 0.4167 | 0.5417 |
| 331 | yourse | y uw r s | 0 | 0.6458 | 0.3542 | 0.25 | 0.3333 | 0.5208 | 0.5208 |
| 332 | yurch | y er ch | 0 | 0.5625 | 0.5 | 0.4792 | 0.5208 | 0.4583 | 0.5625 |
| 333 | zant | z ae n t | 0 | 0.5417 | 0.3542 | 0.4375 | 0.4792 | 0.4792 | 0.5 |
| 334 | zany | z ey n iy | 1 | 0.7708 | 0.0625 | 0.2708 | 0.3542 | 0.125 | 0.5417 |
| 335 | zel | z eh l | 0 | 0.6667 | 0.375 | 0.5417 | 0.2083 | 0.3958 | 0.75 |
| 336 | zerge | z er jh | 0 | 0.6667 | 0.3333 | 0.4375 | 0.4167 | 0.4375 | 0.5625 |
| 337 | zorce | z ao r s | 0 | 0.4583 | 0.5833 | 0.7917 | 0.6667 | 0.625 | 0.625 |
| 338 | zourse | z ow r s | 0 | 0.5625 | 0.3958 | 0.5833 | 0.5208 | 0.375 | 0.6458 |
| 339 | zunch | z ah n ch | 0 | 0.4583 | 0.6667 | 0.625 | 0.7292 | 0.7083 | 0.4375 |
Appendix C Complete Nonsense Word Emotion Intensity Lexicon
Copy-paste the following character sequence into a plain text file
with the name data.txt and execute
base64 -d < data.txt | bzcat > nonsense-words-emotion-intensities.csv
QlpoOTFBWSZTWdlU38YAIfpfgEAQQAF/6CUwWIA///+wYB3wPY1UFBfefHd1y7Z2WwdmpRkdpzhgF2zo63GoO7KoaN
ngAAAAAAgAAfRuwRvttc4gPumOpUnGGmhB6iBMgmhU09TKNmpMnkGmCRRBNEmnqeUMgAABJlSKSfooADIaAAABJ6pU
JMSgAMgAAABo0KTRoGgAyB6jQNNASahETRJkamTRoAAAOZgzP2ec8Bz1cRKPswRYFaYoY0bIsJSKNlLgbQSQD9NZOx
XQgJaC2o7QVhjaqjBkScQOGKwSyq2o2RRJFNQohe5ocTsDEZEhiRbYYZabmu4CJEkii8bIsITyAiNZCC4zEiFIwERG
gjigibYSPG6YTcbgYSEhZJCJQljM7qoYlYEKxLO7EqXaqmV3LtbL3BN17zZPNbN3/L5Ir/X+75pf//StJTrV50QeC7
/nR9BmjY1sZkPojGpFA7yDpvX+sacZ20nNtp4NNXOuloNNLTvpWs0zqXjekbOKYpFTvauaZMGp3NzBsZtvKVuGOdbe
vnq9z6rtc+44sO3/EM4+UNRh6pVw/8qwwA44gbUc3NCooX7OLZrzKe0YMbzZGxjB4V8S3Hp8xx3eeeYiFPp49b6PXo
T58/pWjruopCGq/KzxYVk9uwR3rmUHMDa2VY0qVKl97QLmj1t2mb0j21DyfUj4MPjnnhb6tr0kfSTYvjoFIAY+CF7h
cvOnfHNBbPOObE17fBBPCPbbbRWpnVpFuPfTJDfddHsdIJ7zEwcPkryX7Xm0BatKxeuJF4gcKOIevsfNEHere3u01Q
hTo+SQmdT4p6W+DqubA/CiJTIKTp1IgivW99ab6512gXvvzN7dqsjZ3xLvsetwGBaRix4p2aEdWqA+o7+CPwfj5JQQ
QKxp0wfP2/ALRu/NcBrN0ib10TxJO77d84RtOjyKNGlBJBBAy7zx4nSOlHpGv4DCICM9UQfkeJpxBw/AI1KKYN+ZUH
SHqWfHSANlVXeipeGyJNcfgzZYG9Z73PNK6dO9HgoEnqvEfXnauEeLCmxg4kDBrBkW1pqZrQVOXW2pk6kSYjRVZjlL
dU1XjTk8PPWPs+4hPqFSEhJJ+OMbbbX1fTV9+5zlXA/HbdONhcC4d11V0BznKn7BBcZBcr0AkguViUiqTYKEgSJiRl
KGijbBkoizNGo0GjYBsnnvPnx48e3lo2LRABmYlgD/ilKft/dL8frokkkkkkkkkkkjXRu4eIMm9buQu7LgwztKhTRV
UMSqWRiymazFRLla0IqzScxx71dyF3dw1AEmZlyF3dkyQfBCB0wHV7e3t6r1ExizN6tN0GCiGksloMaSxFWSJSIoii
xFGta1cmyAhmZchd3yEAJmZrppnOdEkkkkkkkkkklKYkEkEkjz1whESjKQRTT5q+SB4hDmiLIEFJc3zzmSGZlwNhBM
zLkLu7kLu67mmotNEUFRigsEezFPKJXTVIsCKUoxbKJN3XbGZbhVxMYNGqIxGKjbu4rJyk3SJd3SJpLI4aImBEQR49
982Oc52AGdkhrWrkLu++bkAamMiCKoixJNCnavXj1876YkxoiQSZeVw0oZKAsIJPft2TQMADMoFApSFJgUYKEowZNM
mikMhsSJlEZHt59vbz8fT3+vxlJJJJJJJJJJJMGZqEgliWYsSSQQsVEFVHqQzLs7d4BGoGtauQu7CSbgoBkqQkrchI
kC5EtiqoqrRSYo1GZsaiN3r159Xnz5zISBmZmZmZ3DTFBRioip2Kpipmd3RDuuSaBEEySDBgyJC51Gw7ulIApFUUFi
xTe973t2b3ve5IQ61rWp74wZhZgxCozI0RgTTDIElCWIlopZKNJGkxEliSgwIJBYkEkEsCxBIBBmZmyze+MpJJJJJJ
JJJJLERlmAYYAYVBZgSAwJYMGpSnjyzIWRsL11ySwmQDIIaRKEzQiBMwiaZEwpppmaHr169atb2vPnqrzA72wbmnLk
FFxsuByI7qmGiIlgzBoiHd3d7REVzS2c5ykkkkkkkl48ePHjx48izkF9KBWJoEalzK7UOkVyqNWqFq0U6EclXprKqs
gEnWZmF3dgQm4B2USCgCwFiyCwFSa1rV3dkhDrMzLu+/dEiAxptvW2tObWi2oqJLKDDEpSKilQjGZkiEwRhiRjKJlG
evXr148eL5kZISwWRgHnqqnKKlEoiyEiZcM1KoLOVcuYYUqXZBWgtEELmoVUGrNK2mpnKWpqqSZs0FpJGlnJVlRFUY
qFiVYdRIlmGFs4ZdDpGmaYQZGpBiaWBElrKDJLWmmIqGhiXOGrILWZpUUctRNmRWnTKCIgxM2GMd3GUnd1BDs5xZ3J
dnImXVsK2MZSSSSSSSSSSSWQwYPTrqrz6BFEHCuRfIc1WnUENirjuSWFkaTAkMJKaZGJAc4YyRRRda1VVkhJvk1rWr
u7JAOpC0IqyEWMUaMk8vLeKEiaJCTRmYymwoaQjSyxDCg1LIaMbERt47x5tTREO75GDMzeVfOFlJJJJJJJJJJJWgFp
YZoEhSjKZ9PJ9dtXcRiRQisGCoLDvqyqrrRCZmXd3VXqx5jjtlSahSRSHLOQQVkjKNEio4ETIiJUaQsgzLpxCBILss
gLMi7TtCmC5O7RCZy7MsmC5cVOci0laoF3ffdXYG5zlXAD01r6q1itS9evTXzNIooiElkILTBgikFIxslGImjMwRpp
JjYTIzCgpNMxIGGSJQGAE0mSjx3j39vj2+fn4+vx8JJJJJJJJJJK5MsSCCCQQCCQWJBgiqLDrWu8hLu6qsk0qqDBiA
IvW1dXa1G2yZGjQZtCJgJNAUVk0UWTUxFIsVRFUXWtVVaJN5mYXd9VjU7jckRy5znNgLlYiNzFWjHKqsC7vfAxRgoo
qKxUBJRJiEohMvp2uYlQhkh3boUmNJGTBREUEQgY0SJMUAmSc4DJFFANhACCSQQQSxBIIpSlM0vnOcJJJJJJJJfHx8
fHx8fD58d9Zr3VERsSNKYbz57eEiA2ZFhmQIjEUEVixslSEaNUkKiRFLusJvrWtVVcQOyBxEJKQFgDEsBSlIiIoBEQ
7u7u7vObZws5SSSSSSSSSSSVRMVFyTRi9IehFQWNYdnr+tKyz1Gxw8Ka4K2FtkioQE1oihHBy4hpukNpFomHi5WRNH
Dk0c1MPTQkCeBuQ6DogpNHOPOc27bNZa0h18Tg0aEyG0RAXGYGUbuaA+XjCI4XYkG2UiiF5nLLIERGp0NUWwOcKQ7F
DAN1R1CpFwUHgRLILMYUqdFGx4QkCQxxwTUUGCxSgbaCyFHq0KOMIOpw2LkuOt3SIy25WLMRA40HSWQxqc2kqkSxgH
h1kzTsCCBNoVbwogkAluMMMqKPDKnGGExVZDu2QguTeXZoVYQTILgsd402K0xrjNctYoOIgI0hVGYoWa0HEQZpg5WN
0Uw8NLIpCAMXLbqb2bHHJApbu21G7FJIShII0KzWUoK4I6nvHIt1i8R3aggntBIaRBd4EEbayQWKbENqEk0QrG1alU
TIqIVSZZI6lELyqzSSzDE3skUMnFA0qXRrG7Xk3SqVVzQFpr3UKcOmvEt0icQQvKnrVhZiSChupwg7hQIreMMU43bS
JkShKQRXNFTBocuAk1ThrhSjClhgcvNGu6iSiGNIZogYYQIIQaBlaFVrrIooKQEKaJLohxRcL0RFpvWnAdeWpFmEa6
1pWs0MMmA1Fmya0LlaxxsEiNDTu6cSdTpZEAJO16RBAW0jUKDUWVMJpNOApBQ1hWSOJESSQMV2BJERCKy7c3GktQ0z
NVYIqbtZ1CHnG0eHzGTyDuaTGbEIpSgYX1LY0rtFEBFYQZlPXle6goHoWwIbpQRxnKkmztsJqgxBOxxIOV5DSC3XYE
bkhTbTbKRUYjcCqyViuMx6WFFKtFqLa7bvGuZAdlpj4pprw4UWXG8JLm94gXNDUBRWwN1MPjDJGxyLNQvYxEghV3Q5
3sIOxgwJoIcLrDeVimxlmEkkklnWZDo2aHgfEN2WYcfEiIaykci0yBGA6Ai9cVSqFIIkSHEnCNRjRO8GrUCFuuHYVE
ncUo1OkTQi0VdArBu7A+uWijSQ0+hBjdFfRwkIzRQzrEQNI3TLkMKDHGpiHKiEIuGGmWiloSFCiLEzx59fz/R9kfsP
y+rpn79n36hfsuwfmXXsClNizUTfJjvl3xzvKIc7954/d4308bD+YNaQ5zXPK/I95pffTs96tnlLTaQV72Dr9KLel3
NYEbP/iyxZYxOmudUtnFiSFbIrM6i6vYGtI0mRXSRCkK85pSJu4N1WLqLEvYg20zF8a7a0WXsdVEuopqbTYRoIwhML
8Y2GrjS4478+LU540ONunzPINLReavDVt1R6gmhsAcIO7xzKzxdG2lqzaytY5RdaYU0r+PLv5PPw7VB2vpDkb8bvt9
d/rx8/fXPPKSSSS+hzrqNuN9999999990kln3pzx37yIj466cVhPYRd6ddddddddddJJJJJJJJLON+eJ8D6fj169Xu
1YqXE+ZtL+HFfHjx48ePHjx4SSWunvtzPP4MCvYitfiZES8nnnnnnnnnnlJJJJJJJJJJJJLA3IznOc1Gc/7U/T7bbR
9e/v5n7IBI8Vfv379+/fv344SS0611222222+LAfGM8ccccbbbL7+e/O+/kOA/XXbt2r9HXy7gjXR+uuuut99990kk
kkkkkkkkkktfvw+oILdjtttttttt4XGmo5n6hyYmkeKN4j6IvLuCLJ7zz1IsKO5/tppSaKmPs5/tP3dVUB/fv379+/
fv37SXW3vXfcc/H1DU5555555555SSSSSSSSSSSSSSSSSSSSSSSSSSXGnBbv67R5LcGvb26uKKTXxaHrNeuuuuuuuu
uySSSSSSSSSSS539a66668Deo457du3bt22222Sx212Ouuuutb22Pwd99999tvz+rfwf8/s/+o/dkKyAAFPxwABX0f
jo8Cp7Z0oUIFVEAiTRZzo3/tMAXIDMSzAasv3P6KwHY7bfvS38X/fI1rgWBmH/mfAwtfyOA2SABu9zpkXfTUuV5Xj+
Hq1ednzagtWzUIO9Jt+T6mY8W5YADrkM5AYsBbF/ffXit2xFaTmZ5CTcAuw3B5OEDB9eHvj+iSnTeyDXX5zfYDy86w
xlHOB4q7RFvK7ZPCIqqkAQA8tY+DaowdZm4Y4pJVnRAYYgMAD5076XL/FYZF+J8084FBe1r9RXatdL5VLseopOtLw4
75nD0F0VtKFnE4mHOYoVjFFWuYFxhKJNoyaQ75KrR3ES32fPy4/5HPDm3le6fXrHiflZpQfLACxZhQScc/U96ZxIVH
xvbHT6BmZ/Ntrvr5yK59Vn4n3t2FW8+M35wh6QRFJBYwD5jTx5+9+Tfy1rfNcJxvAFIcodkSIUhGUyytZK9evdWr3n
WVWYPHCaO1QtmrokrXRZ4YfL2W/Gn5k8uyEeUcXLecn4lXedwO86pdBCSAIBCBQQXJLFiRJpwiXl6jvrrrt7RBVrHB
qlGMEppQzWmsGTjRd55rzXFUshGBZC2goo8jCLLMckQighCU1Hrx3dFMrqsSsCXyxxOfIkcyonQSPv7Wa8GurSANmu
Qvf00rQNEOIEoKAVkw9qVhmpEd+1/PUV6D95b077c9+dsRbayideO2Bp43z5AYDECdCa743IjGuu+JyFmX9adhhfKF
tc/88+nfj028fC6909WQnw9cwDABgiiIrFYosWMZCa6zn23HM69+ZqtVo5PoQ4ZF47UkigsiyCwgGTrdPO09+X31d7
vy9fl8+5nzsMNnq2nmaHEqaqhnHVBa09qcxFmmuL3HEw7nbTRMcA4gXRuS5dw6gTUWsL2GLU5LEksQzDtB500m9LBp
vC4tTZA3Dib0kDLEglgSQCxIDEkszRHpVfJ0fwDaF6uLtSuRiL/FjN40ACH6LGdrY0rlVpV50qK2mZea1FiIADcixH
PPxPi33rt61gW9T8awc0fVx5OPO9W1ppI3wO1LFj6qR9H+RpXqo26302HRrry/jIwQavW1e81iI3+e1J3LUtx8sAWr
z+Z9PG3/fXaCKSIiI1b3oPR+pca+TVRhvPX7PvfvohGDTgjSzqRJInnuEe7k2JvnXKLJZNX0lc2jo7rFrsyy13XJtB
QHIJZyASWBBBNk5dwod+3vvz6MY71l49RTvnQ5BLb+YkeNgtsw2wzTQw+z43LHbdpvLq2I1udmtiJcUvfGwf9qbxpr
xxi1DxL2NH41O5d2Yg7xxBZedtnHPkeh6ee/YePL2e3mLFgoRBhFkAsCxLAlmLBgOf0827SOV4gQgwpbvc0MRE3t3N
64rVYnr2EeUk8EOeHfG9knG6JKHDrVXwkDMd6pdU5oDbJzFVERUZEAbHvjRydO+cHXS9lR5uyESdcVgYrLvYzTDXNX
iHt4hDwQvttfdR4txDcIe3kpGKrdQp/qlgTT7nyxJPE1au5lFqmtZpMcW1o9bRudVft9fjCpm2k98x4xMXTv29frLY
w5qbH+/QmtWHL+mZm7aeRaMJ8dXvmd8qvjvp4nKgpnFBbNYOUUotzGF3KhaZmIrVLQxpozCrBUYFiBxIJBEkIuRn6+
PqPn78/GKYmmhzkgE1pTmqwi7grvjwPQHwgSOBlIMJpANLEs4EmUQ20SmyES2UGSRcqDBuHLnPazYy5k6xksxDd2cY
IgFnWX/6LuSKcKEhsqm/jA==