Probing the magnetic band gap of the ferromagnetic topological insulator MnSb2Te4
Abstract
Mn-rich MnSb2Te4 is a ferromagnetic topological insulator with yet the highest Curie temperature K. It exhibits a magnetic gap at the Dirac point of the topological surface state that disappears above . By scanning tunneling spectroscopy, we probe this gap at different magnetic fields and temperatures. We firstly reveal that the gap size shrinks, when an in-plane magnetic field of up to T is applied, but does not close completely as the magnetization is only partially rotated in-plane. This corroborates the magnetic origin of the gap and the complex magnetic structure. In addition, we demonstrate significant spatiotemporal fluctuations of the gap size at temperatures as low as , above which the remanent magnetization indeed decays. This temperature is close to the antiferromagnetic transition temperature observed for bulk-type single crystals of MnSb2Te4, highlighting the important role of competing magnetic orders in the formation of the favorable ferromagnetic topological insulator. Our study, thus, provides crucial insights into the complex magnetic gap opening of topological insulators that is decisive for quantum anomalous Hall devices.
Corresponding author: M. Morgenstern, email: mmorgens@physik.rwth-aachen.de
The quantum anomalous Hall effect (QAHE) offers quantized conductance and lossless transport without the need for an external magnetic field Onoda03 ; CXLiu08 ; YuScience10 . This implies applications, e.g., in metrology FoxPRB18 . Combining topological insulators (TIs) with transition metal atoms CXLiu08 ; YuScience10 ; Qiao10 ; Tokura19 led to the QAHE in Cr- and V- doped (Bi, Sb)2Te3 Chang13 ; CheckelskyNP14 ; KouPRL14 ; BestwickPRL15 ; Kandala2015 with exact quantization down to a precision of ChangCZNM15 ; GrauerPRB15 ; FoxPRB18 ; GoetzAPL18 ; Okazaki2021 . Fundamentally, the effect is based on the out-of-plane magnetization of ferromagnetically coupled transition metal atoms that opens a gap within the topological surface state. The gap features a non-trivial Chern number via the Berry curvature of the topological Dirac cone Mong2010 ; Zhang2019 ; CXLiu08 ; YuScience10 ; Qiao10 ; Tokura19 . Surprisingly, however, the experimental temperatures required for observing the QAHE ( mK Chang13 ; GrauerPRB15 ) were initially two orders of magnitude lower than the ferromagnetic transition temperature K Zhou2005 ; Figueroa2020 ; CheckelskyNP14 . This has been improved by modulation doping, i.e., by concentrating the magnetic dopants in distinct layers of the topological insulator and, thus, reducing the disorder MogiAPL15 ; Xiao2018 . The QAHE then survives up to K, still much lower than MogiAPL15 ; Xiao2018 , which is likely due to fluctuations of the Dirac point energy caused by electrostatic disorder Chong2020 ; Fijalkowski2021 .
In contrast, intrinsic magnetic topological insulators (MTIs) enabled the observation of the QAHE up to about DengNatPhys2020 . Such MTIs consist of MnX2Te4 septuple layers (X=Bi or Sb) with Te-X-Te-Mn-Te-X-Te stacking Rienks ; HagmannNJP17 ; Wimmer2021 (Fig. 1d). Hence, one extra layer of MnTe is inserted into each quintuple layer X2Te3 of conventional topological insulators YuScience10 ; YeNatComm2015 ; LiMPRL15 . This aims at reducing the disorder compared to randomly substituting X by Cr or V. Accordingly, even for MnxX2Te3+x with , the Mn containing septuple layers are regularly distributed between unperturbed quintuple layers Hu2020 ; Rienks . For such MnxBi2Te3+x, the QAHE indeed appeared up to K (precison %), i.e., very close to the magnetic transition at K DengNatPhys2020 . On the other hand, for MnxBi2Te3+x, the appearance of a magnetically induced gap in the topological surface state EremeevJAC17 ; McQueeneyPRM19 ; McQueeneyPRB19 ; OtrokovAFMTI18 ; ChenPRM20 ; Sekine2021 has remained experimentally controversial Rienks ; Yuan2020 ; OtrokovAFMTI18 ; PRX1 ; PRX3 , which is likely due to its strong sensitivity on sample preparation details as well as due to the predominantly antiferromagnetic coupling of the Mn layers Shikin2021 ; Garnica2022 . In contrast, we have recently revealed that MnSb2Te4 with slight Mn excess is a ferromagnetic topological insulator (TI) with record high K and a pronounced band gap at the Fermi level that opens precisely at and below Wimmer2021 . Moreover, the band gap size was found to be proportional to the magnetization perpendicular to the surface as theoretically expected Rosenberg12 ; Henk2012 . The behaviour of is, however rather complex Wimmer2021 ; Ge2021 ; Lai2021 as it reduces linearly with between /2 and and exhibits a non-saturating magnetic moment of per Mn atom at T Wimmer2021 . In fact, ferromagnetic MnSb2Te4 with slightly different stoichiometry displays a saturation of the magnetization ( per Mn atom) at T only Lai2021 . In addition, nominally stoichiometric MnSb2Te4 shows both ferromagnetism MurakamiPRB19 ; Ge2021 ; liu2021 and antiferromagnetism McQueeneyPRB19 ; ChenPRM20 ; liu2021 depending on the synthesis conditions. This complex magnetic behaviour is most likely related to the partial Mn-Sb exchange within the septuple layers in the few % regime, which strongly depends on the growth conditions liu2021 ; Riberolles2021 ; li2021 ; HuarXiv2020 ; Wimmer2021 ; Lai2021 . On the other hand, it is exactly this Mn-Sb exchange within the Sb layers that is responsible for the favorable combination of TI and ferromagnetic properties in Mn-rich MnSb2Te4 Wimmer2021 ; li2021 .
Here, we probe the change of the ferromagnetic gap in epitaxial MnSb2Te4 by scanning tunneling spectroscopy (STS) as a function of in-plane magnetic fields and at different temperatures. In particular, we demonstrate that the gap of the topological surface state reduces with increasing in-plane field that rotates the magnetization towards the surface, thus decreasing the out-of-plane (see Fig. 1a–c). Since the gap size depends dominantly on Rosenberg12 ; Henk2012 ; Mong2010 ; Sekine2021 , this result corroborates the magnetic origin of the gap. While the applied in-plane field rotates the Mn spins preferentially towards the in-plane direction, a large T is required for complete alignment (Fig. 1c) Wimmer2021 ; Lai2021 . This implies that a moderate leads to a gap reduction with spatial fluctuations instead of a complete closure of the gap. Indeed, we find that the magnetic gap reduces with , but does not close completely up to T, where it exhibits significant spatial variation of the gap size. This is strong additional evidence that the origin of the gap is indeed the topological Dirac cone. Moreover, we find that the gap slowly fluctuates at elevated temperatures towards , where the remanent magnetization starts to decay. We map the spatiotemporal fluctuations by recording sequential gap size maps of the same area, featuring lateral patches of enhanced gap that slowly meander across the surface on the scale of hours, similar to magnetic domains close to a phase transition Shpyrko2007 ; Kronseder2015 ; Lachman16 .
Epitaxial MnSb2Te4 films with 200 nm thickness were grown by molecular beam epitaxy Wimmer2021 and transferred in ultrahigh vacuum to two scanning tunneling microscopes (STMs) operating down to K and K, respectively Mashoff2009 (Supplementary Section S1). The voltage is applied to the sample and the current is measured via the tip. The differential conductivity , proportional to the local density of states (LDOS) of the sample Morgenstern03 , is recorded by lock-in technique after opening the feedback loop at voltage and current .
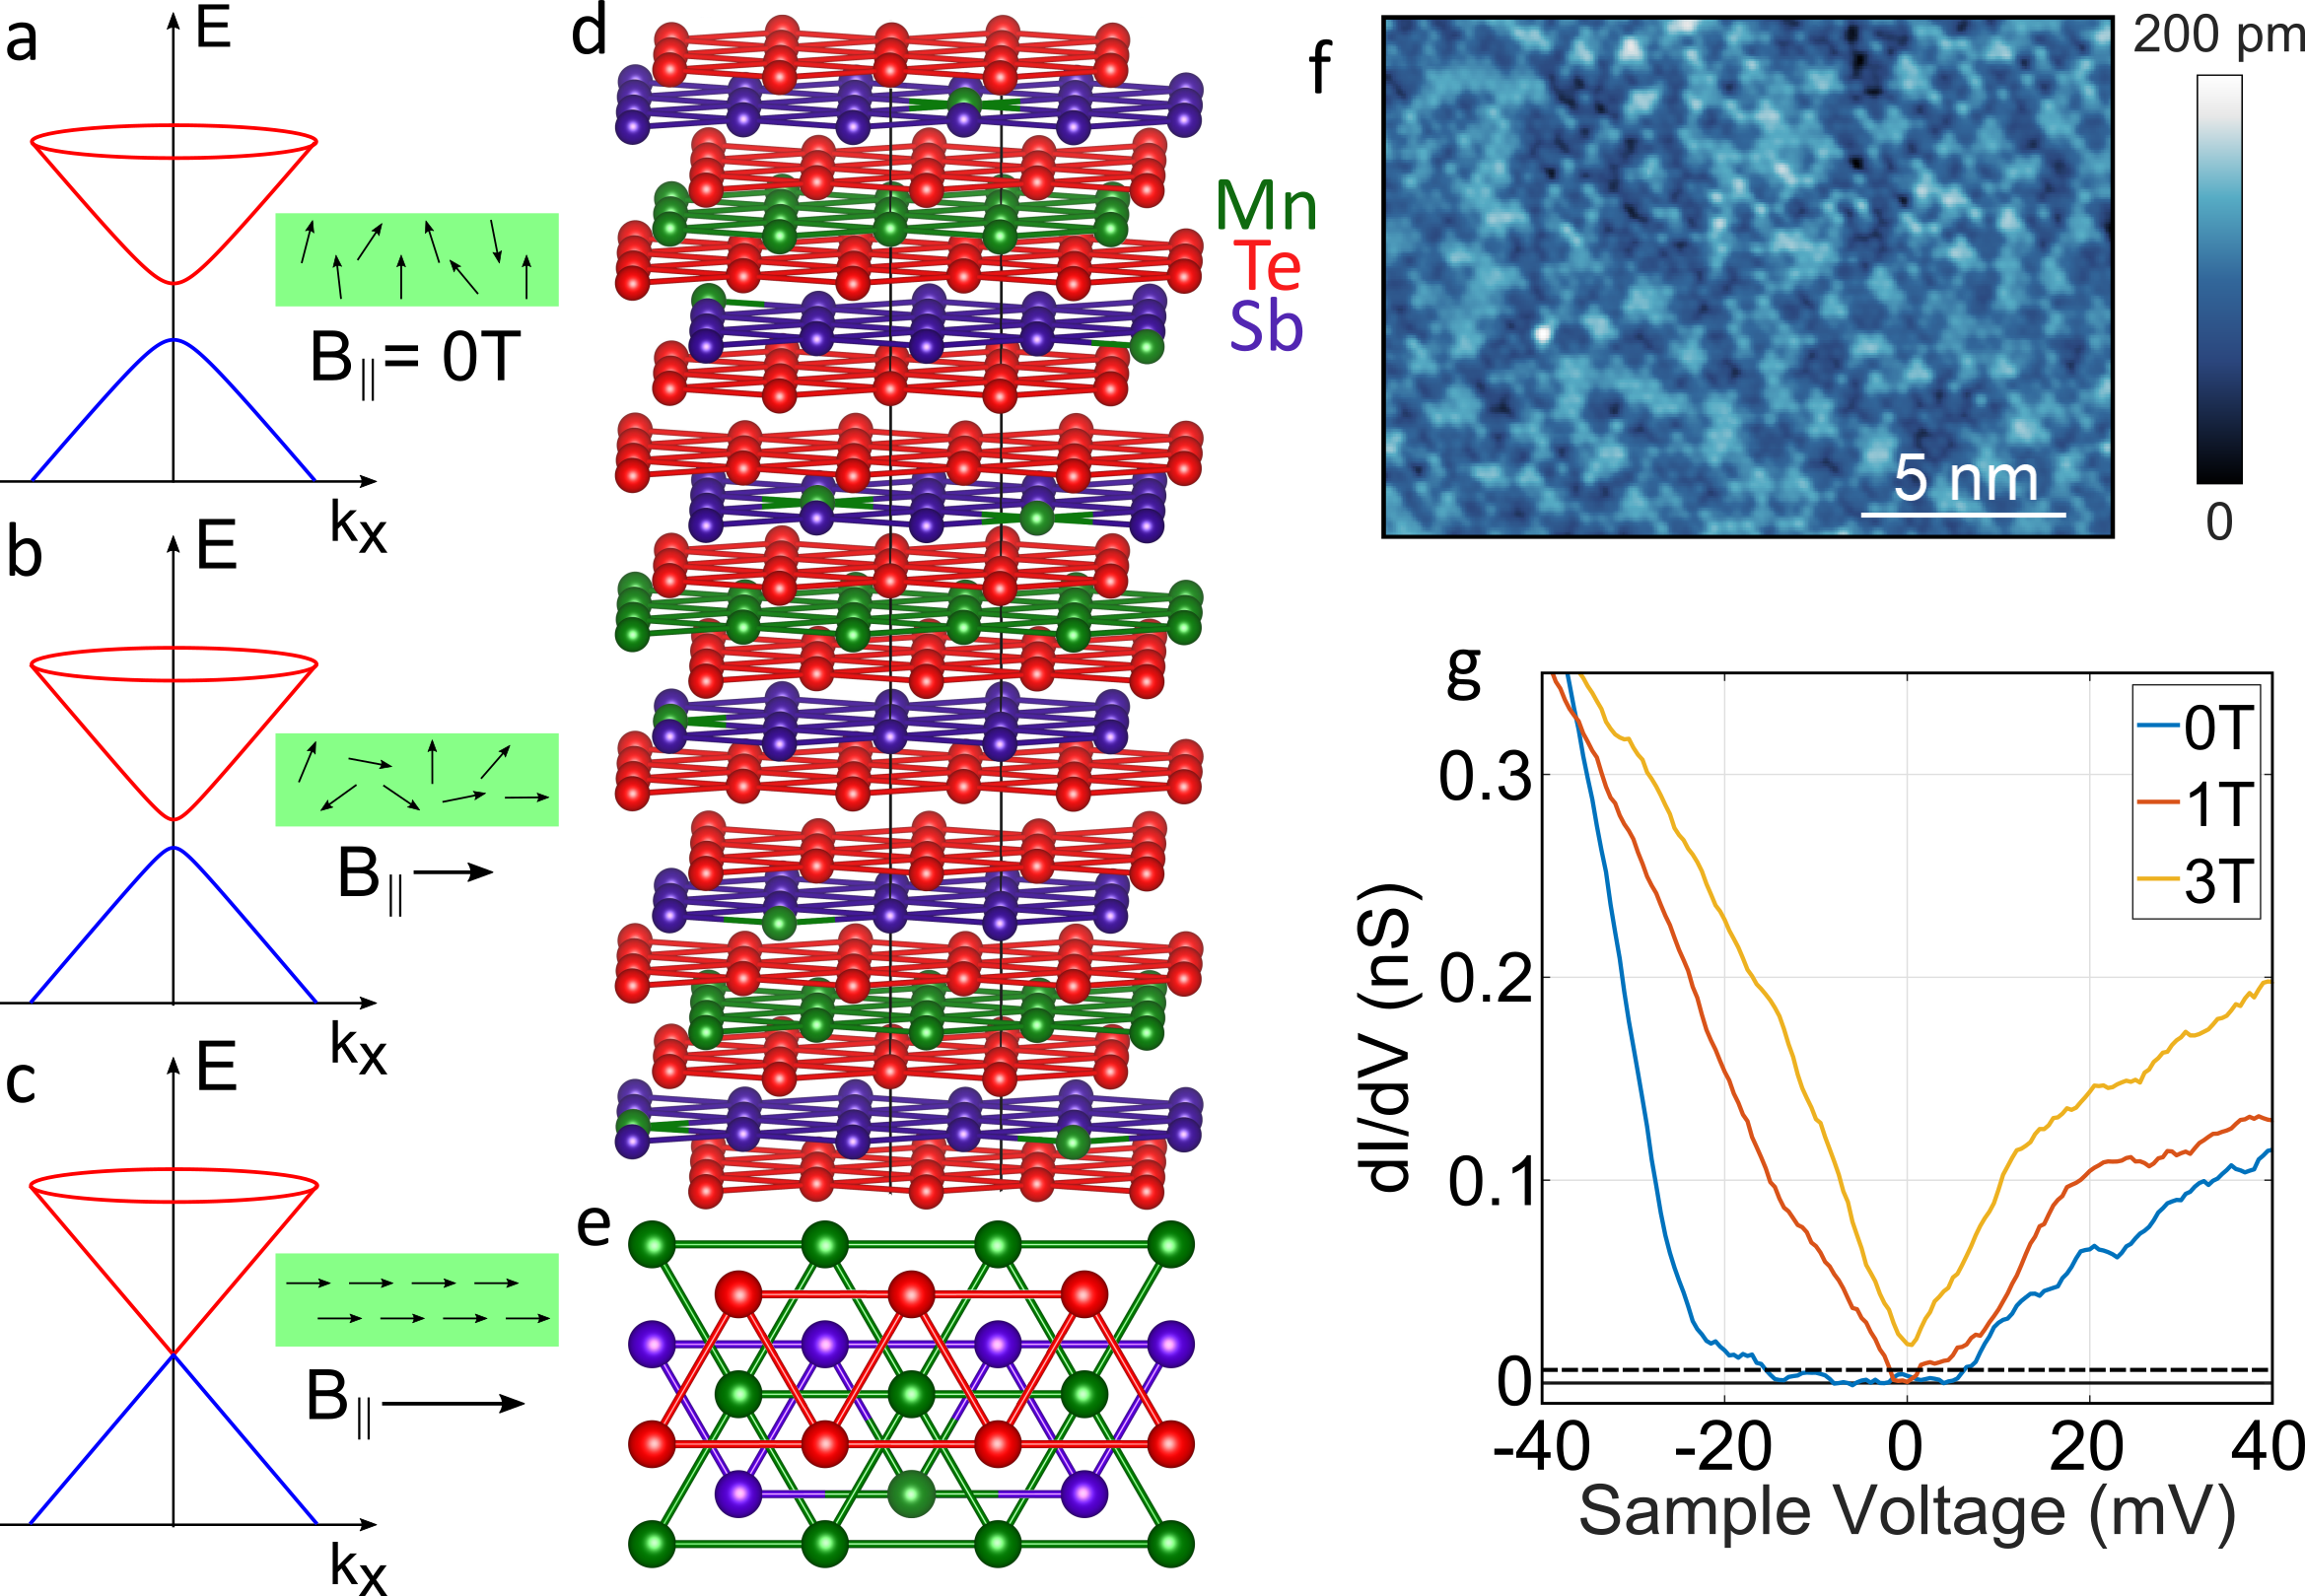
Figures 1d and e sketch the atomic structure of the epitaxial MnSb2Te4 as deduced by transmission electron microscopy, X-ray diffraction and Rutherford backscattering Wimmer2021 . Septuple layers with a Mn layer in the center are separated by van-der-Waals gaps between adjacent Te layers. Moreover, about 3.5 % of the atoms in the Sb layers are replaced by Mn atoms (green balls in the violet layers). STM reveals the hexagonal structure of the top Te layer (Fig. 1f). The height fluctuations up to about 1 Å (RMS roughness: 24 pm), have been attributed previously to the Mn atoms in the subsurface Sb layer Wimmer2021 . The curves exhibit a band gap at the Fermi level for T (Fig. 1g, blue curve) Wimmer2021 . At the chosen fixed surface position, the band gap reduces in size at T (red curve) and completely disappears at T (yellow curve). This is in line with the expectation that, in first order, the gap size depends only on the magnetization perpendicular to the surface, while an in-plane component only shifts the position in space but does not induce a gap Sekine2021 ; Rosenberg12 ; CXLiu08 ; Henk2012 . The reducing gap size, thus, indicates that the Mn spins are locally rotated into the plane by .
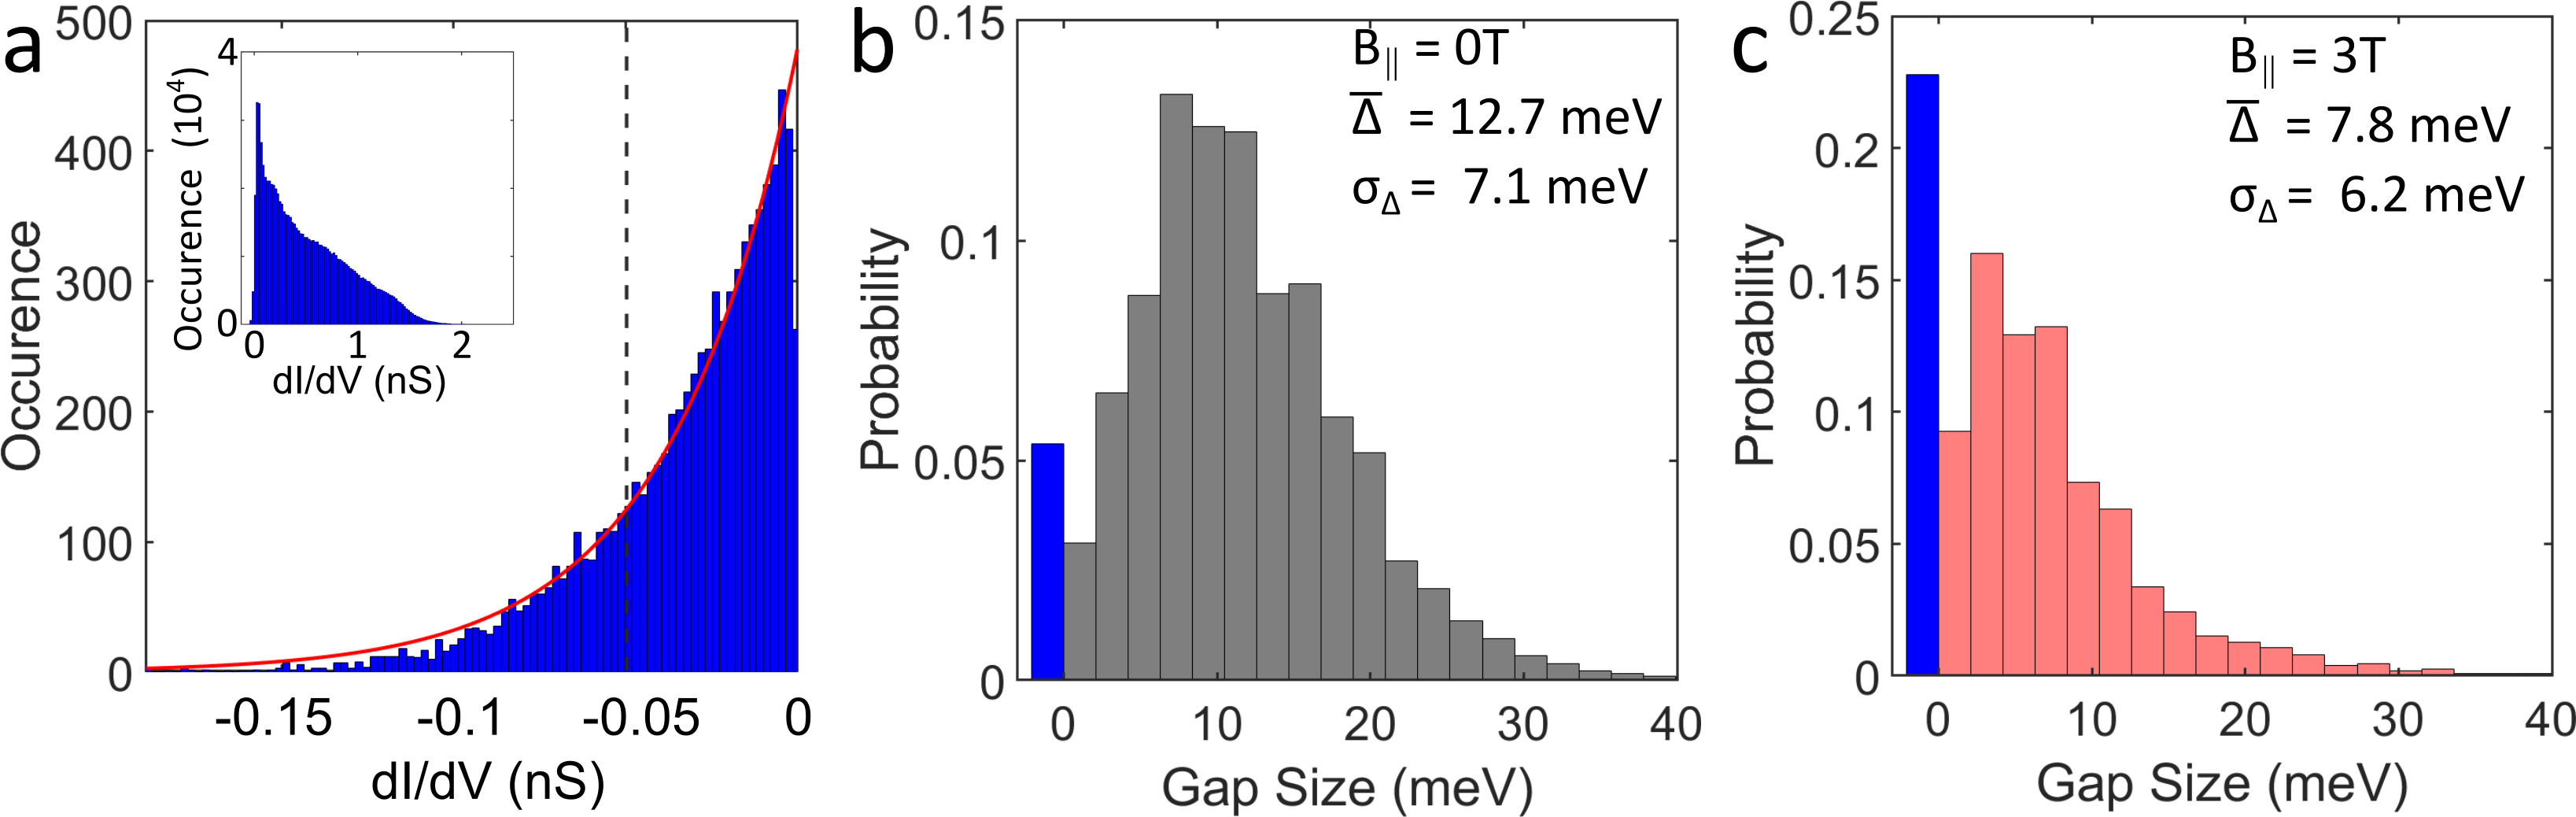
For quantitative band gap determination, we must consider the noise level of curves. Therefore, we firstly determine a histogram of all nS for a map after careful calibration of the lock-in phase (Fig. 2a). We regard the negative as noise. The histogram can be fitted by an exponential function (red line, Fig. 2a). The value that encloses 78 % of the area below the exponential curve, (dashed line, Fig. 2a), serves as threshold, i.e. only voltages with are regarded to belong to the gap (Supplementary Section S2). Figure 2b and c display the histograms of the resulting gap values for T and 3 T, each using several maps including curves and covering an area as large as nm2. The mean value , that includes curves without gap as meV, decreases from T meV to T meV, i.e. the average gap reduces, but does not close completely. The absolute gap values depend on the chosen threshold (Supplementary Section S2), but the threshold is identical for the two and the gap reduction by turns out to be robust for differently chosen thresholds. The percentage of curves without gap (blue bar at meV, Fig. 2b,c) increases from 5 % to 23 %. This indicates that only about 20% of the Mn spins in the surface area are rotated in-plane, while the majority is only partially rotated towards the in-plane direction as evidenced by the reduced . In-plane magnetization data of a ferromagnetic Mn1.00Sb2.09Te3.91 bulk crystal revealed that at T corresponds to /Mn atom only, while /Mn atom are achieved at T Lai2021 . This nicely corroborates the only partial rotation of Mn moments into the plane at T as in our case. Since time reversal symmetry is broken, a tiny gap might also appear for a magnetization parallel to a topological insulator surface. However, according to density functional theory calculations of MnBi2Te4, this gap is an order of magnitude smaller than for surfaces with perpendicular magnetization Gu2021 . The Dirac point energy (mid point energy of the gap) barely changes by applying an in-plane field ( T: meV, meV; T: meV, meV, Supplementary Section S3). Hence, the change in local magnetization does not significantly influence the electrostatic potential. The fact that reveals that magnetic disorder is more severe than electrostatic potential fluctuations for MnSb2Te4. This is opposite for Cr-doped (Bi,Sb)2Te3 Chong2020 , where, however, spatial fluctuations of the magnetization vector are still relevant for the magnetic field induced phase transition Lachman16 ; Liu2020 .
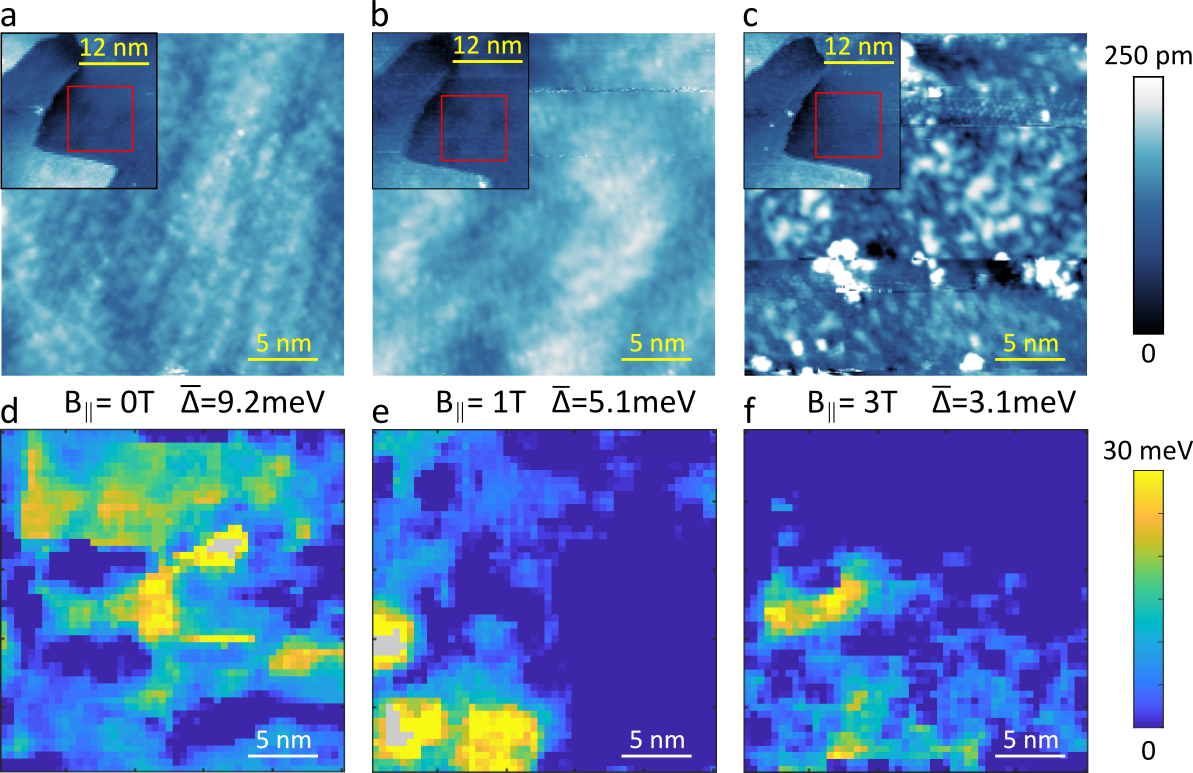
Figure 3 shows maps of the identical area of MnSb2Te4 for three different values (Fig. 3d–f). The area is repeatedly adjusted by its relative position to step edges as seen in the larger scale STM images (insets in Fig. 3a–c). Two experimental challenges appeared. Firstly, roughly 2 % of the curves do not exhibit an increasing for mV, such that could not be determined Wimmer2021 . The corresponding positions are colored grey in the maps. The effect is repeatedly observed for several tips in both STM instruments up to T and up to K. The reason is unknown, but might be related to dynamic trapping of charges from the tunneling current by defects. Secondly, the conditions for STS were not completely stable during the recording of maps at T as clusters of unknown origin appeared on the surface after the maps (Fig. 3c). Such clusters can change the electrostatic potential and, hence, also . Consequently, a reliable comparison can only be made between Fig. 3d and e, again demonstrating a reduction of the average gap size with the magnetic field applied, decreasing from = 9.2 meV at T to 5.1 meV at T, in line with the result obtained from the histograms (Fig. 2). In the top part of the images, exhibits a rather homogeneous decrease of the local with increasing . However, also regions of local increases are found (lower left part) that encircle areas with undefined gap (grey regions), presumably indicating charge trapping. The correlation length of slightly increases from nm to nm (Supplementary Section S3), being only slightly larger than the distance between individual Mn atoms within the subsurface Sb layer nm. Hence, it appears that each Mn atom in the Sb layer contributes significantly to the local gap . Figure 3f, recorded at T, must be regarded as a largely modified potential landscape due to the surface contamination found after recording . Indeed, there is no obvious correlation to at lower . Nevertheless, the average gap of meV is further decreased by about 40% with respect to . The average gap in this area is relatively small (compare Fig. 2c), which is due to the large patch without gap observed in the upper part of the image. The correlation length nm barely changes compared to T. Previously reported magnetization data Wimmer2021 shows that the in-plane magnetization of our MnSb2Te4 films increases by about 20 % between T and T. Albeit a direct comparison is not straightforward, the changes of band gap and magnetization are of a very similar strength. Hence, we conclude that the origin of reduced is dominated by a partial, non-uniform rotation of the Mn spins into the plane by as illustrated in Fig. 1b. Such a relation between gap and magnetization direction as expected for ferromagnetic TIs Tokura2019 ; Sekine2021 has never been demonstrated experimentally before.
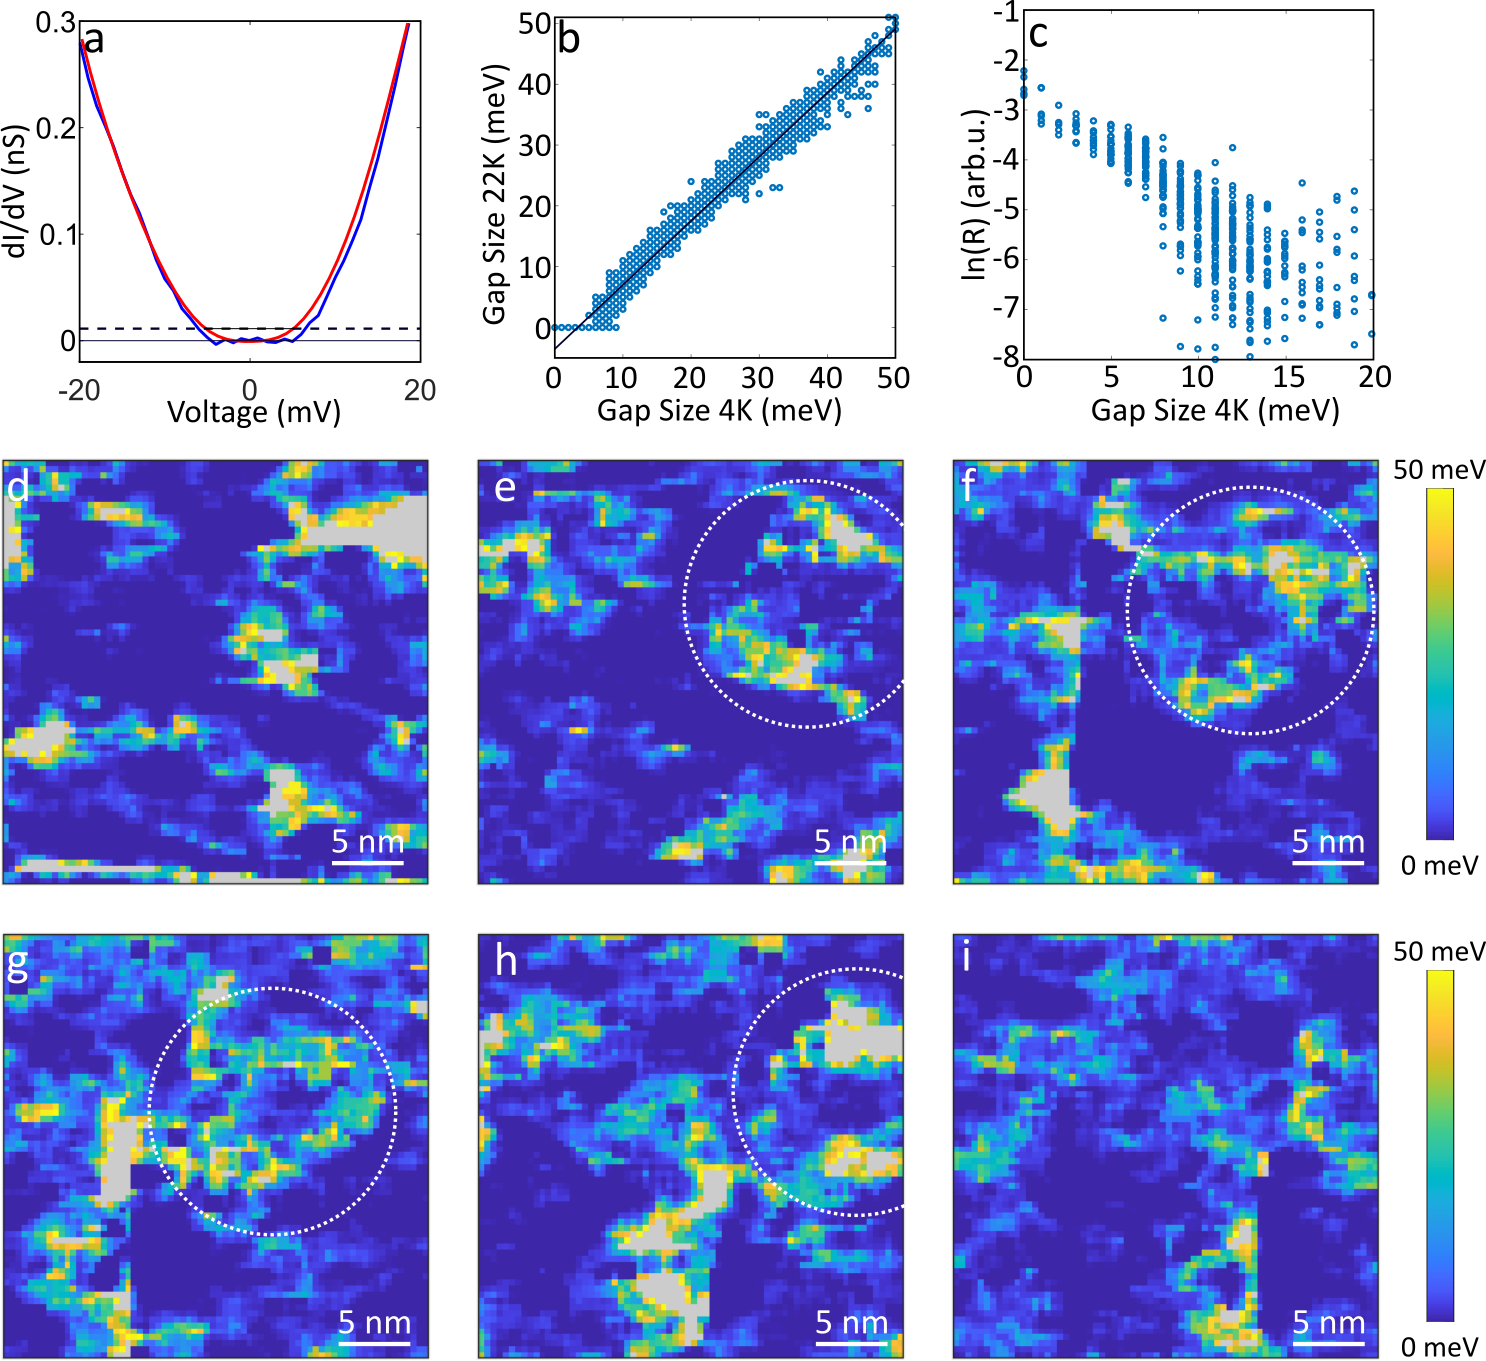
Next, we probe spatiotemporal fluctuations of the magnetically induced gap . curves by XMCD Wimmer2021 revealed a continuous, mostly linear reduction of for K . Consequently, we record maps slightly above, at K, in a series of images covering the same area (Fig. 4d–i). Indirect temperature stabilization led to a lateral drift of nm/hour during the measurements (Supplementary Section S1). The determination of at elevated must consider the Fermi level broadening of the probing tip Wimmer2021 ; LeeIPNAS2015 ; SessiNC16 ; ChenNJP2015 . Figure 4a shows as recorded at K (blue line). Applying the convolution
| (1) |
with Fermi-Dirac distribution (: electron charge, : Boltzmann constant, : energy) returns the expected appearance of at 22 K resulting from the same LDOS (red line). Evidently, the broadening due to the Fermi-Dirac distribution reduces the apparent for identical LDOS. To account for this error, we employed a set of 7500 curves to determine the band gaps and applied eq. 1 to determine the apparent band gaps at 22 K, denoted . The resulting scatter plot for the 7500 curves is shown in Fig. 4b with a linear fit (black line) of all data points exhibiting meV. The fit is then used to relate measured to the expected of the same LDOS that we regard as the true gap of the LDOS at 22 K: . The method does not work for meV, where we instead use to estimate (Fig. 4c). This more complex method has been established previously Wimmer2021 (Supplementary Section S2) and is relevant for 38 % of the curves leading to Fig. 4d–i. For , one reliably gets meV (Fig. 4c).
Figure 4d–i show the resulting maps in a time series. Here, % of the surface area exhibits meV interrupted by irregularly shaped patches with meV. The average gap size within the six images amounts to meV, while within the patches it is meV. Both values are significantly smaller than the average gap size at K (13 meV) as expected from the fact that the magnetization decreases with increasing temperature Wimmer2021 . The correlation length amounts to nm, i.e. slightly smaller than nm, but still close to nm (Supplementary Section S3). Most intriguingly, the patches change quasi-continuously in size and shape as a function of time. This is revealed by the dashed circles in Fig. 4e–h that identifies a similar structure that only slightly changes its shape. Since subsequent images differ by 4 hours, the fluctuations are extremely slow. The same experiment performed at K exhibits fluctuations as well, but due to the larger changes it was not possible to identify similar patches in subsequent images (Supplementary Section S3). All in all, spatiotemporal fluctuations of the gap size start at , i.e. when the magnetization starts to decay. This important observation perfectly corroborates the magnetic origin of the gap. We note that K is very close to the Neel temperature K of antiferromagnetic MnSb2Te4 McQueeneyPRB19 ; ChenPRM20 . Hence, we conjecture that the competition between ferromagnetic and antiferromagnetic interlayer coupling driven by the local distribution of Mn atoms in the Sb layer liu2021 ; Riberolles2021 ; li2021 ; HuarXiv2020 ; Wimmer2021 is responsible for the magnetic fluctuations at this temperature well below . Recently, large fluctuations well below have also been found for Mn(Bi,Sb)2nTe3n+1 by ac magnetic susceptibility measurements Hu2021b as well as for Cr-doped Sb2Te3 by spin resonance relaxation Figueroa2020 . This establishes fluctuations as a general phenomenon in (Bi,Sb)2Te3 based magnetic topological insulators. We tried to quantify the spatiotemporal fluctuation at K in more detail by various correlation functions, but could not establish a clear trend probably due to the limited data set and the remaining lateral drift during the measurements.
In summary, we have shown that the band gap of Mn-rich MnSb2Te4 is controlled by the perpendicular magnetization of the surface. Thus, it is strongly reduced in size by about 1/3 when an in-plane magnetic field of T is applied, which nicely agrees to the in-plane magnetization at this field being 1/3 of the saturation magnetization Lai2021 . At temperatures approaching , the magnetic gap starts to fluctuate spatiotemporarily as measured for , in line with the starting reduction of remanent magnetization. Both results corroborate our assignment of the gap to a magnetic gap of the topological surface state. Moreover, our results establish MnSb2Te4 as a highly promising material for direct spatiotemporal investigation of magnetization changes close to a quantum critical point. The criticality is likely induced by the competition between ferromagnetic and antiferromagnetic interlayer coupling that can be tuned, in principle, by field.
Acknowledgements
We gratefully acknowledge insightful discussion with G. Bauer and funding by the Deutsche Forschungsgemeinschaft via Germany’s Excellence Strategy — Cluster of Excellence: Matter and Light for Quantum Computing (ML4Q) EXC 2004/1 — 390534769, and by Mo 858/19-1, by the Graphene Flagship Core 3, and by the Austrian Science Funds (Projects No. P30960-N27 and I3938-N27).
Supplementary Sections
The Supplementary Sections describe the experimental and theoretical methods as well as additional data supporting the conclusions from the main text.
References
- (1) M. Onoda, N. Nagaosa, Phys. Rev. Lett. 2003, 90, 20 206601.
- (2) C.-X. Liu, X.-L. Qi, X. Dai, Z. Fang, S.-C. Zhang, Phys. Rev. Lett. 2008, 101, 14 146802.
- (3) R. Yu, W. Zhang, H.-J. Zhang, S.-C. Zhang, X. Dai, Z. Fang, Science 2010, 329, 5987 61.
- (4) E. J. Fox, I. T. Rosen, Y. Yang, G. R. Jones, R. E. Elmquist, X. Kou, L. Pan, K. L. Wang, D. Goldhaber-Gordon, Phys. Rev. B 2018, 98, 7 075145.
- (5) Z. Qiao, S. A. Yang, W. Feng, W.-K. Tse, J. Ding, Y. Yao, J. Wang, Q. Niu, Phys. Rev. B 2010, 82, 16 161414.
- (6) Y. Tokura, K. Yasuda, A. Tsukazaki, Nat. Rev. Phys. 2019, 1, 2 126.
- (7) C.-Z. Chang, J. Zhang, X. Feng, J. Shen, Z. Zhang, M. Guo, K. Li, Y. Ou, P. Wei, L.-L. Wang, Z.-Q. Ji, Y. Feng, S. Ji, X. Chen, J. Jia, X. Dai, Z. Fang, S.-C. Zhang, K. He, Y. Wang, L. Lu, X.-C. Ma, Q.-K. Xue, Science 2013, 340, 6129 167.
- (8) J. G. Checkelsky, R. Yoshimi, A. Tsukazaki, K. S. Takahashi, Y. Kozuka, J. Falson, M. Kawasaki, Y. Tokura, Nat. Phys. 2014, 10, 10 731.
- (9) X. Kou, S.-T. Guo, Y. Fan, L. Pan, M. Lang, Y. Jiang, Q. Shao, T. Nie, K. Murata, J. Tang, Y. Wang, L. He, T.-K. Lee, W.-L. Lee, K. L. Wang, Phys. Rev. Lett. 2014, 113, 13 137201.
- (10) A. Bestwick, E. Fox, X. Kou, L. Pan, K. L. Wang, D. Goldhaber-Gordon, Phys. Rev. Lett. 2015, 114, 18 187201.
- (11) A. Kandala, A. Richardella, S. Kempinger, C.-X. Liu, N. Samarth, Nat. Commun. 2015, 6, 1 7434.
- (12) C.-Z. Chang, W. Zhao, D. Y. Kim, H. Zhang, B. A. Assaf, D. Heiman, S.-C. Zhang, C. Liu, M. H. W. Chan, J. S. Moodera, Nat. Mater. 2015, 14, 5 473.
- (13) S. Grauer, S. Schreyeck, M. Winnerlein, K. Brunner, C. Gould, L. W. Molenkamp, Phys. Rev. B 2015, 92, 20 201304.
- (14) M. Götz, K. M. Fijalkowski, E. Pesel, M. Hartl, S. Schreyeck, M. Winnerlein, S. Grauer, H. Scherer, K. Brunner, C. Gould, F. J. Ahlers, L. W. Molenkamp, Appl. Phys. Lett. 2018, 112, 7 072102.
- (15) Y. Okazaki, T. Oe, M. Kawamura, R. Yoshimi, S. Nakamura, S. Takada, M. Mogi, K. S. Takahashi, A. Tsukazaki, M. Kawasaki, Y. Tokura, N.-H. Kaneko, Nat. Phys. 2021, 18, 1 25.
- (16) R. S. K. Mong, A. M. Essin, J. E. Moore, Phys. Rev. Lett. 2010, 81, 24 245209.
- (17) D. Zhang, M. Shi, T. Zhu, D. Xing, H. Zhang, J. Wang, Phys. Rev. Lett. 2019, 122, 20 206401.
- (18) Z. Zhou, Y.-J. Chien, C. Uher, Appl. Phys. Lett. 2005, 87, 11 112503.
- (19) A. I. Figueroa, T. Hesjedal, N.-J. Steinke, Appl. Phys. Lett. 2020, 117, 15 150502.
- (20) M. Mogi, R. Yoshimi, A. Tsukazaki, K. Yasuda, Y. Kozuka, K. S. Takahashi, M. Kawasaki, Y. Tokura, Appl. Phys. Lett. 2015, 107, 18 182401.
- (21) D. Xiao, J. Jiang, J.-H. Shin, W. Wang, F. Wang, Y.-F. Zhao, C. Liu, W. Wu, M. H. Chan, N. Samarth, C.-Z. Chang, Phys. Rev. Lett. 2018, 120, 5 056801.
- (22) Y. X. Chong, X. Liu, R. Sharma, A. Kostin, G. Gu, K. Fujita, J. C. S. Davis, P. O. Sprau, Nano Lett. 2020, 20, 11 8001.
- (23) K. M. Fijalkowski, N. Liu, P. Mandal, S. Schreyeck, K. Brunner, C. Gould, L. W. Molenkamp, Nat. Commun. 2021, 12, 1 5599.
- (24) H. Deng, Z. Chen, A. Wołoś, M. Konczykowski, K. Sobczak, J. Sitnicka, I. V. Fedorchenko, J. Borysiuk, T. Heider, Ł. Pluciński, K. Park, A. B. Georgescu, J. Cano, L. Krusin-Elbaum, Nat. Phys. 2020, 17, 1 36.
- (25) E. D. L. Rienks, S. Wimmer, J. Sánchez-Barriga, O. Caha, P. S. Mandal, J. Růžička, A. Ney, H. Steiner, V. V. Volobuev, H. Groiss, M. Albu, G. Kothleitner, J. Michalička, S. A. Khan, J. Minár, H. Ebert, G. Bauer, F. Freyse, A. Varykhalov, O. Rader, G. Springholz, Nature 2019, 576, 7787 423.
- (26) J. A. Hagmann, X. Li, S. Chowdhury, S.-N. Dong, S. Rouvimov, S. J. Pookpanratana, K. M. Yu, T. A. Orlova, T. B. Bolin, C. U. Segre, D. G. Seiler, C. A. Richter, X. Liu, M. Dobrowolska, J. K. Furdyna, New J. Phys. 2017, 19, 8 085002.
- (27) S. Wimmer, J. Sánchez-Barriga, P. Küppers, A. Ney, E. Schierle, F. Freyse, O. Caha, J. Michalička, M. Liebmann, D. Primetzhofer, M. Hoffman, A. Ernst, M. M. Otrokov, G. Bihlmayer, E. Weschke, B. Lake, E. V. Chulkov, M. Morgenstern, G. Bauer, G. Springholz, O. Rader, Adv. Mat. 2021, 33, 42 2102935.
- (28) M. Ye, W. Li, S. Zhu, Y. Takeda, Y. Saitoh, J. Wang, H. Pan, M. Nurmamat, K. Sumida, F. Ji, Z. Liu, H. Yang, Z. Liu, D. Shen, A. Kimura, S. Qiao, X. Xie, Nat. Commun. 2015, 6, 1 8913.
- (29) M. Li, C.-Z. Chang, L. Wu, J. Tao, W. Zhao, M. H. Chan, J. S. Moodera, J. Li, Y. Zhu, Phys. Rev. Lett. 2015, 114, 14 146802.
- (30) C. Hu, L. Ding, K. N. Gordon, B. Ghosh, H.-J. Tien, H. Li, A. G. Linn, S.-W. Lien, C.-Y. Huang, S. Mackey, J. Liu, P. V. S. Reddy, B. Singh, A. Agarwal, A. Bansil, M. Song, D. Li, S.-Y. Xu, H. Lin, H. Cao, T.-R. Chang, D. Dessau, N. Ni, Sci. Adv. 2020, 6, 30 eaba4275.
- (31) S. Eremeev, M. Otrokov, E. Chulkov, J. Alloys Compd. 2017, 709 172.
- (32) J.-Q. Yan, Q. Zhang, T. Heitmann, Z. Huang, K. Y. Chen, J.-G. Cheng, W. Wu, D. Vaknin, B. C. Sales, R. J. McQueeney, Phys. Rev. Mat. 2019, 3, 6 064202.
- (33) J.-Q. Yan, S. Okamoto, M. A. McGuire, A. F. May, R. J. McQueeney, B. C. Sales, Phys. Rev. B 2019, 100, 10 104409.
- (34) M. M. Otrokov, I. I. Klimovskikh, H. Bentmann, D. Estyunin, A. Zeugner, Z. S. Aliev, S. Gaß, A. U. B. Wolter, A. V. Koroleva, A. M. Shikin, M. Blanco-Rey, M. Hoffmann, I. P. Rusinov, A. Y. Vyazovskaya, S. V. Eremeev, Y. M. Koroteev, V. M. Kuznetsov, F. Freyse, J. Sánchez-Barriga, I. R. Amiraslanov, M. B. Babanly, N. T. Mamedov, N. A. Abdullayev, V. N. Zverev, A. Alfonsov, V. Kataev, B. Büchner, E. F. Schwier, S. Kumar, A. Kimura, L. Petaccia, G. D. Santo, R. C. Vidal, S. Schatz, K. Kißner, M. Ünzelmann, C. H. Min, S. Moser, T. R. F. Peixoto, F. Reinert, A. Ernst, P. M. Echenique, A. Isaeva, E. V. Chulkov, Nature 2019, 576, 7787 416.
- (35) Y. Chen, Y.-W. Chuang, S. H. Lee, Y. Zhu, K. Honz, Y. Guan, Y. Wang, K. Wang, Z. Mao, J. Zhu, C. Heikes, P. Quarterman, P. Zajdel, J. A. Borchers, W. Ratcliff, Phys. Rev. Mat. 2020, 4, 6 064411.
- (36) A. Sekine, K. Nomura, J. Appl. Phys. 2021, 129, 14 141101.
- (37) Y. Yuan, X. Wang, H. Li, J. Li, Y. Ji, Z. Hao, Y. Wu, K. He, Y. Wang, Y. Xu, W. Duan, W. Li, Q.-K. Xue, Nano Lett. 2020, 20, 5 3271.
- (38) Y.-J. Hao, P. Liu, Y. Feng, X.-M. Ma, E. F. Schwier, M. Arita, S. Kumar, C. Hu, R. Lu, M. Zeng, Y. Wang, Z. Hao, H.-Y. Sun, K. Zhang, J. Mei, N. Ni, L. Wu, K. Shimada, C. Chen, Q. Liu, C. Liu, Phys. Rev. X 2019, 9, 4 041038.
- (39) Y. J. Chen, L. X. Xu, J. H. Li, Y. W. Li, H. Y. Wang, C. F. Zhang, H. Li, Y. Wu, A. J. Liang, C. Chen, S. W. Jung, C. Cacho, Y. H. Mao, S. Liu, M. X. Wang, Y. F. Guo, Y. Xu, Z. K. Liu, L. X. Yang, Y. L. Chen, Phys. Rev. X 2019, 9, 4 041040.
- (40) A. M. Shikin, D. A. Estyunin, N. L. Zaitsev, D. Glazkova, I. I. Klimovskikh, S. O. Filnov, A. G. Rybkin, E. F. Schwier, S. Kumar, A. Kimura, N. Mamedov, Z. Aliev, M. B. Babanly, K. Kokh, O. E. Tereshchenko, M. M. Otrokov, E. V. Chulkov, K. A. Zvezdin, A. K. Zvezdin, Phys. Rev. B 2021, 104, 11 115168.
- (41) M. Garnica, M. M. Otrokov, P. C. Aguilar, I. I. Klimovskikh, D. Estyunin, Z. S. Aliev, I. R. Amiraslanov, N. A. Abdullayev, V. N. Zverev, M. B. Babanly, N. T. Mamedov, A. M. Shikin, A. Arnau, A. L. V. de Parga, E. V. Chulkov, R. Miranda, npj Quant. Mater. 2022, 7, 1 7.
- (42) G. Rosenberg, M. Franz, Phys. Rev. B 2012, 85, 19 195119.
- (43) J. Henk, M. Flieger, I. V. Maznichenko, I. Mertig, A. Ernst, S. V. Eremeev, E. V. Chulkov, Phys. Rev. Lett. 2012, 109 076801.
- (44) W. Ge, P. M. Sass, J. Yan, S. H. Lee, Z. Mao, W. Wu, Phys. Rev. B 2021, 103 134403.
- (45) Y. Lai, L. Ke, J. Yan, R. D. McDonald, R. J. McQueeney, Phys. Rev. B 2021, 103, 18 184429.
- (46) T. Murakami, Y. Nambu, T. Koretsune, G. Xiangyu, T. Yamamoto, C. M. Brown, H. Kageyama, Phys. Rev. B 2019, 100, 19 195103.
- (47) Y. Liu, L.-L. Wang, Q. Zheng, Z. Huang, X. Wang, M. Chi, Y. Wu, B. C. Chakoumakos, M. A. McGuire, B. C. Sales, W. Wu, J. Yan, Phys. Rev. X 2021, 11 021033.
- (48) S. X. M. Riberolles, Q. Zhang, E. Gordon, N. P. Butch, L. Ke, J. Q. Yan, R. J. McQueeney, Phys. Rev. B 2021, 104 064401.
- (49) H. Li, Y. Li, Y. Lian, W. Xie, L. Chen, J. Zhang, Y. Wu, S. Fan, Sci. China Mater. 2021, https://doi.org/10.1007/s40843–021–1738–9.
- (50) C. Hu, S. Mackey, N. Ni, Phys. Rev. B 2021, 104 054422.
- (51) O. G. Shpyrko, E. D. Isaacs, J. M. Logan, Y. Feng, G. Aeppli, R. Jaramillo, H. C. Kim, T. F. Rosenbaum, P. Zschack, M. Sprung, S. Narayanan, A. R. Sandy, Nature 2007, 447, 7140 68.
- (52) M. Kronseder, T. N. G. Meier, M. Zimmermann, M. Buchner, M. Vogel, C. H. Back, Nat. Commun. 2015, 6, 1 6832.
- (53) E. O. Lachman, A. F. Young, A. Richardella, J. Cuppens, H. R. Naren, Y. Anahory, A. Y. Meltzer, A. Kandala, S. Kempinger, Y. Myasoedov, M. E. Huber, N. Samarth, E. Zeldov, Sci. Adv. 2015, 1, 10 e1500740.
- (54) T. Mashoff, M. Pratzer, M. Morgenstern, Rev. Sci. Instr. 2009, 80, 5 053702.
- (55) M. Morgenstern, Surf. Rev. Lett. 2003, 10, 06 933.
- (56) M. Gu, J. Li, H. Sun, Y. Zhao, C. Liu, J. Liu, H. Lu, Q. Liu, Nat. Commun. 2021, 12, 1 3524.
- (57) C. Liu, Y. Ou, Y. Feng, G. Jiang, W. Wu, S. Li, Z. Cheng, K. He, X. Ma, Q. Xue, Y. Wang, Phys. Rev. X 2020, 10, 4 041063.
- (58) Y. Tokura, K. Yasuda, A. Tsukazaki, Nat. Rev. Phys. 2019, 1, 2 126.
- (59) I. Lee, C. K. Kim, J. Lee, S. J. L. Billinge, R. Zhong, J. A. Schneeloch, T. Liu, T. Valla, J. M. Tranquada, G. Gu, J. C. S. Davis, Proc. Natl. Acad. Sci. 2015, 112, 5 1316.
- (60) P. Sessi, R. R. Biswas, T. Bathon, O. Storz, S. Wilfert, A. Barla, K. A. Kokh, O. E. Tereshchenko, K. Fauth, M. Bode, A. V. Balatsky, Nat. Commun. 2016, 7, 1 12027.
- (61) C.-C. Chen, M. L. Teague, L. He, X. Kou, M. Lang, W. Fan, N. Woodward, K.-L. Wang, N.-C. Yeh, New J. Phys. 2015, 17, 11 113042.
- (62) C. Hu, M. A. Tanatar, R. Prozorov, N. Ni, J. Phys. D: Appl. Phys. 2022, 55 054003.