StickyLand: Breaking the Linear Presentation of Computational Notebooks
Abstract.
How can we better organize code in computational notebooks? Notebooks have become a popular tool among data scientists, as they seamlessly weave text and code together, supporting users to rapidly iterate and document code experiments. However, it is often challenging to organize code in notebooks, partially because there is a mismatch between the linear presentation of code and the non-linear process of exploratory data analysis. We present StickyLand, a notebook extension for empowering users to freely organize their code in non-linear ways. With sticky cells that are always shown on the screen, users can quickly access their notes, instantly observe experiment results, and easily build interactive dashboards that support complex visual analytics. Case studies highlight how our tool can enhance notebook users’s productivity and identify opportunities for future notebook designs. StickyLand is available at https://github.com/xiaohk/stickyland.
1. Introduction
Computational notebooks, such as Jupyter Notebook (Kluyver et al., 2016) and Colab, have become dominant programming environments for data scientists to explore and understand data (Randles et al., 2017). According to a 2021 Kaggle survey (Kaggle, 2021), Jupyter Notebook and JupyterLab are among the top-3 most popular integrated development environments, and more than 75% surveyed data scientists use Jupyter Notebook or JupyterLab in their day-to-day work. These notebooks present a customizable programming environment that consists of an arbitrary number of cells—small editors for markdown text and code. These cells are linearly organized in a document format and tend to grow longer and longer as the complexity of the analysis increases. Textual and visual results, such as code output and visualizations, are presented below corresponding cells. Users can arrange and execute these cells in their notebooks—creating a form of literate programming (Knuth, 1984). With a seamless combination of text, code, and visual outputs, notebooks facilitates data scientists to perform exploratory data analysis, document data insights, and eventually share data stories with collaborators.
However, recent research suggests that notebook users face challenges regarding code organization (Chattopadhyay et al., 2020; Head et al., 2019). Since there is only one code interpreter that keeps all the execution states in a notebook, users need to carefully arrange and execute cells in certain orders to avoid variable corruptions (Head et al., 2019; Kery et al., 2019). In addition, all notebooks follow a linear presentation style that is contradictory to the non-linear nature of exploratory data analysis (Kery et al., 2018; Weinman et al., 2021). Effectively, all of the code cells are a part of a single program, despite being spread across the notebook. This means that edits such as changing variables in one part of the notebook may have unforeseen consequences later in the notebook. To help users better organize notebook cells, researchers propose techniques such as distilling essential cells to create sub-notebooks (Head et al., 2019), supporting cell-level code version controls (Mikami et al., 2017), and two-column notebook layout (Weinman et al., 2021). In contrast to these works, we address the notebook messiness by focusing on the linearity of the traditional notebook layout.
We introduce StickyLand (Fig. 1), an interface that breaks the linearity of notebooks with sticky cells that are always shown on top of the notebook. This alternative layout provides multiple new options for organizing, navigating, displaying and executing notebooks. Our main contributions are:
-
•
StickyLand, a collection of user interface techniques that empowers data scientists to break the linear presentation of traditional notebooks. These user interface techniques include the ability to create persistent, free-floating cells that can contain either code or markup, the ability to automatically run code cells in order to help synchronize states and explore results instantly; and a variety of organizational techniques that let users rearrange and combine sticky cells in order to create customized dashboards that support complex visual analytics. We also present three use scenarios where StickyLand enhances notebook users’ productivity, collaboration, and learning through more flexible code organizations.
-
•
An open-source111StickyLand Code: https://github.com/xiaohk/stickyland implementation that broadens the public’s access to a more flexible notebook layout. We also provide comprehensive documentation to help future designers and researchers use StickyLand as a user interface toolkit to explore and develop alternative notebook designs. To see a demo of StickyLand, visit https://youtu.be/OKaPmEBzEX0.
We hope our work will inspire the design, research, and development of computational notebooks that help data scientists to more productively analyze data, document insights, and share findings.
2. Background and Related Work
As computational notebooks have been gaining popularity in recent years, there is a growing body of research from the CHI community that aims to improve these notebooks (e.g., Kery et al., 2019; Rule et al., 2018; Kery et al., 2018). Through conducting interviews and surveys with data scientists, researchers have identified difficulties of using notebooks in practice: One of the main pain points is code management (Chattopadhyay et al., 2020; Kery et al., 2018). Since the traditional scripting code is modularized as a linear collection of multiple cells that users can arrange and execute in any order, it becomes challenging to manage code in computational notebooks (Chattopadhyay et al., 2020; Lau et al., 2020). For example, the fact that all the code cells are effective in one program means that a change to some code at the top of the notebook may impact or break code far away at the end of the notebook. Likewise, as the data analysis gets more complex, users may find themselves flipping back and forth through the long notebook, trying to find specific pieces of information.
To address this issue, researchers introduce techniques to clean unused code (Head et al., 2019; Rule et al., 2018) and provide better version control of code (Kery et al., 2017; Mikami et al., 2017). To align notebook designs with the non-linear and iterative nature of exploratory data analysis, Weinman et al. (2021) explore alternatives to the single execution state of notebooks with forking and backtracking, as well as a two-column layout. Similarly, researchers have also explored designs that allow users to more easily navigate between code and interactive visualizations, such as bi-directional communications (Kery et al., 2020) and side-by-side presentations (Wu et al., 2020). However, these works still follow the traditional linear presentation style of notebooks. Such linear presentation is not the only way to organize code; In fact, before computation notebooks, researchers developed a wide range of tools that support visual organization of code, such as partially linked code in a grid (Hartmann et al., 2008), stackable cards to dynamically organize code segments (Nelson et al., 2017), single code editor across multiple documents (Han et al., 2020), and code bubbles that users can freely group and arrange (Bragdon et al., 2010). Inspired by these works, StickyLand challenges the linear layout of notebooks by introducing flexible sticky cells that persist on top of the notebook. To help users easily inspect code results and navigate the notebook, StickyLand supports automatically running cells and a variety of organization techniques.
3. System Design and Implementation
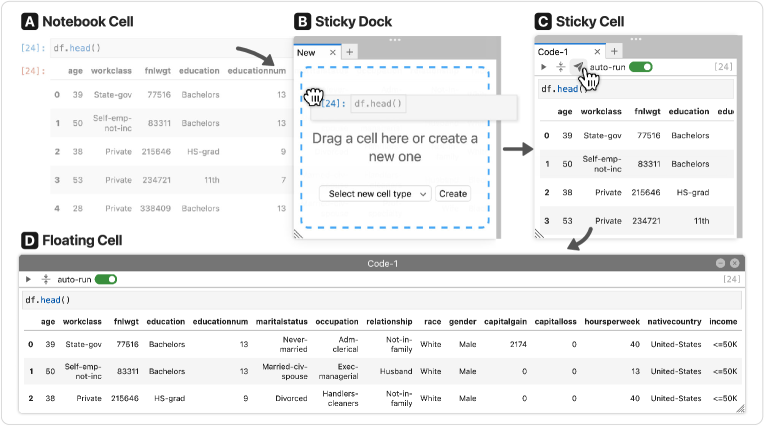
StickyLand is an interface that breaks the traditional linear presentation of computational notebooks by introducing a persistent area on top of the notebook where users can freely store any notebook artifacts such as code, notes, and task lists. It can help users more easily navigate the notebook, write less repetitive code, and better manage the execution states of their code. To accomplish this, StickyLand starts with the Sticky Dock (§ 3.1), a persistent area shown on top of the notebook that contains sticky cells. With easy drag-and-drop, users can add editable Sticky Code cells (§ 3.2), which can execute code and have an auto-run feature and Sticky Markdown cells (§ 3.3), which can format markdown and LaTeX text. In addition, users can create multiple Floating Cells (§ 3.4)—enabling more flexible code display and easy dashboard creation. The following sections describe these features in detail.
Auto-run feature image
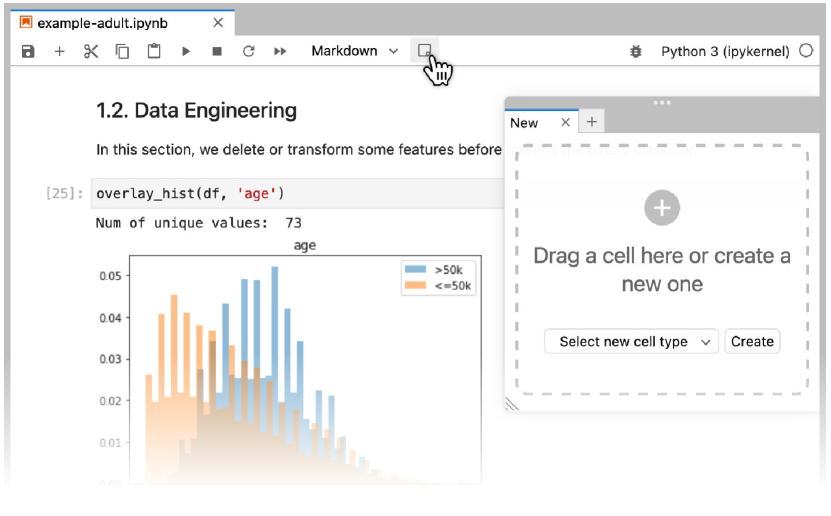
3.1. Sticky Dock
When users launch StickyLand in a notebook by clicking a button in the toolbar, the Sticky Dock appears—sticking to the right edge of the notebook window (Fig. 2). Users can resize the dock by dragging the panel corner and re-position it by dragging the top handle up and down along the right window edge. Sticky Dock is always shown on top of the main notebook, and it does not move when users scroll the notebook. Sticky Dock consists of a tab bar where each tab is associated with one sticky cell. Users can create an unlimited number of tabs to store sticky cells. To create a new tab, users can click the + button which opens a new tab with a dropzone. Users can easily drag-and-drop existing cells from the main notebook to the dropzone. If an existing cell is dragged to Sticky Dock, StickyLand creates a clone of the cell and collapses (hides) the original cell in the notebook. StickyLand synchronizes the content (both input and output results) in the existing cell and the cloned cell. In other words, editing a cell also changes the original cell in the notebook in real-time. Users can also create a new sticky cell from scratch in the dropzone, and Sticky Dock will add a collapsed cell in the notebook to synchronize the content with the new sticky cell. Once users close a tab, Sticky Dock removes the sticky cell and extends (shows) its corresponding cell in the notebook.
3.2. Sticky Code
Auto-run feature image
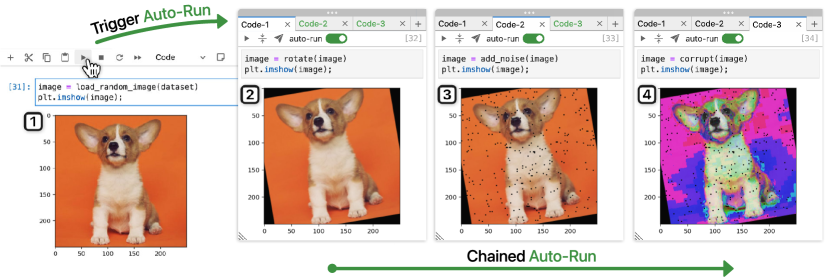
 They first run a code cell in the main notebook that loads a random image from their dataset.
This interaction triggers three Sticky Codes with auto-run toggled to automatically execute in a chained manner:
They first run a code cell in the main notebook that loads a random image from their dataset.
This interaction triggers three Sticky Codes with auto-run toggled to automatically execute in a chained manner:  first rotating the original image;
  then adding noise to the rotated image;
  finally corrupting the edited image.
In the Sticky Dock, users can create a tab that contains a traditional code cell, where each cell has an input and output cell (Fig. 3). In computational notebooks, users write scripts (e.g., Python, R, Julia) in the input cell, and the output cell displays the result after users execute the input cell. The output cell can render many different forms of data, from simple strings, tables, and charts to any HTML markups. Therefore, users can use the Sticky Code to display online videos and interactive visual analytics tools (Wexler et al., 2019; Tenney et al., 2020; Li et al., 2020).
Users can easily create new Sticky Code cells by using drag-and-drop to copy cell code from the notebook to StickyLand. Users can also create a new Sticky Code from scratch. The Sticky Code has a cell synchronization feature: code in the Sticky Code inherits and shares the code and execution states from the notebook, so editing and executing the cell in StickyLand will make the same changes to the content and execution states in the notebook as well. In other words, users can access variables defined in the notebook from StickyLand, and vice versa. Sticky Code shares the global code state so that it is easier for users to keep a mental model of the code execution history across the notebook.
On top of the input cell in the Sticky Code, there is a toolbar with four buttons, where users can click to run, hide the input cell, make the cell float (§ 3.4), and toggle the auto-run mode. When the auto-run mode is active, every time the user runs a different cell from the notebook or StickyLand (Fig. 3-1), the Sticky Code automatically runs the input cell and displays the output (Fig. 3-2). The auto-run feature helps users avoid manually running cells that need recurring updates, such as code that displays the results of code experiments. If there are multiple Sticky Codes in the auto-run mode, StickyLand will automatically run them in the order they are created (Fig. 3-24). Sticky Dock also highlights auto-run Sticky Code that has unseen updates with a green tab name.
3.3. Sticky Markdown
The Sticky Markdown is similar to the Sticky Code (§ 3.2): users can type Markdown code in the input cell, and then the output cell will render the corresponding formatted textual result. Users can use a keyboard shortcut or toolbar buttons to switch between the input and output cells. Similarly to the Sticky Code, users can make the Sticky Markdown float, and the content of a Sticky Markdown is synchronized with its corresponding cell in the notebook. Users can also render LaTeX mathematical equations in the input cell. With Sticky Markdowns, users can easily store artifacts such as data exploration notes, code snippets, and to-do lists.
3.4. Floating Cells
There is a “launch” button in the toolbar of both Sticky Code and Sticky Markdown (Fig. 3-2), where users can click to launch the sticky cell outside of the Sticky Dock container (Fig. 1D). Then, the cell transitions into a separate cell window with a smooth animation. This Floating Cell floats on top of the notebook, and it does not move when users scroll the notebook. During the transition, the cell window is auto-resized to fit the input cell size. Users can drag the header of Floating Cell to change its position and drag the left corner to resize the window. Floating Sticky Code and Sticky Markdown keep all the same functionalities including auto-run as they are in the Sticky Dock. Users can minimize or close the Floating Cell by clicking the buttons on its header.
In addition, StickyLand allows users to launch multiple Floating Cells on the screen. Therefore, with a combination of floating Sticky Code and Sticky Markdown as well as the auto-run feature, users can easily create an interactive dashboard. With different components on a dashboard, users can display text and visual outputs, provide input values, run code, or interact with stand-alone interactive tools. As users can freely customize and arrange Floating Cells, users can use the interactive dashboard for data analysis or as a storyboard to communicate data insights to other people.
3.5. Open-source Implementation
We implement StickyLand as a JupyterLab Extension.222JupyterLab Extension:https://github.com/jupyterlab/extension-examples With JupyterLab’s flexible and extensible design, we can customize the presentation styles of notebooks. Through extension APIs, StickyLand has access to cell content, and it can listen to code execution events from the notebooks. With a responsive design and integrated style as native UI elements, we hope StickyLand can provide data scientists a seamless experience when using JupyterLab for exploratory data analysis. We also release StickyLand as a Python package so that users can easily install it with one command.
4. Usage Scenario
4.1. Exploratory Data Analysis
![[Uncaptioned image]](/html/2202.11086/assets/x12.png)
As a junior data scientist, Carl struggles with organization and keeping track of his thoughts and findings. With StickyLand, he can keep everything in the same place for easy access. Carl is working on a complicated task with many steps, so he opens StickyLand and creates a new tab with a new Sticky Markdown cell from scratch. He double clicks the input cell to enter the editing mode and adds his to-do list (shown on the right); it helps him plan his work process. As he keeps working, he can always see the list of steps that helps him remember and follow his plan. Carl also clicks the rendered checkbox to check-off completed items and update the list as needed. As he continues conducting the data analysis, he creates a new Sticky Markdown tab and writes down his thoughts and findings. The next day, he has a “gotcha” moment at work, so he quickly opens StickyLand as a reference to remember his findings from the day before and make comparisons. Here, StickyLand acts like a miniature notebook that is always accessible, as it persists on the screen regardless of the tasks happening in the notebook. Now Carl wants to test and compare some results to confirm some hypotheses regarding the dataset, but his visualization results are buried in different sections within his long notebook. To better organize these visualizations, Carl creates several Sticky Codes tabs and drags related code into StickyLand. He also collapses the input cell so that only the visualization output is visible. Carl turns on the auto-run mode on all visualization Sticky Codes, so that every time he makes a change in the notebook, the visualization refreshes. Now Carl can focus on writing code in the main document to try out different data transformation methods, as he can always inspect the latest experiment results in StickyLand. With accessible and automatically-updated visualizations, Carl can quickly verify his hypotheses.
4.2. Communicating Machine Learning Models
Auto-run feature image
 markdown text describing the dashboard,
  input field to specify a feature to diagnose,
  auto-run chart showing the distribution of the specified feature,
  second input field to further specify the range within the feature to diagnose,
  auto-run table displaying all samples that meet the criteria,
  auto-run visualization explaining how the ML model makes decision on these samples,
  interactive tool allowing the ML engineer to fix the ML model by editing its parameters based on their error analysis.
Ellie, a senior machine learning (ML) engineer at a financial institution, has trained an ML model that helps the institution make loan application decisions.
This model takes inputs of an individual’s financial information, such as credit score, annual income, and employment length, to inform a lending decision.
As this model could directly affect the livelihood of thousands of clients, Ellie wants to make sure that the model’s behavior aligns with the financial experts’ knowledge and does not discriminate against specific demographics.
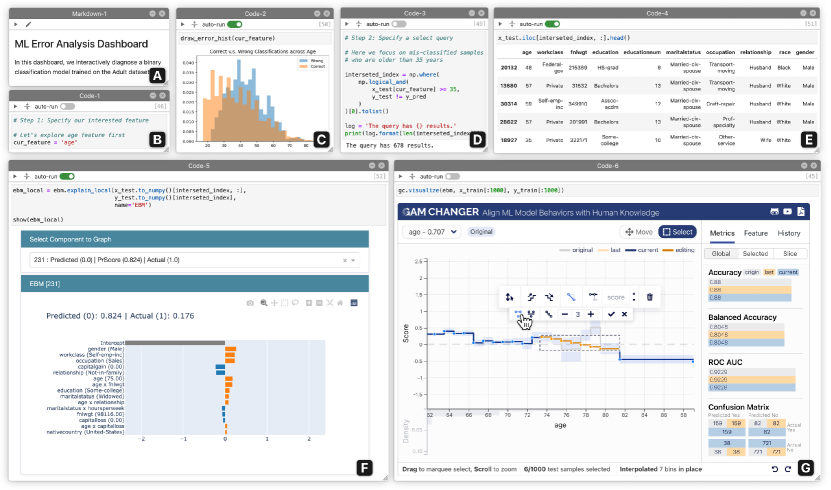
Ellie develops her model in JupyterLab, so she decides to use StickyLand to create an interactive dashboard (Fig. 4) to perform ML model error analysis with a financial expert.
She first creates a Sticky Markdown that describes the purpose of the dashboard, and then she clicks the launching button to convert the cell to a ![]() Floating Cell (Fig. 4A) that floats on top of the notebook.
She drags the Floating Cell to the top left of the notebook and resizes it accordingly.
Following the same procedure, Ellie further creates:
Floating Cell (Fig. 4A) that floats on top of the notebook.
She drags the Floating Cell to the top left of the notebook and resizes it accordingly.
Following the same procedure, Ellie further creates:
-
![[Uncaptioned image]](/html/2202.11086/assets/x29.png)
Code cell that allows users to specify a feature from the dataset on which to perform error analysi
-
![[Uncaptioned image]](/html/2202.11086/assets/x31.png)
Histogram chart with auto-run that visualizes the distribution of all samples on the specified feature
-
![[Uncaptioned image]](/html/2202.11086/assets/x33.png)
Code cell that allows users to further specify a range with the selected feature to diagnose the model
-
![[Uncaptioned image]](/html/2202.11086/assets/x35.png)
Table with auto-run that displays the details of all samples from the dataset that meet the specified range
-
![[Uncaptioned image]](/html/2202.11086/assets/x37.png)
Interactive chart with auto-run that explains how the model makes the decision on these samples (Nori et al., 2019)
-
![[Uncaptioned image]](/html/2202.11086/assets/x39.png)
ML editor that helps users align a model’s behavior with their knowledge by editing the model’s parameters (Wang et al., 2021)
Then, Ellie and the financial expert examine the model’s behaviors across common under-represented demographics (e.g., older people and people of color) by changing the feature and feature range in two code cells (Fig. 4B, D). Once Ellie runs these two cells, all other cells in the dashboard with auto-run toggled automatically refresh themselves and display information in sync with the specified subset of data. Finally, they use the model editor (Fig. 4G) to create a more equitable model by editing its parameters to mitigate biases they discover from this dashboard. With StickyLand, Ellie is now able to quickly build an interactive and tightly-integrated dashboard that supports collaborative and complex visual analytics.
4.3. Learning Programming
Russel, an undergraduate computer science student, is taking a class to learn how to use Python for data analysis. His instructor requires students to submit their assignments in Jupyter Notebooks. The starter notebook lists detailed instructions at the top followed by a long list of skeleton code. When completing the assignments, Russel usually has to scroll all the way back up to check the instructions.
![[Uncaptioned image]](/html/2202.11086/assets/x41.png)
After installing StickyLand this week, he realizes he can drag the instructions into a new Sticky Markdown to store the steps to refer to as he works through the assignment. Russel is struggling with completing one problem as he keeps forgetting the syntax and how to use some Python functions. To get help, Russel creates a new floating Sticky Code in StickyLand, where he imports a YouTube video of a Python tutorial with code walk through. He then drags that Sticky Code cell to resize the video so that he can read the code in the video. Seeing the video while writing code at the same time helps Russel solve many problems. Later, Russel gets frustrated that he keeps forgetting the parameter list of some functions. Therefore, he creates another floating Sticky Code where he prints out the documentation of confusing functions (shown on the right). This sticky cell enables Russel to quickly refer to the syntax of functions while completing the assignment. With StickyLand’s help, Russel quickly finishes this week’s assignment and eagers to learn more.
5. Limitations & Future Work
While StickyLand can help users better organize their code in computational notebooks, there are some potential improvements to our current system design regarding the auto-run feature (§ 5.1), code states (§ 5.2), and notebook platforms (§ 5.3). We also plan to conduct a user study to evaluate StickyLand (§ 5.4).
5.1. Support Topological Auto-run
We develop the auto-run feature in Sticky Code to help users avoid running cells that need recurring updates (§ 3.2). When auto-run is activated, a Sticky Code would automatically execute its code after any other cell is executed. However, this mode can fail in some special cases. For example, an auto-run Sticky Code A depends on cell B which depends on cell C. If a user runs cell C, then the Sticky Code A can yield unexpected results after its automatic execution, because cell B is not updated. Also, an auto-run Sticky Code might waste unnecessary execution time when a user runs unrelated cells. To address this issue, we plan to take inspirations from Observable333Observable: https://observablehq.com and support topological automatic execution: auto-run Sticky Code would only run when their referenced values changed in other cells, and it would also automatically recompute all intermediate cells that uses the same referenced values in a topological order.
5.2. Explore Separate States
We are working on adding the feature of separating the code state in StickyLand from the cell state in the main notebook. This feature would be a unidirectional state sharing mechanism, where the code in the Sticky Code inherits states from the notebook, but the code in the notebook does not have access to the states in the Sticky Code. In other words, instead of creating Sticky Code that live in one big program as the notebook, these cells would be independent from each other, with their own scope, thus providing better abstraction, freedom from side effects, and separation of concerns. For example, users can create visualizations in the Sticky Code using data from the notebook, but they cannot access variables defined in the Sticky Code from the notebook. By partially separating the execution states, StickyLand might help avoid information overload when tracking the code states across the notebook. For example, a user can use cells with separate states as a “safe space” for throw-away experiments, as they do not need to worry about interfering with the states in the notebook. Thus, having separate code states might further challenge the linearity of computational notebooks.
5.3. Generalize to Other Notebooks
For future work, we would look at generalizing StickyLand to be used for other computational notebooks such as Google Colab, VSCode Notebook, Azure Notebook. While Jupyter is the most popular computational notebook, expanding StickyLand to other notebooks with similar functionality would increase benefits to a wider range of users. StickyLand could then help more users who work in different domains with different programming languages.
5.4. Planned Evaluation
We are preparing to conduct a survey study to evaluate the usability of StickyLand. We will recruit data scientists who use JupyterLab or Jupyter Notebook in their work through social media and word of mouth. Then, we will provide participants with information regarding the features of our tool and detailed instructions on how to use it in notebooks with a tutorial video. We will ask participants to use StickyLand in their daily work. After some time, we will ask participants to complete a survey to (1) report their daily usage and use patterns, (2) evaluate the usability of our tool, and (3) provide feedback on the design and implementation.
6. Conclusion
As computational notebooks have become the most popular programming tool among data scientists, it is critical to address the limitations of the current notebook design. In this work, we present StickyLand, a user interface that leverages an always-on workspace to break the linear presentation of traditional notebooks. We implement our tool as an open-source JupyterLab extension. It enables users to easily install and use StickyLand in their daily work. Also, future designers and developers can use our tool to explore alternative notebook designs and implementations. We discussed use scenarios where users with different levels of familiarity with data science can benefit from a non-linear layout of computational notebooks. We hope our work will inspire future researchers to study and evaluate alternative notebook designs that help improve the usefulness, productivity, and user experience for notebook users and eventually help democratize data science.
Acknowledgements.
We thank Haekyu Park, Rahul Duggal, Duen Horng (Polo) Chau, Benjamin Hoover, and Seongmin Lee for the fruitful discussions. We appreciate the Project Jupyter community for answering our JupyterLab extension development questions. We are also very grateful to anonymous reviewers for their valuable feedback.References
- (1)
- Bragdon et al. (2010) Andrew Bragdon, Robert Zeleznik, Steven P. Reiss, Suman Karumuri, William Cheung, Joshua Kaplan, Christopher Coleman, Ferdi Adeputra, and Joseph J. LaViola. 2010. Code Bubbles: A Working Set-Based Interface for Code Understanding and Maintenance. In Proceedings of the 28th International Conference on Human Factors in Computing Systems - CHI ’10. ACM Press, Atlanta, Georgia, USA, 2503.
- Chattopadhyay et al. (2020) Souti Chattopadhyay, Ishita Prasad, Austin Z. Henley, Anita Sarma, and Titus Barik. 2020. What’s Wrong with Computational Notebooks? Pain Points, Needs, and Design Opportunities. In Proceedings of the 2020 CHI Conference on Human Factors in Computing Systems. ACM, Honolulu HI USA, 1–12.
- Han et al. (2020) Han L. Han, Miguel A. Renom, Wendy E. Mackay, and Michel Beaudouin-Lafon. 2020. Textlets: Supporting Constraints and Consistency in Text Documents. In Proceedings of the 2020 CHI Conference on Human Factors in Computing Systems. ACM, Honolulu HI USA, 1–13.
- Hartmann et al. (2008) Björn Hartmann, Loren Yu, Abel Allison, Yeonsoo Yang, and Scott R Klemmer. 2008. Design as Exploration: Creating Interface Alternatives through Parallel Authoring and Runtime Tuning. In Proceedings of the 21st Annual ACM Symposium on User Interface Software and Technology. 91–100.
- Head et al. (2019) Andrew Head, Fred Hohman, Titus Barik, Steven M. Drucker, and Robert DeLine. 2019. Managing Messes in Computational Notebooks. In Proceedings of the 2019 CHI Conference on Human Factors in Computing Systems. ACM, 1–12.
- Kaggle (2021) Kaggle. 2021. State of Machine Learning and Data Science 2021.
- Kery et al. (2017) Mary Beth Kery, Amber Horvath, and Brad Myers. 2017. Variolite: Supporting Exploratory Programming by Data Scientists. In Proceedings of the 2017 CHI Conference on Human Factors in Computing Systems. ACM, Denver Colorado USA, 1265–1276.
- Kery et al. (2019) Mary Beth Kery, Bonnie E. John, Patrick O’Flaherty, Amber Horvath, and Brad A. Myers. 2019. Towards Effective Foraging by Data Scientists to Find Past Analysis Choices. In Proceedings of the 2019 CHI Conference on Human Factors in Computing Systems. ACM, Glasgow Scotland Uk, 1–13.
- Kery et al. (2018) Mary Beth Kery, Marissa Radensky, Mahima Arya, Bonnie E. John, and Brad A. Myers. 2018. The Story in the Notebook: Exploratory Data Science Using a Literate Programming Tool. In Proceedings of the 2018 CHI Conference on Human Factors in Computing Systems. ACM, Montreal QC Canada, 1–11.
- Kery et al. (2020) Mary Beth Kery, Donghao Ren, Fred Hohman, Dominik Moritz, Kanit Wongsuphasawat, and Kayur Patel. 2020. Mage: Fluid Moves Between Code and Graphical Work in Computational Notebooks. In Proceedings of the 33rd Annual ACM Symposium on User Interface Software and Technology. ACM, Virtual Event USA, 140–151.
- Kluyver et al. (2016) Thomas Kluyver, Benjamin Ragan-Kelley, Fernando Pérez, Brian E. Granger, Matthias Bussonnier, Jonathan Frederic, Kyle Kelley, Jessica B. Hamrick, Jason Grout, Sylvain Corlay, Paul Ivanov, Damián Avila, Safia Abdalla, Carol Willing, and Jupyter Development Team. 2016. Jupyter Notebooks - a Publishing Format for Reproducible Computational Workflows. In ELPUB.
- Knuth (1984) Donald Ervin Knuth. 1984. Literate Programming. The computer journal 27, 2 (1984), 97–111.
- Lau et al. (2020) Sam Lau, Ian Drosos, Julia M. Markel, and Philip J. Guo. 2020. The Design Space of Computational Notebooks: An Analysis of 60 Systems in Academia and Industry. In 2020 IEEE Symposium on Visual Languages and Human-Centric Computing (VL/HCC). IEEE, Dunedin, New Zealand, 1–11.
- Li et al. (2020) Siwei Li, Zhiyan Zhou, Anish Upadhayay, Omar Shaikh, Scott Freitas, Haekyu Park, Zijie J. Wang, Susanta Routray, Matthew Hull, and Duen Horng Chau. 2020. Argo Lite: Open-Source Interactive Graph Exploration and Visualization in Browsers. arXiv:2008.11844 (Aug. 2020).
- Mikami et al. (2017) Hiroaki Mikami, Daisuke Sakamoto, and Takeo Igarashi. 2017. Micro-Versioning Tool to Support Experimentation in Exploratory Programming. In Proceedings of the 2017 CHI Conference on Human Factors in Computing Systems. ACM, Denver Colorado USA, 6208–6219.
- Nelson et al. (2017) Nicholas Nelson, Anita Sarma, and André van der Hoek. 2017. Towards an IDE to Support Programming as Problem-Solving.. In PPIG. 15.
- Nori et al. (2019) Harsha Nori, Samuel Jenkins, Paul Koch, and Rich Caruana. 2019. InterpretML: A Unified Framework for Machine Learning Interpretability. arXiv:1909.09223 (Sept. 2019).
- Randles et al. (2017) Bernadette M. Randles, Irene V. Pasquetto, Milena S. Golshan, and Christine L. Borgman. 2017. Using the Jupyter Notebook as a Tool for Open Science: An Empirical Study. In 2017 ACM/IEEE Joint Conference on Digital Libraries (JCDL). IEEE, Toronto, ON, Canada, 1–2.
- Rule et al. (2018) Adam Rule, Aurélien Tabard, and James D. Hollan. 2018. Exploration and Explanation in Computational Notebooks. In Proceedings of the 2018 CHI Conference on Human Factors in Computing Systems. ACM, Montreal QC Canada, 1–12.
- Tenney et al. (2020) Ian Tenney, James Wexler, Jasmijn Bastings, Tolga Bolukbasi, Andy Coenen, Sebastian Gehrmann, Ellen Jiang, Mahima Pushkarna, Carey Radebaugh, Emily Reif, and Ann Yuan. 2020. The Language Interpretability Tool: Extensible, Interactive Visualizations and Analysis for NLP Models. In Proceedings of the 2020 Conference on Empirical Methods in Natural Language Processing: System Demonstrations. Association for Computational Linguistics, Online, 107–118.
- Wang et al. (2021) Zijie J. Wang, Alex Kale, Harsha Nori, Peter Stella, Mark Nunnally, Duen Horng Chau, Mihaela Vorvoreanu, Jennifer Wortman Vaughan, and Rich Caruana. 2021. GAM Changer: Editing Generalized Additive Models with Interactive Visualization. arXiv:2112.03245 (Dec. 2021).
- Weinman et al. (2021) Nathaniel Weinman, Steven M. Drucker, Titus Barik, and Robert DeLine. 2021. Fork It: Supporting Stateful Alternatives in Computational Notebooks. In Proceedings of the 2021 CHI Conference on Human Factors in Computing Systems. ACM, Yokohama Japan, 1–12.
- Wexler et al. (2019) James Wexler, Mahima Pushkarna, Tolga Bolukbasi, Martin Wattenberg, Fernanda Viegas, and Jimbo Wilson. 2019. The What-If Tool: Interactive Probing of Machine Learning Models. IEEE Transactions on Visualization and Computer Graphics (2019).
- Wu et al. (2020) Yifan Wu, Joseph M. Hellerstein, and Arvind Satyanarayan. 2020. B2: Bridging Code and Interactive Visualization in Computational Notebooks. In Proceedings of the 33rd Annual ACM Symposium on User Interface Software and Technology. ACM, Virtual Event USA, 152–165.