Understanding the fragile-to-strong transition in silica from microscopic dynamics
Abstract
In this work, we revisit the fragile-to-strong transition (FTS) in the simulated BKS silica from the perspective of microscopic dynamics in an effort to elucidate the dynamical behaviors of fragile and strong glass-forming liquids. Softness, which is a machine-learned feature from local atomic structures, is used to predict the microscopic activation energetics and long-term dynamics. The FTS is found to originate from a change in the temperature dependence of the microscopic activation energetics. Furthermore, results suggest there are two diffusion channels with different energy barriers in BKS silica. The fast dynamics at high temperatures is dominated by the channel with small energy barriers (1 eV), which is controlled by the short-range order. The rapid closing of this diffusion channel when lowering temperature leads to the fragile behavior. On the other hand, the slow dynamics at low temperatures is dominated by the channel with large energy barriers controlled by the medium-range order. This slow diffusion channel changes only subtly with temperature, leading to the strong behavior. The distributions of barriers in the two channels show different temperature dependences, causing a crossover at 3100 K. This transition temperature in microscopic dynamics is consistent with the inflection point in the configurational entropy, suggesting there is a fundamental correlation between microscopic dynamics and thermodynamics.
I Introduction
Glass-forming liquids based on the temperature dependence of dynamical slowing-down can be classified into two groups.[1, 2] If the viscosity (or other similar dynamic properties like diffusion coefficient and relaxation time) shows Arrhenius-like temperature dependence, e.g., in the case of silica, the liquid is referred to as “strong”. In other liquids including most organic and metallic glass formers, which are referred to as “fragile”, the slowing-down of the dynamics can be more drastic, with properties like viscosity showing super-Arrhenius temperature dependence. Fragility, which can be defined based on the degree of deviation from the Arrhenius behavior, is one of the most important concepts in glass physics, as it leads to intriguing questions on why dynamics slows down so quickly in some liquids and what controls the different behaviors.[3] To answer these questions, the fragile-to-strong transition (FTS, or fragile-to-strong crossover) discovered in many glass-forming systems such as silica has attracted much attention.[4, 5, 6, 7] During FTS, a crossover in the liquid’s dynamic behavior occurs without compositional changes or significant structural transformations. Understanding the cause of FTS could therefore provide unique insights into the origin of fragility.
The perspective on FTS so far is largely based on relating dynamics to thermodynamics, motivated by the Adam-Gibbs relation and further supported by the random first-order transition theory (RFOT).[8, 9] The explanation focuses on the configurational entropy describing the number of inherent states, i.e., local minima, on potential energy landscape (PEL) explored by the system in equilibrium.[10, 11] Saika-Voivod et al. demonstrated based on molecular dynamics (MD) simulations that the Adam-Gibbs relation is obeyed in liquid silica, and that an inflection in may be responsible for the FTS.[5, 12] The work related this thermodynamic inflection to polyamorphism, a liquid-liquid phase transition, but this is not supported by experiments or simulations. Later, Saksaengwijit et al. explained the thermodynamic phenomenon by a depletion of inherent states below a cutoff on the silica PEL, inferred by MD simulations.[13] In this view, as the distribution of the sampled states touches the cutoff of the PEL, decreases more and more slowly with lowering temperature and eventually becomes constant.
However, discrepancies still exist in the understandings of FTS. In our recent replica exchange molecular dynamics (REMD) simulations of silica,[14] we did not observe a sudden depletion of states around the FTS temperature (i.e., from 3500 K down to 2000 K, as shown in Supplementary Information Fig. S2a). We attribute this discrepancy with the previous study to the ability in efficiently achieving equilibrium in REMD simulations, which is difficult in regular MD simulations of silica liquids below the FTS. Nonetheless, our simulation indeed confirmed the existence of an inflection point in at the FTS, as shown in SI Fig. S2b. The decrease of becomes slower as silica enters the strong region. However, because this can no longer be attributed to the sudden depletion of the states on the PEL, the source of this inflection point remains unclear.
In addition, the FTS may also be related to changes in the dynamics of local atomic rearrangements (hereinafter referred to as microscopic dynamics), which involves predominantly atomic hopping in the covalent network of silica. Saksaengwijit et al. observed the inherent structures above and below the FTS differ in the concentrations of short range defects.[13] This suggests that bond breaking, and therefore the microscopic dynamics, is more active above the transition. There have been debates on the contribution of microscopic dynamics to the dynamic slowdown in glass-forming liquids in general.[15, 16] Understanding the role of microscopic dynamics in FTS would provide direct insights to help resolve this issue.
Here, we investigate the features of the PEL related to microscopic dynamics, i.e., distribution of activation barriers, in BKS silica liquid across the FTS, by means of machine learning (ML). Obtaining accurate statistics of microscopic activation barriers using traditional MD approaches would involve identifying large numbers of atom jumps (for both dynamically active and inactive atoms) and computing the associated barrier heights, which is very challenging computationally. Recently, Liu and colleagues developed a ML method that can successfully connect local atomic structure to microscopic dynamics.[17, 18] The ML-generated quantity “softness”, which can be obtained solely from atomic structures, demonstrates clear correlations with dynamics in various systems.[19, 20] Once the ML model is carefully trained and tested, microscopic activation barriers for individual atoms can be estimated from their local atomic environments based on their softnesses. By analyzing inherent structures collected from equilibrated MD simulations, we can examine how the barrier distribution changes with temperature in both fragile and strong silica liquids, thereby elucidating the role of microscopic dynamics in FTS.
II Results
II.1 Predicting diffusion from local atomic structures
The machine learning model is a key element of this study. Based on the methodology from Schoenholz et al.,[18, 21] we implemented several modifications to improve the ML efficiency and accuracy for the silica system. Instead of using hundreds of symmetry functions to train the model, we only employ 10 structural features as inputs. The inputs include means and variances of distances and angles (listed in Sec. IV.1) based on the tetrahedral orders of SiO4 and SiSi4 in silica. The output is whether an atom will rearrange in the next 1 ps. This is a smaller time window than previously used because we found it gives a better prediction accuracy. The ML training datasets are generated from inherent structures obtained from MD trajectories of equilibrated supercooled BKS silica liquid at 2600 K. After training, the accuracy of 86% (and the recall, measuring the fraction of rearranging atoms that are correctly predicted, 79%) was achieved, which is higher than previously obtained for the same system.[21] The ML quantity “softness” is defined similarly to the previous studies, i.e., as the distance to the hyperplane for classification. Here we focus on Si atoms although we have obtained similar results were with O atoms as well. Details of the ML methods and the softness calculation can be found in Sec. IV.1 and SI.
After training, the ML model is utilized to study the FTS in two steps. In the first step, we use softness to estimate microscopic dynamics and the associated energy barrier statistics. The relationship between softness and activation energy of microscopic dynamics is established by applying the ML model to various temperatures from 2600 to 4000 K and statistically computing the rearrangement probability as a function of softness (denoted as ). For the selected time window of 1 ps, the total rearrangement probability, (=1 ps) can be expressed as a function of an elementary rearrangement probability (or atomic hopping probability) by
| (1) |
where is the number of hopping attempts within . within the temperature range we investigate is assumed as 30 for 1 ps, based on the vibrational density of states of amorphous silica.[22, 23] The previous study used for this value.[21] Since the hopping probability is small, choosing different values mainly affects the absolute value of we obtain rather than its trend with temperature. The elementary rearrangement probability can be described based on the transition state theory as
| (2) |
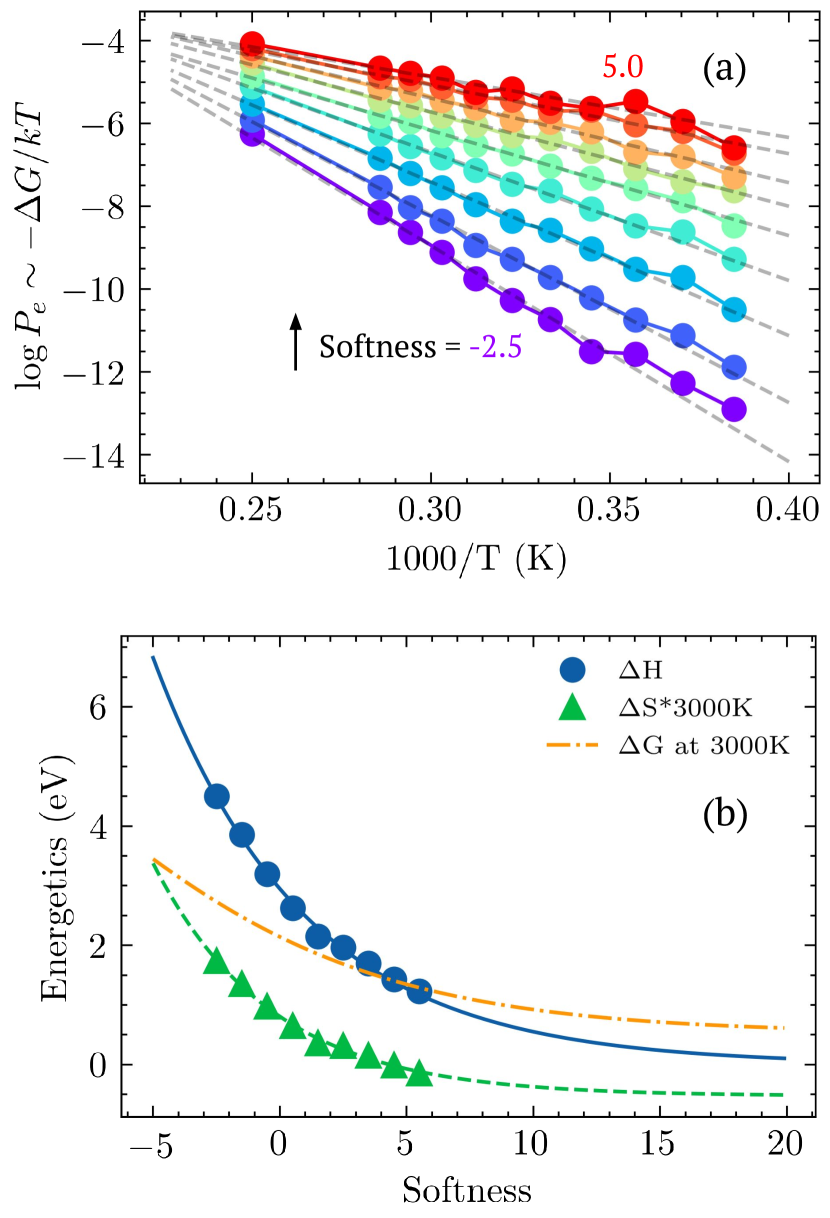
where , , and are free energy, entropy, and enthalpy of activation, respectively. Note that the small variation in the hopping attempt frequency over the temperature range is accounted for through the prefactor term of . As shown in Fig. 1a, the rearrangement probability for atoms with a given softness shows an Arrhenius behavior with temperature. The slope of the Arrhenius function gives and the intercept . Fig. 1b summarizes the calculated and as functions of softness . The enthalpy and entropy of activation both decrease with increasing softness. This relationship can be fitted with exponential function , where and are fitting parameters. Because a minimum value of zero is expected for (i.e., zero barrier height) but not for (which is simply the entropy of the transition state with respect to the ground state), a constant is included to the exponential fitting for , . Nevertheless, the activation free energy can now be established as a function of softness. Combined with softness distributions obtained by applying the ML model to inherent structures generated from MD simulations, we are able to predict microscopic dynamics and associated activation energy distribution for silica liquids at various temperatures.
In the second step, we investigate FTS using softness based on the correlation between short- and long- term dynamics in silica liquids. The elementary hopping probability predicted so far is linearly related to short-term dynamics, represented by the mean squared displacements (MSD) over a short time relative to the relaxation time, e.g., 1 ps, assuming a constant hopping distance :
| (3) |
Note that the short-term dynamics here is based on inherent structures and therefore the thermal vibrations have been excluded. As shown in Fig. S4a, MSDIS(1ps) predicted by softness agree well with those calculated directly from MD trajectories. However, the FTS in silica liquid manifests in long-term dynamics, e.g., in bulk diffusion coefficients. To bridge the dynamics at different time frames, we found that the bulk diffusivity in silica liquid is connected to the elementary hopping probability (or short-term/microscopic dynamics) through a quadratic relationship:
| (4) |
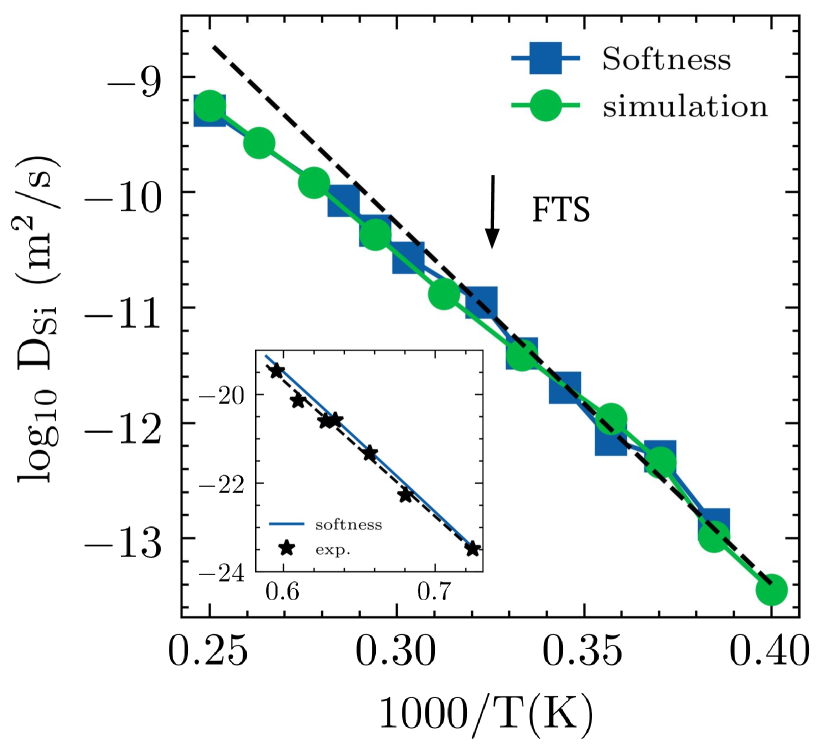
where is found to be around 2 based on MD simulation results. This relationship is phenomenological and based on the evolution of the time dependence of MSD from short- to long- term. The details of the calculations are reported in SI. Extrapolating short-term dynamics to long term using this relationship, we can now estimate bulk diffusivity using softness. As shown in Fig. 2, diffusion coefficients of Si atoms predicted by softness are in good agreements with those calculated directly from 300 ns MD trajectories. Similar to the diffusion behavior directly observed in MD simulations, a FTS is clearly present in the softness-predicted diffusion coefficient around 3100 K. By demonstrating the FTS can be predicted from local structures that control atomic hopping, we show that the transition may be rooted in microscopic dynamics that is directly resolved by softness.
II.2 Activation energetics of microscopic dynamics
We now utilize the ML model to further investigate the origin of the FTS. Taking atomic snapshots of the silica liquid, atoms in different local environments have different softnesses, representing their propensity for different microscopic dynamics. The softness distributions in liquid silica at different temperatures are shown in Fig. 3a. At the highest temperature we investigated, 4000 K, the softness distribution shows a peak around -1 with a long tail of large softness extending to . At this temperature, atoms with large softnesses, i.e., that can easily hop or rearrange, pervade in the liquid. The tail of large softnesses shrinks in proportion to the main peak as the temperature decreases. At 2600 K, most atoms show low propensity for local rearrangement, i.e., covered under the main peak. The distinct peak around -1 present at all temperatures suggests there is a main type of atomic environments in silica liquids associated with slow microscopic dynamics. Our ML results indicate this corresponds to the ideal tetrahedral order in the short range. Atoms without such ordered atomic environments, captured by the long tail of large softnesses, contribute to fast microscopic dynamics. The relative proportions of the two groups change with temperature. As such, when the averaged softness in the liquid is plotted versus temperature in Fig. 3b, two linear portions can be observed with a break of slope at 3100 K, coinciding with the FTS.
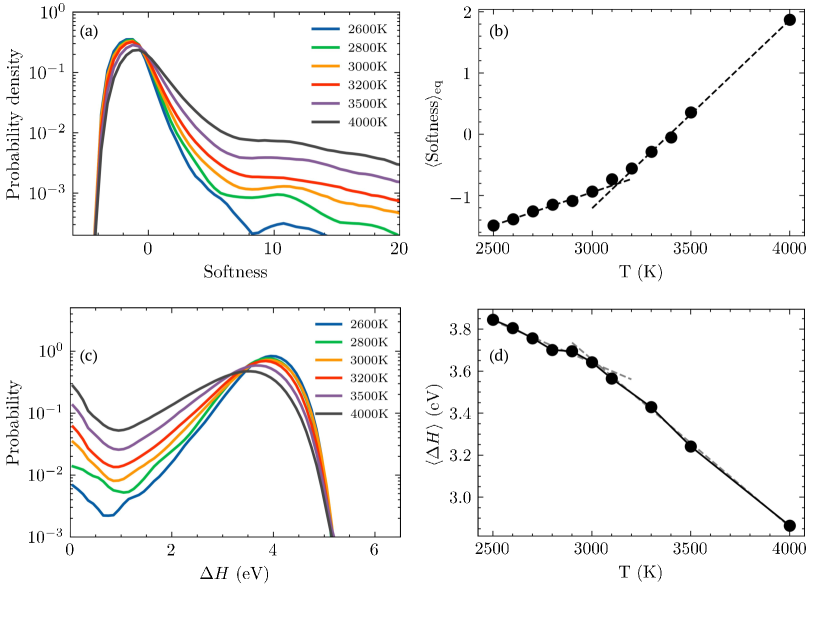
We further predict the distributions of microscopic activation enthalpies , i.e., the energy barriers for the elementary atomic hops, based on the relationship in Fig. 1b. Distributions of the energy barriers at all temperatures are clearly bimodal, as shown in Fig. 3c, with one main peak at 4 eV and a smaller peak around zero. Again, the main peak corresponds to atoms in well-coordinated tetrahedral environments. Hopping of these atoms is associated with substantial energy barriers. As the temperature decreases, the proportion of these atoms and associated energy barrier height both increase slowly, as suggested by the main peak increasing in intensity and shifting right. The changes in this peak become even more subtle below the FTS, suggesting the coordination environment becomes rather stable for these atoms at low temperatures. The secondary peak around represents a microscopic dynamics channel associated with very small energy barriers. With lowering temperature, the height of this peak decreases quadratically in the case of liquid silica (please refer to SI for more detailed analysis).[25] As a result of different temperature dependencies of the two microscopic dynamics channels, the averaged activation enthalpy shows a transition around 3100 K, as shown in Fig. 3d. Note that, although the overall activation energy associated with the bulk diffusivity is not equal to the averaged microscopic activation enthalpy, they are linearly related, as shown in Fig. S6a. The activation energy in the low temperature region changes slowly with temperature, leading to a stronger behavior than the high temperature region.
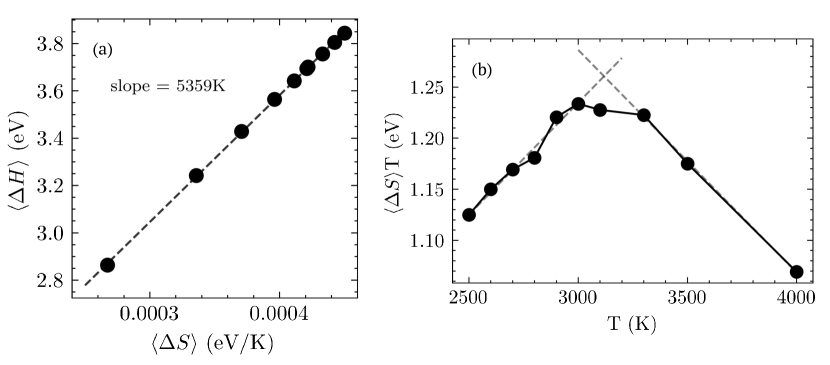
As the other factor in the elementary rearrangement probability (Equation 2), the activation entropy is approximately linear to the average activation enthalpy, as shown in Fig. 4a. This relationship given by is consistent with the enthalpy-entropy compensation observed in many systems.[26] The slope 5360 K indicates an onset temperature where diffusion of Si atoms in silica is independent of the local atomic structure, separating the activated dynamics regime for supercooled liquids and the free diffusion regime of high-T liquids. It is consistent with the temperature where inherent enthalpy starts to show the typical decreasing trend with temperature during melt-quenching simulations of BKS silica.[5, 27] When the entropic contribution to the activation energy is plotted versus temperature, as shown in Figure 4b, a break of slope is again evident at 3100 K, separating the fragile and strong regions. It is worth mentioning that, calculating the bulk diffusivity by extrapolating the softness distribution in Fig. 3b to the experimental glass transition temperature (detailed in SI Sec. S4) results in a fairly good agreement with the experimental data, as shown in the inset of Fig 2.[24]
III Discussion
To summarize, we demonstrate that the FTS in silica liquid can be explained by changes in the microscopic dynamics. Specifically, the energy barriers for local rearrangements in silica liquid show a bimodal distribution representing two distinct microscopic channels with very different barrier heights. The microscopic dynamics channel associated with very small energy barriers ( eV), or “barrierless”, closes rapidly as the temperature decreases, while the activation energetics of the channel with larger barriers ( eV) has a much weaker temperature dependence. This consequently leads to a crossover in the overall activation energetics at around 3100 K, which manifests itself in the bulk diffusive dynamics as the FTS. Interestingly, water, which is known to have a FTS crossover, is also speculated to have similar bimodality of local structures.[28]
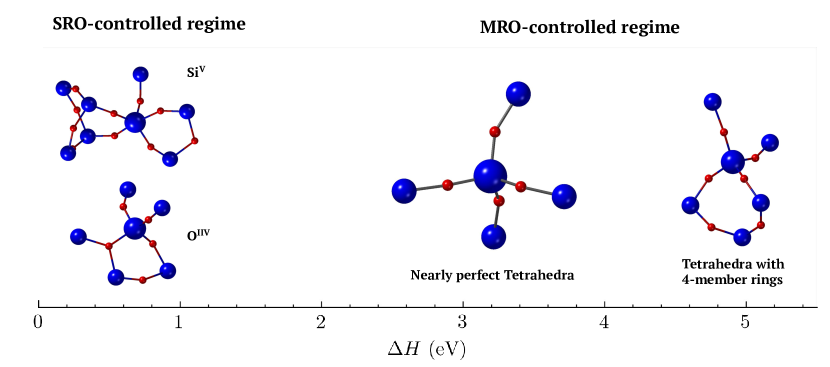
By using physically meaningful inputs for machine learning, we can directly investigate the structural features correlating with the two microscopic dynamics channels (see SI Sec. S5 for details). The smaller energy barriers have strong correlation with defects in the short-range order (SRO), including coordination defects, 3-member rings, and highly distorted SiO4 tetrahedra. Typical structures of these short-range defects are shown in Fig. 5. These structures have strong tendency to rearrange in a short time. The larger energy barriers, on the other hand, are mostly associated with structures with near-ideal SRO, i.e., SiO4 tetrahedra with small distortions. The medium-range order (MRO) for these structures is usually well established as well, in the form of SiSi4 tetrahedron. Small deviations in the SRO and MRO from the ideal tetrahedra do lead to some variations in the softness. It is interesting to note that we observe the barriers above 4.5 eV are associated with a specific MRO that involves distorted SiSi4 tetrahedra involving 4-member rings, suggesting this MRO structure has strong kinetic stability. Although this MRO structure only occurs with a small fraction of the Si atoms, how it is related to silica stability may warrant more investigations.
The link between fragile behavior and SRO defects has been noted in the previous study by Saksaengwijit et al..[13] Here, we propose that the fragile behavior above FTS can be understood by considering the formation of SRO defects as thermally activated like the formation of intrinsic defects in crystals. Previous studies have already shown the concentration of certain SRO defects in silica has strong dependence on temperature (or inherent enthalpy).[29, 25] Some of these defects, such as under or over coordinated Si, are structurally similar to vacancies and interstitials in quartz.[30] However, unlike in crystals where point defects and their formation energy are usually well defined, the SRO defects in glass structures are complex and may involve different levels and types of distortions without obvious coordination defects. This is evident in Fig. 3a where a broad range of large softnesses are observed for atoms in liquid silica. Nonetheless, all these SRO defects can be associated with small microscopic activation energies. As their concentrations quadratically increase with temperatures, the average activation energy decreases, leading to super-Arrhenius behavior in dynamics. Based on this explanation, FTS crossover should be a universal feature of strong glass-forming liquids. Strong behavior is an indication that there exist one or more diffusion channels in the liquid, of which the activation energetics shows weak temperature dependence. In these liquids, the formation of SRO defects will open additional diffusion channels associated with low activation barriers. The crossover occurs when the defect concentration begins to strongly affect the average activation energetics. This is echoed by the recent study on various doped silica melts.[31] For fragile liquids, however, the universality of FTS crossover upon cooling is unclear because there is no guarantee that all liquids have diffusion channels with weakly temperature-dependent energetics.
The insights into the FTS from the microscopic dynamics perspective also suggests that the fragile behavior does not require the presence of cooperative motion. In this study, the fragile behavior in the silica bulk diffusivity is derived from microscopic dynamics under the Stokes-Einstein relationship. This lends support to the important role of microscopic dynamics in glass dynamics in the recent debate.[15, 16] It would be interesting to investigate common fragile liquids to see if there also exist multiple microscopic dynamics channels that show different temperature dependencies. These could be due to SRO defects but can also involve different molecular motions for organic glasses. For studying defects specifically, the softness-based ML approach addresses a major challenge in defining SRO defects in complex amorphous structures.
Finally, question remains on the connection between the origins of the FTS in microscopic dynamics and in configurational entropy. Like in the previous study, our simulations also show FTS is associated with a inflection point in the vs. T (see SI), suggesting there may be fundamental correlations between and microscopic dynamics. This connection was also suggested recently by Berthier et al. to explain the efficiency of the SWAP algorithm within the RFOT framework.[16] The SWAP algorithm, which enhances microscopic dynamics in Monte Carlo simulations by introducing an additional degree of freedom associated with particle sizes,[32] is able to drastically accelerate glass relaxation, a process that has been explained solely based on thermodynamics in theories like RFOT.[9, 33] This was explained by that the effective energy landscape (i.e., the energy landscape seen by the system) is altered by artificial enhancements in the microscopic dynamics, circumventing the metastability that would prevent the system from efficient relaxation in the absence of SWAP. This concept is similar to the concept of ergodicity.[34] Here, by demonstrating the microscopic dynamics origin of the FTS in silica, we provide yet another evidence that quantitatively incorporating the effect of microscopic dynamics on broken ergodicity or effective energy landscape is a critical step towards a full thermodynamic description of supercooled liquids.
IV Methods
IV.1 Machine learning methods
In this study, the ML model is trained to predict rearrangements of individual atoms in silica liquids. The input features are local structural features of atoms. Previous studies and our test studies show that short-range features within 4 Å in silica are the most predictive for rearrangement. Structures within this range involve SiO4 and SiSi4 tetrahedra. Therefore, we use structural features based on these two types of tetrahedra instead of a large number of symmetry functions as in previous studies. For Si atoms specifically, the 10 input features are numbers of O around Si in the first neighboring shell, means and variances of the Si-O bond lengths, means and variances of the O-Si-O bond angles, numbers of Si around center Si in the first neighboring shell, means and variances of the Si-Si distances, means and variances of the Si-Si(center)-Si angles. The 10 features quantitatively describe how the two types of tetrahedra are distorted from the ideal geometry, and atoms in more distorted tetrahedra are expected to rearrange more easily.
The output of the model is whether an atom will rearrange in the next 1 ps (4 ps was used in the previous study for silica [21]). We find that the accuracy of the ML model improves as the time window becomes shorter, although the computational cost for preparing and analyzing data also increases significantly. Besides the previously used hopping probability (an indicator of atomic displacements within a given time window),[35, 36] we also employ local connectivity changes to identify rearrangements. Connectivity is an important feature of glass formers with a rigid network like SiO2. We find that, although the accuracy at the training temperature is not strongly affected, using connectivity helps the ML model make more accurate predictions at higher temperatures. This is because connectivity can effectively distinguish hops from vibrational motions. The cutoff to calculate Si-O connectivity is set to 2 Å based on the range of the first peak in the pair distribution function.
The dataset used for training and testing (25%) are 13,000 inherent structures from MD trajectories at 2600 K, the lowest temperature investigated in this study. Training the ML model at a low temperature allows the model to better capture the effect of structure on the dynamics. However, rearranging atoms are rare comparing to non-rearranging atoms at this temperature. To avoid naive solutions due to class imbalance, the dataset contains the same number of rearranging and non-rearranging events. This is achieved by randomly select a subset of non-rearranging atoms to match the number of rearranging atoms captured from the simulation.
For ML, we use logistic regression with regularization in this study.[37] In our tests, its performance is as good as non-linear classification methods including neural network, random forest, and previously used support vector machine. Similar to previous studies, softness herein is defined to be proportional to the distance to the hyperplane in the feature space.[18] The hyperplane is an dimensional subspace in an dimensional feature space that best separates instances into two classes. Therefore, softness quantifies the probability of one instance to be classified into one class, that is, rearrangement probability (during 1 ps in our case). Note that the quantity of ”softness” would have different mathematical definitions when different ML algorithms are employed. In logistic regression based classification, softness has a simple form , which is a linear combination of input features with a bias.
IV.2 Molecular dynamics simulations
The systems contain 1512 Si atoms and 3024 O atoms in a cubic simulation box with periodic conditions applied in all three directions. The box size is fixed in the canonical (NVT) ensemble to maintain a density of 2.28 g/cm3. The time step is 1 fs and the BKS potential is employed in all the simulations. The cutoff of the potential is chosen as 6.0 Å, which can reproduce the experimental density of 2.2 g/cm3 if the system is melt-quenched under isothermal-isobaric (NPT) ensemble. The temperature range investigated covers 2600 to 4000 K. In simulations at a specific temperature, the initial structure is taken at the same temperature from a melt-quenching simulation trajectory with a cooling rate of 0.01 K/ps. To make sure equilibrium is reached, the system is annealed at each temperature for a sufficiently long time with respect to the relaxation time calculated the from intermediate scattering function (e.g., the system was annealed for 200 ns at 2600 K, comparing with the relaxation time of 50 ns, as shown in Fig. S5). To obtain inherent structures, energy minimization is performed using an MD-based approach that instantaneously quenches the structure to 0 K under 1 bar pressure. The inherent structure is then obtained after continuing the simulation at 0 K for 10 ps. We find this is sufficient to converge the change in the system energy to below 10-4 meV per atom in all cases.
Acknowledgements.
This research was primarily supported by NSF through the University of Wisconsin Materials Research Science and Engineering Center (DMR-1720415).This work used the Extreme Science and Engineering Discovery Environment (XSEDE), which is supported by National Science Foundation grant number ACI-1548562.References
- Angell [1991] C. A. Angell, Relaxation in liquids, polymers and plastic crystals — strong/fragile patterns and problems, Journal of Non-Crystalline Solids Proceedings of the International Discussion Meeting on Relaxations in Complex Systems, 131–133, 13 (1991).
- Angell [1995] C. A. Angell, Formation of Glasses from Liquids and Biopolymers, Science 267, 1924 (1995).
- Ediger et al. [1996] M. D. Ediger, C. A. Angell, and S. R. Nagel, Supercooled Liquids and Glasses, J. Phys. Chem. 100, 13200 (1996).
- Ito et al. [1999] K. Ito, C. T. Moynihan, and C. A. Angell, Thermodynamic determination of fragility in liquids and a fragile-to-strong liquid transition in water, Nature 398, 492 (1999).
- Saika-Voivod et al. [2001] I. Saika-Voivod, P. H. Poole, and F. Sciortino, Fragile-to-strong transition and polyamorphism in the energy landscape of liquid silica, Nature 412, 514 (2001).
- Mallamace et al. [2010] F. Mallamace, C. Branca, C. Corsaro, N. Leone, J. Spooren, S.-H. Chen, and H. E. Stanley, Transport properties of glass-forming liquids suggest that dynamic crossover temperature is as important as the glass transition temperature, PNAS 107, 22457 (2010).
- Zhang et al. [2010] C. Zhang, L. Hu, Y. Yue, and J. C. Mauro, Fragile-to-strong transition in metallic glass-forming liquids, J. Chem. Phys. 133, 014508 (2010).
- Adam and Gibbs [1965] G. Adam and J. H. Gibbs, On the Temperature Dependence of Cooperative Relaxation Properties in Glass-Forming Liquids, J. Chem. Phys. 43, 139 (1965).
- Lubchenko and Wolynes [2007] V. Lubchenko and P. G. Wolynes, Theory of Structural Glasses and Supercooled Liquids, Annu. Rev. Phys. Chem. 58, 235 (2007).
- Goldstein [1969] M. Goldstein, Viscous Liquids and the Glass Transition: A Potential Energy Barrier Picture, J. Chem. Phys. 51, 3728 (1969).
- Debenedetti and Stillinger [2001] P. G. Debenedetti and F. H. Stillinger, Supercooled liquids and the glass transition, Nature 410, 259 (2001).
- Saika-Voivod et al. [2004] I. Saika-Voivod, F. Sciortino, and P. H. Poole, Free energy and configurational entropy of liquid silica: Fragile-to-strong crossover and polyamorphism, Phys. Rev. E 69, 041503 (2004).
- Saksaengwijit et al. [2004] A. Saksaengwijit, J. Reinisch, and A. Heuer, Origin of the Fragile-to-Strong Crossover in Liquid Silica as Expressed by its Potential-Energy Landscape, Phys. Rev. Lett. 93, 235701 (2004).
- Yu et al. [2020] Z. Yu, Q. Liu, I. Szlufarska, and B. Wang, Dataset and bks silica structures for machine learning studies on the structure-thermodynamic stability relationship in silica (Materials Data Facility, 2020).
- Wyart and Cates [2017] M. Wyart and M. E. Cates, Does a Growing Static Length Scale Control the Glass Transition?, Phys. Rev. Lett. 119, 195501 (2017).
- Berthier et al. [2019] L. Berthier, G. Biroli, J.-P. Bouchaud, and G. Tarjus, Can the glass transition be explained without a growing static length scale?, J. Chem. Phys. 150, 094501 (2019).
- Cubuk et al. [2015] E. D. Cubuk, S. S. Schoenholz, J. M. Rieser, B. D. Malone, J. Rottler, D. J. Durian, E. Kaxiras, and A. J. Liu, Identifying Structural Flow Defects in Disordered Solids Using Machine-Learning Methods, Phys. Rev. Lett. 114, 108001 (2015).
- Schoenholz et al. [2016] S. S. Schoenholz, E. D. Cubuk, D. M. Sussman, E. Kaxiras, and A. J. Liu, A structural approach to relaxation in glassy liquids, Nature Physics 12, 469 (2016).
- Schoenholz et al. [2017] S. S. Schoenholz, E. D. Cubuk, E. Kaxiras, and A. J. Liu, Relationship between local structure and relaxation in out-of-equilibrium glassy systems, PNAS 114, 263 (2017).
- Sussman et al. [2017] D. M. Sussman, S. S. Schoenholz, E. D. Cubuk, and A. J. Liu, Disconnecting structure and dynamics in glassy thin films, PNAS 114, 10601 (2017).
- Cubuk et al. [2020] E. D. Cubuk, A. J. Liu, E. Kaxiras, and S. S. Schoenholz, Unifying framework for strong and fragile liquids via machine learning: A study of liquid silica, arXiv:2008.09681 [cond-mat] (2020), arXiv:2008.09681 [cond-mat] .
- Benoit and Kob [2002] M. Benoit and W. Kob, The vibrational dynamics of vitreous silica: Classical force fields vs. first principles, EPL 60, 269 (2002).
- Bhattarai and Drabold [2016] B. Bhattarai and D. A. Drabold, Vibrations in amorphous silica, Journal of Non-Crystalline Solids 439, 6 (2016).
- Brebec et al. [1980] G. Brebec, R. Seguin, C. Sella, J. Bevenot, and J. C. Martin, Diffusion du silicium dans la silice amorphe, Acta Metallurgica 28, 327 (1980).
- Yu et al. [2021] Z. Yu, Q. Liu, I. Szlufarska, and B. Wang, Structural signatures for thermodynamic stability in vitreous silica: Insight from machine learning and molecular dynamics simulations, Phys. Rev. Materials 5, 015602 (2021).
- Almond and West [1987] D. P. Almond and A. R. West, The activation entropy for transport in ionic conductors, Solid State Ionics 23, 27 (1987).
- Sastry et al. [1998] S. Sastry, P. G. Debenedetti, and F. H. Stillinger, Signatures of distinct dynamical regimes in the energy landscape of a glass-forming liquid, Nature 393, 554 (1998).
- Shi et al. [2018] R. Shi, J. Russo, and H. Tanaka, Origin of the emergent fragile-to-strong transition in supercooled water, PNAS 115, 9444 (2018).
- Vollmayr et al. [1996] K. Vollmayr, W. Kob, and K. Binder, Cooling-rate effects in amorphous silica: A computer-simulation study, Phys. Rev. B 54, 15808 (1996).
- Wang et al. [2015] B. Wang, Y. Yu, I. Pignatelli, G. Sant, and M. Bauchy, Nature of radiation-induced defects in quartz, J. Chem. Phys. 143, 024505 (2015).
- Mauro et al. [2022] J. C. Mauro, C. R. Kurkjian, P. K. Gupta, and W. Kob, Viscosity of silica and doped silica melts: Evidence for a crossover temperature, Journal of the American Ceramic Society 105, 61 (2022).
- Ninarello et al. [2017] A. Ninarello, L. Berthier, and D. Coslovich, Models and Algorithms for the Next Generation of Glass Transition Studies, Phys. Rev. X 7, 021039 (2017).
- Berthier and Biroli [2011] L. Berthier and G. Biroli, Theoretical perspective on the glass transition and amorphous materials, Rev. Mod. Phys. 83, 587 (2011).
- Mauro and Smedskjaer [2014] J. C. Mauro and M. M. Smedskjaer, Statistical mechanics of glass, Journal of Non-Crystalline Solids 396–397, 41 (2014).
- Candelier et al. [2010] R. Candelier, A. Widmer-Cooper, J. K. Kummerfeld, O. Dauchot, G. Biroli, P. Harrowell, and D. R. Reichman, Spatiotemporal Hierarchy of Relaxation Events, Dynamical Heterogeneities, and Structural Reorganization in a Supercooled Liquid, Phys. Rev. Lett. 105, 135702 (2010).
- Smessaert and Rottler [2013] A. Smessaert and J. Rottler, Distribution of local relaxation events in an aging three-dimensional glass: Spatiotemporal correlation and dynamical heterogeneity, Phys. Rev. E 88, 022314 (2013).
- Le Cessie and Van Houwelingen [1992] S. Le Cessie and J. C. Van Houwelingen, Ridge Estimators in Logistic Regression, Journal of the Royal Statistical Society. Series C (Applied Statistics) 41, 191 (1992).