Validation of e+e- Pair Production Total Cross Sections for Monte Carlo Particle Transport
Abstract
Several sources of total cross sections for e+e- pair production by photon interaction with matter, used by major Monte Carlo codes for particle transport, are quantitatively evaluated with respect to experimental measurements collected from the literature. They include data libraries deriving from theoretical calculations and analytical formulae representing empirical fits to tabulations. Although most of these sources of cross sections are based on one theoretical reference, the statistical data analysis documented in the paper highlights differences in their compatibility with experiment. The cross sections collected in the 1997 version of the Evaluated Photon Data Library (EPDL) exhibit the lowest incompatibility with experiment; the paper details the validation results for all the examined cross section sources. The scarcity of experimental data does not allow the validation process to discern pair production in the field of the nucleus and in the field of atomic electrons; nevertheless, the paper documents relevant clues regarding the contribution of the latter to reproduce experimental measurements.
Index Terms:
Monte Carlo, simulation, Geant4, pair productionI Introduction
Photon interactions with matter involve several atomic physics processes; in the region of photon energy above a few MeV, e+e- pair production is the dominant one [1]. Hence, the simulation of this process is important in various experimental domains that involve high energy photons, such as fundamental physics investigations in particle and nuclear physics experiments, medical physics, radiation dosimetry and shielding.
The occurrence of this process in the course of photon transport is determined by its total cross section. The validation test documented in this paper evaluates the capability of widely used Monte Carlo systems for particle transport to model e+e- pair production total cross section consistently with experiment; its results identify the state of the art among the calculation methods adopted by these codes. To this end, it employs methods of statistical inference to evaluate cross section calculations quantitatively and objectively with respect to a collection of experimental measurements.
To the best of our knowledge, this paper reports the first large-scale validation test of e+e- pair production total cross sections used in major particle transport systems. Previous papers [2, 3], limited to photon cross sections used by Geant4 [4, 5, 6], document their verification with respect to theoretical calculations, while experimental publications, such as those listed in the bibliography, at most report qualitative appraisals of a small set of measurements with respect to theory.
This extensive investigation provides guidance to the developers and the users of Monte Carlo codes to address the requirements of physics accuracy pertinent to different experimental scenarios.
II Physics overview
Photon conversion has been the object of theoretical and experimental interest for several decades; only a brief overview is summarized here to facilitate the comprehension of the results documented in this paper.
II-A Particle transport environment
The cross section calculation methods examined in this paper reflect the assumptions and approximations adopted in the general-purpose Monte Carlo transport systems used in experimental particle and nuclear physics, and related fields. They deal with interactions with free atoms; they neglect the effects of the environment of the target atom and multi-photon effects associated with incident beams. They do not take into account either any internal degrees of freedom of the initial or final atom, such as its orientation; therefore they do not describe photon interactions in molecules and oriented solids.
The discussion of calculation methods and their validation is limited in this paper to the energy range where total cross section measurements could be retrieved from the literature.
II-B Theoretical calculations
The total photon cross section gathers contributions from various independent processes: at lower photon energies, it is dominated by the photoelectric effect, where a photon ejects an electron from the target atom; then, Compton scattering becomes relevant, where a photon is scattered by an almost free electron; and then, an e+e- pair can be created in an external electromagnetic field if the energy of the photon becomes higher than the couple rest mass. At even higher energies, other inelastic processes may occur, such as photonuclear reactions [ or above approximately 10 MeV], photomeson production and conversion to couples of heavier particle-antiparticle pairs.
Electron-positron pair production can happen thanks to the presence of an external electromagnetic field that permits a virtual particle-antiparticle couple to become real, as only in such a case energy-momentum conservation can be satisfied. The electromagnetic field can be provided by the atomic nucleus of the target atom or by the electrons surrounding it. The latter case is known as triplet pair production; the “triplet” naming stems from the peculiar signature of this reaction in a cloud chamber, caused by the ejection of the atomic electron as well. The two processes occur with different intensities.
This phenomenon was theoretically predicted by Dirac in 1928 [7] and observed by Anderson in 1933 [8], who was later credited with the Nobel prize; positron tracks were present in earlier photographs, but experimental limitations did not permit reaching definite conclusions [9]. More detailed theory was developed by Bethe and Heitler [10]; refinements to the calculations have been pursued for the next decades [11].
The threshold energy for a conversion process depends on the mass of the particle that is initially at rest and is different for singlet and triplet pair production:
| (1) |
corresponding to approximately 1.022 MeV and 2.044 MeV, respectively. The cross section for singlet pair production varies with atomic number as , as for triplet.
The processes of singlet and triplet pair production are also characterized by a different final state, because triplet production necessarily involves excitation and ionization of the target atom, while singlet pair production involves only interaction with the atomic nucleus. The ionization of the target atom yields a small shift in the threshold energy [12] and two identical electrons in the final state, which should then be anti-symmetrized in the calculations.
Several theoretical calculations of pair production cross sections have been documented in the literature; a comprehensive review can be found in [11]. A systematic evaluation of the computational approaches is discussed in a landmark paper by Hubbell, Gimm and Øverbø [12]. The calculation strategy of [12] starts from the Born approximation in an unscreened field, on top of which Coulomb, screening and radiative corrections are successively implemented. Coulomb correction amounts to taking care of successive iteration of Coulomb interaction: the importance of such terms stems from the fact that the expansion parameter is in for pair production (where is the fine structure constant); it is not important, and is usually omitted, in triplet cross section calculations [13, 14]. The treatment of screening takes care of the presence of other charges. Screening corrections vary significantly with energy, but they can be evaluated with good accuracy. Finally, lowest order radiative corrections amount to the emission and reabsorption of virtual photons.
From a theoretical point of view, many effects should be taken into account in the calculation of triplet production cross sections: the atomic binding of the target electron, the screening by other electrons and by the field of the nucleus, the retardation due the recoil of the target electron, the interaction of the incident photon with the atomic electron via virtual Compton scattering and production of virtual electron-positron pairs, the exchange terms due to the indistinguishability of the two electrons and radiative corrections. The calculation are of considerable complexity; since a comprehensive computation taking into account all these effects is lacking, the cross sections in [12] derive from combining a variety of theoretical approaches and numerical evaluations.
III Cross sections in particle transport
The calculation of cross sections based on state-of-the-art theoretical methods in the course of transport would be a prohibitive burden for the computational performance of simulation applications. Therefore, Monte Carlo codes calculate the cross sections needed for particle transport either by interpolation of data libraries or through simple analytical formulae, which may derive from empirical parameterizations, from simplified models or from fits to tabulated data. Most of these codes account for both pair and triplet production cross sections to determine the occurrence of a photon interaction, although they usually simplify the generation of the final state as if pair production would always occur in the nuclear field.
Tabulations of pair production total cross sections, which incorporate the body of knowledge of theoretical approaches at the time of their publication, were produced by Hubbell, Gimm and Øverbø [12] in 1980; they still represent the most authoritative reference for Monte Carlo transport codes. They report the contributions of pair production in the field of the nucleus and in the field of the atomic electrons for the elements with atomic number up to 100, and for energies from the threshold (corresponding to twice the electron mass) to 100 GeV. These calculations have been incorporated in the Evaluated Photon Data Library (EPDL) [15, 16], in the XCOM database [17] of the National Institute of Standards and Technology) (NIST) and in the PHOTX [18] data library, which in turn was developed for inclusion in the ENDF/B-VI [19] physics data library. Although these data libraries share the same physical foundation of [12], they may exhibit different features, such as the number of data values, the photon energies and the number of significant digits in the tabulations.
EPDL is extensively used in Monte Carlo simulation. Several well-known particle transport codes, such as EGSnrc [20], FLUKA [21, 22], Geant4 [4, 5, 6], ITS [23], MCNP [24], PHITS [25] and Serpent [26], base the simulation of e+e- pair production on the cross sections tabulated in EPDL.
Most particle transport codes use the EPDL version released in 1997, also known as EPDL97 [16], which was included in ENDF/B-VI.8 and in the following releases of the ENDF/B-VII series [27, 28]. An EPDL version released by IAEA (International Atomic Energy Agency) in 2014 appears to be identical to the 1997 version, apart from the format of numbers in scientific notation.
New versions of EPDL were released in 2018: one was included in the ENDF/B-VIII.0 [29] data library, encoded in the ENDF-6 format, and others were distributed by IAEA within EPICS 2017, in ENDF-6 and ENDL format, respectively. The new releases raised several issues, documented in [30]; those included in EPICS 2017 appear to have undergone some modifications with respect to the originally released content, while keeping the same “EPICS 2017” identification. One of the issues highlighted in [30] is, indeed, the lack of proper version control in the IAEA distribution of EPDL and of the associated electron and atomic data libraries, which prevent the unambiguous identification of different data downloaded from this distribution source as “EPICS 2017”. According to the associated documentation [31], the EPDL data released in 2018 can be linearly interpolated, while logarithmic interpolation was recommended for EPDL97.
In addition to EPDL, other data libraries are used in major particle transport codes to calculate pair and triplet production cross sections: EGS5 [32] uses the PHOTX compilation, while EGSnrc provides the option of using the compilation by Storm and Israel [33], XCOM or the 1997 version of EPDL.
The Penelope [34] Monte Carlo system encompasses a compilation of pair and triplet production cross sections, which are released along with the source code. The approach adopted in the calculations, detailed in the code documentation, appears to be the same as in [12].
Other simulation codes calculate cross sections according to analytical formulae rather than through interpolation of tabulated data. This is the case for Geant4 Standard electromagnetic package, which adopts a similar solution to its predecessor GEANT 3 [35]; for both codes, the parameterizations of pair production cross sections are based on fits to the data tabulated by Hubbell, Gimm and Øverbø in [12]. An ultra-relativistic model, also implemented in Geant4, computes pair production cross sections using direct integration of differential cross sections [36]; it is not considered in the validation test reported in this paper due to lack of experimental measurements in the energy range recommended for its use, above 80 GeV.
To the best of our knowledge, systematic and quantitative validation of the above mentioned compilations of pair production cross sections is not yet documented in the literature.
IV Strategy of this study
| Identifier | Description | Type | Content | Energy |
|---|---|---|---|---|
| EPDL | EPDL, 1997 version | tabulation | singlet and triplet pair production cross sections | 1.022 MeV - 100 GeV |
| ENDFB | ENDF/B-VIII.0 | tabulation | singlet and triplet pair production cross sections | 1.022 MeV - 100 GeV |
| EPICSF | EPICS 2017, ENDF format | tabulation | singlet and triplet pair production cross sections | 1.022 MeV - 100 GeV |
| EPICSL | EPICS 2017, ENDF format | tabulation | singlet and triplet pair production cross sections | 1.022 MeV - 100 GeV |
| Pen18 | Penelope 2018 | tabulation | singlet and triplet pair production cross sections | 1.022 MeV - 100 GeV |
| PHOTX | PHOTX | tabulation | singlet and triplet pair production cross sections | 1.022 MeV - 100 GeV |
| Storm | Storm and Israel | tabulation | singlet and triplet pair production cross sections | 1.022 MeV - 100 MeV |
| XCOM | XCOM, default energies | tabulation | singlet and triplet pair production cross sections | 1.022 MeV - 100 GeV |
| G3 | GEANT 3 | analytical | sum of singlet and triplet pair production cross sections | 1.022 MeV - 100 GeV |
| Std | Geant4 Standard | analytical | sum of singlet and triplet pair production cross sections | 1.022 MeV - 100 GeV |
| Element | Energy range | Sample | References | |
| Symbol | (MeV) | size | ||
| 1 | H | 330-8700 | 22 | [37], [38], [39] |
| 2 | He | 2.62 | 1 | [40] |
| 3 | Li | 17.6 | 1 | [41] |
| 6 | C | 1.173-8700 | 14 | [40], [37], [42], [41], [43] |
| 13 | Al | 1.119-8700 | 12 | [40], [37], [44], [45], [42], [46], [41] |
| 22 | Ti | 1.173-2.754 | 5 | [47] |
| 26 | Fe | 1.119-2.615 | 6 | [48], [44], [45], [49] |
| 28 | Ni | 1.779 | 1 | [45] |
| 29 | Cu | 1.119-8700 | 21 | [48], [40], [37], [44], [45], [47], [49], [42], [50], [51], [41] |
| 32 | Ge | 1.0404-11.775 | 170 | [52], [53], [54], [55], [56], [57], [58], [59], [60], [61], [62] |
| 34 | Se | 1.779 | 1 | [45] |
| 40 | Zr | 1.119 | 1 | [50] |
| 42 | Mo | 1.12-2.754 | 7 | [45], [47] |
| 45 | Rh | 1.119 | 1 | [50] |
| 47 | Ag | 1000 | 1 | [63] |
| 48 | Cd | 1.12-2.754 | 9 | [45], [47] |
| 50 | Sn | 1.115-17.6 | 22 | [64], [65], [48], [66], [40], [67], [44], [45], [49], [50], [51], [46], [41] |
| 53 | I | 1.077-2.754 | 10 | [68], [43] |
| 58 | Ce | 1.779 | 1 | [45] |
| 73 | Ta | 1.119-2.614 | 2 | [50], [46] |
| 74 | W | 1.119-2.754 | 7 | [45], [47] |
| 78 | Pt | 1.119 | 1 | [50] |
| 79 | Au | 1.115-1000 | 4 | [66], [63], [50], [46] |
| 82 | Pb | 1.077-1200 | 33 | [65], [48], [69], [40], [67], [44], [45], [47], [70], [49], [42], [71], [50], [51], [72], [73], [41] |
| 83 | Bi | 1.275-2.615 | 3 | [45] |
| 90 | Th | 1.115 | 1 | [66] |
| 92 | U | 1.115-8700 | 10 | [48], [66], [37], [74], [45], [49] |
Consistent with the pertinent Standard [75], the validation of cross sections intended for use in particle transport has a pragmatic nature: Monte Carlo codes are concerned with identifying the state of the art among practically usable modeling methods – tabulations or simple analytical formulations – on the basis of the available body of knowledge, i.e. of existing experimental data. The extent of the validation tests and the depth of their physics investigation are determined by the amount and the characteristics of the available experimental measurements; they are meaningful if they have sufficient power to achieve significant conclusions.
The validation process of pair production cross sections addresses two issues: appraising the compatibility with experiment of the calculation methods used in major Monte Carlo codes for particle transport, and identifying the state of the art for simulation applications among them.
For these purposes, the data libraries and analytical formulations representing the approaches adopted in major Monte Carlo transport codes have been singled out; cross section calculations based on them have been implemented in a consistent software design, which minimizes external dependencies to ensure the unbiased appraisal of the intrinsic capabilities of the methods subject to evaluation.
A set of experimental data has been collected from the literature for the validation of the calculation methods. The majority of the experimental measurements do not distinguish the production of e+e- pairs deriving from interactions in the field of the nucleus or in the field of the atomic electrons; therefore, the validation process concerns the calculations representing the sum of the cross sections pertaining to both processes. Nevertheless, the analysis highlights the critical role played by the calculations of triplet production.
The use of statistical inference methods in the validation process ensures objective and quantitative conclusions. Goodness-of-fit tests compare calculated and experimental data distributions to evaluate the incompatibility with experiment of cross section data libraries and analytical formulations; techniques of categorical data analysis are applied to ascertain whether the various methods’ cross section calculations exhibit significant differences in incompatibility with experiment.
The validation process is supported by investigations concerning the robustness of the results and by assessments of the power of the tests.
The limited amount of available experimental data prevents the stratification of the analysis in terms of atomic number, photon energy or other specific features: the power of the tests considerably drops when one partitions the small data sample, thus hindering the achievement of meaningful results over strata. This limitation prevents the evaluation of possible effects related to the inhomogeneity of the existing experimental sample, which is determined by the experimental activity of the past decades and could only be mitigated by performing further measurements in the future; nevertheless, it does not affect the conceptual cogency of the feasible tests in the peculiar context of Monte Carlo codes, where the concern is using state-of-the-art of pair production cross sections in particle transport, compatible with existing knowledge.
In the following sections, the type of occurrence of the pair production process, i.e. production in the field of the nucleus (or singlet production), and production in the field of atomic electrons (or triplet production), is explicitly specified when the distinction is relevant to the context.
IV-A Cross section calculations
The cross section sources subject to test are summarized in Table I. Data libraries provide distinct tabulations of pair production cross sections in the field of the nucleus and of the atomic electrons, while the analytical cross section formulations considered in the validation process calculate the sum of the two contributions.
All the cross section calculation methods involved in the validation process have been implemented in a stand-alone test system, adopting a policy-based class design [76]. This software design supports the provision of a wide variety of physics modeling approaches without imposing the constraint of inheritance from a predefined interface. A single policy class calculates cross sections based on data libraries; alternative data tabulations are managed through the file system. Dedicated policy classes implement cross section calculations based on analytical formulae.
The correctness of the implementation of cross section calculations has been verified to ensure the software reproduces the physical features of each calculation method consistently.
In the validation process, the cross sections subject to test are calculated in the same settings (photon energy and target element) as the experimental data they are compared to.
IV-B Experimental data
The experimental data sample, derived from an extensive survey of the literature [64, 65, 48, 69, 66, 53, 54, 55, 56, 63, 40, 52, 37, 57, 58, 38, 67, 44, 74, 45, 47, 68, 70, 59, 49, 42, 39, 60, 71, 50, 51, 61, 72, 73, 46, 41, 43, 62], consists of 367 measurements, which concern target elements from hydrogen to uranium and span the energy range from 1.04 MeV to 8.7 GeV. An overview of this data sample is summarized in Table II. Despite the effort invested in the search of relevant data in the literature, this experimental sample is much smaller than the pools of measurements used in similar validation tests of photon interaction cross sections [77, 78, 79].
The raw experimental sample collected from the literature was further examined to ascertain the usability of the data. This assessment is particularly delicate due to the scarcity of measurements, as further reduction of the sample size could compromise the power of the statistical tests, i.e. their capability to produce significant results.
Precise knowledge of the primary photon energy is necessary in the validation process to ensure that the cross sections subject to test are calculated under the same conditions as in the experimental setup. The experimental publications involving radioactive sources often report inconsistent values for the energy of the emitted photons: the imprecision of these data reflects the body of knowledge of radioactive decays at the time when the experiments were performed. The energies of photons originating from radioactive sources were updated in the validation test process to conform to recent authoritative standards [80], thus ensuring consistency and correctness of the cross section calculations involved in the test.
Some experimental cross sections are published only in graphical form; numerical values were digitized from the plots by means of the Engauge Digitizer [81] software. The reliability of the digitized cross section values is hindered by the difficulty of appraising the experimental points and their error bars in plots that may span several orders of magnitude in logarithmic scale. The error introduced by the digitization process was estimated by digitizing a few plotted data, whose numerical value is explicitly reported in the related publications; nevertheless, due to the variable quality of the plots in the collected experimental references, this estimate can only be considered an approximate indication. The effects on the validation tests introduced by using digitized experimental data were evaluated in the analysis and are reported in Section V-B.
Several references report semi-empirical pair production cross sections, deriving from measurements of total mass attenuation coefficients: they were estimated in the original papers by subtracting the contributions of other processes (Compton scattering and photoelectric absorption) from the measured observables. Since these data are not pristine experimental measurements, they were discarded from the validation process.
Some experimental measurements are reported in the associated publications relative to theoretical calculations rather than as absolute values, usually with the intent to highlight consistency or deviations with respect to theory. A number of them can be converted into their pristine absolute values, based on the information available in the original papers; for others, lacking adequate details, one can only formulate educated guesses on the theoretical values, relative to which the published measurements are expressed. These experimental references are liable to introduce systematic effects in the validation process; their treatment in the analysis is discussed in Section V-A and the effects of their inclusion in the statistical analysis are reported in Section V-B.
A special case concerns a few cross section measurements that are reported relative to a reference value (at a given energy and for a given target element), whose absolute value is fixed by a theoretical calculation or by another experiment. Since there is consensus that some theoretical calculations used in the past for this purpose are now obsolete and have been superseded by more authoritative theoretical approaches, experimental cross sections normalized to such theoretical values are prone to introduce systematic effects. Therefore, the reference values were renormalized in the validation process with respect to the more recent calculations based on EPDL, and the number of degrees of freedom in the goodness-of-fit tests was adjusted accordingly to calculate the p-value of the tests correctly.
Correct estimate of experimental errors is a concern in the validation process, since an unrealistic estimation may lead to incorrect conclusions in the test regarding the rejection of the null hypothesis of compatibility between calculations and experiment. Some experimental publications do not document the experimental uncertainties of the cross section measurements they report; estimated errors were introduced in the validation process, deriving from an educated guess based on the typical uncertainties of similar measurements performed in similar conditions, using similar experimental techniques. When such educated guesses were not possible, the experimental data lacking uncertainties were discarded from the validation process. Other experimental references explicitly state that the results they report only account for statistical uncertainties, thus hinting at underestimated uncertainties affecting the outcome of the test.
The experimental data sample encompasses measurements of varying precision; Fig. 1 shows the distribution of the relative errors of the experimental data, derived from the respective publications. One cannot discern any manifest association between the relative error reported in the experimental papers and the date of the experiments: that is, more recent measurements are not necessarily more precise than older ones. The effect of measurements with varying precision on the validation process is discussed in Section V-B.
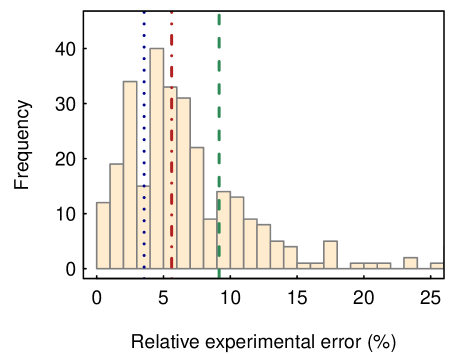
Discrepancies are evident in some of the experimental data; systematic effects are likely present in some cases, where sequences of positive or negative differences between data samples originating from different experimental groups hint at incompatibility with randomness. Some of these discrepancies were already highlighted and discussed in the experimental publications, e.g. in [52, 59]. Due to the limited availability of experimental measurements and the scarcity of documentation in some experimental publications, it is not always possible to ascertain which data sets exhibiting large discrepancies could be affected by systematic effects; therefore, it is unavoidable that the experimental data sample used in the validation process may be polluted by unreliable measurements.
Quality criteria are applied to the experimental data involved in the validation process to mitigate the risks associated with questionable experimental sources, as is documented in Section V. The evaluation of the power of the tests, reported in Section V-C, also supports the robustness of the results.
IV-C Data analysis method
The validation process applies the methodology described in [78]: first, cross sections calculated by each model are compared with experimental data to determine their incompatibility with experiment; in the following stage, categorical data analysis is performed to identify significant differences in compatibility with experiment among the various calculation methods. Further details concerning the methodology can be found in [82, 78, 79, 77, 83, 84, 85, 86, 87, 88, 89, 90]. The level of significance of the tests is 0.01, unless stated otherwise.
The first stage of the analysis is articulated through a series of tests [91] over test cases identified consistently with the available experimental data distributions. The test cases reflect how the data are reported by the experiments: either as measurements concerning specific elements as a function of energy or as measurements at fixed energies as a function of the atomic number of the target elements. The cross sections subject to validation are calculated in the same settings (photon energy and target element) as the experimental data.
The null hypothesis in the test is defined as the calculated and experimental data distributions being equivalent. For convenience, the “efficiency” of a cross section model is defined as the fraction of test cases in which the test does not reject the null hypothesis at the selected level of significance.
It is worthwhile to recall that the test takes into account the experimental uncertainties explicitly in the calculation of the test statistic; therefore, its outcome is sensitive to incorrect estimates of the experimental errors.
In the second stage of the analysis the results of the test are summarized in contingency tables, which report the number of test cases classified as “fail” or “pass”, according to whether the hypothesis of compatibility of experimental and calculated cross sections is or is not rejected. The null hypothesis in the test of a contingency table assumes equivalent compatibility with experiment of the cross section calculation methods subject to test. Exact tests (Fisher [92], Boschloo [93], Z-pooled [94] and Barnard [95] in the CSM approximation [96]) are used in the analysis of contingency tables; Pearson’s test [97] is also used, when the number of entries in the cells of the table justifies its applicability (i.e., it is greater than 5 [98]). The variety of tests applied to contingency tables mitigates the risk of introducing systematic effects in the analysis, which could be related to features of the mathematical formulation of the tests.
The analysis reported in this paper used the R software system [99], version 4.1.0.
V Results
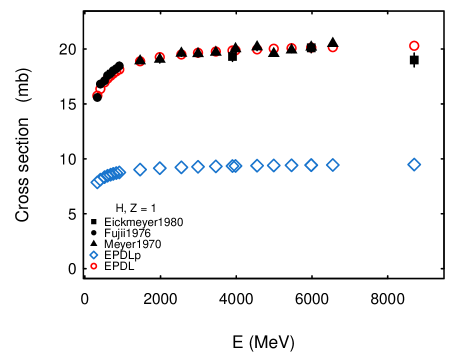
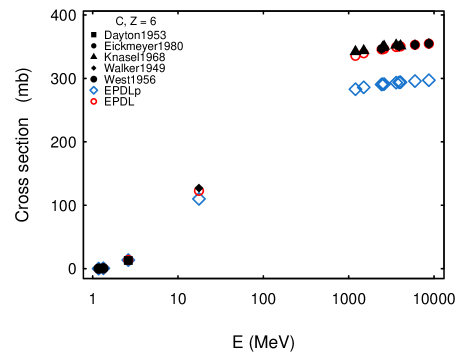
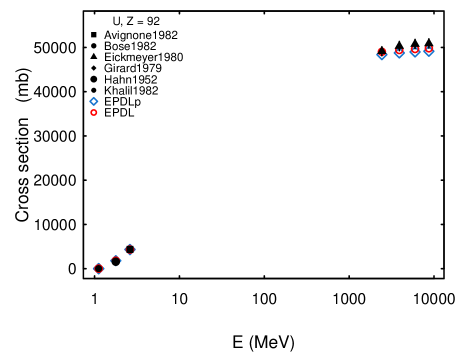
A selection of representative experimental and calculated cross sections is shown in Figs. 2-9. The plots allow a qualitative appraisal of the data; the results of the validation process derive from statistical inference and are documented in the following subsections.
V-A Comparison of calculated and experimental cross sections
Test cases to compare cross section calculations with experimental measurements are defined as described in Section IV-C. Since the experiments reporting cross section measurements are generally unable to distinguish pair and triplet production events, the comparison with experimental data concerns the sum of pair and triplet production cross sections.
A few criteria were applied to reinforce the quality of the experimental data involved in the test: the experimental sample includes only measurements reported in digital form in the respective publications; it excludes experimental values expressed in terms of Bethe-Heitler cross section or other theoretical references, unless the authors’ theoretical calculations were explicitly documented, so that the reported values could be unambiguously converted into absolute cross section measurements.
| Calculation Source | Pass | Fail | Efficiency |
|---|---|---|---|
| EPDL 97 | 38 | 7 | 0.84 0.05 |
| EPICS 2017 (ENDF) | 37 | 8 | 0.82 0.06 |
| EPICS 2017 (ENDL) | 37 | 8 | 0.82 0.06 |
| ENDFB VIII.0 | 37 | 8 | 0.82 0.06 |
| Penelope 2018 | 32 | 13 | 0.71 0.07 |
| XCOM | 21 | 24 | 0.47 0.07 |
| Storm and Israel | 5 | 28 | 0.15 0.06 |
| PHOTX | 21 | 24 | 0.47 0.07 |
| GEANT 3 | 17 | 28 | 0.38 0.07 |
| Geant4 Standard | 18 | 27 | 0.40 0.07 |
The outcome of the test comparing the calculated cross sections with experimental measurements is summarized in Table III. These results concern the whole range of energies of the experimental data, with the exception of the tests concerning Storm and Israel’s compilation, which covers photon energies up to 100 MeV.
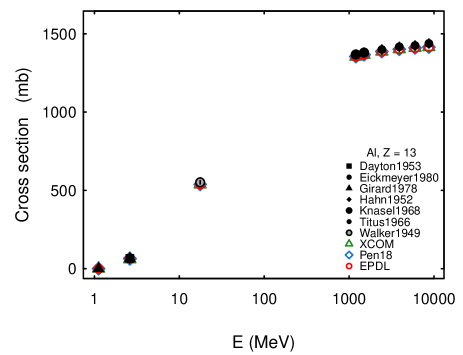
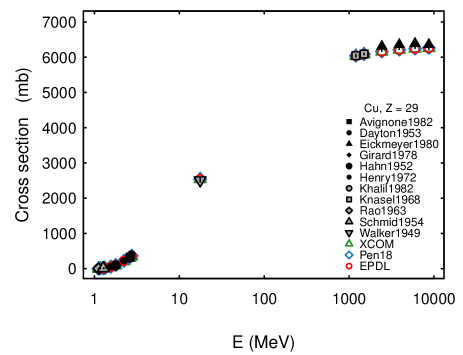
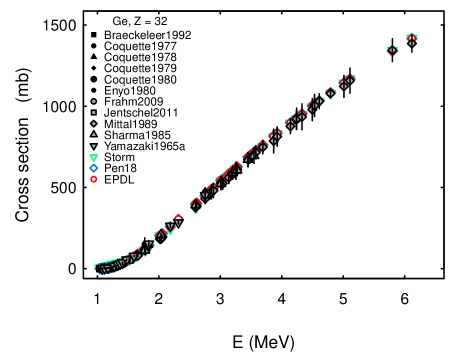
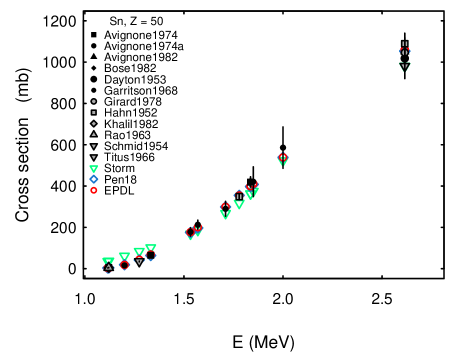
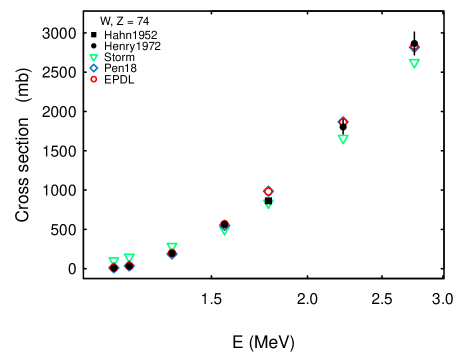
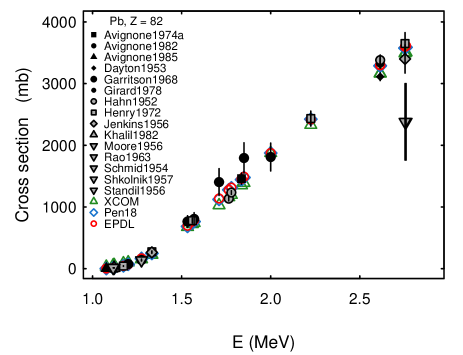
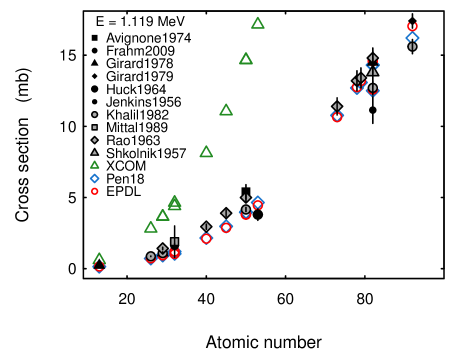
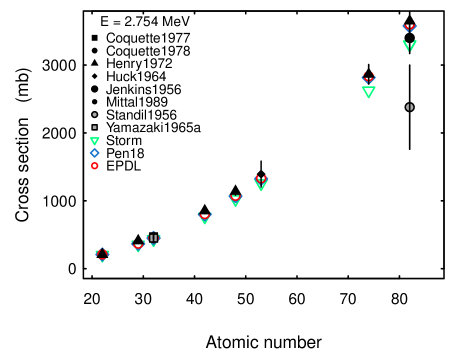
Table IV reports the results limited to experimental measurements above 1.5 MeV, selected according to the previously mentioned quality criteria. The fraction of test cases where the null hypothesis is rejected is lower in this data sample than in the full sample: this difference could be due to better accuracy of the calculation methods at higher energies, but also to underestimated uncertainties in experimental measurements close to the threshold, which are delicate and more exposed to systematic effects. Discrepancies in the measurements at low energies reported by different experimental groups have been highlighted in the literature [59]; inconsistencies in experimental and calculated cross sections at 1.119 MeV are qualitatively visible in Fig. 8. The available information is insufficient to discern the origin of the apparently worse compatibility with experiment at lower energies.
| Calculation Method | Pass | Fail | Efficiency |
|---|---|---|---|
| EPDL 97 | 33 | 2 | 0.94 0.04 |
| EPICS 2017 (ENDF) | 33 | 2 | 0.94 0.04 |
| EPICS 2017 (ENDL) | 33 | 2 | 0.94 0.04 |
| ENDFB VIII.0 | 33 | 2 | 0.94 0.04 |
| Penelope 2018 | 31 | 4 | 0.89 0.06 |
| XCOM | 29 | 6 | 0.83 0.06 |
| Storm and Israel | 14 | 9 | 0.61 0.10 |
| PHOTX | 29 | 6 | 0.83 0.06 |
| GEANT 3 | 28 | 7 | 0.80 0.07 |
| Geant4 Standard | 28 | 7 | 0.80 0.07 |
V-B Robustness of the results
The effect of the quality criteria applied to the experimental sample can be appreciated by considering the results of the test over a more extensive data sample, including experimental measurements digitized from figures and reported in terms of non reproducible theoretical references. The results are reported in Table V, where the first row concerns data available in digital format and unambiguously as absolute values, identified as “Digital, Direct”. One can observe in Table V that the fraction of test cases where the hypothesis of compatibility with experiments is rejected is larger when the criteria of experimental data quality are relaxed. This outcome is reflected in a decrease of the power of the tests: for instance, the power of the Boschloo test to correctly reject the hypothesis of equivalent compatibility with experiment of EPDL and XCOM, with respect to the alternative hypothesis of better performance of EPDL, drops from 0.93 to 0.79 when the criteria of experimental data quality are relaxed. Therefore, the above mentioned stricter quality criteria were applied to all the tests reported in the following.
| Data type | Pass | Fail | Efficiency |
|---|---|---|---|
| Digital, Direct | 38 | 7 | 0.84 0.05 |
| Digital | 43 | 14 | 0.75 0.05 |
| Digital or figure | 54 | 18 | 0.75 0.05 |
The concern that the varying precision of the measurements included in the experimental sample could affect the outcome of the validation process was addressed by evaluating the compatibility of calculated cross sections with experimental data of different precision.
This assessment was performed over cross section calculations based on EPDL, 1997 version. It compared the outcome of the test when different portions of the error distribution shown in Fig. 1 are involved: measurements associated with relative errors smaller or larger than the median value, and measurements corresponding to the first and the last quartiles of the relative error distribution. It was qualitatively observed that the test results in larger “efficiency” when higher precision experimental measurements are involved, i.e. with experimental errors in the first quartile and smaller than the median; nevertheless, the hypothesis of statistically equivalent compatibility with experiment was not rejected in any comparisons involving higher and lower precision experimental samples, with 0.01 significance.
These assessments suggest that the conclusions of the analysis are robust.
V-C Comparative evaluation of calculation methods
The results of the test, documented in Table III, are fed into contingency tables, which set the grounds for the statistical analysis comparing the compatibility with experiment of the various categories of cross section calculations.
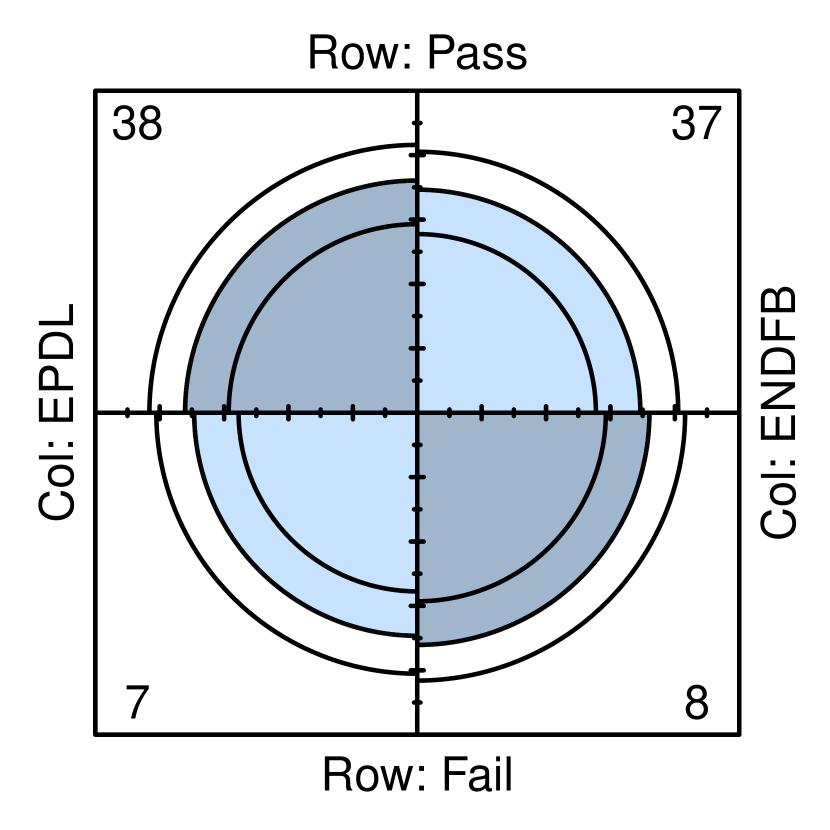
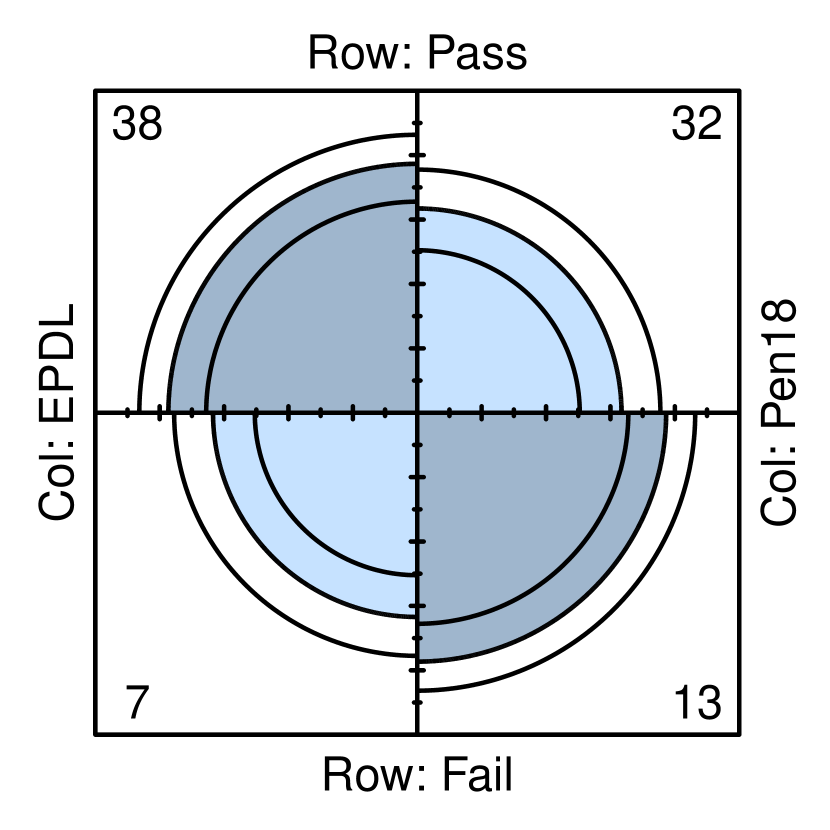
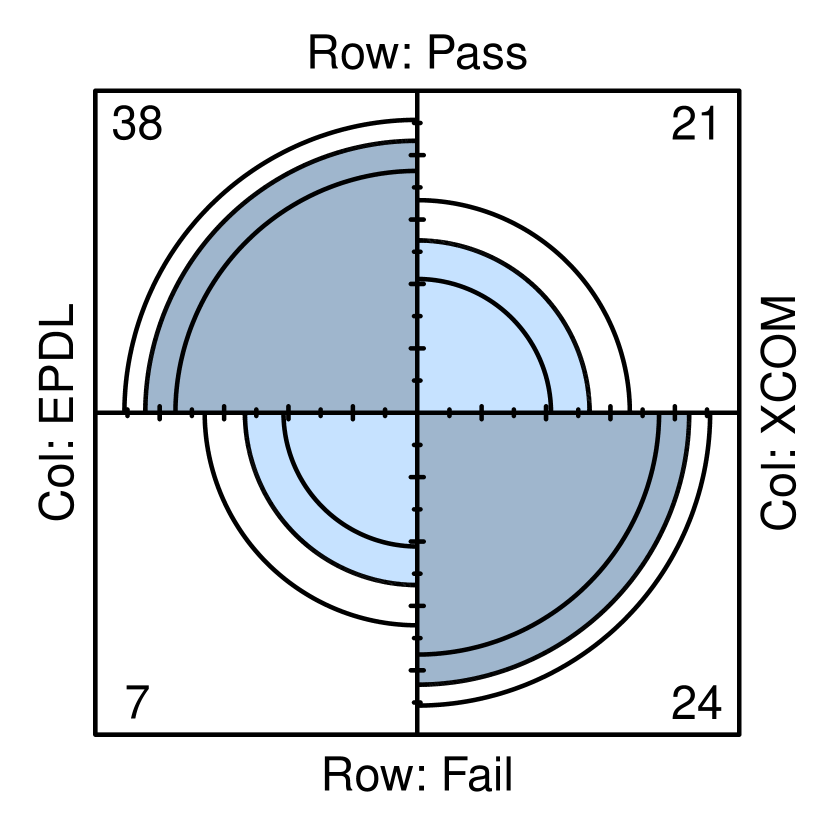
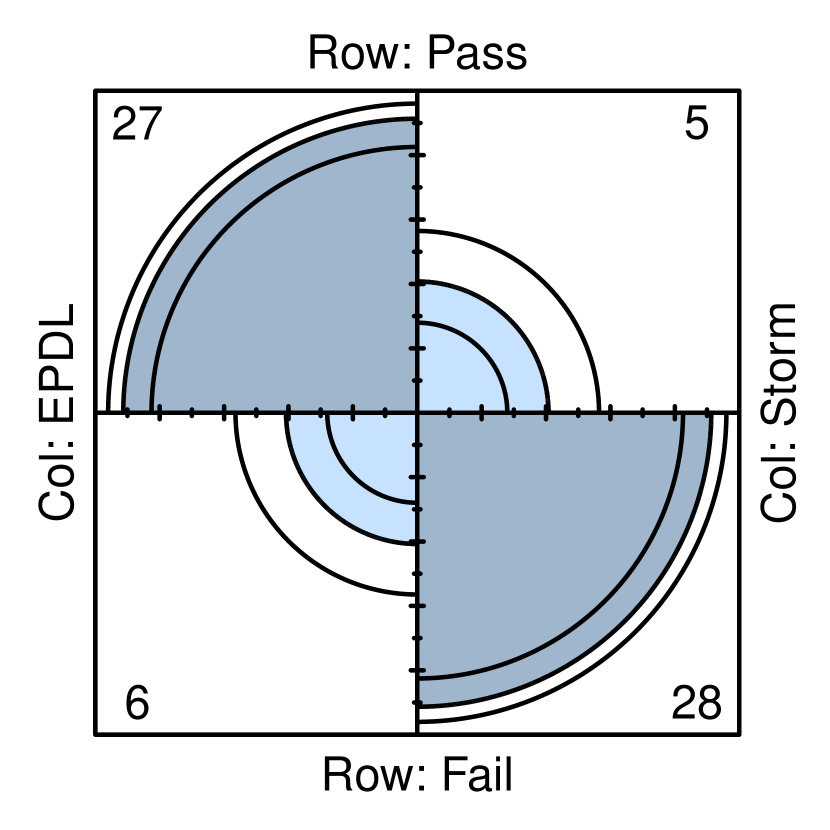
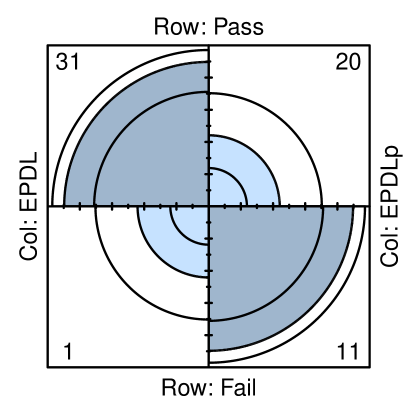
A representative selection of contingency tables is graphically illustrated in Fig. 10 by means of so-called “fourfold” plots. The area of each quarter circle in the fourfold plots is proportional to the cell frequency in the corresponding table; the rings represent the 99% confidence level for the odds ratio. Overlapping rings in adjacent quadrants indicate consistency with the null hypothesis that the different “pass” and “fail” counts of the test in the corresponding categories could arise from chance only; diagonally opposite cells in one direction differing in size from those in the other direction hint at qualitatively large differences in compatibility with experiment between the two data categories. Further documentation about fourfold plots can be found in [100, 101]; their use in a similar cross section validation context is illustrated in [79].
| Calculation method | Fisher | Boschloo | Z-pooled | CSM | |
|---|---|---|---|---|---|
| EPICS 2017 (ENDF) | 1.000 | 0.777 | 1.000 | 0.860 | 0.823 |
| EPICS 2017 (ENDL) | 1.000 | 0.777 | 1.000 | 0.860 | 0.823 |
| ENDFB VIII.0 | 1.000 | 0.777 | 1.000 | 0.860 | 0.823 |
| Penelope 2018 | 0.204 | 0.128 | 0.156 | 0.137 | 0.145 |
| XCOM | |||||
| Storm and Israel | |||||
| PHOTX | |||||
| GEANT 3 | |||||
| Geant4 Standard |
The results of the tests applied to the contingency tables derived from the outcome of the test reported in Table III are summarized in Table VI. The tests compare the compatibility with experiment of the various cross section calculation methods with that of the 1997 version of EPDL, which was identified in Table III as the data library producing the highest “efficiency”; they are consistent at rejecting the hypothesis of equivalent compatibility with experiment for the cross sections based on XCOM, PHOTX, Storm and Israel tabulations, and on the analytical calculations implemented in GEANT 3 and in Geant4. The null hypothesis of equivalent compatibility with experiment is not rejected for the cross sections based on ENDF/B-VIII.0, EPICS 2017 and Penelope 2018 tabulations.
Table VII documents the power of the tests to identify significant differences in the compatibility of cross section categories with experiment; it concerns the test cases for which the null hypothesis of equivalent compatibility with experiment is rejected in Table VI. It reports the power of the Boschloo test, i.e. its ability to correctly reject the null hypothesis of equivalent compatibility with experiment with respect to the two-sided alternative hypothesis of different compatibility with experiment and to the one-sided alternative of greater EPDL compatibility with experiment, at the selected significance level of 0.01. All the tests applied to contingency tables, appearing in Table VI, exhibit similar high power.
| Categorical data comparison | 1-sided | 2-sided |
|---|---|---|
| EPDL - XCOM/PHOTX | 0.93 | 0.77 |
| EPDL - Storm and Israel | 1.00 | 1.00 |
| EPDL - Geant4 Standard | 0.99 | 0.97 |
The tests over the categorical data above 1.5 MeV, deriving from the results of the test reported in Table IV, reject the null hypothesis of compatibility with experiment equivalent to that of EPDL97 only for the cross sections based on Storm and Israel’s compilation. The details of the results of the tests are available in Table VIII. Also in this test case all the tests exhibit high power (0.995).
| Calculation method | Fisher | Boschloo | Z-pooled | CSM |
|---|---|---|---|---|
| EPICSF | 1.000 | 1.000 | 1.000 | 0.990 |
| EPICSL | 1.000 | 1.000 | 1.000 | 0.990 |
| ENDFB | 1.000 | 1.000 | 1.000 | 0.990 |
| Pen18 | 0.673 | 0.550 | 0.530 | 0.530 |
| XCOM | 0.259 | 0.188 | 0.152 | 0.203 |
| Storm | ||||
| PHOTX | 0.259 | 0.188 | 0.152 | 0.203 |
| GEANT 3 | 0.151 | 0.111 | 0.086 | 0.120 |
| Geant4 Standard | 0.151 | 0.111 | 0.086 | 0.120 |
One can infer from the analysis that the ENDF/B-VIII.0, EPICS 2017 and Penelope 2018 data libraries are statistically equivalent to the 1997 version of EPDL in their ability to calculate pair production cross sections compatible with measurements over the whole experimental sample. PHOTX, XCOM (with the default energy grid), Storm and Israel’s compilation, and the analytical cross section formulations perform significantly worse than EPDL97 when their behaviour is examined over the whole energy range covered by the experimental data sample. Above 1.5 MeV only Storm and Israel’s compilation exhibits significantly different compatibility with experiment with respect to EPDL97.
V-D Triplet production cross sections
The validation of triplet production cross section calculations according to the same methodology is hindered by the scarcity of precision measurements specific to this process. Nevertheless, the validation tests provide meaningful indications regarding the calculations of these cross sections.
A clue comes from the test concerning data above the threshold for triplet production (2.044 MeV), when one compares experimental measurements with cross section calculations limited to e+e- pair production in the field of the nucleus and with calculations also including the contribution of production in the field of atomic electrons.
The results reported here concern EPDL97, but the effect is also observed in the calculations concerning other data libraries. The hypothesis of compatibility between experimental and calculated cross sections is rejected in a significantly larger fraction of test cases when only the production of e+e- pairs in the field of the nucleus is accounted for: above the threshold for triplet production, the “efficiency” resulting from the test is 0.650.08 when accounting only for e+e- pair production in the field of the nucleus, while it is 0.970.03 when triplet production is also taken into account. These results are illustrated in Fig. 11. The hypothesis of equivalent compatibility with experiment of the two cross section calculations is rejected by all the exact tests applied in Section V-C with 0.01 significance.
The relative contribution of pair production in the field of atomic electrons is expected [13] to be higher for elements with low atomic number, hence, especially for photon interactions with hydrogen. Figs. 12, 13 and 14 confirm this prediction.
These results suggest that the contribution of triplet production in the cross section calculation is critical to reproduce experimental measurements of e+e- pair production.
VI Conclusion
The data libraries and analytical parameterizations used in major Monte Carlo codes for particle transport to calculate e+e- pair production cross sections by photon interactions have been quantitatively evaluated regarding their capability to reproduce experimental measurements. Most of them originate from an authoritative compendium of theoretical calculations [12]; nevertheless, they exhibit some differences in their compatibility with experiment.
The experimental data involved in the validation process derive from an extensive survey of the literature. Quality criteria applied to the selection of the experimental sample, objectively assessed by means of statistical methods, strengthen the reliability of the validation results.
Among the calculation methods subject to test, the statistical analysis has identified the 1997 version of EPDL as the cross section source with the lowest incompatibility with experiment. More recent versions of EPDL, released in ENDF/B-VIII.0 and distributed in EPICS 2017 by IAEA, as well as the tabulations distributed with Penelope 2018, are statistically equivalent to EPDL97 in compatibility with experiment. EPDL97 is currently used by several Monte Carlo codes; the results of the analysis support this choice and show that moving to more recent versions is not needed at the present time.
Other cross section sources – XCOM tabulations for default photon energies, PHOTX and the parameterizations used in Geant4 Standard electromagnetic package – are statistically equivalent to EPDL in compatibility with experimental data at energies above 1.5 MeV. Their reduced ability to reproduce experimental measurements close to the e+e- pair production threshold is likely due to insufficient granularity of the tabulations or inadequacy of the analytical parameterizations in the low energy range corresponding to rapid variability of the cross section. Storm and Israel’s compilation, which antedates the publication of [12], exhibits significant differences in compatibility with experiment with respect to EPDL97. Developers and maintainers of Monte Carlo codes may consider providing alternative options of cross section calculations, if they do not already do so, to address the shortcomings associated with some of them. Experimental users may consider selecting appropriate cross section options in their simulations, in general or specifically at low energies, when high accuracy is required by sensitive applications.
The characteristics of the available experimental data and the scarcity of specific measurements prevent the distinct appraisal of cross sections for e+e- pair production in the field of the nucleus and in the field of atomic electrons; nevertheless, the analysis has highlighted the significant role played by triplet production calculations to achieve consistency with the available experimental data.
The scarcity of experimental data prevents stratified analyses, which could single out the capabilities of cross section calculation methods to a finer degree. Further measurements, also addressing the higher energy end that is currently scarcely represented in the literature, would be helpful to refine the scope and the depth of the validation tests.
Acknowledgment
The authors thank Anita Hollier for proofreading the manuscript and valuable comments, and Sergio Bertolucci for helpful support at CERN. The CERN Library has provided substantial assistance and essential reference material for this research.
References
- [1] N. J. Carron, An Introduction to the Passage of Energetic Particles through Matter. Boca Raton, USA: CRC Press, 2006.
- [2] K. Amako et al., “Comparison of Geant4 electromagnetic physics models against the NIST reference data,” IEEE Trans. Nucl. Sci., vol. 52, no. 4, pp. 910–918, 2005.
- [3] G. Cirrone et al., “Validation of the Geant4 electromagnetic photon cross-sections for elements and compounds,” Nucl. Instrum. Methods Phys. Res. A, vol. 618, no. 1, pp. 315–322, 2010.
- [4] S. Agostinelli et al., “GEANT4 - a simulation toolkit,” Nucl. Instrum. Methods Phys. Res. A, vol. 506, no. 3, pp. 250–303, 2003.
- [5] J. Allison et al., “Geant4 developments and applications,” IEEE Trans. Nucl. Sci., vol. 53, no. 1, pp. 270–278, Feb. 2006.
- [6] J. Allison et al., “Recent developments in Geant4,” Nucl. Instrum. Methods Phys. Res. A, vol. 835, pp. 186 – 225, 2016.
- [7] P. A. M. Dirac and R. H. Fowler, “The quantum theory of the electron,” Proc. R. Soc. London, Ser. A, vol. 117, no. 778, pp. 610–624, 1928.
- [8] C. D. Anderson, “The positive electron,” Phys. Rev., vol. 43, pp. 491–494, Mar. 1933.
- [9] G. Bazilevskaya, “Skobeltsyn and the early years of cosmic particle physics in the Soviet Union,” Astropart. Phys., vol. 53, pp. 61–66, 2014.
- [10] H. Bethe and W. Heitler, “On the stopping of fast particles and on the creation of positive electrons,” Proc. R. Soc. London, Ser. A, vol. 146, no. 856, pp. 83–112, 1934.
- [11] J. H. Hubbell, “Electron–positron pair production by photons: A historical overview,” Radiation Physics and Chemistry, vol. 75, no. 6, pp. 614–623, 2006.
- [12] J. H. Hubbell, H. A. Gimm, and I. Overbø, “Pair, triplet, and total atomic cross sections (and mass attenuation coefficients) for 1 MeV - 100 GeV photons in elements Z=1 to 100,” J. Phys. Chem. Ref. Data, vol. 9, no. 4, pp. 1023–1148, 1980.
- [13] L. C. Maximon and H. A. Gimm, “Pair production in the field of atomic electrons,” Phys. Rev. A, vol. 23, pp. 172–185, Jan. 1981.
- [14] H. A. Gimm and J. H. Hubbell, “Total Photon Absorption Cross Section Measurements, Theroretical Analysis and Evaluations for Energies Above 10 MeV,” US National Bureau of Standards, Tech. Rep. 968, 1978.
- [15] D. E. Cullen et al., “Tables and graphs of photon-interaction cross sections from 10 eV to 100 GeV derived from the LLNL Evaluated Photon Data Library (EPDL),” Lawrence Livermore National Laboratory, Livermore, CA, USA, Tech. Rep. UCRL-50400, 1989.
- [16] D. Cullen, J. Hubbell, and L. Kissel, “EPDL97: The Evaluated Photon Data Library, 97 version,” Lawrence Livermore National Laboatory, Livermore, CA, USA, Tech. Rep. UCRL-50400, 1997.
- [17] M. Berger et al. (2010) XCOM: Photon Cross Sections Database. NIST (National Institute of Standards and Technology). Gaithersburg, MD, USA. [Online]. Available: https://www.nist.gov/pml/xcom-photon-cross-sections-database
- [18] D. K. Trubey, M. J. Berger, and J. H. Hubbell, “Photon cross sections for ENDF/B-VI,” Oak Ridge National Laboratory, Oak Ridge, TN, USA, Tech. Rep. CONF-890408-4, 1989.
- [19] P. F. Rose, “ENDF-201: ENDF/B-VI summary documentation,” Brookhaven National Laboratory, Upton, NY, USA, Tech. Rep. BNL-NCS-17541, 1991.
- [20] I. Kawrakow et al., “The EGSnrc code system: Monte Carlo simulation of electron and photon transport,” National Research Council Canada, Tech. Rep. PIRS-701, 2017.
- [21] T. Bohlen et al., “The FLUKA code: Developments and challenges for high energy and medical applications,” Nuclear Data Sheets, vol. 120, pp. 211 – 214, 2014.
- [22] A. Ferrari et al., “FLUKA: A multi-particle transport code (program version 2005),” Tech. Rep. CERN-2005-010, SLAC-R-773, INFN-TC-05-11, 2005.
- [23] B. C. Franke, R. P. Kensek, and T. W. Laub, “ITS Version 6: the integrated TIGER series of coupled electron/photon Monte Carlo transport codes,” Sandia National Laboratories, Albuquerque, NM, USA, Tech. Rep. SAND2008-3331, 2008.
- [24] T. Goorley et al., “Initial MCNP6 release overview,” Nucl. Technol., vol. 180, no. 3, pp. 298–315, 2012.
- [25] K. Niita et al., “PHITS - a Particle and Heavy Ion Transport code System,” Radiat. Meas., vol. 41, no. 9, pp. 1080–1090, 2006.
- [26] T. Kaltiaisenaho, “Photon transport physics in Serpent 2 Monte Carlo code,” Comput. Phys. Commun., vol. 252, p. 107143, 2020.
- [27] M. Chadwick et al., “ENDF/B-VII.0: Next Generation Evaluated Nuclear Data Library for Nuclear Science and Technology,” Nucl. Data Sheets, vol. 107, no. 12, pp. 2931–3060, 2006.
- [28] M. Chadwick et al., “ENDF/B-VII.1 Nuclear Data for Science and Technology: Cross Sections, Covariances, Fission Product Yields and Decay Data,” Nucl. Data Sheets, vol. 112, no. 12, pp. 2887–2996, 2011.
- [29] D. Brown et al., “ENDF/B-VIII.0: The 8th Major Release of the Nuclear Reaction Data Library with CIELO-project Cross Sections, New Standards and Thermal Scattering Data,” Nucl. Data Sheets, vol. 148, pp. 1–142, 2018.
- [30] M. C. Han et al., “First assessment of ENDF/B-VIII and EPICS Atomic Data Libraries,” IEEE Trans. Nucl. Sci., vol. 65, no. 8, pp. 2268–2278, 2018.
- [31] D. E. Cullen, “A survey of photon cross section data for use in EPICS2017,” IAEA (International Atomic Energy Agency), Tech. Rep. IAEA-NDS-225, rev. 1, 2018.
- [32] H. Hirayama et al., “The EGS5 code system,” Tech. Rep. SLAC-R-730, KEK-2005-8, KEK-REPORT-2005-8, 2005.
- [33] L. Storm and H. I. Israel, “Photon cross sections from 1 keV to 100 MeV for elements Z=1 to Z=100,” At. Data Nucl. Data Tables, vol. 7, no. 6, pp. 565–681, 1970.
- [34] F. Salvat, “Penelope. a code system for Monte Carlo simulation of electron and photon transport,” NEA Data Bank, Tech. Rep. NEA/MBDAV/R(2019)1, 2019.
- [35] R. Brun et al., “GEANT 3,” CERN, Geneva, Switzerland, Tech. Rep. CERN-DD-EE-84-1, Sep. 1987.
- [36] Geant4 Collaboration. (2021) Geant4 Physics Reference Manual, version 10.7. [Online]. Available: http://cern.ch/geant4-userdoc/UsersGuides/PhysicsReferenceManual/html/index.html
- [37] J. Eickmeyer et al., “High-energy electron-pair photoproduction from nuclei: Comparison with theory,” Phys. Rev. D, vol. 21, pp. 3001–3004, Jun. 1980.
- [38] H. Fujii et al., “Total pair-production cross section of photons for hydrogen in the energy range 330 MeV to 910 MeV,” Nucl. Phys.B, vol. 114, no. 3, pp. 477–482, 1976.
- [39] H. Meyer et al., “Total cross section for photoproduction of hadrons on hydrogen and deuterium between 1.0 and 6.4 GeV,” Phys. Lett. B, vol. 33, no. 2, pp. 189–192, 1970.
- [40] I. E. Dayton, “Z-Dependence of the Pair Production Cross Section at 1.33 and 2.62 Mev,” Phys. Rev., vol. 89, pp. 544–551, Feb. 1953.
- [41] R. L. Walker, “Relative Cross Sections for Pair Production at 17.6 MeV,” Phys. Rev., vol. 76, pp. 1440–1444, Nov. 1949.
- [42] T. Knasel and J. Walker, “An accurate determination of the total pair production cross section in carbon, aluminium, copper and lead for photons from 1.200 to 4.050 GeV,” Phys. Lett. B, vol. 27, no. 2, pp. 103–105, 1968.
- [43] H. I. West, “Measurement of low-energy gamma-ray pair cross sections in scintillators using a scintillation pair spectrometer,” Phys. Rev., vol. 101, pp. 915–921, Feb. 1956.
- [44] T. A. Girard, F. T. Avignone, and S. M. Blankenship, “Low-energy absolute pair-production cross-section measurements in targets of Z=13, 26, 29, 50, and 82,” Phys. Rev. A, vol. 17, pp. 218–222, Jan. 1978.
- [45] B. Hahn, E. Baldinger, and P. Huber, “Wirkungsquerschnitt der Paarerzeugung in Abhängigkeit der Kernladungszahl für Gamma-Strahlen von Th(C + C”), RaC, AND Co60,” Helv. Phys. Acta, vol. 25, no. 5, pp. 505–520, Sep. 1952.
- [46] F. Titus and A. Levy, “Pair production in Al, Sn, Ta and Au by 2.62 MeV gamma rays,” Nucl. Phys., vol. 80, no. 3, pp. 588–592, 1966.
- [47] L. C. Henry and T. J. Kennett, “Total pair production cross sections from 1.120 to 2.754 MeV,” Can. J. Phys., vol. 50, no. 22, pp. 2756–2759, 1972.
- [48] F. T. Avignone and A. E. Khalil, “Improved low-energy absolute pair-production cross-section measurements in targets of Z=26, 29, 50, 82, and 92,” Phys. Rev. A, vol. 26, pp. 825–830, Aug. 1982.
- [49] A. E. Khalil and F. T. Avignone, “Absolute pair-production cross-section measurements in targets of Z=26, 29, 50, 82, and 92 with 1.119-MeV photons,” Phys. Rev. A, vol. 26, pp. 770–774, Aug. 1982.
- [50] J. Rao, V. Lakshminarayana, and J. Swami, “Z-dependence of pair cross-section in the energy region 1 to 2 MeV,” Indian J. Pure Appl. Phys., vol. 1, no. 6, 1963.
- [51] P. Schmid and P. Huber, “Z-Abhangigkeit des Paarbildungsquerschnittes fur Co-60-Gammastrahlen und Absorptionskoeffizienten fur Vernichtungsstrahlung,” Helv. Phys. Acta, vol. 27, no. 3, pp. 152–155, 1954.
- [52] L. De Braeckeleer, E. G. Adelberger, and A. García, “Reexamination of an anomaly in near-threshold pair production,” Phys. Rev. A, vol. 46, pp. R5324–R5326, Nov. 1992.
- [53] A. Coquette, “Méthode de mesure absolue de la section efficace totale de création de paires près du seuil,” Nucl. Instrum. Methods, vol. 144, no. 3, pp. 571–577, 1977.
- [54] A. Coquette, “Mesure absolue de la section efficace totale de création de paires près du seuil,” J. Phys., vol. 39, no. 10, pp. 1055–1058, 1978.
- [55] A. Coquette, “Méthode de mesure absolue de la section efficace totale de création de paires, près du seuil, au moyen d’une source d’energie variable,” Nucl. Instrum. Methods, vol. 164, no. 2, pp. 337–342, 1979.
- [56] A. Coquette, “Mesure absolue de la section efficace totale de création de paires, près du seuil, au moyen d’une source d’énergie variable,” J. Phys., vol. 41, no. 2, pp. 97–99, 1980.
- [57] H. En’yo, T. Numao, and T. Yamazaki, “Cross section of pair production near threshold,” Phys. Rev. A, vol. 21, pp. 1439–1442, May 1980.
- [58] R. Frahm et al., “Positron-electron pair creation near threshold,” AIP Conf. Proc., vol. 1090, no. 1, pp. 554–558, 2009.
- [59] M. Jentschel et al., “Measurements of the pair production cross section close to the threshold energy,” Phys. Rev. C, vol. 84, p. 052501, Nov. 2011.
- [60] V. Mittal and H. Sahota, “Measurement of pair production cross sections in the 1.21 - 1.775 MeV energy range and systematics of up to 100 MeV in Ge,” Int. J. Radiat. Appl. Instrum. Part A, vol. 40, no. 8, pp. 683–686, 1989.
- [61] R. K. Sharma, K. Singh, and H. S. Sahota, “Measurement of pair production cross sections in Ge for the 1.238-3.548 MeV energy range,” J. Phys. B: At. Mol. Phys., vol. 18, no. 4, pp. 637–643, Feb. 1985.
- [62] T. Yamazaki and J. M. Hollander, “Measurement of pair-production cross section near threshold,” Phys. Rev., vol. 140, pp. B630–B637, Nov 1965.
- [63] D. Dauvergne et al., “Measurement of vacuum-assisted photoionization at 1 GeV for Au and Ag targets,” Phys. Rev. Lett., vol. 90, p. 153002, Apr. 2003.
- [64] F. T. Avignone and S. M. Blankenship, “Low-energy pair-production cross-section measurements for ,” Phys. Rev. A, vol. 10, pp. 793–796, Sep. 1974.
- [65] F. Avignone and S. Blankenship, “Internal-source method of measuring absolute pair-production cross sections,” Nucl. Instrum. Methods, vol. 116, no. 3, pp. 515–519, 1974.
- [66] J. Bose et al., “A method of studying atomic screening effects in pair production,” Nucl. Instrum. Methods, vol. 212, no. 1, pp. 539–543, 1983.
- [67] G. R. Garritson, “Absolute pair creation cross sections using monoenergetic photons,” Ph.D. dissertation, University of Notre Dame, 1968. [Online]. Available: https://calhoun.nps.edu/handle/10945/11542
- [68] J. Huck, “Mesures absolues de sections efficaces de matérialisation d’un rayonnemen de un cristal de NaI(Tl),” J. Phys., vol. 25, no. 12, pp. 1029–1034, 1964.
- [69] F. T. Avignone et al., “Near-threshold behavior of pair-production cross sections in a lead target,” Phys. Rev. A, vol. 32, pp. 2622–2627, Nov. 1985.
- [70] T. L. Jenkins, “Measurements of the Cross-Section for Pair Production Near Threshold in Lead,” Ph.D. dissertation, Cornell University, 1956.
- [71] R. D. Moore, “An absolute measurement of the pair production cross section of lead at 2.76 MeV,” Ph.D. dissertation, University of Manitoba, 1956.
- [72] V. Shkolnik and S. Standil, “Determination of an absolute pair production cross section by relative measurements,” Can. J. Phys., vol. 35, no. 9, pp. 1156–1158, 1957.
- [73] S. Standil and V. Shkolnik, “Measurements of absolute pair production cross sections at low energies,” Can. J. Phys., vol. 36, no. 9, pp. 1154–1160, 1958.
- [74] T. Girard, F. Avignone, and T. Huntsberger, “Absolute pair production cross section measurements in Z = 92 at energies near threshold,” Phys. Lett. A, vol. 71, no. 1, pp. 33–34, 1979.
- [75] System, Software, and Hardware Verification and Validation, IEEE Std. 1012-2016, Rev. of IEEE Std 1012-2012, 2017.
- [76] A. Alexandrescu, Modern C++ Design: Generic Programming and Design Patterns Applied. USA: Addison-Wesley Longman Publishing Co., Inc., 2001.
- [77] M. Batic et al., “Photon elastic scattering simulation: Validation and improvements to Geant4,” IEEE Trans. Nucl. Sci., vol. 59, no. 4, pp. 1636–1664, 2012.
- [78] M. C. Han et al., “Validation of Cross Sections for Monte Carlo Simulation of the Photoelectric Effect,” IEEE Trans. Nucl. Sci., vol. 63, no. 2, pp. 1117–1146, 2016.
- [79] T. Basaglia, M. G. Pia, and P. Saracco, “Evolutions in Photoelectric Cross Section Calculations and Their Validation,” IEEE Trans. Nucl. Sci., vol. 67, no. 3, pp. 492–501, 2020.
- [80] O. Helene et al., “Update of X-ray and Gamma-ray Decay Data Standards for Detector Calibration and Other Applications,” International Atomic Energy Agency: Vienna, Tech. Rep. 210, 2007.
- [81] M. Mitchell. (2021) Engauge Digitizer. [Online]. Available: https://zenodo.org/badge/latestdoi/26443394
- [82] A. Lechner, M. G. Pia, and M. Sudhakar, “Validation of Geant4 Low Energy Electromagnetic Processes Against Precision Measurements of Electron Energy Deposition,” IEEE Trans. Nucl. Sci., vol. 56, no. 2, pp. 398–416, 2009.
- [83] T. Basaglia et al., “Validation of Shell Ionization Cross Sections for Monte Carlo Electron Transport,” IEEE Trans. Nucl. Sci., vol. 65, no. 8, pp. 2279–2302, 2018.
- [84] T. Basaglia et al., “Quantitative Test of the Evolution of Geant4 Electron Backscattering Simulation,” IEEE Trans. Nucl. Sci., vol. 63, no. 6, pp. 2849–2865, 2016.
- [85] S. H. Kim et al., “Validation Test of Geant4 Simulation of Electron Backscattering,” IEEE Trans. Nucl. Sci., vol. 62, no. 2, pp. 451–479, 2015.
- [86] M. Batic et al., “Validation of Geant4 Simulation of Electron Energy Deposition,” IEEE Trans. Nucl. Sci., vol. 60, no. 4, pp. 2934–2957, 2013.
- [87] H. Seo et al., “Ionization Cross Sections for Low Energy Electron Transport,” IEEE Trans. Nucl. Sci., vol. 58, no. 6, pp. 3219–3245, 2011.
- [88] M. Batic, M. G. Pia, and P. Saracco, “Validation of Proton Ionization Cross Section Generators for Monte Carlo Particle Transport,” IEEE Trans. Nucl. Sci., vol. 58, no. 6, pp. 3269–3280, 2011.
- [89] M. G. Pia et al., “PIXE Simulation With Geant4,” IEEE Trans. Nucl. Sci., vol. 56, no. 6, pp. 3614–3649, 2009.
- [90] M. G. Pia, P. Saracco, and M. Sudhakar, “Validation of K and L Shell Radiative Transition Probability Calculations,” IEEE Trans. Nucl. Sci., vol. 56, no. 6, pp. 3650–3661, 2009.
- [91] R. K. Bock and W. Krischer, The Data Analysis BriefBook. Berlin, Heidelberg: Springer Berlin Heidelberg, 1998.
- [92] R. A. Fisher, “On the interpretation of from contingency tables, and the calculation of p,” J. R. Stat. Soc., vol. 85, no. 1, pp. 87–94, 1922.
- [93] R. D. Boschloo, “Raised conditional level of significance for the 22 table when testing the equality of two probabilities,” Stat. Neerl., vol. 24, no. 1, pp. 1–9, 1970.
- [94] S. Suissa and J. J. Shuster, “Exact Unconditional Sample Sizes for the 2 Times 2 Binomial Trial,” J. R. Stat. Soc. A), vol. 148, no. 4, pp. 317–327, 1985.
- [95] G. A. Barnard, “Significance tests for 2x2 tables,” Biometrika, vol. 34, no. 1/2, pp. 123–138, 1947.
- [96] E. B. Wilson, “Barnard’s CSM Test of Significance,” Proc. Natl. Acad. Sci. U.S.A., vol. 38, no. 10, pp. 899–905, Oct. 1952.
- [97] K. Pearson, “On the test of goodness of fit,” Biometrika, vol. 14, no. 1/2, pp. 186–191, 1922.
- [98] L. Lyons, Statistics for nuclear and particle physicists. Cambridge University Press, 1989.
- [99] R. The R Project for Statistical Computing. The R Foundation. [Online]. Available: https://www.r-project.org/
- [100] M. Friendly, “Conceptual Models for Visualizing Contingency Table Data - Chapter 2,” in Visualization of Categorical Data, J. Blasius and M. Greenacre, Eds. San Diego: Academic Press, 1998, pp. 17–37.
- [101] M. Friendly and D. Meyer, Discrete data analysis with R: visualization and modeling techniques for categorical and count data. Boca Raton, USA: CRC Press, 2015, vol. 120.