Subtyping brain diseases from imaging data
Abstract
The imaging community has increasingly adopted machine learning (ML) methods to provide individualized imaging signatures related to disease diagnosis, prognosis, and response to treatment. Clinical neuroscience and cancer imaging have been two areas in which ML has offered particular promise. However, many neurologic and neuropsychiatric diseases, as well as cancer, are often heterogeneous in terms of their clinical manifestations, neuroanatomical patterns or genetic underpinnings. Therefore, in such cases, seeking a single disease signature might be ineffectual in delivering individualized precision diagnostics. The current chapter focuses on ML methods, especially semi-supervised clustering, that seek disease subtypes using imaging data. Work from Alzheimer’s Disease and its prodromal stages, psychosis, depression, autism, and brain cancer are discussed. Our goal is to provide the readers with a broad overview in terms of methodology and clinical applications.
Keywords: Neuroimaging, machine learning, semi-supervised clustering, heterogeneity
1. Introduction
There is growing clinical evidence that structural and functional brain development and aging take heterogeneous paths within different subsets of the human population [51, 55, 78]. This heterogeneity has been relatively ignored in case-control studies analyses, yielding a limited understanding of the diversity of underlying biological processes that might give rise to similar clinical phenotypes. The advent of high throughput neuroimaging technologies and the concentrated efforts of the collection of large-scale datasets [49, 61] provide a unique opportunity to dissect the structural and functional heterogeneity of brain disorders in finer details and in an unbiased data-driven manner. A developing body of work that leverages ML and neuroimaging seeks disease subtypes of neuropsychiatric and neurodegenerative disorders, including Alzheimer’s disease (AD) [74, 75, 76, 83, 85, 88], schizophrenia [7, 19], and late-life depression [77].
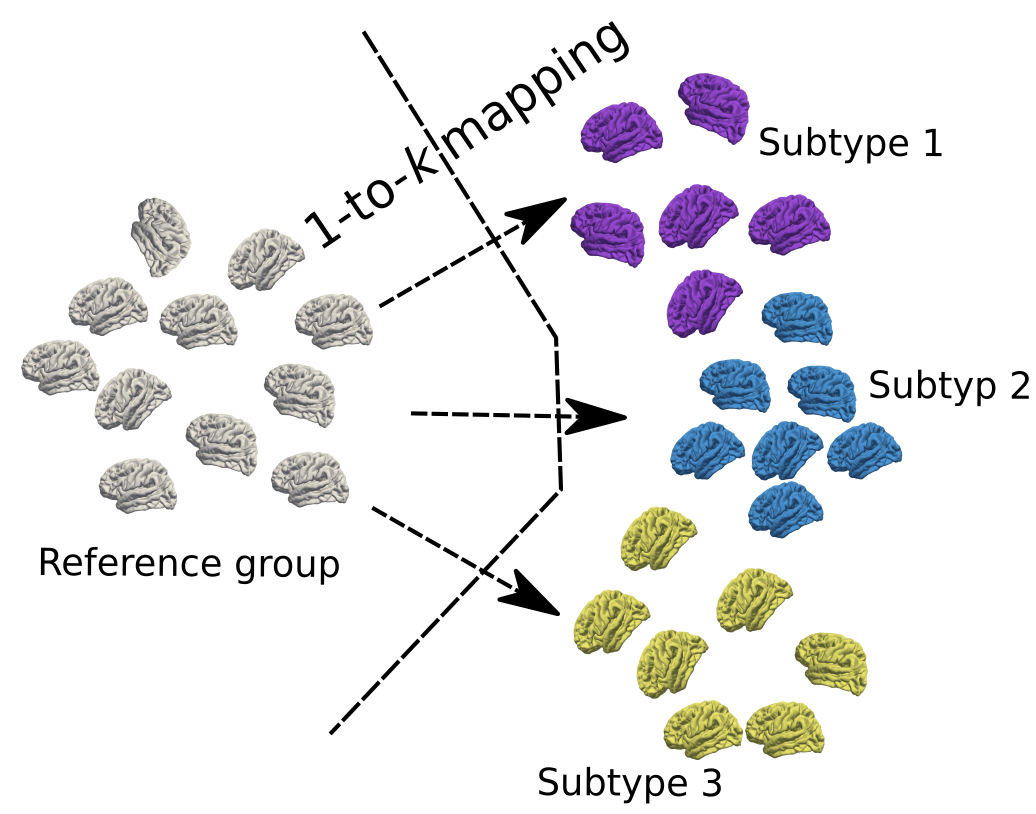
Subtyping brain diseases is a clustering problem where the goal is to break down the set of patients into distinct and relatively homogeneous subgroups (i.e., subtypes). While this has been actively investigated in the computer science community, subtyping neuroimaging data is endowed with a unique set of obstacles, such as the “curse of dimensionality” and the confounding nuisance effects, such as global demographics and scanner differences. Furthermore, brain development and pathologies often progress along a continuum, e.g., from healthy state to preclinical stages to full-fledged disease [84], thereby modeling directly in the patient domain may lead to a biased clustering solution. Thus to tackle these problems, some recent efforts have focused on developing semi-supervised [15, 74, 76, 83] and unsupervised clustering methods [85, 88]. Early studies mainly focused on unsupervised clustering methods, such as K-means [33] or hierarchical clustering [13], to derive data-driven subtypes using imaging data. However, such approaches directly partition the patients based on similarities/dissimilarities, potentially biased by confounding factors, such as demographics or heterogeneity caused by unrelated pathological processes. More recently, semi-supervised clustering methods [15, 74, 76, 83] have been proposed to tackle this problem from a novel angle. To seek a pathology-oriented clustering solution, semi-supervised approaches dissect disease heterogeneity by the “1-to-k” mapping between the reference group (i.e., healthy control (CN)) and the subgroups of the patient group (i.e., the k subtypes). This approach presumably zooms into the heterogeneity of pathological processes rather than unwanted heterogeneity in general. Furthermore, confounding variations, such as demographics, are often ruled out in these approaches.
Aiming to provide the reader in the imaging and machine learning community with a broad guideline in terms of methodology and clinical applications, we organize the remainder of this chapter as follows. In Section 2, we provide a brief overview of clustering methods, including unsupervised and semi-supervised approaches. Section 3 discusses their applications in various neurological and neuropsychiatric disorders and diseases. Section 4 concludes the paper by discussing our main observations, methodological limitations, and future directions.
2. Methodological development using machine learning and neuroimaging
Machine learning and neuroimaging have brought unprecedented opportunities to elucidate disease heterogeneity in various brain disorders and diseases [11]. Several trailblazing methodological papers have been recently published [83, 85, 88], challenging the conventional approach of patient stratification that puts all patients into the same bucket. Among these, unsupervised [85, 88] and semi-supervised clustering methods [83] sought to derive biologically data-driven disease subtypes, but they anchor the modeling from distinct perspectives. For conciseness, let us note that our imaging dataset contains q healthy control (CN) samples , representing our reference group, and n patient samples (PT) , representing the target subtype population. We denote the whole population as a matrix that is organized by arranging each image as a vector per column , where p is the number of features per image. We use binary labels to distinguish the patient and control groups, where 1 represents PT and -1 means CN. Disease subtyping sought to find the number of clusters (k) in the patient group that are neuroanatomically distinct while clinically relevant.
2.1 U nsupervised clustering
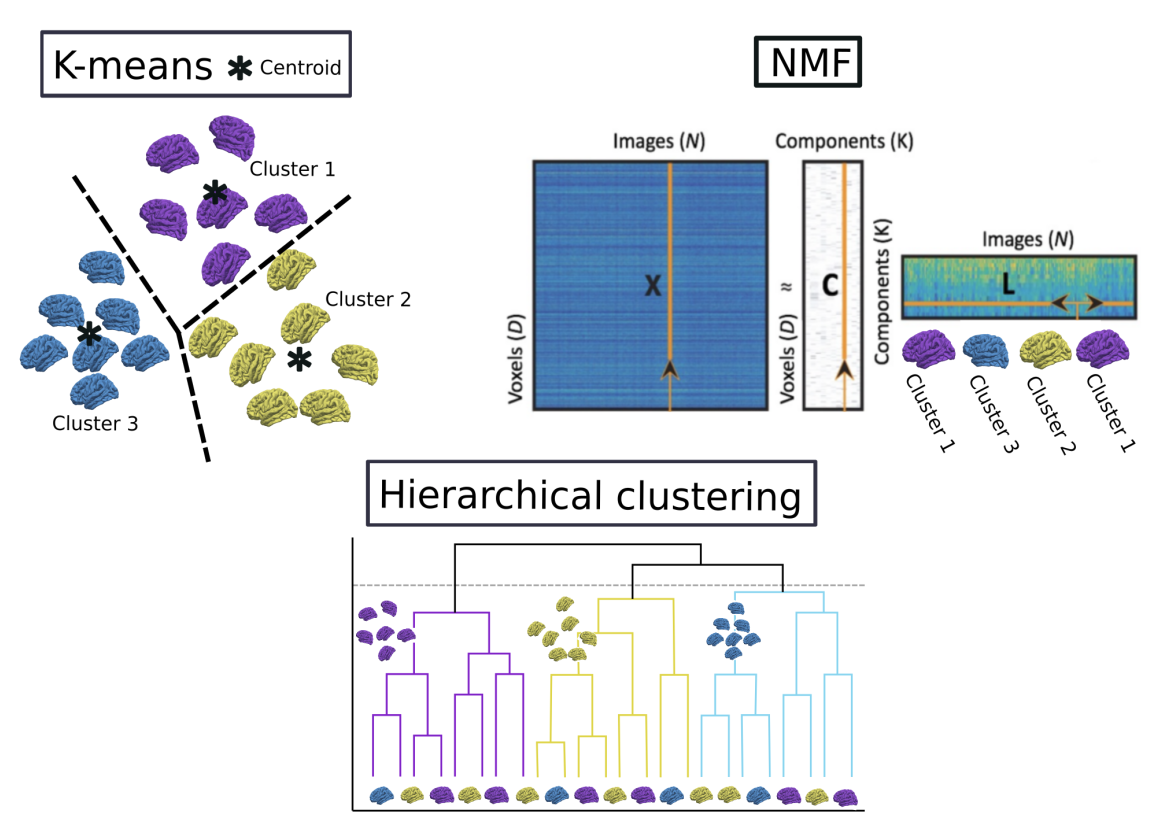
Many recent efforts to discover the heterogeneous nature of brain diseases have investigated different unsupervised clustering algorithms [21, 36, 39, 46, 53, 57, 58, 60, 62, 64, 63, 71, 41, 85, 88]. Among these approaches, the key clustering methods are often K-means, hierarchical clustering, and non-negative matrix factorization (NMF) (Figure 1). In this subsection, we first briefly go through these methods. Subsequently, we focus on two representative models building on these unsupervised methods, i.e., Sustain [85] and latent Dirichlet allocation [88].
2.1.1. K-means clustering
K-means clustering aims to directly partition the n patients into k clusters. Each patient belongs to the cluster with the nearest mean (i.e., cluster centroid) quantified by a distance metric of choice (e.g., Euclidean distance). Since searching the global minimum in clustering is computationally difficult (NP-hard), local minima are searched in the K-means algorithm via an iterative refinement approach. This usually involves two steps after giving an initial set of k centroids: i) assignment step, assigning each data point to the cluster with the nearest centroid with the least squared Euclidean distance; ii) update step, recalculating means (centroids) for all data points assigned to each cluster. The two steps iteratively continue until the convergence, i.e., the assignments no longer change. More details regarding the k-means algorithm are provided in Chapter 2, Section 12.1. Please refer to [24, 65, 66] for representative studies using K-means for disease subtyping.
2.1.2. NMF clustering
Non-negative matrix factorization (NMF) is a method that implicitly performs clustering by taking advantage that complex patterns can be construed as a sum of simple parts. In essence, the input data is factorized into two non-negative matrices and , for which we refer to the component matrix and loading coefficient matrix, respectively. This method has been widely used as an effective dimensionality reduction technique in signal processing and image analysis [42]. By its nature, the matrix can be directly used for clustering purposes, which is analogous to K-means if we impose an orthogonality constraint on the matrix. Specifically, if for all , this clusters the data point into the k-th cluster. The vectors of the matrix indicate the cluster centroids. Please refer to [41] for a representative study using NMF for disease subtyping.
2.1.3. Hierarchical clustering
Hierarchical clustering aims to build a hierarchy of clusters, including two types of approach: agglomerative and divisive [13]. In general, the merges and splits are determined greedily and presented in a dendrogram. Similarly, a measure of dissimilarity between sets of observations is required. Most commonly, this is achieved by using an appropriate metric (e.g., Euclidean distance) and a linkage criterion that specifies the dissimilarity of sets as a function of the pairwise distances of observations. Please refer to [34, 38, 53, 57, 63] for representative studies using the hierarchical clustering for disease subtyping.
2.1.4. Representative unsupervised clustering methods
Sustain [85] is an unsupervised clustering method for subtype and stage inference. Specifically, Sustain formulates the model as groups of subjects with a particular biomarker progression pattern as a subtype. The biomarker evolution of each subtype is modeled as a linear z-score model, a continuous generalization of the original event-based model [86]. Each biomarker follows a piecewise linear trajectory over a common timeframe. The key advantage of this model is that it can work with purely cross-sectional data, and derive an imaging signatures of subtype and stage simultaneously.
A Bayesian latent Dirichlet allocation model [88] was proposed to extract latent AD-related atrophy factors. This probabilistic approach hypothesizes that each patient expresses one or more latent factors, and each factor is associated with distinct but possibly overlapping atrophy patterns. However, due to the nature of latent Dirichlet allocation methods, the input images have to be discretized. Moreover, this method exclusively models brain atrophy while ignoring brain enlargement. For example, larger brain volumes in basal ganglia have been associated with one subtype of schizophrenia [7].
2.2 S emi-supervised clustering
Semi-supervised clustering methods dissect the subtle heterogeneity of interest under the principle of deriving data-driven and neurobiologically plausible subtypes (Figure 2). In essence, the “1-to-k” mapping between the reference CN group and the PT group, thereby teasing out clusters that are likely driven by distinct pathological trajectories, instead of by global similarity/dissimilarity in data, which is the core momentum of conventional unsupervised clustering methods.
In the following subsections, we briefly discuss four semi-supervised clustering methods. These methods employ different techniques to seek this “1-to-k” mapping. In particular, CHIMERA [15] and Smile-GAN [83] utilize generative models to achieve this mapping, while HYDRA [74] and MAGIC [76] are built on top of discriminative models.
2.2.1. CHIMERA
CHIMERA employs a generative probabilistic approach, considers all samples as points in the imaging space, and infers the clusters from the transformations between the CN and PT distributions. It hypothesizes that the PT distribution can be generated from the CN distribution under k sets of transformations, each reflecting a distinct disease process.
Mathematically, the transformation is a convex combination of the k linear transformations that map a CN subject in the reference space to the target space: , where is the probability that a PT belongs to the j-th subtype. Ideally, if the disease subtypes were distinct, should take value 1 for the transformation corresponding to this specific disease subtype and value 0 otherwise. At its core, the Coherent Point Drift algorithm [52], a generative probabilistic approach, is used to estimate the transformation . Specifically, the CN sample point is mapped to the PT domain and regarded as a centroid of a spherical Gaussian cluster, whereas the patient points are treated as independent and identically distributed data generated by a Gaussian Mixture Model (GMM) with equal weights for each cluster. The goal is to maximize the data likelihood during the distribution matching while also taking into account covariate confounds (e.g., age and gender). The Expectation-Maximization approach is adopted to optimize the resulting energy objective. Clustering inference is straightforward after the optimized transformation is achieved, i.e., a patient can be assigned the subtype membership corresponding to the largest likelihood.
2.2.2. Smile-GAN
Smile-GAN is a novel generative deep learning approach based on Generative Adversarial Networks (GAN). The reader may refer to Chapter 5 for generic information about GANs. Smile-GAN aims to learn a mapping function, , from joint CN domain and subtype domain to the PT domain , by transforming CN data to different synthesized PT data that are indistinguishable from real PT data, , by the discriminator, . Mapping function, , is regularized for inverse consistencies, with a clustering function, , trained interactively to reconstruct from synthesized PT data . The clustering function, , can also be directly used to cluster both training and unseen test data after the training process.
More specifically, three different data distributions are denoted as (for controls), (for patients) and (for a subtype), respectively, where is sampled from a discrete uniform distribution and encoded as a one-hot vector with dimension (number of clusters). Mapping function, , and clustering function, , are learned through the following training procedure ( denotes the cross-entropy loss):
| (1) |
where
| (2) | ||||
| (3) | ||||
| (4) |
The objective consists of adversarial loss , regularization terms and . Adversarial loss forces the synthesized PT data to follow similar distributions as real PT data. The discriminator , trying to identify synthesized PT data from real PT data, attempts to maximize the loss while the mapping attempts to minimize against it. Both regularization terms serve to constrain the function class where the mapping function is sampled from so that it is truly meaningful while matching the distributions. Minimization of encourages sparsity of regions captured by , with the assumption that only some regions are changed by disease effect. Optimizing ensures that the input sub variable can be reconstructed from synthesized PT data , so that the mutual information between and are maximized, and distinct imaging patterns are synthesized when takes different values. Further regularization is also imposed by forcing mapping function f and clustering function g to be Lipschitz continuous. More importantly, thanks to the inverse consistencies led by , function can directly output cluster probabilities and cluster labels when given unseen test PT data.
2.2.3. HYDRA
In contrast to the generative approaches used in CHIMERA and Smile-GAN, HYDRA leverages a widely used discriminative method, i.e., support vector machines (SVM), to seek this “1-to-k” mapping. The novelty is that HYDRA extends multiple linear SVMs to the non-linear case in a piecewise fashion, thereby simultaneously serving for classification and clustering. Specifically, it constructs a convex polytope by combining the hyperplane from k linear SVMs, separating the CN group and the k subpopulation of the PT group. Intuitively, each face of the convex polytope can be regarded to encode each subtype, capturing a distinct disease effect.
The convex polytope is estimated by sequentially solving each linear SVM as a sub-problem under the principle of the sample weighted SVM [8]. The optimization stops when the sample weights become stable, i.e., the polytope is stably established. The objective of maximizing the polytope’s margin can be summarized as:
| (5) |
where and are the weight and bias for each hyperplane, respectively. is a penalty parameter on the training error, and is the subtype membership matrix of dimension deciding whether a patient sample i belongs to subtype j. The cluster membership is inferred as follows:
| (6) |
2.2.4. MAGIC
MAGIC was proposed to overcome one of the main limitations that HYDRA faced. That is, a single-scale set of features (e.g., atlas-based regions of interest) may not be sufficient to derive subtle differences, compared to global demographics, disease heterogeneity, since ample evidence has shown that the brain is fundamentally composed of multi-scale structural or functional entities. To this objective, MAGIC extracts multi-scale features in a coarse-to-fine granular fashion via stochastic orthogonal projective non-negative matrix factorization (opNMF) [70], a very effective unbiased, data-driven method for extracting biologically interpretable and reproducible feature representations. Together with these multi-scale features, HYDRA is embedded into a double-cyclic optimization procedure to yield robust and scale-consistent cluster solutions.
MAGIC encapsulates the two previous proposed methods (i.e., opNMF and HYDRA) and optimizes the clustering objective for each single-scale feature as a sub-optimization problem. To fuse the multi-scale clustering information and enforce the clusters to be scale-consistent, it adopts a double-cyclic procedure that transfers and fine-tunes the clustering polytope. First, i) inner cyclic procedure: let us remind that HYDRA decides the clusters based on the subtype membership matrix (). MAGIC first initializes the matrix with a specific single-scale feature set, i.e., , then the matrix is transferred to the next set of feature set until the predefined stopping criterion is achieved (i.e., the clustering solution across scales are stable). Secondly, ii) outer cyclic procedure: the inner cyclic procedure was repeated by initializing with each single-scale feature set. Finally, to determine the final subtype assignment, we perform a consensus clustering by computing a co-occurrence matrix based on all the clustering results and then perform spectral clustering [54].
3. Application to brain disorders
Brain disorders and diseases affect the human brain across a wide age range. Neurodevelopmental disorders, such as autism spectrum disorders (ASD), are usually present from early childhood and affect daily functioning [22]. Psychotic disorders, such as schizophrenia, involve psychosis that is typically diagnosed for the first time in late adolescence or early adulthood [31]. Dementia and mild cognitive impairment (MCI) prevail both in late mid-life for early-onset AD (usually 30 to 60 years of age) and most frequently in late-life for late-onset AD (usually over 65 years of age) [50]. Brain cancers in children and adults are heterogeneous and encompass over 100 different histological types of tumors, based on cells of origin and other histopathological features, and have substantial morbidity and mortality [56]. Ample clinical evidence encourages the stratification of the patients in these brain disorders and cancers, potentially paving the road towards individualized precision medicine.
This section collectively overviews previous work aiming to unravel imaging-derived heterogeneity in ASD, psychosis, major depressive disorders (MDD), MCI and AD, and brain cancer.
3.1 A utism Spectrum Disorder
ASD encompasses a broad spectrum of social deficits and atypical behaviors [48]. Heterogeneity of its clinical presentation has sparked massive research efforts to find subtypes to better delineate its diagnosis [44, 79]. Recent initiatives to aggregate neuroimaging data of ASD, such as the ABIDE [14] and the EU-AIMS [45], also have motivated large-scale subtyping projects using imaging signatures [35].
Different clustering methods have been applied to reveal structural brain-based subtypes, but primarily traditional techniques such as the K-means [9] or hierarchical clustering [34]. Besides structural MRI, functional MRI [20] and EEG [18] have also been popular modalities. For reasons discussed earlier, normative clustering and dimensional analyses are better suited to parse a patient population that is highly heterogeneous [72]. However, efforts in this avenue have been primitive, with only a few recent publications using cortical thickness [87]. Taken together, although more validation and replication efforts are necessary to define any reliable neuroanatomical subtypes of ASD, some convergence in findings has been noted [35]. First, most sets of ASD neuroimaging subtypes indicate a combination of both increases and decreases in imaging features compared to the CN group, instead of pointing in a uniform direction. Second, most subtypes are characterized by spatially distributed imaging patterns instead of isolated or focal patterns. Both findings emphasize the significant heterogeneity in ASD brains and the need for better stratification.
The search for subtypes in the ASD population has unique challenges. First, the early onset of ASD implies that it is heavily influenced by neurodevelopmental processes. Depending on the selected age range, the results may significantly differ. Second, ASD is more prevalent in males, with three to four male cases for one female case [43], which adds a layer of potential bias. Third, individuals with ASD often suffer psychiatric comorbidities, such as ADHD, anxiety disorders, obsessive-compulsive disorder, among many others [29], which, if not screened carefully, can dilute or alter the true signal.
3.2 P sychosis
Psychosis is a medical syndrome characterized by unusual beliefs called delusions and sometimes hallucinations of visions, sounds, smells, or body sensations that are not present in reality. Symptoms, functioning, and outcomes are highly heterogeneous across individuals, leading to long-standing hypotheses of underlying brain subgroups. However, objective brain biomarkers have largely not been discovered for any psychosis diagnosis, stage, or clinically-defined subgroup [32, 59]. Neuroimaging studies are also affected by brain heterogeneity [1, 37]. Recent research has thus focused on finding structural brain subtypes using unbiased statistical techniques [7, 19, 40].
Psychosis studies have mainly focused on determining subtypes by clustering brain structural data within the chronic schizophrenia population that has had the illness for years, with results demonstrating two [7, 19], three [58], and six [71] subgroups. Various clustering techniques have been used to achieve these outcomes, including conventional approaches, such as k-means, in addition to more advanced machine learning methods, such as semi-supervised learning. A limitation of the work so far has been the lack of internal or external validation. Still, in studies with robust internal validation methods using metrics that choose the optimal cluster number based on the stability of the solution (e.g., consensus clustering), subtypes cluster along the lines of the severity of brain differences.
In a recent study, with the largest sample to date (n=671), clustered individuals with chronic schizophrenia using HYDRA and multiple internal validation procedures were applied (i.e., cross-validation resampling, split-half reproducibility, and leave-site-out validation) [7]. A two-subtype solution was found, with one subtype demonstrating widespread reductions and the other showing the localized larger volume of the striatum that was not associated with antipsychotic use. Interestingly, there were limited associations with current psychosis symptoms in this work, but indications of associations with education and illness duration in specific subtypes.
Functional imaging has also been used to define psychosis subgroups using functional connectivity at rest [82] and effective connectivity during task performance [5]. The research commonly has relatively low sample sizes with little internal or external validation. Still, of these works, preliminary results demonstrate that clusters can follow diagnostic divisions between individuals with psychosis [5] and that specific networks (e.g., frontoparietal network) are associated with specific psychotic symptoms [5] [82]. A recent advanced deep learning approach has also revealed clinical separations along the lines of symptom severity [81]. Taken together with brain structural results, it is possible that functional imaging maps onto symptom states rather than underlying illness traits that are captured by structural imaging. Further internal and external validation work is required to investigate this hypothesis by characterizing, comparing, and ultimately combining clustering solutions. A critical future direction will also be to conduct longitudinal studies that track individuals over time. Such research could lead the way towards clinical translation.
3.3 M ajor depressive disorder
MDD is a common, severe, and recurrent disorder, with over 300 million people affected worldwide, and is characterized by low mood, apathy, and social withdrawal, with symptoms spanning multiple domains [80]. Its vast heterogeneity is exemplified by the fact that according to DSM-5 criteria, at least 227 and up to 16,400 unique symptom presentations exist [26, 47]. The potential causes for this heterogeneity vary from divergent clinical symptom profiles to genetic aetiologies and individual differences in treatment outcomes.
Despite neurobiological findings in MDD spanning cortical thickness, gray matter volume (GMV), and fractional anisotropy (FA) measures, objective brain biomarkers that can be used to diagnose and predict disease course and outcome remain elusive [6, 47, 68]. Recently, there have been efforts to identify neurobiologically based subtypes of depression using a bottom-up approach, mainly using data from resting-state fMRI [47]. Several studies [24, 65, 66] employed k-means clustering and group iterative multiple model estimation respectively to identify two functional connectivity subtypes, while Tokuda et al. [73] and Drysdale et al. [17] identified three and four subtypes respectively using non-parametric Bayesian mixture models and hierarchical clustering. These subtypes are characterized by reduced connectivity in different networks, including the Default Mode Network (DMN), ventral attention network, and frontostriatal and limbic dysfunction. Regarding structural neuroimaging, one study has used K-means clustering on fractional anisotropy (FA) data to identify two depression subtypes. The first subtype was characterized by decreased FA in the right temporal lobe and the right middle frontal areas and was associated with an older age at onset. In contrast, the second subtype was characterized by increased FA in the left occipital lobe and was associated with a younger age at onset [10].
Current research in the identification of brain subtypes in MDD has produced results that are promising but confounded by methodological and design limitations. While some studies have shown clinical promises such as predicting higher depressive symptomatology and lower sustenance of positive mood [65, 66], depression duration [24], and TMS therapy response [17], they are confounded by limitations such as relatively small samples sizes, nuisance variances such as age, gender, and common ancestry, lack of external validation, and lack of statistical significance testing of identified clusters. Furthermore, there has been a lack of ambition in the use of novel clustering techniques. Clustering based on structural neuroimaging is limited compared to other disease entities and is an avenue that future research should consider. Future studies should also aim to perform longitudinal clustering to elucidate the stability of identified brain subtypes over time and examine their utility in predicting disease outcomes.
3.4 M CI and AD
AD, along with its prodromal stage presenting MCI, is the most common neurodegenerative disease, affecting millions across the globe. Although a plethora of imaging studies have derived AD-related imaging signatures, most studies ignored the heterogeneity in AD. Recently, there has been a developing body of effort to derive imaging signatures of AD that are heterogeneity-aware (i.e., subtypes) [75, 76, 83, 85, 88].
Most previous studies leveraged unsupervised clustering methods such as Sustain [85], NMF [41], latent Dirichlet allocation [88], and hierarchical clustering [38, 53, 57, 63]. Other papers [16, 21, 25, 74, 83] utilized semi-supervised clustering methods. Due to the variabilities of the choice of databases and methodologies and the lack of ground truth in the context of clustering, the reported number of clusters and the subtypes’ neuroanatomical patterns differ and cannot be directly compared. The targeted heterogeneous population of study also varies across papers. For instance, [74] focused on dissecting the neuroanatomical heterogeneity for AD patients, while [16] included AD plus MCI and [21] studied MCI only. However, some common subtypes were found in different studies. First, a subtype showing a typical diffuse atrophy pattern over the entire brain was witnessed in several studies [16, 38, 39, 60, 63, 64, 41, 74, 76, 83, 85]. Another subtype demonstrating nearly normal brain anatomy was robustly identified [15, 21, 39, 53, 57, 64, 63, 76, 83]. Moreover, studies [16, 63, 64, 76, 83] also reported one subtype showing atypical AD patterns (i.e., hippocampus or medial temporal lobe atrophy spared).
Though these methods enabled a better understanding of heterogeneity in AD, there are still limitations and challenges. First, due to demographic variations and the existence of comorbidities, it is not guaranteed that models cluster the data based on variations of the pathology of interest. Semi-supervised methods might tackle this problem to some extent, but more careful sample selection and further study with longitudinal data may ensure disease-specificity. Second, spatial differences and temporal changes may simultaneously contribute to subtypes derived through clustering methods. Third, subtypes captured from neuroimaging data alone bring limited insight into disease treatments, thereby a joint study of neuroimaging and genetic heterogeneity may provide greater clinical value [77, 27].
3.5 B rain cancer
Brain tumors, such as glioblastoma (GBM), exhibit extensive inter and intra-tumor heterogeneity, diffuse infiltration, and invasiveness of various immune and stromal cell populations, which pose diagnostic and prognostic challenges, and render the standard therapies futile [4]. Deciphering the underlying heterogeneity of brain tumors, which arises from genomic instability of these tumors, plays a key role in understanding and predicting the course of tumor progression and its response to the standard therapies, thereby designing effective therapies targeted at aberrant genetic alterations [2, 67]. Medical imaging noninvasively portrays the phenotypic differences of brain tumors and their micro-environment caused by molecular activities of tumors on a macroscopic scale [12, 30]. It has the potential to provide readily accessible and surrogate biomarkers of particular genomic alterations, predict response to therapy, avoid risks of tumor biopsy or inaccurate diagnosis due to sampling errors, and ultimately develop personalized therapies to improve patient outcomes. An imaging subtype of brain tumors may provide a wealth of information about the tumor, including distinct molecular pathways [23, 28].
Recent studies on radiomic analysis of multiparametric MRI (mpMRI) scans provide evidence of distinct phenotypic presentation of brain tumors associated with specific molecular characteristics. These studies propose that quantification of tumor morphology, texture, regional microvasculature, cellular density, or microstructural properties can map to different imaging subtypes. In particular, one study [69] discovered three distinct clusters of GBM subtypes through unsupervised clustering of these features, with significant differences in survival probabilities and associations with specific molecular signaling pathways. These imaging subtypes, namely solid, irregular, and rim-enhancing, were significantly linked to different clinical outcomes and molecular characteristics, including isocitrate dehydrogenase-1, O6-methylguanine–DNA methyltransferase, epidermal growth factor receptor variant III, and transcriptomic molecular subtype composition.
These studies have offered new insights into the characterization of tumor heterogeneity on both microscopic, i.e., histology and molecular, and macroscopic, i.e., imaging levels, consequently providing a more comprehensive understanding of the tumor aggressiveness and patient prognosis, and ultimately, the development of personalized treatments.
4. Conclusion
Taken together, these novel clustering algorithms tailored for high resolution yet highly variable neuroimaging datasets have demonstrated a broad utility in disease subtyping across many neurological and psychiatric conditions. Simultaneously, cautions need to be taken in order not to overclaim the biological importance of subtypes, since all clustering methods find patterns in data, even if such patterns don’t have a meaningful underlying biological correlate [3]. External validations are necessary. For instance, evidence of post-hoc evaluations, e.g., a difference in clinical variables or genetic architectures, can support the biological relevance of identified neuroimaging-based subtypes [77]. Moreover, good practices such as split-sample analysis, permutation tests [7], and comparison to the guideline of semi-simulated experiments [76] discern the robustness of the subtypes. As dataset sizes and imaging resolution improve over time, unique computational challenges are expected to appear, along with unique opportunities to further refine our methodologies to decipher the diversity of brain diseases.
Acknowledgments
This work was supported, in part, by NIH grants R01NS042645, U01AG068057, R01MH112070 and RF1AG054409.
References
- Abi-Dargham and Horga [2016] Abi-Dargham A, Horga G (2016) The search for imaging biomarkers in psychiatric disorders. Nature Medicine 22(11):1248–1255, DOI 10.1038/nm.4190
- Akhavan et al [2019] Akhavan D, Alizadeh D, Wang D, Weist MR, Shepphird JK, Brown CE (2019) CAR T cells for brain tumors: Lessons learned and road ahead. Immunological Reviews 290(1):60–84, DOI 10.1111/imr.12773, URL https://onlinelibrary.wiley.com/doi/abs/10.1111/imr.12773, _eprint: https://onlinelibrary.wiley.com/doi/pdf/10.1111/imr.12773
- Altman and Krzywinski [2017] Altman N, Krzywinski M (2017) Clustering. Nature Methods 14(6):545–546, DOI 10.1038/nmeth.4299, URL http://www.nature.com/articles/nmeth.4299
- Andrea et al [2013] Andrea S, Inmaculada S, Sara P, Anestis T, Peter C, John M, Christina C, Colin W, Simon T (2013) Intratumor heterogeneity in human glioblastoma reflects cancer evolutionary dynamics. Proceedings of the National Academy of Sciences of the United States of America 110:4009–4014, DOI 10.1073/pnas.1219747110
- Brodersen et al [2014] Brodersen KH, Deserno L, Schlagenhauf F, Lin Z, Penny WD, Buhmann JM, Stephan KE (2014) Dissecting psychiatric spectrum disorders by generative embedding. NeuroImage Clinical 4:98–111, DOI 10.1016/j.nicl.2013.11.002
- Buch and Liston [2021] Buch AM, Liston C (2021) Dissecting diagnostic heterogeneity in depression by integrating neuroimaging and genetics. Neuropsychopharmacology 46(1):156–175, DOI 10.1038/s41386-020-00789-3, URL https://www.nature.com/articles/s41386-020-00789-3, bandiera_abtest: a Cg_type: Nature Research Journals Number: 1 Primary_atype: Reviews Publisher: Nature Publishing Group Subject_term: Depression;Diagnostic markers Subject_term_id: depression;diagnostic-markers
- Chand et al [2020] Chand GB, Dwyer DB, Erus G, Sotiras A, Varol E, Srinivasan D, Doshi J, Pomponio R, Pigoni A, Dazzan P, Kahn RS, Schnack HG, Zanetti MV, Meisenzahl E, Busatto GF, Crespo-Facorro B, Pantelis C, Wood SJ, Zhuo C, Shinohara RT, Shou H, Fan Y, Gur RC, Gur RE, Satterthwaite TD, Koutsouleris N, Wolf DH, Davatzikos C (2020) Two distinct neuroanatomical subtypes of schizophrenia revealed using machine learning. Brain 143(3):1027–1038, DOI 10.1093/brain/awaa025, URL https://academic.oup.com/brain/article/143/3/1027/5758311
- Chang and Lin [2011] Chang CC, Lin CJ (2011) LIBSVM: A library for support vector machines. ACM Transactions on Intelligent Systems and Technology 2(3):1–27, DOI 10.1145/1961189.1961199, URL http://dl.acm.org/citation.cfm?doid=1961189.1961199
- Chen et al [2019] Chen H, Uddin LQ, Guo X, Wang J, Wang R, Wang X, Duan X, Chen H (2019) Parsing brain structural heterogeneity in males with autism spectrum disorder reveals distinct clinical subtypes. Human Brain Mapping 40(2):628–637, DOI 10.1002/hbm.24400
- Cheng et al [2014] Cheng Y, Xu J, Yu H, Nie B, Li N, Luo C, Li H, Liu F, Bai Y, Shan B, Xu L, Xu X (2014) Delineation of Early and Later Adult Onset Depression by Diffusion Tensor Imaging. PLoS ONE 9(11), DOI 10.1371/journal.pone.0112307, URL https://www.ncbi.nlm.nih.gov/pmc/articles/PMC4231105/
- Davatzikos [2019] Davatzikos C (2019) Machine learning in neuroimaging: Progress and challenges. NeuroImage 197:652–656, DOI 10.1016/j.neuroimage.2018.10.003, URL https://linkinghub.elsevier.com/retrieve/pii/S1053811918319621
- Davatzikos et al [2019] Davatzikos C, Sotiras A, Fan Y, Habes M, Erus G, Rathore S, Bakas S, Chitalia R, Gastounioti A, Kontos D (2019) Precision diagnostics based on machine learning-derived imaging signatures. Magnetic Resonance Imaging 64:49–61, DOI 10.1016/j.mri.2019.04.012, URL https://www.sciencedirect.com/science/article/pii/S0730725X18306301
- Day and Edelsbrunner [1984] Day WHE, Edelsbrunner H (1984) Efficient algorithms for agglomerative hierarchical clustering methods. Journal of Classification 1(1):7–24, DOI 10.1007/BF01890115, URL http://link.springer.com/10.1007/BF01890115
- Di Martino et al [2017] Di Martino A, O’Connor D, Chen B, Alaerts K, Anderson JS, Assaf M, Balsters JH, Baxter L, Beggiato A, Bernaerts S, Blanken LME, Bookheimer SY, Braden BB, Byrge L, Castellanos FX, Dapretto M, Delorme R, Fair DA, Fishman I, Fitzgerald J, Gallagher L, Keehn RJJ, Kennedy DP, Lainhart JE, Luna B, Mostofsky SH, Müller RA, Nebel MB, Nigg JT, O’Hearn K, Solomon M, Toro R, Vaidya CJ, Wenderoth N, White T, Craddock RC, Lord C, Leventhal B, Milham MP (2017) Enhancing studies of the connectome in autism using the autism brain imaging data exchange II. Scientific Data 4:170010, DOI 10.1038/sdata.2017.10
- Dong et al [2016a] Dong A, Honnorat N, Gaonkar B, Davatzikos C (2016a) CHIMERA: Clustering of Heterogeneous Disease Effects via Distribution Matching of Imaging Patterns. IEEE Transactions on Medical Imaging 35(2):612–621, DOI 10.1109/TMI.2015.2487423, URL http://ieeexplore.ieee.org/document/7293208/
- Dong et al [2016b] Dong A, Toledo JB, Honnorat N, Doshi J, Varol E, Sotiras A, Wolk D, Trojanowski JQ, Davatzikos C, for the Alzheimer’s Disease Neuroimaging Initiative (2016b) Heterogeneity of neuroanatomical patterns in prodromal Alzheimer’s disease: links to cognition, progression and biomarkers. Brain p aww319, DOI 10.1093/brain/aww319, URL https://academic.oup.com/brain/article-lookup/doi/10.1093/brain/aww319
- Drysdale et al [2017] Drysdale AT, Grosenick L, Downar J, Dunlop K, Mansouri F, Meng Y, Fetcho RN, Zebley B, Oathes DJ, Etkin A, Schatzberg AF, Sudheimer K, Keller J, Mayberg HS, Gunning FM, Alexopoulos GS, Fox MD, Pascual-Leone A, Voss HU, Casey BJ, Dubin MJ, Liston C (2017) Resting-state connectivity biomarkers define neurophysiological subtypes of depression. Nature Medicine 23(1):28–38, DOI 10.1038/nm.4246, URL https://www.nature.com/articles/nm.4246, number: 1 Publisher: Nature Publishing Group
- Duffy and Als [2019] Duffy FH, Als H (2019) Autism, spectrum or clusters? An EEG coherence study. BMC neurology 19(1):27, DOI 10.1186/s12883-019-1254-1
- Dwyer et al [2018] Dwyer DB, Cabral C, Kambeitz-Ilankovic L, Sanfelici R, Kambeitz J, Calhoun V, Falkai P, Pantelis C, Meisenzahl E, Koutsouleris N (2018) Brain Subtyping Enhances The Neuroanatomical Discrimination of Schizophrenia. Schizophrenia Bulletin 44(5):1060–1069, DOI 10.1093/schbul/sby008, URL https://doi.org/10.1093/schbul/sby008
- Easson et al [2019] Easson AK, Fatima Z, McIntosh AR (2019) Functional connectivity-based subtypes of individuals with and without autism spectrum disorder. Network Neuroscience (Cambridge, Mass) 3(2):344–362, DOI 10.1162/netn˙a˙00067
- Ezzati et al [2020] Ezzati A, Zammit AR, Habeck C, Hall CB, Lipton RB, Alzheimer’s Disease Neuroimaging Initiative (2020) Detecting biological heterogeneity patterns in ADNI amnestic mild cognitive impairment based on volumetric MRI. Brain Imaging and Behavior 14(5):1792–1804, DOI 10.1007/s11682-019-00115-6
- Faras et al [2010] Faras H, Al AN, Tidmarsh L (2010) Autism spectrum disorders. Annals of Saudi Medicine 30(4):295–300, DOI 10.4103/0256-4947.65261, URL https://www.annsaudimed.net/doi/full/10.4103/0256-4947.65261, publisher: King Faisal Specialist Hospital & Research Centre
- Fathi Kazerooni et al [2020] Fathi Kazerooni A, Bakas S, Saligheh Rad H, Davatzikos C (2020) Imaging signatures of glioblastoma molecular characteristics: A radiogenomics review. Journal of Magnetic Resonance Imaging 52(1):54–69, DOI 10.1002/jmri.26907, URL https://onlinelibrary.wiley.com/doi/abs/10.1002/jmri.26907, _eprint: https://onlinelibrary.wiley.com/doi/pdf/10.1002/jmri.26907
- Feder et al [2017] Feder S, Sundermann B, Wersching H, Teuber A, Kugel H, Teismann H, Heindel W, Berger K, Pfleiderer B (2017) Sample heterogeneity in unipolar depression as assessed by functional connectivity analyses is dominated by general disease effects. Journal of Affective Disorders 222:79–87, DOI 10.1016/j.jad.2017.06.055
- Filipovych et al [2012] Filipovych R, Resnick SM, Davatzikos C (2012) JointMMCC: Joint Maximum-Margin Classification and Clustering of Imaging Data. IEEE Transactions on Medical Imaging 31(5):1124–1140, DOI 10.1109/TMI.2012.2186977, URL http://ieeexplore.ieee.org/document/6146434/
- Fried and Nesse [2015] Fried EI, Nesse RM (2015) Depression is not a consistent syndrome: An investigation of unique symptom patterns in the STAR*D study. Journal of Affective Disorders 172:96–102, DOI 10.1016/j.jad.2014.10.010, URL https://www.sciencedirect.com/science/article/pii/S0165032714006326
- GB et al [2022] GB C, P S, DB D, J W, G E, J D, D S, E M, E V, A S, G H (2022) Two schizophrenia imaging signatures and their associations with cognition, psychopathology, and genetics in the general population. arxiv DOI 10.1101/2022.01.07.22268854
- Gevaert et al [2014] Gevaert O, Mitchell LA, Achrol AS, Xu J, Echegaray S, Steinberg GK, Cheshier SH, Napel S, Zaharchuk G, Plevritis SK (2014) Glioblastoma Multiforme: Exploratory Radiogenomic Analysis by Using Quantitative Image Features. Radiology 273(1):168–174, DOI 10.1148/radiol.14131731, URL https://pubs.rsna.org/doi/10.1148/radiol.14131731, publisher: Radiological Society of North America
- Gillberg and Fernell [2014] Gillberg C, Fernell E (2014) Autism plus versus autism pure. Journal of Autism and Developmental Disorders 44(12):3274–3276, DOI 10.1007/s10803-014-2163-1
- Gillies et al [2016] Gillies RJ, Kinahan PE, Hricak H (2016) Radiomics: Images Are More than Pictures, They Are Data. Radiology 278(2):563–577, DOI 10.1148/radiol.2015151169
- Gottesman et al [1982] Gottesman II, Shields J, Hanson DR (1982) Schizophrenia. CUP Archive, google-Books-ID: eoA6AAAAIAAJ
- Haijma et al [2013] Haijma SV, Van Haren N, Cahn W, Koolschijn PCMP, Hulshoff Pol HE, Kahn RS (2013) Brain volumes in schizophrenia: a meta-analysis in over 18 000 subjects. Schizophrenia Bulletin 39(5):1129–1138, DOI 10.1093/schbul/sbs118
- Hamerly and Elkan [2004] Hamerly G, Elkan C (2004) Learning the k in k-means. In: Thrun S, Saul LK, Schölkopf B (eds) Advances in Neural Information Processing Systems 16, MIT Press, pp 281–288, URL http://papers.nips.cc/paper/2526-learning-the-k-in-k-means.pdf
- Hong et al [2018] Hong SJ, Valk SL, Di Martino A, Milham MP, Bernhardt BC (2018) Multidimensional Neuroanatomical Subtyping of Autism Spectrum Disorder. Cerebral Cortex (New York, NY: 1991) 28(10):3578–3588, DOI 10.1093/cercor/bhx229
- Hong et al [2020] Hong SJ, Vogelstein JT, Gozzi A, Bernhardt BC, Yeo BTT, Milham MP, Di Martino A (2020) Toward Neurosubtypes in Autism. Biological Psychiatry 88(1):111–128, DOI 10.1016/j.biopsych.2020.03.022
- Honnorat et al [2019] Honnorat N, Dong A, Meisenzahl-Lechner E, Koutsouleris N, Davatzikos C (2019) Neuroanatomical heterogeneity of schizophrenia revealed by semi-supervised machine learning methods. Schizophrenia Research 214:43–50, DOI 10.1016/j.schres.2017.12.008, URL https://linkinghub.elsevier.com/retrieve/pii/S0920996417307600
- Insel and Cuthbert [2015] Insel T, Cuthbert B (2015) Medicine. brain disorders? precisely. Science (New York, NY) 348:499–500, DOI 10.1126/science.aab2358
- Jeon et al [2019] Jeon S, Kang JM, Seo S, Jeong HJ, Funck T, Lee SY, Park KH, Lee YB, Yeon BK, Ido T, Okamura N, Evans AC, Na DL, Noh Y (2019) Topographical Heterogeneity of Alzheimer’s Disease Based on MR Imaging, Tau PET, and Amyloid PET. Frontiers in Aging Neuroscience 11:211, DOI 10.3389/fnagi.2019.00211, URL https://www.frontiersin.org/article/10.3389/fnagi.2019.00211/full
- Jung et al [2016] Jung NY, Seo SW, Yoo H, Yang JJ, Park S, Kim YJ, Lee J, Lee JS, Jang YK, Lee JM, Kim ST, Kim S, Kim EJ, Na DL, Kim HJ (2016) Classifying anatomical subtypes of subjective memory impairment. Neurobiology of Aging 48:53–60, DOI 10.1016/j.neurobiolaging.2016.08.010, URL https://linkinghub.elsevier.com/retrieve/pii/S0197458016301853
- Kaczkurkin et al [2020] Kaczkurkin AN, Moore TM, Sotiras A, Xia CH, Shinohara RT, Satterthwaite TD (2020) Approaches to Defining Common and Dissociable Neurobiological Deficits Associated With Psychopathology in Youth. Biological Psychiatry 88(1):51–62, DOI 10.1016/j.biopsych.2019.12.015
- ten Kate et al [2018] ten Kate M, Dicks E, Visser PJ, van der Flier WM, Teunissen CE, Barkhof F, Scheltens P, Tijms BM, Alzheimer’s Disease Neuroimaging Initiative (2018) Atrophy subtypes in prodromal Alzheimer’s disease are associated with cognitive decline. Brain 141(12):3443–3456, DOI 10.1093/brain/awy264, URL https://academic.oup.com/brain/article/141/12/3443/5142624
- Lee and Seung [2001] Lee DD, Seung HS (2001) Algorithms for Non-negative Matrix Factorization. In: Proc. Neural Information Processing Systems, p 7
- Loomes et al [2017] Loomes R, Hull L, Mandy WPL (2017) What Is the Male-to-Female Ratio in Autism Spectrum Disorder? A Systematic Review and Meta-Analysis. Journal of the American Academy of Child and Adolescent Psychiatry 56(6):466–474, DOI 10.1016/j.jaac.2017.03.013
- Lord and Jones [2012] Lord C, Jones RM (2012) Annual research review: re-thinking the classification of autism spectrum disorders. Journal of Child Psychology and Psychiatry, and Allied Disciplines 53(5):490–509, DOI 10.1111/j.1469-7610.2012.02547.x
- Loth et al [2017] Loth E, Charman T, Mason L, Tillmann J, Jones EJH, Wooldridge C, Ahmad J, Auyeung B, Brogna C, Ambrosino S, Banaschewski T, Baron-Cohen S, Baumeister S, Beckmann C, Brammer M, Brandeis D, Bölte S, Bourgeron T, Bours C, de Bruijn Y, Chakrabarti B, Crawley D, Cornelissen I, Acqua FD, Dumas G, Durston S, Ecker C, Faulkner J, Frouin V, Garces P, Goyard D, Hayward H, Ham LM, Hipp J, Holt RJ, Johnson MH, Isaksson J, Kundu P, Lai MC, D’ardhuy XL, Lombardo MV, Lythgoe DJ, Mandl R, Meyer-Lindenberg A, Moessnang C, Mueller N, O’Dwyer L, Oldehinkel M, Oranje B, Pandina G, Persico AM, Ruigrok ANV, Ruggeri B, Sabet J, Sacco R, Cáceres ASJ, Simonoff E, Toro R, Tost H, Waldman J, Williams SCR, Zwiers MP, Spooren W, Murphy DGM, Buitelaar JK (2017) The EU-AIMS Longitudinal European Autism Project (LEAP): design and methodologies to identify and validate stratification biomarkers for autism spectrum disorders. Molecular Autism 8:24, DOI 10.1186/s13229-017-0146-8
- Lubeiro et al [2016] Lubeiro A, Rueda C, Hernández JA, Sanz J, Sarramea F, Molina V (2016) Identification of two clusters within schizophrenia with different structural, functional and clinical characteristics. Progress in Neuro-Psychopharmacology and Biological Psychiatry 64:79–86, DOI 10.1016/j.pnpbp.2015.06.015, URL https://linkinghub.elsevier.com/retrieve/pii/S0278584615300087
- Lynch et al [2020] Lynch CJ, Gunning FM, Liston C (2020) Causes and Consequences of Diagnostic Heterogeneity in Depression: Paths to Discovering Novel Biological Depression Subtypes. Biological Psychiatry 88(1):83–94, DOI 10.1016/j.biopsych.2020.01.012
- Masi et al [2017] Masi A, DeMayo MM, Glozier N, Guastella AJ (2017) An Overview of Autism Spectrum Disorder, Heterogeneity and Treatment Options. Neuroscience Bulletin 33(2):183–193, DOI 10.1007/s12264-017-0100-y
- Miller et al [2016] Miller KL, Alfaro-Almagro F, Bangerter NK, Thomas DL, Yacoub E, Xu J, Bartsch AJ, Jbabdi S, Sotiropoulos SN, Andersson JLR, Griffanti L, Douaud G, Okell TW, Weale P, Dragonu I, Garratt S, Hudson S, Collins R, Jenkinson M, Matthews PM, Smith SM (2016) Multimodal population brain imaging in the UK Biobank prospective epidemiological study. Nature Neuroscience 19(11):1523–1536, DOI 10.1038/nn.4393, URL https://www.nature.com/articles/nn.4393, number: 11 Publisher: Nature Publishing Group
- Mucke [2009] Mucke L (2009) Alzheimer’s disease. Nature 461(7266):895–897, DOI 10.1038/461895a, URL https://www.nature.com/articles/461895a, bandiera_abtest: a Cg_type: Nature Research Journals Number: 7266 Primary_atype: Comments & Opinion Publisher: Nature Publishing Group
- Murray et al [2011] Murray ME, Graff-Radford NR, Ross OA, Petersen RC, Duara R, Dickson DW (2011) Neuropathologically defined subtypes of Alzheimer’s disease with distinct clinical characteristics: a retrospective study. The Lancet Neurology 10(9):785–796, DOI 10.1016/S1474-4422(11)70156-9
- Myronenko A [2010] Myronenko A SX (2010) Point set registration: Coherent point drift. IEEE transactions on pattern analysis and machine intelligence 32:2262–2275, DOI 10.1109/TPAMI.2010.46
- Nettiksimmons et al [2014] Nettiksimmons J, DeCarli C, Landau S, Beckett L (2014) Biological heterogeneity in ADNI amnestic mild cognitive impairment. Alzheimer’s & Dementia 10(5):511–521.e1, DOI 10.1016/j.jalz.2013.09.003, URL https://linkinghub.elsevier.com/retrieve/pii/S1552526013028379
- Ng et al [2002] Ng A, Jordan M, Weiss Y (2002) On spectral clustering: Analysis and an algorithm. In: Dietterich T, Becker S, Ghahramani Z (eds) Advances in Neural Information Processing Systems, MIT Press, vol 14, URL https://proceedings.neurips.cc/paper/2001/file/801272ee79cfde7fa5960571fee36b9b-Paper.pdf
- Noh et al [2014] Noh Y, Jeon S, Lee JM, Seo SW, Kim GH, Cho H, Ye BS, Yoon CW, Kim HJ, Chin J, Park KH, Heilman KM, Na DL (2014) Anatomical heterogeneity of Alzheimer disease: Based on cortical thickness on MRIs. Neurology 83(21):1936–1944, DOI 10.1212/WNL.0000000000001003, URL http://www.neurology.org/cgi/doi/10.1212/WNL.0000000000001003
- Ostrom et al [2019] Ostrom QT, Adel Fahmideh M, Cote DJ, Muskens IS, Schraw JM, Scheurer ME, Bondy ML (2019) Risk factors for childhood and adult primary brain tumors. Neuro-Oncology 21(11):1357–1375, DOI 10.1093/neuonc/noz123, URL https://doi.org/10.1093/neuonc/noz123
- Ota et al [2016] Ota K, Oishi N, Ito K, Fukuyama H (2016) Prediction of alzheimer’s disease in amnestic mild cognitive impairment subtypes: Stratification based on imaging biomarkers. Journal of Alzheimer’s disease : JAD 52, DOI 10.3233/JAD-160145
- Pan et al [2020] Pan Y, Pu W, Chen X, Huang X, Cai Y, Tao H, Xue Z, Mackinley M, Limongi R, Liu Z, Palaniyappan L (2020) Morphological Profiling of Schizophrenia: Cluster Analysis of MRI-Based Cortical Thickness Data. Schizophrenia Bulletin 46(3):623–632, DOI 10.1093/schbul/sbz112
- Pantelis et al [2003] Pantelis C, Velakoulis D, McGorry PD, Wood SJ, Suckling J, Phillips LJ, Yung AR, Bullmore ET, Brewer W, Soulsby B, Desmond P, McGuire PK (2003) Neuroanatomical abnormalities before and after onset of psychosis: a cross-sectional and longitudinal MRI comparison. Lancet (London, England) 361(9354):281–288, DOI 10.1016/S0140-6736(03)12323-9
- Park et al [2017] Park JY, Na HK, Kim S, Kim H, Seo S, Na D, Han C, Seong JK (2017) Robust identification of alzheimer’s disease subtypes based on cortical atrophy patterns. Scientific Reports 7:43270, DOI 10.1038/srep43270
- Petersen et al [2010] Petersen RC, Aisen PS, Beckett LA, Donohue MC, Gamst AC, Harvey DJ, Jack CR, Jagust WJ, Shaw LM, Toga AW, Trojanowski JQ, Weiner MW (2010) Alzheimer’s Disease Neuroimaging Initiative (ADNI): Clinical characterization. Neurology 74(3):201–209, DOI 10.1212/WNL.0b013e3181cb3e25, URL http://www.neurology.org/cgi/doi/10.1212/WNL.0b013e3181cb3e25
- Planchuelo-Gomez et al [2020] Planchuelo-Gomez A, Lubeiro A, Nunez-Novo P, Gomez-Pilar J, de Luis-García R, Del Valle P, Martin-Santiago O, Pérez-Escudero A, Molina V (2020) Identificacion of MRI-based psychosis subtypes: Replication and refinement. Progress in Neuro-Psychopharmacology & Biological Psychiatry 100:109907, DOI 10.1016/j.pnpbp.2020.109907
- Poulakis et al [2018] Poulakis K, Pereira JB, Mecocci P, Vellas B, Tsolaki M, Kłoszewska I, Soininen H, Lovestone S, Simmons A, Wahlund LO, Westman E (2018) Heterogeneous patterns of brain atrophy in Alzheimer’s disease. Neurobiology of Aging 65:98–108, DOI 10.1016/j.neurobiolaging.2018.01.009, URL https://linkinghub.elsevier.com/retrieve/pii/S0197458018300174
- Poulakis et al [2020] Poulakis K, Ferreira D, Pereira JB, Smedby O, Vemuri P, Westman E (2020) Fully bayesian longitudinal unsupervised learning for the assessment and visualization of AD heterogeneity and progression. Aging p 26
- Price et al [2017a] Price RB, Gates K, Kraynak TE, Thase ME, Siegle GJ (2017a) Data-Driven Subgroups in Depression Derived from Directed Functional Connectivity Paths at Rest. Neuropsychopharmacology: Official Publication of the American College of Neuropsychopharmacology 42(13):2623–2632, DOI 10.1038/npp.2017.97
- Price et al [2017b] Price RB, Lane S, Gates K, Kraynak TE, Horner MS, Thase ME, Siegle GJ (2017b) Parsing Heterogeneity in the Brain Connectivity of Depressed and Healthy Adults During Positive Mood. Biological Psychiatry 81(4):347–357, DOI 10.1016/j.biopsych.2016.06.023
- Qazi et al [2017] Qazi MA, Vora P, Venugopal C, Sidhu SS, Moffat J, Swanton C, Singh SK (2017) Intratumoral heterogeneity: pathways to treatment resistance and relapse in human glioblastoma. Annals of Oncology 28(7):1448–1456, DOI 10.1093/annonc/mdx169, URL https://www.sciencedirect.com/science/article/pii/S0923753419322665
- Rajkowska et al [1999] Rajkowska G, Miguel-Hidalgo JJ, Wei J, Dilley G, Pittman SD, Meltzer HY, Overholser JC, Roth BL, Stockmeier CA (1999) Morphometric evidence for neuronal and glial prefrontal cell pathology in major depression. Biological Psychiatry 45(9):1085–1098, DOI 10.1016/s0006-3223(99)00041-4
- Rathore et al [2018] Rathore S, Akbari H, Rozycki M, Abdullah KG, Nasrallah MP, Binder ZA, Davuluri RV, Lustig RA, Dahmane N, Bilello M, O’Rourke DM, Davatzikos C (2018) Radiomic MRI signature reveals three distinct subtypes of glioblastoma with different clinical and molecular characteristics, offering prognostic value beyond IDH1. Scientific Reports 8(1):5087, DOI 10.1038/s41598-018-22739-2, URL https://www.nature.com/articles/s41598-018-22739-2, bandiera_abtest: a Cc_license_type: cc_by Cg_type: Nature Research Journals Number: 1 Primary_atype: Research Publisher: Nature Publishing Group Subject_term: Cancer imaging;CNS cancer;Tumour heterogeneity Subject_term_id: cancer-imaging;cns-cancer;tumour-heterogeneity
- Sotiras et al [2015] Sotiras A, Resnick SM, Davatzikos C (2015) Finding imaging patterns of structural covariance via Non-Negative Matrix Factorization. NeuroImage 108:1–16, DOI 10.1016/j.neuroimage.2014.11.045, URL https://linkinghub.elsevier.com/retrieve/pii/S1053811914009756
- Sugihara et al [2016] Sugihara G, Oishi N, Son S, Kubota M, Takahashi H, Murai T (2016) Distinct Patterns of Cerebral Cortical Thinning in Schizophrenia: A Neuroimaging Data-Driven Approach. Schizophrenia Bulletin p sbw176, DOI 10.1093/schbul/sbw176, URL https://academic.oup.com/schizophreniabulletin/article-lookup/doi/10.1093/schbul/sbw176
- Tang et al [2020] Tang S, Sun N, Floris DL, Zhang X, Di Martino A, Yeo BTT (2020) Reconciling Dimensional and Categorical Models of Autism Heterogeneity: A Brain Connectomics and Behavioral Study. Biological Psychiatry 87(12):1071–1082, DOI 10.1016/j.biopsych.2019.11.009
- Tokuda et al [2018] Tokuda T, Yoshimoto J, Shimizu Y, Okada G, Takamura M, Okamoto Y, Yamawaki S, Doya K (2018) Identification of depression subtypes and relevant brain regions using a data-driven approach. Scientific Reports 8, DOI 10.1038/s41598-018-32521-z
- Varol et al [2017] Varol E, Sotiras A, Davatzikos C (2017) HYDRA: Revealing heterogeneity of imaging and genetic patterns through a multiple max-margin discriminative analysis framework. NeuroImage 145:346–364, DOI 10.1016/j.neuroimage.2016.02.041, URL https://linkinghub.elsevier.com/retrieve/pii/S1053811916001506
- Vogel et al [2021] Vogel JW, Young AL, Oxtoby NP, Smith R, Ossenkoppele R, Strandberg OT, La Joie R, Aksman LM, Grothe MJ, Iturria-Medina Y, Pontecorvo MJ, Devous MD, Rabinovici GD, Alexander DC, Lyoo CH, Evans AC, Hansson O (2021) Four distinct trajectories of tau deposition identified in Alzheimer’s disease. Nature Medicine 27(5):871–881, DOI 10.1038/s41591-021-01309-6, URL https://www.nature.com/articles/s41591-021-01309-6, bandiera_abtest: a Cg_type: Nature Research Journals Number: 5 Primary_atype: Research Publisher: Nature Publishing Group Subject_term: Alzheimer’s disease;Neurodegenerative diseases;Prognostic markers Subject_term_id: alzheimers-disease;neurodegenerative-diseases;prognostic-markers
- Wen et al [2021] Wen J, Varol E, Sotiras A, Yang Z, Chand GB, Erus G, Shou H, Abdulkadir A, Hwang G, Dwyer DB, Pigoni A, Dazzan P, Kahn RS, Schnack HG, Zanetti MV, Meisenzahl E, Busatto GF, Crespo-Facorro B, Rafael RG, Pantelis C, Wood SJ, Zhuo C, Shinohara RT, Fan Y, Gur RC, Gur RE, Satterthwaite TD, Koutsouleris N, Wolf DH, Davatzikos C, Alzheimer’s Disease Neuroimaging Initiative (2021) Multi-scale semi-supervised clustering of brain images: Deriving disease subtypes. Medical Image Analysis 75:102304, DOI 10.1016/j.media.2021.102304
- Wen et al [2022] Wen J, Fu CHY, Tosun D, Veturi Y, Yang Z, Abdulkadir A, Mamourian E, Srinivasan D, Ioanna S, Ashish S, Bao J, Erus G, Shou H, Habes M, Doshi J, Varol E, Mackin SR, Sotiras A, Fan Y, Saykin AJ, Sheline YI, Shen L, Ritchie MD, Wolk DA, Albert M, Resnick SM, Davatzikos C (2022) Characterizing heterogeneity in neuroimaging, cognition, clinical symptomatology, and genetics among patients with late-life depression. JAMA Psychiatry URL 10.1001/jamapsychiatry.2022.0020
- Whitwell et al [2007] Whitwell JL, Petersen RC, Negash S, Weigand SD, Kantarci K, Ivnik RJ, Knopman DS, Boeve BF, Smith GE, Jack CR (2007) Patterns of Atrophy differ among Specific Subtypes of Mild Cognitive Impairment. Archives of neurology 64(8):1130–1138, DOI 10.1001/archneur.64.8.1130, URL https://www.ncbi.nlm.nih.gov/pmc/articles/PMC2735186/
- Wolfers et al [2019] Wolfers T, Floris DL, Dinga R, van Rooij D, Isakoglou C, Kia SM, Zabihi M, Llera A, Chowdanayaka R, Kumar VJ, Peng H, Laidi C, Batalle D, Dimitrova R, Charman T, Loth E, Lai MC, Jones E, Baumeister S, Moessnang C, Banaschewski T, Ecker C, Dumas G, O’Muircheartaigh J, Murphy D, Buitelaar JK, Marquand AF, Beckmann CF (2019) From pattern classification to stratification: towards conceptualizing the heterogeneity of Autism Spectrum Disorder. Neuroscience and Biobehavioral Reviews 104:240–254, DOI 10.1016/j.neubiorev.2019.07.010
- World Health Organization [1992] World Health Organization (1992) The ICD-10 classification of mental and behavioural disorders : clinical descriptions and diagnostic guidelines. Tech. rep., World Health Organization, URL https://apps.who.int/iris/handle/10665/37958, iSBN: 9787117019576 number-of-pages: 362
- Yan et al [2021] Yan W, Zhao M, Fu Z, Pearlson GD, Sui J, Calhoun VD (2021) Mapping relationships among schizophrenia, bipolar and schizoaffective disorders: A deep classification and clustering framework using fMRI time series. Schizophrenia Research pp S0920–9964(21)00077–3, DOI 10.1016/j.schres.2021.02.007
- Yang et al [2014] Yang Z, Xu Y, Xu T, Hoy CW, Handwerker DA, Chen G, Northoff G, Zuo XN, Bandettini PA (2014) Brain network informed subject community detection in early-onset schizophrenia. Scientific Reports 4:5549, DOI 10.1038/srep05549
- Yang et al [2021] Yang Z, Nasrallah IM, Shou H, Wen J, Doshi J, Habes M, Erus G, Abdulkadir A, Resnick SM, Albert MS, Maruff P, Fripp J, Morris JC, Wolk DA, Davatzikos C, iSTAGING Consortium, Baltimore Longitudinal Study of Aging (BLSA), Alzheimer’s Disease Neuroimaging Initiative (ADNI) (2021) A deep learning framework identifies dimensional representations of Alzheimer’s Disease from brain structure. Nature Communications 12(1):7065, DOI 10.1038/s41467-021-26703-z, URL https://www.nature.com/articles/s41467-021-26703-z
- Yang Z [2022] Yang Z DC Wen P (2022) Surreal-gan:semi-supervised representation learning via gan for uncovering heterogeneous disease-related imaging patterns. ICLR 2022 DOI https://openreview.net/forum?id=nf3A0WZsXS5
- Young et al [2018] Young A, Marinescu R, Oxtoby N, Bocchetta M, Yong K, Firth N, Cash D, Thomas D, Moore K, Cardoso MJ, Swieten J, Borroni B, Galimberti D, Masellis M, Tartaglia M, Rowe J, Graff C, Tagliavini F, Frisoni G, Alexander D (2018) Uncovering the heterogeneity and temporal complexity of neurodegenerative diseases with subtype and stage inference. Nature Communications 9, DOI 10.1038/s41467-018-05892-0
- Young et al [2014] Young AL, Oxtoby NP, Daga P, Cash DM, Fox NC, Ourselin S, Schott JM, Alexander DC, Alzheimer’s Disease Neuroimaging Initiative (2014) A data-driven model of biomarker changes in sporadic Alzheimer’s disease. Brain: A Journal of Neurology 137(Pt 9):2564–2577, DOI 10.1093/brain/awu176
- Zabihi et al [2020] Zabihi M, Floris DL, Kia SM, Wolfers T, Tillmann J, Arenas AL, Moessnang C, Banaschewski T, Holt R, Baron-Cohen S, Loth E, Charman T, Bourgeron T, Murphy D, Ecker C, Buitelaar JK, Beckmann CF, Marquand A, EU-AIMS LEAP Group (2020) Fractionating autism based on neuroanatomical normative modeling. Translational Psychiatry 10(1):384, DOI 10.1038/s41398-020-01057-0
- Zhang et al [2016] Zhang X, Mormino E, Sun N, Sperling R, Sabuncu M, Yeo BT (2016) Bayesian model reveals latent atrophy factors with dissociable cognitive trajectories in alzheimer’s disease. Proceedings of the National Academy of Sciences 113:E6535–E6544, DOI 10.1073/pnas.1611073113