Guidelines and Evaluation of Clinical Explainable AI in
Medical Image Analysis
2Department of Electrical and Computer Engineering, The University of British Columbia
3Division of Neurosurgery, The University of British Columbia
)
Abstract
Explainable artificial intelligence (XAI) is essential for enabling clinical users to get informed decision support from AI and comply with evidence-based medical practice. Applying XAI in clinical settings requires proper evaluation criteria to ensure the explanation technique is both technically sound and clinically useful, but specific support is lacking to achieve this goal. To bridge the research gap, we propose the Clinical XAI Guidelines that consist of five criteria a clinical XAI needs to be optimized for. The guidelines recommend choosing an explanation form based on Guideline 1 (G1) Understandability and G2 Clinical relevance. For the chosen explanation form, its specific XAI technique should be optimized for G3 Truthfulness, G4 Informative plausibility, and G5 Computational efficiency. Following the guidelines, we conducted a systematic evaluation on a novel problem of multi-modal medical image explanation with two clinical tasks, and proposed new evaluation metrics accordingly. Sixteen commonly-used heatmap XAI techniques were evaluated and found to be insufficient for clinical use due to their failure in G3 and G4. Our evaluation demonstrated the use of Clinical XAI Guidelines to support the design and evaluation of clinically viable XAI.
©2022. This manuscript version is made available under the CC-BY-NC-ND 4.0 license https://creativecommons.org/licenses/by-nc-nd/4.0/
1 Introduction
Suppose an artificial intelligence (AI) developer Alex is developing a clinical AI system, and she wants to select an explainable AI (XAI) technique to make the AI model interpretable and transparent to clinical users. As there are numerous AI explainability techniques available, Alex may ask: How can I choose an AI explainability technique that is optimal for my target clinical task? She may look up literature on XAI evaluation [Sokol and Flach, 2020, Mohseni et al., 2021, Vilone and Longo, 2021, Došilović et al., 2018, Gilpin et al., 2018] hoping it will guide her selection on XAI techniques. The literature suggests various selection criteria and computational- or human-level evaluation methods. But since Alex is building an AI system which will assist doctors in clinically important decisions, she may ask, Is it clinically viable to use these evaluation metrics? Will they help to meet doctors’ clinical requirements for AI explanation? How to prioritize multiple evaluation objectives for clinical XAI systems?
Alex’s questions are prevalent when applying or proposing explainable AI techniques for clinical use. As a fast-advancing technology, AI has transformative potential in many medical fields [Zhang et al., 2019, Fujisawa et al., 2018, Mohan et al., 2020]. Nonetheless, there are outstanding barriers to the widespread translation of AI from bench to bedside [He et al., 2019], such as data collection and harmonization [Nan et al., 2022], data privacy [Topaloglu et al., 2021], bias and fairness in data and model [Chen et al., 2021, Rajpurkar et al., 2022], domain adaptation and generalization [Futoma et al., 2020], and model explainability [Jin et al., 2020, Rajpurkar et al., 2022, Kelly et al., 2019]. In this work, we focus on the problem of AI model explainability, interpretability, or transparency. The model explainability issue is caused by the black-box nature of the state-of-the-art AI technologies, i.e., deep neural networks (DNN): the decision process of AI models is not completely and intuitively comprehensible even to its human creators, due to its millions of parameters, complex feature representations in high-dimensional space, multiple layers of decision processing, and non-linear mappings from input space to output prediction.
AI developers, like Alex, resort to XAI techniques to explain AI decisions in human-understandable forms [Doshi-Velez and Kim, 2017], and enable clinical users to make informed decisions with AI assistance that comply with evidence-based medical practice***“Evidence-based medicine is the conscientious, explicit, judicious, and reasonable use of modern, best evidence in making decisions about the care of individual patients.” [Masic et al., 2008] [Sackett et al., 1996]. The notion of XAI and its corresponding techniques were originally proposed in the machine learning community [Barredo Arrieta et al., 2020, Guidotti et al., 2018, Zhang and Zhu, 2018], and were then applied and developed in the medical image analysis (MIA) community [Yang et al., 2022, Singh et al., 2020b], for example in brain [Pereira et al., 2018], retinal [De Fauw et al., 2018], cardiac [Bello et al., 2019], chest [Ye et al., 2022], and skin imaging tasks [Kawahara et al., 2019]. They utilize different explanation forms and algorithms that aim to generate clinical end-user-friendly explanations [Jin et al., 2021a], such as explaining using features (heatmap [Bien et al., 2018], concept [Kim et al., 2018]), examples (similar [Cai et al., 2019b], typical [Chen et al., 2019], and counterfactual examples [Bigolin Lanfredi et al., 2019]), and rules (decision tree [Wu et al., 2019]). Indeed, research has shown that explanations have the potential to help clinical users to verify AI’s decisions [Ribeiro et al., 2016], resolve disagreements with AI during decision discrepancy [Cai et al., 2019c], calibrate their trust in AI assistance [Bussone et al., 2015, Zhang et al., 2020], identify potential biases [Caruana et al., 2015], facilitate biomedical discoveries [Woo et al., 2017], meet ethical and legal requirements [Amann et al., 2020, Lagioia, 2020], and ultimately facilitate doctor-AI communication and collaboration to leverage the strengths of both [Wang et al., 2021, Topol, 2019, Carter and Nielsen, 2017].
Applying XAI in clinical settings requires proper evaluation to ensure the explanation technique is both technically sound and clinically useful. Although existing works on XAI evaluation proposed many real-world evaluation objectives and metrics [Sokol and Flach, 2020, Mohseni et al., 2021, Vilone and Longo, 2021, Došilović et al., 2018, Jacovi and Goldberg, 2020, Alvarez-Melis and Jaakkola, 2018, Hase and Bansal, 2020, Doshi-Velez and Kim, 2017, Gilpin et al., 2018] (summarized in Supplementary Material S2 Table 1), there is not a canonical criterion on the goodness of explanation, and it is unknown which evaluation objectives are suitable for clinical applications. For the very limited emerging XAI evaluation works on medical image tasks, such as on retinal [Singh et al., 2020a], endoscopic [de Souza et al., 2021], and chest X-Ray [Saporta et al., 2021, Arun et al., 2021] imaging tasks, the evaluation mainly focused on one criterion, which is how well the explanation agrees with clinical prior knowledge, without justification for the selection of such criterion and its clinical applicability. This evaluation criterion may be confounded by factors outside XAI methods themselves, such as model training and spurious patterns in the data, as detailed in §2.2. Furthermore, there are no clear guidelines on which evaluation objectives should be applied and prioritized to correspond to clinical requirements for AI explanation.
To answer Alex’s questions and provide concrete support for the design and evaluation of clinical XAI, we propose the Clinical XAI Guidelines, which were developed with dual clinical and technical perspectives. The guidelines consist of five evaluation criteria: The form of explanation is selected based on Guideline 1 (G1) Understandability and G2 Clinical relevance. The specific explanation technique for the selected form is chosen based on G3 Truthfulness, G4 Informative plausibility, and operational considerations on G5 Computational efficiency. Following the guidelines, we conducted a systematic evaluation of 16 commonly-used feature attribution map (heatmap) techniques on two multi-modal medical image tasks. We also formulated a novel and clinically pervasive problem of multi-modal medical image explanation, which is a generalized form of single-modal medical image explanation. We proposed the XAI evaluation metrics for this novel problem accordingly. The evaluation showed existing heatmap methods met G1, and partially met G2. But they did not meet G3 and G4, which suggests they are inadequate for clinical use.
Our key contributions are:
-
1.
We propose the Clinical XAI Guidelines grounded in both clinical and technical perspectives. The guidelines support the selection and design of clinically viable XAI techniques for medical imaging tasks.
-
2.
We conduct a systematic evaluation of multiple feature attribution map XAI algorithms on two medical imaging tasks to give a wholistic evaluation of their adherence to the guidelines.
-
3.
Departing from the de-facto single modality explanation, we propose the clinically important but technically ignored problem of multi-modal medical image explanation and propose a novel metric: modality-specific feature importance (MSFI) to quantify and automate physicians’ assessment of explanation plausibility.
Roadmap
The manuscript is organized as follows: we first present the clinical XAI guidelines in §2, with its key points highlighted in Table 1 and Fig. 1. We then present the systematic evaluation of 16 existing heatmap explanation methods based on the guidelines, with evaluation setup (§3), evaluation methods (§4), results (§5), and discussions (§6).
2 Clinical Explainable AI Guidelines
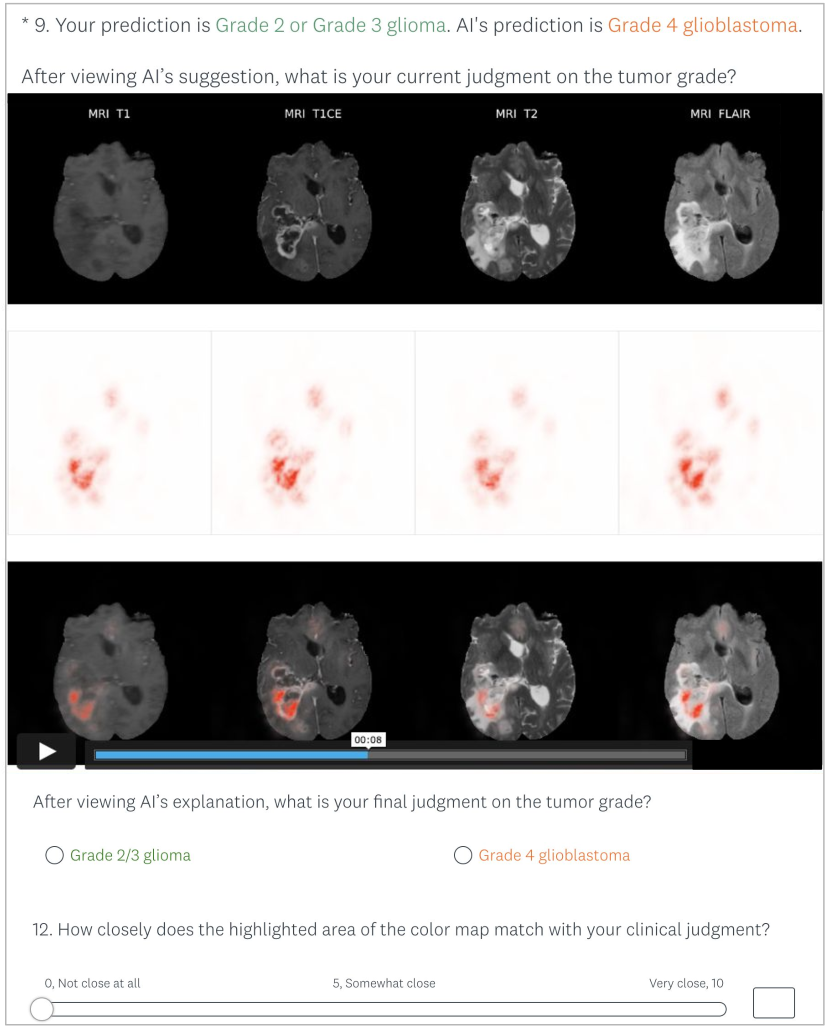
By leveraging collective expertise in AI, clinical medicine, and human factor analysis, we developed the Clinical XAI Guidelines based on a thorough physician user study, our pilot XAI evaluation experiments [Jin et al., 2022, 2021b], and literature review (Supplementary Material S2 Table 1). The physician user study was conducted with 30 neurosurgeons on a glioma grading XAI prototype (Fig 2). We collected physicians’ quantitative ratings on the heatmap explanation, and qualitative comments on the XAI system from the interview sessions and open-ended questionnaire. The qualitative data were used as the guidelines support from clinical aspect. The detailed user study findings and method are in Supplementary Material S1, and its related supporting sections were referred to in the paper starting with ‘U’.
Next, we present the Clinical XAI Guidelines, which is a checklist of five evaluation objectives to optimize a clinical XAI technique. They are categorized into three considerations: clinical usability, evaluation, and operation. For each objective in the guidelines, we list its key references from our user study or literature. The methods of assessment are also described to help identify if the objective is met. The guidelines and their key points are summarized in Table 1. The full version of the guidelines is in the Appendix.
| Consideration | Clinical XAI Guidelines | Ways of Assessment | Key References |
| Clinical Usability | G1: Understandability | ||
| Explanations should be easily understandable by clinical users without requiring technical knowledge. | Sketch explanation forms and show them to clinical users. | [Jin et al., 2021a], [Sokol and Flach, 2020]; U3.3. Making AI transparent by providing information on performance, training dataset, and decision confidence. | |
| G2: Clinical relevance | |||
| Explanation should be relevant to physicians’ clinical decision-making pattern, and can support their clinical reasoning process. | Talk to or sketch prototypes with clinical users, to inspect if the explanation corresponds to their clinical reasoning process. | U2.2. Resolving disagreement; U3. Clinical requirements of explainable AI. | |
| Evaluation | G3: Truthfulness | ||
| Explanations should truthfully reflect the AI model decision process. This is the prerequisite for G4. | Cumulative feature removal/addition test [Yin et al., 2021, Yeh et al., 2019, Hooker et al., 2019, Samek et al., 2017, Lundberg et al., 2020, Alvarez-Melis and Jaakkola, 2018]; Synthetic dataset with known discriminative features as the ground truth [Doshi-Velez and Kim, 2017, Kim et al., 2018, Gilpin et al., 2018]. | [Jacovi and Goldberg, 2020, Sokol and Flach, 2020, Critch and Krueger, 2020]; U2.3. Verifying AI decision, and calibrating trust. | |
| G4: Informative plausibility | |||
| Users’ judgment on explanation plausibility may inform users about AI decision quality, including potential flaws or biases. | Statistical test on the correlation between AI decision quality measure and explanation plausibility measure [Adebayo et al., 2022, Saporta et al., 2021]. | [Jacovi and Goldberg, 2020], [Doshi-Velez and Kim, 2018]; U2. Clinical utility of explainable AI; U5. Clinical assessment of explainable AI. | |
| Operation | G5: Computational efficiency | ||
| The speed to generate an explanation should be within clinical users’ tolerable waiting time on the given task. | Understand how time sensitive the clinical task is, and record the speed and computational resources needed to generate an explanation. | [Sokol and Flach, 2020]; U1.2.1. Decision support for time-sensitive cases, and hard cases. |
G - Guidelines, U - Physician user study findings (in Supplementary Material S1)
2.1 Clinical usability considerations
Guideline 1: Understandability.
The format and context of an explanation should be easily understandable by its clinical users. Users do not need to have technical knowledge in machine learning, AI, or programming to interpret the explanation.
Guideline 2: Clinical relevance.
The way physicians use explanations is to inspect the AI-based evidence provided by the explanation, and incorporate such evidence in their clinical reasoning process for downstream tasks, such as assessing the validity of AI decision, making a final decision on the case, improving their problem-solving skills, or making scientific discoveries (U2. Clinical utility of explainable AI; U1. Clinical utility of AI). To make XAI clinically useful, the explanation information should be relevant to physicians’ clinical decision-making pattern, and can support their clinical reasoning process.
For diagnostic/predictive tasks on medical images, a physician’s image interpretation process includes two general steps: 1) feature extraction: physicians first perform pattern recognition to localize key features and identify pathology of these features; 2) reasoning on the extracted features: physicians perform medical reasoning and construct diagnostic hypotheses (differential diagnosis) based on the image feature evidence. A clinically relevant explanation should provide information corresponding to the above process, so that physicians can incorporate the explanation information into their medical image interpretation process (U3. Clinical requirements of explainable AI).
2.2 Evaluation considerations
Guideline 3: Truthfulness.
An explanation should truthfully reflect the model decision process. This is the fundamental requirement for a clinically oriented explanation, and an explanation method should fulfill the truthfulness requirement first prior to G4: Informative plausibility.
Counterexample:
One of the main clinical utilities of explanation is that clinical users intuitively assess the plausibility of explanations (G4) to decide whether to take or reject the AI suggestion, and calibrate their trust in AI’s current prediction on the case, or the AI model in general accordingly (U2.3). Users do so with an implicit assumption that explanations are the true representation of the model decision process. Violating truthfulness can lead to two significant consequences during physicians’ use of explanation:
1. Clinical users may mistakenly reject AI’s correct suggestion merely for the poor performance of the XAI method, which shows an unreasonable explanation.
2. If an XAI method is proposed or selected based on explanation plausibility objective only, rather than help clinical users to verify the decision quality, the explanation can be optimized to deceive clinical users with its seemingly plausible explanation, despite the wrong prediction from AI [Critch and Krueger, 2020].
Assessment method:
The most common way to assess explanation truthfulness for feature attribution XAI methods in the literature is to gradually add or remove features from the most to the least important ones according to an explanation, and measure the model performance change [Yin et al., 2021, Yeh et al., 2019, Hooker et al., 2019, Samek et al., 2017, Lundberg et al., 2020, Alvarez-Melis and Jaakkola, 2018, DeYoung et al., 2020]. Another way is to construct synthetic evaluation datasets in which the ground-truth knowledge on the model decision process from input features to prediction is known and controlled [Doshi-Velez and Kim, 2017, Kim et al., 2018, Gilpin et al., 2018].
Guideline 4: Informative plausibility.
The ultimate use of an explanation is to be interpreted and assessed by clinical users. Physicians intuitively use the assessment of explanation plausibility or reasonableness (i.e.: how reasonable the explanation is based on its agreement with human prior knowledge on the task) as a way to evaluate AI decision quality. This then allows multiple clinical utilities with XAI, including verifying AI’s decisions (U2.3), calibrating trust in AI (U2.3), ensuring the safe use of AI, resolving disagreement with AI (U2.2), identifying potential biases, and making medical discoveries (U2.4). Informative plausibility assesses whether an XAI method can achieve its utility in helping users identify potential AI decision flaws and/or biases, i.e.: a plausible explanation for a right decision, and an implausible explanation for a wrong decision of AI. G3 Truthfulness is the gatekeeper of G4 Informative plausibility to guarantee that the explanation truthfully represents the AI decision process.
Assessment method:
To test whether explanation plausibility is informative to help users identify AI decision errors and biases, AI designers can assess the correlation between AI decision quality measures (such as model performance, calibrated prediction uncertainty, prediction correctness, and quantification of biased patterns) and plausibility measures [Adebayo et al., 2022, Saporta et al., 2021].
Since human assessment of explanation plausibility is usually subjective and susceptible to biases (U5.2. Bias and limitation of physicians’ quantitative rating), AI designers may consider quantifying the plausibility measure by abstracting the human assessment criteria into computational metrics for a given task. The quantification of human assessment is not meant to directly select or optimize XAI methods for clinical use. Rather, XAI methods should be optimized for their truthfulness measures (G3). Quantifying plausibility is a means to validate the explanation’s informativeness, i.e.: the effectiveness of XAI methods in their subsequent clinical utility to reveal AI decision flaws and/or biases, but not an XAI evaluation end goal in itself. Quantifying plausibility can make such an informativeness validation process automatic, reproducible, standardizable, and computationally efficient. Similarly, the human annotation of important features according to physicians’ prior knowledge, which is used to quantify plausibility, cannot be regarded as the “ground truth” of explanation, because explanations (given that they fulfill G3 Truthfulness) are still acceptable even if they are not aligned with human prior knowledge, but reveal the model decision quality or help humans identify new patterns and make biomedical discoveries.
2.3 Operational consideration
Guideline 5: Computational efficiency
Since many AI-assisted clinical tasks are time-sensitive decisions (U1.2.1. Decision support for time-sensitive cases, and hard cases), the selection or proposal of clinical XAI techniques needs to consider the computational time and resources. The wait time for an explanation should not be a bottleneck for the clinical task workflow.
3 Evaluation problem setup
In the previous section, we presented the Clinical XAI Guidelines. Next, we apply the guidelines to a specific problem on multi-modal medical image explanation. Multi-modal medical images, such as multi-parametric MRI, have indispensable diagnostic value in clinical settings. Nevertheless, their related explanation problem has not yet been explored in the technical community. We conduct a systematic evaluation on 16 commonly-used XAI methods to inspect whether their explanations on multi-modal medical images can fulfill the five objectives outlined in the Clinical XAI Guidelines and can be applied clinically.
3.1 Multi-modal medical imaging: clinical interpretation, learning, and explanation
Our evaluation focuses on the novel problem of multi-modal medical image explanation. Multi-modal medical image explanation can be regarded as a generalized form of single-modal medical image explanation. We present the clinical image interpretation process of multi-modal image, the clinical requirements for multi-modal image explanation, and different model learning paradigms on multi-modal medical image data.
3.1.1 Multi-modal medical images and their clinical interpretation
Multi-modal medical images consist of multiple image modalities or channels, where each modality captures a unique signal of the same underlying cells, tissues, lesions, or organs [Martí-Bonmatí et al., 2010]. Multi-modal images widely exist in the biomedical domain. For example, different pulse sequences of magnetic resonance imaging (MRI) technique — T1 weighted, T2 weighted, or fluid-attenuated inversion recovery (FLAIR) modalities; dual-modality imaging of positron emission tomography-computed tomography (PET-CT) [Beyer et al., 2002]; CT images viewed at different levels and windows to observe different anatomical structures such as bones, lungs, and other soft tissues [Harris et al., 1993]; multi-modal endoscopy imaging [Ray, 2017]; photographic, dermoscopic, and hyper-spectral images of a skin lesion [Kawahara et al., 2019, Zherebtsov et al., 2019]; multiple stained microscopic or histopathological images [Long et al., 2020, Song et al., 2013].
To interpret multi-modal images, doctors compare and combine modality-specific information to make diagnoses and differential diagnoses. For instance, in a radiology report on MRI, radiologists usually observe and describe anatomical structures in T1 modality, and pathological changes in T2 modality [Cochard and Netter, 2012, Bitar et al., 2006]; doctors can infer the composition of a lesion (such as fat, hemorrhage, protein, fluid) by combining its signals from different MRI modalities [Patel et al., 2016]. In addition, some imaging modalities are particularly crucial for the diagnosis and management of certain diseases, such as a contrast-enhanced modality of CT or MRI for a suspected tumor case, and diffusion-weighted imaging (DWI) modality MRI for a suspected stroke case [Lansberg et al., 2000].
3.1.2 Clinical requirements for multi-modal medical image explanation
We summarize our findings on the clinical requirements for multi-modal medical image explanation based on our user study with neurosurgeons (U4 in Supplementary Material S1) on a glioma grading task with multi-modal brain MRI.
To assess the plausibility of multi-modal explanation, physicians require the explanation to 1) prioritize the important image modality for the model’s decision, and such prioritization may or may not necessarily need to be in concordance with physicians’ prior knowledge on modality prioritization; and 2) capture the modality-specific features. Such features may or may not be completely consistent with doctors’ prior knowledge, but should at least be a subset and not deviate too much from clinical knowledge.
3.1.3 Multi-modality learning
There are three major paradigms to build convolutional neural network (CNN) models that learn from multi-modal medical images by fusing multi-modal features at the input-level, feature-level, or decision-level [Xu, 2019]. Our evaluation covered two fusion settings at the input-level (the brain tumor grading task) and feature-level (the knee lesion identification task). For multi-modal fusion at the input-level, the multi-modal images are stacked as input channels to feed a CNN. The modality-specific information is fused by summing up the weighted modality values in the first convolutional layer. For multi-modal image fusion at the feature-level, each imaging modality is fed to its CNN branch individually to extract features first, and the image features are aggregated at a deeper layer.
3.2 Clinical task, data, and model
We include two clinical tasks in our evaluation on multi-modal medical image explanation: glioma grading on brain MRI, and knee lesion identification on knee MRI. Next, we describe the clinical task, medical imaging dataset, and the training of CNN models prepared for the evaluation.
3.2.1 Glioma grading task
Clinical task
As a type of primary brain tumors, gliomas are one of the most devastating cancers. Grading gliomas based on MRI provides physicians with indispensable information on a patient’s treatment plan and prognosis. We focus on the task to classify gliomas into lower-grade (LGG) or high-grade gliomas (HGG).
Data
We used the publicly available BraTS 2020 dataset [Bakas et al., 2017] and a BraTS-based synthetic dataset (described in §4.3.3). Both are multi-modal 3D (BraTS) or 2D (synthetic) MRIs that consist of four modalities of T1, T1C (contrast enhancement), T2, and FLAIR. The BraTS dataset contains physician-annotated glioma localization masks that were used in the plausibility quantification.
Model
For the BraTS dataset, we trained a VGG-like [Simonyan and Zisserman, 2015] 3D CNN with six convolutional layers. It receives multi-modal 3D MRIs of MRI modality, width, height, and depth respectively. We split the data into a training, validation, and test set with a 65%, 15%, 20% split ratio. We trained five models using the same train/validation dataset and training scheme with different random seeds for model parameter initialization. We used a weighted sampler to handle the imbalanced data. The models were trained with a learning rate , and batch size = 4. And training epoch was selected based on the accuracy on validation data. The average accuracy on the test set for the five models is 89.46 1.99%.
For the synthetic glioma dataset, we fine-tuned a pre-trained DenseNet121 model [Huang et al., 2017] that receives 2D multi-modal MRI input slices of that represents MRI modality, width, and height. We used the same training strategies as described above. The model achieves accuracy on the test set.
3.2.2 Knee lesion identification task
Clinical task
MRI is the workhorse in diagnosing knee disorders with high accuracies [Rosas and Smet, 2009]. We focus on the task of identifying meniscus tear vs. intact based on knee MRI.
Data
We used the publicly available knee MRI dataset MRNet [Bien et al., 2018]. It consists of three modalities showing the knee structure from the coronal, sagittal, and axial view. The coronal view can be T1 weighted, or T2 weighted with fat saturation. The sagittal view is proton density (PD) weighted, or T2 weighted with fat saturation. Finally, the axial view is PD weighted with fat saturation.
We use bounding boxes of the meniscus as the representation of human prior knowledge in the explanation plausibility quantification. They were annotated by the first author who holds an M.D. degree based on knee MRI lesion interpretation principles [Rosas and Smet, 2009]. The bounding boxes are not exact annotations that localize the specific tear lesion, but only outline the anatomical location of the lateral and medial meniscus as a whole. This is meant to be closer to the practical real-world XAI evaluation scenario where only the least amount of annotation effort and domain expertise are required.
Model
We used the same model architecture and training paradigm from the third place of MRNet challenge [Bien et al., 2018], which fused multi-modal information at the feature level. We trained five models by only varying their random seeds for parameter initialization. The model performance area under the curve (AUC) on the validation set is , which is equivalent to the reported ones in [Bien et al., 2018]. The test AUC, however, is lower: .
3.3 Post-hoc feature attribution explanation methods
We chose feature attribution explanation methods based on user study assessment on G1 Understandability (detailed in Section §4.1). For feature attribution map methods, we focus on methods that are post-hoc. This group of methods is a type of proxy models that probe the model parameters and/or input-output pairs of an already deployed or trained black-box model. In contrast, the ante-hoc heatmap methods – such as attention mechanism – are predictive models with explanations baked into the training process. We leave out the ante-hoc methods because such explanations are entangled in its specialized model architecture, which would introduce confounders in the evaluation. We include 16 post-hoc XAI algorithms in our evaluation, which belong to two categories:
-
•
Gradient-based: Gradient [Simonyan et al., 2014], Guided BackProp [Springenberg et al., 2015], GradCAM [Selvaraju et al., 2017], Guided GradCAM [Selvaraju et al., 2017], DeepLift [Shrikumar et al., 2017a], InputGradient [Shrikumar et al., 2017b], Integrated Gradients [Sundararajan et al., 2017], Gradient Shap [Lundberg and Lee, 2017], Deconvolution [Zeiler and Fergus, 2014], Smooth Grad [Smilkov et al., 2017]
- •
A detailed review of these algorithms and heatmap post-processing method are in Supplementary Material S2.
4 Evaluation method
We present the systematic evaluation to inspect whether the commonly-used heatmap methods can be applied clinically to explain model decisions on multi-modal medical images. The evaluation follows the clinical XAI guidelines (§2) to ensure the evaluation results can be an indicator for their suitableness in clinical settings.
4.1 Evaluating G1: Understandability
We applied the end-user XAI prototyping method [Jin et al., 2021a] and asked our clinical collaborator to comment and select understandable explanation forms. Based on the neurosurgeon’s feedback and XAI technique availability, we targeted the explanation form of feature attribution map (namely, heatmap).
4.2 Evaluating G2: Clinical relevance
To further identify the clinical relevance of heatmap explanation in the clinical usage scenario, we built an XAI prototype (Fig. 2) and conducted a user study with neurosurgeons. The user study method and findings are detailed in Supplementary Material S1.
4.3 Evaluating G3: Truthfulness
For the truthfulness assessment, we conducted cumulative feature removal and modality importance (MI) evaluation for the two clinical tasks, and proposed two novel metrics AUPC and MI correlation respectively. We also conducted a synthetic data experiment on the glioma grading task.
4.3.1 Cumulative feature removal
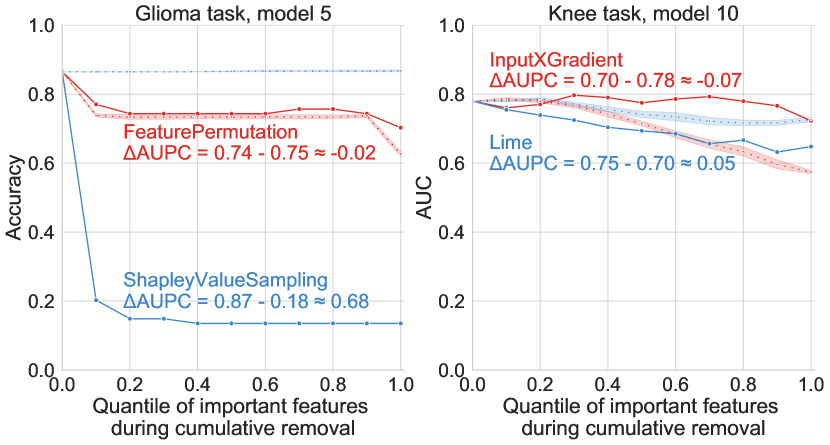
To test if the heatmap highlighted regions are true important features to the model’s decision, we cumulatively removed the input image features from the most to the least important ones according to the feature importance ranking quantile of an XAI algorithm . The removed features are replaced with a constant value (0 for glioma task, and modality mean for knee task). We then plotted a feature perturbation curve (PC) (Fig. 3) that shows the relationship of the cumulative feature removal to the model performance metric (accuracy for the glioma task, and AUC for the knee task). The area under PC () can be used to quantify the degree of performance deterioration during cumulative feature removal process: an XAI method that indicates a more accurate feature importance ranking will lead to a faster performance deterioration, thus has a smaller AUPC. We proposed a new metric AUPC (difference of the area under the feature perturbation curve) defined as: , where and are the area under the feature perturbation curve of an XAI method and its corresponding baseline . AUPC slightly modifies the above cumulative feature removal method in literature [Yin et al., 2021, Yeh et al., 2019, Hooker et al., 2019, Samek et al., 2017, Lundberg et al., 2020, Alvarez-Melis and Jaakkola, 2018] by introducing a random baseline for fair comparison among different XAI methods. For an XAI method , its corresponding random baseline is generated by a random permutation of . For different XAI methods , the absolute numbers of highlighted image pixels/voxels are different, thus the performance deterioration measure may be confounded by the number of highlighted image regions. AUPC overcomes this to quantify the relative performance deterioration by comparing AUPC() with the AUPC of its corresponding random baseline . An XAI algorithm with a larger AUPC indicates it can better identify important features for model prediction compared with its random baseline.
4.3.2 Modality importance
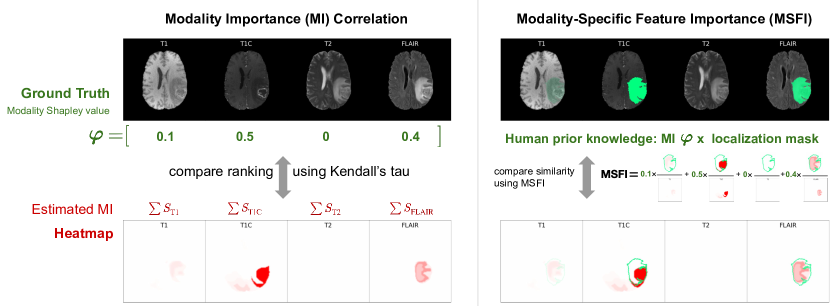
For multi-modal medical image explanation, we want to assess how truthfully a heatmap reflects the modality importance information used in the model decision process. This corresponds to the clinical requirements of modality prioritization (U4.2. The role and prioritization of multiple modalities). We first calculate the ground truth modality importance score using Shapley value method, then calculate the correlation between modality-wise sum of heatmap value and the ground truth as the modality importance correlation (MI correlation).
To determine the ground-truth modality importance, we use Shapley value from cooperative game theory [Shapley, 1951], due to its desirable properties such as efficiency, symmetry, linearity, and marginalism. In a set of modalities, Shapley value treats each modality as a player in a cooperative game play. It is the unique solution to fairly distribute the total contributions (in our case, the model performance) to each individual modality .
We define the modality Shapley value to be the ground truth modality importance score for a modality . It is calculated as:
| (1) |
where is the modality-specific performance metric (accuracy for the glioma task, and AUC for the knee task), and denotes all modality subsets not including modality . We constructed a modality subset by setting all values in a modality to 0 for modalities that were not included in the subset.
To measure the agreement of heatmaps’ modality importance value with the ground truth modality Shapley value, for each heatmap, we define the estimated MI as the modality-wise sum of all positive values in the heatmap. MI correlation measures the MI ranking agreement between the ground-truth and the estimated MI, calculated using Kendall’s Tau-b ranking correlation.
4.3.3 Synthetic data experiment
The idea of constructing synthetic data to validate the truthfulness of an XAI method is that, we have the full control of the ground truth features that the model learned for its prediction, therefore, the ground truth features are also the ground truth for model decision rationale we want the explanation to capture. We can then assess the agreement between the explanation and the ground truth features using the same plausibility measure as detailed in §4.4.1.
For multi-modal medical image tasks, according to the multi-modal medical image interpretation pattern identified in our user study (U4), we categorize the ground truth explanation information into: 1. the relative importance of each modality to the prediction (i.e.: modality importance in §4.3.2); and 2. localization of the modality-specific features. We constructed a synthetic multi-modal brain MRI dataset on the glioma grading task with the two ground truth information corresponding to the prediction label.
Specifically, to control the ground truth of feature localization, we use a GAN-based (generative adversarial network) tumor synthesis model developed by [Kim et al., 2021] to generate two types of tumors and their segmentation masks, mimicking lower- and high-grade gliomas by varying their shapes (round vs. irregular [ho Cho et al., 2018]).
To control the ground truth of modality importance, inspired by [Kim et al., 2018], we set tumor features on T1C modality to have 100% alignment with the ground-truth label, and on FLAIR to have a probability of 70% alignment, i.e., the tumor features on FLAIR correspond to the correct label with 70% probability. The remaining modalities have 0 modality importance value, as they are designed to not contain class discriminative features. The model may learn to pay attention to either the less noisy T1C modality, or the more noisy FLAIR modality, or both. To determine their relative importance as the ground truth modality importance, we test the well-trained model on two test sets:
TIC dataset: The dataset shows tumors only (without brain background) on all modalities. And the tumor shape has 100% alignment with the ground-truth class label on T1C modality, and 0% alignment on FLAIR. Its test accuracy is denoted as .
FLAIR dataset: It has the same settings, but only differs in that the tumor shape has 100% alignment with the ground-truth class label on FLAIR modality, and 0% alignment on T1C. Its test accuracy is denoted as .
The test performance and indicate the degree of model reliance on that modality to make predictions. We use them as the ground truth modality importance. On the test set, , . In this way, we constructed a model with known ground truth of modality importance of 1 for T1C, and 0 for the remaining modalities. We then calculate the plausibility metric as the measure of truthfulness for the synthetic data.
4.4 Evaluating G4: Informative plausibility
Given an XAI method that meets G3: Truthfulness, to further validate whether clinical users can use their own assessment on explanation plausibility to judge decision quality and identify potential errors and biases, next we assess whether the human plausibility assessment is informative. We do so in two steps: 1) proposing a novel plausibility metric – modality-specific feature importance (MSFI) – on multi-modal explanation task that bypasses physicians’ manual assessment; and 2) testing the correlation between plausibility metric and decision quality metric.
4.4.1 Quantifying plausibility
To quantify how reasonable the explanation is to human judgment and facilitate subsequent validation of using such plausibility information for AI decision verification, we used an existing metric feature portion (FP), and proposed a novel metric modality-specific feature importance (MSFI) designed for multi-modal medical image explanation based on its clinical requirements (§3.1.2). Both metrics quantify the agreement of heatmap highlighted regions with human prior knowledge.
FP assesses, among the highlighted regions in the heatmap, how many of them agree with human prior knowledge. It is calculated as:
| FP | (2) |
where is a heatmap, with denoting the spatial location. is the human-annotated feature masks, with outlining the spatial location of the feature. is the indicator function that selects the heatmap values inside the feature mask.
To abstract the clinical requirements for multi-modal medical image explanation (U4. Multi-modal medical image interpretation and clinical requirements for its explanation), we propose a novel plausibility metric MSFI for multi-modal explanation (Fig. 4). It combines the assessment of feature localization with modality prioritization, by multiplying FP with modality importance value modality-wise. Specifically, MSFI is the portion of heatmap values inside the feature localization mask for each modality , weighted by MI which is normalized to to have a comparable range with FP.
| (3) | ||||
| MSFI | (4) |
where is unnormalized, and MSFI is the normalized metric in . A higher MSFI score indicates a heatmap is more agreeable with clinical prior knowledge regarding capturing the important modalities and their localized features. MSFI can be regarded as a general form of FP that generalizes the feature portion calculation from single-modality to multi-modality images.
Instead of asking physicians to manually assess plausibility for a few explanations (the questionnaire in Fig. 2 demonstrates such process), whose rating may be susceptible to cognitive biases (U5.2. Bias and limitation of physicians’ quantitative rating), quantifying plausibility bypasses humans’ manual assessment, standardizes and automates the assessment process, and can assess multiple XAI methods using one set of annotated data.
In addition, although plausibility quantification requires annotations to represent human prior knowledge, the human prior knowledge annotation may not necessarily need to be as exact as feature segmentation masks, because MSFI and FP only penalize for regions outside the annotation mask†††In comparison, we did not use the intersection over union (IoU) metric commonly used in computer vision, because compared to MSFI or FP that penalizes only for false positives, IoU also penalizes for false negatives, which require the annotations to be exact. . Therefore, the annotation can be in the form of segmentation masks, bounding boxes, or landmarks. In our evaluation, we used tumor segmentation masks for the glioma task, and bounding boxes for the knee task. The annotations may not even need to be annotated by humans. It can be generated by training an AI model on a few annotated data points, or using trained models on feature segmentation/localization tasks.
4.4.2 Testing for plausibility informativeness
The indispensable step after plausibility quantification is to validate the clinical utility of using explanations to verify AI decision quality. We measure AI decision quality by using 1) the soft output probability, and 2) the hard thresholding model prediction correctness on the two classification tasks. We then test the correlation between prediction probability and plausibility, and test for identically distributed plausibility for different prediction correctness groups. Unless otherwise stated, we use a significance level for two-sided statistical test.
4.5 Evaluating G5: Computational efficiency
We recorded the computational time to generate each heatmap on a computer with 1 GTX Quadro 24 GB GPU and 8 CPU cores, and on a computing cluster with similar hardware configurations.
5 Evaluation result
We report evaluation results on whether the commonly-used 16 heatmap methods are clinically feasible by fulfilling the guidelines on the two clinical tasks with multi-modal medical images. All results were reported on the test dataset.
5.1 Evaluating G1 Understandability and G2 Clinical relevance
In our user study, although physicians did not express difficulty in understanding the meaning of heatmap as important regions for AI prediction (G1: Understandability is met), the heatmap explanation is not completely clinically relevant, as physicians were perplexed by the highlighted areas regardless of whether these areas align with their prior knowledge or not. This may be due to heatmap explanation only performing half of the clinical image interpretation step of feature localization, it lacks pathological description of important features, let alone to perform reasoning on these features (U3.1. Limitations of existing heatmap explanation). Therefore, the heatmap explanation only partially fulfills G2 Clinical relevance.
| Cumulative feature removal | Modality importance correlation | Synthetic data experiment | |||
| AUPC [-1, 1] | MI correlation [-1, 1] | MSFI [0, 1] | |||
| Glioma | Knee | Glioma | Knee | Synthetic glioma | |
| Deconvolution | 0.380.14 | -0.040.04 | 0.460.28 | -0.470.51 | 0.040.02 |
| DeepLift | 0.160.10 | NaN | 0.600.33 | NaN | 0.220.23 |
| Feature Ablation | 0.340.11 | -0.020.04 | 0.600.43 | 0.050.64 | 0.190.23 |
| Feature Permutation | -0.030.08 | NaN | NaN | NaN | 0.080.07 |
| GradCAM | 0.220.16 | NaN | NaN | NaN | 0.020.02 |
| Gradient | 0.090.02 | -0.050.02 | 0.490.41 | -0.520.51 | 0.190.13 |
| Gradient Shap | 0.180.12 | -0.020.03 | 0.640.31 | -0.290.54 | 0.220.19 |
| Guided BackProp | 0.530.09 | -0.040.03 | 0.570.21 | -0.440.53 | 0.490.21 |
| Guided GradCAM | 0.530.09 | NaN | 0.560.23 | NaN | 0.420.29 |
| InputGradient | 0.160.11 | -0.050.03 | 0.640.29 | -0.350.55 | 0.230.14 |
| Integrated Gradients | 0.180.12 | -0.040.02 | 0.630.31 | 0.240.64 | 0.220.19 |
| Kernel Shap | 0.310.10 | 0.000.03 | NaN | 0.330.58 | 0.080.08 |
| Lime | 0.510.08 | 0.000.04 | 0.570.42 | 0.350.58 | 0.050.07 |
| Occlusion | 0.210.08 | -0.010.02 | 0.580.45 | -0.320.54 | 0.220.25 |
| Shapley Value Sampling | 0.510.10 | 0.000.04 | 0.590.37 | 0.350.50 | 0.100.10 |
| Smooth Grad | 0.480.08 | -0.050.03 | 0.720.24 | -0.430.57 | 0.030.02 |
5.2 Evaluating G3: Truthfulness
The evaluation results on G3 Truthfulness of all three evaluation experiments are shown in Table 2. The AUPC metric on cumulative feature removal experiment is a global metric that runs on the whole test set, and we reported the metric mean standard deviation (std) of five models on the same test set, and used it to compare the XAI method performances; whereas the other evaluation metrics are local and run on individual data point, and we reported their mean std of five models by aggregating all test data points, and conducted Friedman and post-hoc Nemenyi test to identify the top ranking XAI methods. Using Kendall’s Tau-b ranking correlation, we also tested the performance ranking (using the mean of a metric) correlation between the glioma and knee tasks, to see if the performance on one task can be generalized to another task.
For the cumulative feature removal experiment that examines the fine-grained feature-level explanation truthfulness of XAI methods to the model decision process, the performances of the examined XAI methods on glioma and knee tasks differ a lot: on the glioma task, Guided BackProp, Guided GradCAM, Lime, Shapley Value Sampling, and Smooth Grad were the top-ranked algorithms with an average AUPC around 0.5, and their performances were relatively stable across different models. Whereas on the knee task, all XAI methods performed poorly with their AUPC scores around 0, which indicates the examined XAI methods did not differ from the baseline of random heatmaps. In addition, when comparing the glioma and knee tasks on the XAI method rankings based on mean AUPC, there was not a statistically significant correlation using Kendall’s Tau-b (), indicating the performance of XAI methods may only be specific to a task and not generalizable.
For the MI correlation experiment that examines the coarse-grained modality-level explanation truthfulness of XAI methods to the model decision process, on the glioma task, the importance ranking of heatmaps modalities showed weak to moderate positive correlations with the ground-truth modality Shapley values. Among the examined 13 XAI methods, there was a statistically significant difference of mean MI correlation using Friedman test, . A post-hoc Nemenyi test showed only Smooth Grad had a statistical significance higher performance than the rest of XAI methods (). On the knee task, the examined 12 XAI methods showed from moderate negative to weak positive correlations with the ground-truth Shapley values, and there was a statistically significant difference of mean MI correlation using Friedman test, . A post-hoc Nemenyi test showed Lime, Shapley Value Sampling, and Kernel Shap had a statistical significance higher performance than the rest of XAI methods (). Furthermore, the MI correlation performance ranking on one task did not migrate to another, with a statistically insignificant Kendall’s Tau-b ranking correlation test, .
For the synthetic data experiment on the glioma task that examines both modality- and feature-level truthfulness of XAI methods to the model decision process, the MSFI scores were generally in the low range, and no XAI method achieved an average MSFI score above 0.5. Among these, only Guided BackProp outperformed other XAI methods with statistical significance () using a post-hoc Nemenyi test after a significant Friedman test (). Since the synthetic data evaluation combined both the coarse-grained modality-level (MI correlation) and the fine-grained feature-level explanation truthfulness (AUPC), we further tested whether the XAI method performance on the synthetic data can be used to guide the selection of XAI on the original real-patient data on glioma task. Kendall’s Tau-b correlation test showed that the MSFI mean score ranking of the synthetic data experiment had no statistically significant ranking correlation with MI correlation (), and with AUPC ().
In summary, on the glioma task, the only XAI methods that outperformed others on feature-level (AUPC and MSFI on synthetic data experiment) and modality-level (MI correlation) explanation truthfulness evaluations are Guided BackProp. Despite this, the performances of the top XAI methods were around 0.5 compared to the ground truth or out-performed the random baseline. Since there is no benchmark, and the relative weights for individual evaluation metrics are unknown, the fulfillment of G3 Truthfulness may be dependent on the specific task and its clinical importance. On the knee task, all the examined XAI methods failed to meet G3 Truthfulness due to their low evaluation performances on both modality- and feature-level truthfulness. In addition, the good-performing XAI method on one clinical task did not generalize to another task.
5.3 Evaluating G4: Informative plausibility
| MSFI correlation w/ pred. prob. | Testing for plausibility informativeness - Glioma | Testing for plausibility informativeness - Knee | ||||||
| Glioma | Knee | Stat. Sig. | Right Pred. | Wrong Pred. | Stat. Sig. | Right Pred. | Wrong Pred. | |
| Deconvolution | 0.41 ∗ | -0.08 ∗ | NS | 0.47 (0.44,0.49) | 0.55 (0.44,0.57) | NS | 0.23 (0.22,0.24) | 0.23 (0.22,0.24) |
| DeepLift | 0.49 ∗ | NaN | 0.83 (0.79,0.85) | 0.75 (0.55,0.81) | NaN | NaN | NaN | |
| FeatureAblation | 0.59 ∗ | -0.16 ∗ | 0.70 (0.66,0.75) | 0.48 (0.29,0.67) | NS | 0.16 (0.15,0.16) | 0.18 (0.17,0.19) | |
| FeaturePermutation | 0.19 ∗ | NaN | NS | 0.29 (0.22,0.35) | 0.21 (0.06,0.32) | NaN | NaN | NaN |
| GradCAM | 0.18 ∗ | NaN | NS | 0.04 (0.04,0.05) | 0.04 (0.02,0.05) | NaN | NaN | NaN |
| Gradient | 0.41 ∗ | -0.08 ∗ | NS | 0.49 (0.46,0.51) | 0.50 (0.33,0.54) | NS | 0.24 (0.24,0.25) | 0.24 (0.24,0.25) |
| GradientShap | 0.49 ∗ | -0.09 ∗ | 0.78 (0.75,0.80) | 0.70 (0.52,0.76) | NS | 0.23 (0.22,0.23) | 0.24 (0.22,0.24) | |
| GuidedBackProp | 0.41 ∗ | -0.07 | NS | 0.78 (0.74,0.79) | 0.76 (0.57,0.82) | NS | 0.25 (0.25,0.26) | 0.25 (0.25,0.27) |
| GuidedGradCAM | 0.37 ∗ | NaN | NS | 0.82 (0.80,0.85) | 0.80 (0.54,0.86) | NaN | NaN | NaN |
| InputGradient | 0.57 ∗ | -0.08 ∗ | 0.77 (0.75,0.79) | 0.69 (0.46,0.76) | NS | 0.23 (0.23,0.24) | 0.24 (0.24,0.25) | |
| IntegratedGradients | 0.50 ∗ | -0.08 | 0.78 (0.75,0.82) | 0.71 (0.51,0.76) | NS | 0.22 (0.21,0.23) | 0.23 (0.22,0.23) | |
| KernelShap | 0.36 ∗ | -0.13 ∗ | NS | 0.20 (0.16,0.23) | 0.15 (0.03,0.35) | NS | 0.15 (0.15,0.16) | 0.17 (0.16,0.18) |
| Lime | 0.36 ∗ | -0.13 ∗ | NS | 0.23 (0.19,0.27) | 0.19 (0.12,0.25) | NS | 0.16 (0.16,0.17) | 0.18 (0.17,0.18) |
| Occlusion | 0.60 ∗ | -0.07 | 0.55 (0.54,0.58) | 0.24 (0.14,0.44) | NS | 0.20 (0.19,0.21) | 0.20 (0.19,0.21) | |
| ShapleyValueSampling | 0.53 ∗ | -0.10 ∗ | NS | 0.58 (0.54,0.61) | 0.38 (0.27,0.59) | NS | 0.17 (0.16,0.17) | 0.18 (0.17,0.19) |
| SmoothGrad | 0.36 ∗ | -0.03 | NS | 0.39 (0.37,0.40) | 0.39 (0.32,0.42) | NS | 0.24 (0.23,0.24) | 0.24 (0.23,0.25) |
5.3.1 Quantifying plausibility
Physicians’ average quantitative rating on heatmap quality had a higher Pearson’s r correlation with MSFI (, ) compared with FP (, ). Therefore, we resorted to quantifying the human assessment of explanation plausibility using MSFI score, while reporting the results using FP measure in Supplementary S2. In addition, physicians’ inter-rater agreement on the heatmap quality assessment was low: Krippendorff’s Alpha is 0.528 (cutoff value 0.667 [Krippendorff, 2004]), and Fleiss’ kappa is 0.009 (with 1 for perfect agreement and 0 for poor agreement). This indicates that doctors’ judgment of heatmap quality could be very subjective, which aligns with qualitative findings on U5.2. Bias and limitation of physicians’ quantitative rating.
5.3.2 Testing for plausibility informativeness
Since G3 Truthfulness is the prerequisite for G4 on plausibility informativeness, it is less meaningful to conduct plausibility informativeness assessment for XAI methods that did not fulfill G3 Truthfulness. Nevertheless, we reported the full evaluation results for all XAI methods as a reference.
To examine the correlation between plausibility measure MSFI and model prediction probability, we computed their non-parametric Spearman correlation (Table 3). For the glioma task, the plausibility measure MSFI of all XAI methods had a weak to moderate positive correlation with the model prediction probability, and the correlations were all statistically significant (). Occlusion, Feature Ablation, and InputGradient were the top three highly correlated XAI methods. For the knee task, all methods had a negative weak correlation with model prediction probability that may or may not show statistical significance.
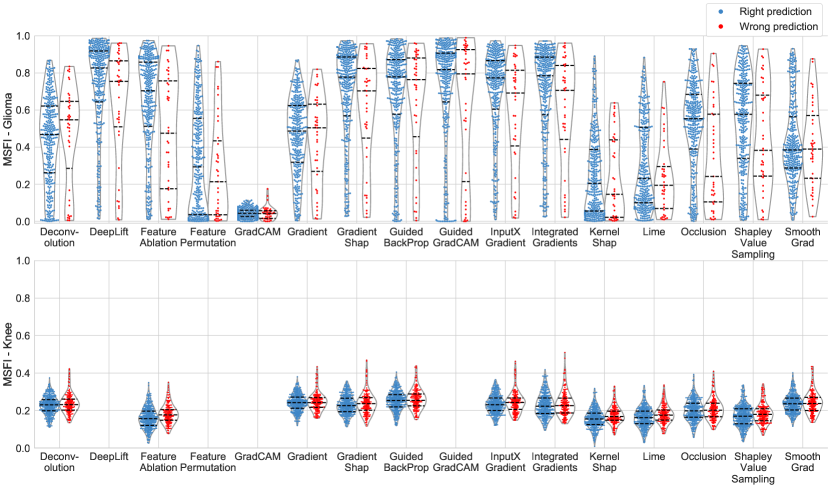
The above model output probability may not be well calibrated [Guo et al., 2017], thus may not be a good indicator for model decision quality. We then resorted to model prediction correctness as the definitive indicator for decision quality. Using the non-parametric Mann-Whitney U test [Mann and Whitney, 1947], we tested the upper-tailed alternative hypothesis that the distribution of MSFI on the correctly predicted data group is significantly higher than the incorrectly predicted one. The resulting significance level for each XAI algorithm is shown in Table 3. For some XAI methods such as Occlusion and Feature Ablation, despite they showed statistically higher MSFI scores on the right prediction data group compared to the wrong prediction one, by further inspecting their distributions (Fig. 5-top), the ranges of correctly and incorrectly predicted data points largely overlapped with each other. This may hinder the application of XAI methods for clinical users to identify potential decision flaws based on their plausibility judgment of the explanation, because the right and wrong predictions could have the same range of MSFI scores. For the knee task, all XAI methods failed to reject the null hypothesis, with the right and wrong prediction data points having similar MSFI score distributions (Fig. 5-bottom). Similar to the evaluation on G3, in G4 evaluation, the examined XAI methods did not exhibit the same performance pattern on the glioma and knee task.
The testing for plausibility informativeness on glioma task showed that, despite the overall range of the correctly and incorrectly predicted data points overlapping with each other, for some XAI methods, the Mann-Whitney U test still showed statistically higher MSFI for the correctly predicted data points than the incorrectly predicted ones. Further analysis showed that the statistical test result was confounded by different MSFI distributions on the two classes of LGG and HGG: for all XAI methods, both the predicted and ground-truth HGG class had a significantly higher () MSFI score compared to the predicted or ground-truth LGG class. The different distributions of MSFI on LGG and HGG classes influenced the results on testing for informative plausibility. To remove the influence of this confounder, we then conducted testing for plausibility informativeness conditioned on each class, and it yielded similar results as the above unconditioned one: when conditioned on HGG prediction, only Occlusion and Feature Ablation showed significantly higher MSFI for the rightly predicted data compared to the wrongly predicted ones, with and respectively. None of the XAI methods showed statistical significance when conditioned on LGG prediction. The visualization of MSFI conditioned on either HGG or LGG prediction, however, still showed range overlapping for the right and wrong predictions (Supplementary S2 Fig. 16). This indicates the examined XAI methods, both the unconditioned one and the one conditioned on each predicted class, failed the testing for informative plausibility. The same analysis on the knee task did not show statistically different MSFI on right and wrong predictions conditioned on each predicted class. The above analysis is detailed in Supplementary S2 §4.3.2.
Based on the results on testing for plausibility informativeness, the examined XAI methods did not meet G4 Informative plausibility neither on the glioma nor on the knee task.
5.4 Evaluating G5: Computational efficiency
| Computational time | |||
| seconds | |||
| Glioma | Synthetic Glioma | Knee | |
| Deconvolution | 2.11.2 | 1.30.0 | 2.62.1 |
| DeepLift | 4.62.0 | 2.20.0 | NaN |
| FeatureAblation | 8225 | 581.5 | 98102 |
| FeaturePermutation | 10.12.1 | 15.20.4 | NaN |
| GradCAM | 0.70.3 | 0.30.0 | NaN |
| Gradient | 2.21.3 | 1.10.0 | 2.62.2 |
| GradientShap | 7.83.3 | 5.00.1 | 2.82.2 |
| GuidedBackProp | 2.11.2 | 0.90.0 | 2.31.7 |
| GuidedGradCAM | 2.81.5 | 1.20.0 | NaN |
| InputGradient | 2.11.2 | 1.10.0 | 2.62.2 |
| IntegratedGradients | 6734 | 490.9 | 11379 |
| KernelShap | 24387 | 931.6 | 382388 |
| Lime | 449141 | 1542.6 | 507523 |
| Occlusion | 171321 | 273.5 | 672255 |
| ShapleyValueSampling | 2205693 | 1595228 | 19902021 |
| SmoothGrad | 14.46.8 | 9.50.1 | 24.116.7 |
The computational time spent in generating a heatmap is shown in Table 4. The speed of generating a heatmap was stable across the three datasets with different image dimensions (2D and 3D) and model architectures. Some gradient-based methods that rely solely on backpropagation can generate near real-time explanations, which enables their clinical use in real-time interactive XAI systems. For some gradient-based and all perturbation-based methods that require multiple sampling, their speed is seconds or even longer. Methods such as Lime or Shapley Value Sampling need to take 730 minutes to generate a heatmap. Depending on the specific use case and XAI method parameter settings, the long wait time may prevent their clinical use.
6 Discussion
6.1 Evaluated heatmap methods failed to meet the Clinical XAI Guidelines
We conducted a systematic evaluation on 16 commonly-used heatmap methods following the Clinical XAI Guidelines. Although the heatmap explanations were easily understandable to clinical users (G1), they only partially fulfilled G2 clinical relevance, due to the missing descriptions of feature pathology from the heatmap, which corresponds to the clinical image interpretation process (§5.1). The examined heatmap methods did not reliably exhibit the property of G3 Truthfulness on multiple models in the two clinical tasks. Due to the failure of G3, G4 testing for informative plausibility also had poor performance. Most heatmaps were computationally efficient regarding G5 that can generate a heatmap within seconds, except for some sampling-based methods such as Shapley Value Sampling, which may take more than 20 minutes.
Next, we discuss the computational evaluation results on G3 and G4 by referring to the literature, and discuss potential research directions and open research questions.
6.1.1 G3 Truthfulness
In G3, we evaluated whether the examined heatmaps can correctly reveal important features for model decision process at both the coarse-grained modality level and fine-grained feature level. None of the examined XAI methods fulfilled G3 on both glioma and knee tasks. Our findings join a number of previous literature findings on the untruthfulness of post-hoc XAI methods in natural image and MIA tasks [Adebayo et al., 2022, 2020, 2018, Zhou et al., 2021], in which they used modified datasets with known ground truth of important features to diagnose spurious or biased features learned by the model. Prior literature hypothesized the reason for the untruthfulness of the post-hoc explanation is that post-hoc methods summarize statistics that may only reveal partial aspects of a model’s internal state, and the actual decision process may be scattered throughout the network [Chen et al., 2020]. Therefore, prior work called for inherently interpretable AI models instead in high-stakes domains [Rudin, 2019]. Both post-hoc XAI and inherently interpretable AI models require truthfulness assessment [Jacovi and Goldberg, 2020].
6.1.2 G4 Informative plausibility
In G4, we tested the MSFI correlation with two indicators for model decision quality: 1) model output probability, and 2) model prediction correctness. For 1) model output probability, on the glioma task, our assessment showed the plausibility measure can be correlated with model prediction probability, which aligns with prior literature finding on XAI evaluation for chest X-ray task [Saporta et al., 2021]. For 2) testing informative plausibility using model prediction correctness, our results showed existing post-hoc XAI methods can hardly reveal information on model decision correctness, on both the glioma and knee task. This echoes with prior literature finding on a chest X-ray task that showed no strong correspondence between model generalization performance and heatmap plausibility measure [Viviano et al., 2021].
The above findings indicate that existing post-hoc heatmap methods may be able to reveal information that is obvious, or known to the model (such as the prediction label and its probability), but not good at revealing information that is difficult to estimate, or unknown to the model (such as prediction correctness, quality, or reliability). The former information on prediction probability is straightforward for clinical users to obtain by reading the model output, without the extra effort to interpret and assess its explanation; whereas the latter information on decision quality has more clinical significance as shown in our user study (U2. Clinical utility of explainable AI), and is more relevant to the clinical users to spend extra time interpreting the explanation and assessing its plausibility.
Generating explanations that can be informative for model decision quality is a challenging and clinically important problem. This problem is closely related to uncertainty estimation (UE) for deep learning models [Gal and Ghahramani, 2016] that estimates model decision uncertainty. Compared to providing users with a UE number, generating informative explanations for model decision quality can provide more contextual information to help users understand why, how, and when AI works and does not work. Despite its clinical importance, proposing and evaluating XAI for model decision verification (G4 Informative plausibility) is an underexplored problem, and there are only a few works [Slack et al., 2021, Li et al., 2020, Patro et al., 2019] that combine UE with XAI by bringing a probabilistic Bayesian view to XAI algorithms. But these proposed XAI methods did not incorporate plausibility measure as a way to quantify explanation uncertainty and its corresponding model decision uncertainty, and their ability to fulfill G4 on revealing model decision quality with plausibility measure is unknown and not assessed. Our Clinical XAI Guidelines and evaluation propose this open and clinically important problem to the research community.
6.2 Comparison of the guideline criteria
Both G1 Understandability and G2 Clinical relevance are qualitative assessments with respect to clinical applicability of the general form of an explanation, and are non-specific to an XAI method and the content it generated. In contrast, the other guidelines, G3 Truthfulness, G4 Informative plausibility, and G5 Computational efficiency are quantitative and computational assessments of the explanation content, and are specific to each XAI method that generates the explanation content within a specific explanation form. The explanation form can be regarded as different modalities of the explanation information, such as explaining using features, examples, or rules. Whereas the explanation content is the specific information expressed through an explanation form. Moreover, although G4 Informative plausibility and G2 Clinical relevance both focus on the aspect of human interpretation of the explanation, plausibility focuses on the content of explanation, whereas G2 Clinical relevance assesses a group of XAI methods that are represented in the same explanation form. An explanation that has a high score in G4 may not be clinically relevant (G2). For example, the content of a heatmap assessed by a plausibility measure may be very indicative of model decision quality, thus it has a high score for G4. But the general form of heatmap is not completely clinically relevant (G2), because it only provides localization information without information on feature pathology (as detailed in Section 5.1). Similarly, an explanation that is clinically relevant (G2) may not always correspond to a high score in G4. For example, if a group of XAI algorithms provides information on both feature localization and pathology identification, they are considered to be clinically relevant (G2). Within this group, different XAI algorithms may have different performances on their G4 scores, depending on how well the explanation plausibility correlates with AI decision quality.
Since G1 Understandability and G2 Clinical relevance assess the explanation form, an explanation form that passed G1 and G2 can be used to select or propose a group of XAI algorithms that generate the same form. For example, our user study discovered a clinically relevant explanation form of feature attribution: an explanation should at least present feature information on localization and pathology description (§2.1). This may cover the explanation form of segmentation maps labeled with different pathology [De Fauw et al., 2018], or a heatmap coupled with pathological description. Any XAI algorithms that generate such explanation forms are considered to fulfill G2. Some user studies have examined or identified explanation forms on understandability [Jin et al., 2021a, Cai et al., 2019a, b] and clinical relevance [Jin and Hamarneh, ]. User studies like these may enable AI developers to bypass G1 or G2 assessment by directly applying the relevant user study findings from the literature to their individual tasks. They can also serve as a starting point for the clinical AI development team before communicating with clinical users to assess G1 and G2.
Much of the literature on XAI evaluation considers the plausibility measure as a requirement [Singh et al., 2020a, de Souza et al., 2021, Saporta et al., 2021, Arun et al., 2021]. The Clinical XAI Guidelines do not include the stand-alone plausibility as a clinical requirement, because G1 Understandability and G2 Clinical relevance already regulate an XAI to be clinically viable in its explanation form, and the explanation content itself does not necessarily need to align with human knowledge (measured by plausibility). Instead of making an explanation plausible to users to gain their trust with a shortcut (i.e., by bypassing the G3 Truthfulness assessment), the Clinical XAI Guidelines focus on the clinical utility of user’s plausibility assessment, and inspect whether users’ plausibility assessment can shed light on the downstream clinical utilities (U2. Clinical utility of explainable AI), and help users answer their questions following their plausibility assessment (G4 Informative plausibility), such as enabling users to verify model decision, to diagnose model decision flaws and biases, or to discover new knowledge. All these utilities do not require the explanation content to align with human prior knowledge. In fact, we argue that it may be dangerous to select or optimize an XAI method solely on the basis of its plausibility measure. As observed in our user study and in prior literature [Critch and Krueger, 2020], a potential consequence is that the XAI method may be optimized to deceive users and make them overtrust a wrong AI decision with its seemingly plausible explanation, rather than help users to verify the decision quality.
6.3 Use of the Clinical XAI Guidelines
Our systematic evaluation demonstrated the use of the guidelines in the evaluation of XAI in two clinical tasks. Specifically, if we go back to Alex’s questions in the beginning, to apply the guidelines to a clinical XAI problem for XAI method selection or proposal, AI designers like Alex may first talk to their target clinical users or other stakeholders to understand their AI literacy (G1 Understandability), their clinical reasoning process which relates to the interpretation of explanation (G2 Clinical relevance). Based on the conversation, AI designers may have a clearer idea about which form(s) of explanation to target.
For the targeted form of explanation such as feature attribution map, there may be multiple XAI algorithms that can generate it. To design or select the optimal XAI algorithm of the target explanation form, AI designers may choose suitable metrics to assess and optimize XAI methods on the G3 Truthfulness measure. AI designers may also need to test the truthfulness metrics for an XAI algorithm on multiple trained AI models to examine the robustness of XAI method in truly reflecting the model decision process.
For the XAI method candidates that passed the truthfulness assessment, to validate whether the explanation is clinically useful in alerting physicians to AI potential decision flaws, AI developers may further test such property for the XAI method candidates (G4 Informative plausibility). To do so, AI designers can ask clinical users about which features or criteria they are based on to judge the plausibility of explanation, and select computational metrics and prepare data annotations based on the plausibility quantification criteria. Then AI developers can test the correlation between plausibility and decision quality.
AI designers may also need to record the G5 Computational efficiency of the XAI method candidates to rule out the ones that do not meet the speed and computational resource requirement in clinical deployment.
7 Limitations and future work
The Clinical XAI Guidelines focus on the general clinical requirements for AI explanation. Some task-dependent requirements for XAI methods, such as data privacy protection, were not included in the guidelines. They can serve as add-on requirements in addition to the guideline criteria for specific clinical tasks.
Our evaluation provides a demonstration of the XAI assessment process to align with clinical requirements. We modified existing methods or proposed ours for the assessment of G3 and G4, and we do not claim that they are the best evaluation methods for the general guideline criteria. We list the limitations for each evaluation method below:
For G3 Truthfulness: 1) Cumulative feature removal experiment has a feature independence assumption, which is violated in image data setting; and there is no consensus on how to set feature replacement value that can keep the same data distribution and not introduce additional information [Frye et al., 2021, Ren et al., 2021]. 2) Modality importance correlation experiment only evaluates important features from a modality as a whole, which is too coarse for MIA settings. 3) When using synthetic or modified datasets with known ground truth of important features to evaluate XAI methods, it is unknown how well we can generalize the conclusion from the synthetic to real-patient task, given the model and data distribution discrepancies between the two.
For G4 Informative plausibility: the statistical test for informative plausibility requires the number of wrongly predicted test data to reach a certain sample size for statistical power, which may be difficult to acquire with a highly accurate model and small test set. The statistical test does not identify whether the plausibility measure of correctly and incorrectly predicted data are well separated, and we had to manually visualize the data distribution.
Future work may propose novel XAI evaluation methods and automated, end-to-end, standardized evaluation pipeline corresponding to the guidelines to speed up the clinical development of XAI techniques.
8 Conclusion
In this work, we propose the Clinical XAI Guidelines to support the design and evaluation of clinically-oriented XAI systems. The proposal of the guidelines was based on dual understandings of the clinical requirements for explanations from our physician user study, and technical understanding from our previous XAI evaluation studies and XAI literature. The guidelines G1 Understandability and G2 Clinical relevance provide clinical insights for the selection of explanation forms. Guidelines G3 Truthfulness, G4 Informative plausibility, and G5 Computational efficiency incorporate the clinical requirements for explanation as clear technical objectives to be optimized for.
Based on the guidelines, we conducted a systematic evaluation on 16 commonly-used heatmap methods. The evaluation focused on a technically-novel and clinically-pervasive problem of multi-modal medical image explanation with two clinical tasks of brain tumor grading and knee lesion identification. We proposed a novel metric, MSFI for multi-modal medical image explanation tasks, to bypass physicians’ manual assessment of explanation plausibility. The evaluation results showed that the evaluated heatmap methods failed to fulfill G3 and G4, thus were not suitable for clinical use. The evaluation demonstrates the use of Clinical XAI Guidelines in real-world clinical tasks to facilitate the design and evaluation of clinically-oriented XAI.
Acknowledgments
We thank all physician participants in our user study. We thank Sunho Kim, Yiqi Yan, Mayur Mallya, Shahab Aslani, Ben Cardoen, and Hanene Ben Yedder for their technical support and helpful discussions. We thank the reviewers for their time, efforts, and insightful comments. This research was supported by the BC Cancer Foundation-BrainCare Fund, and Borealis AI through the Borealis AI Global Fellowship Award. This research was also enabled in part by the computational resources provided by NVIDIA and the Digital Research Alliance of Canada (alliancecan.ca).
Conflicts of interest
None.
Code availability
Code is available at:
github.com/weinajin/multimodal_explanation
Supplementary material
Supplementary Material S1 and S2 are available at:
github.com/weinajin/multimodal_explanation/tree/main/paper
Appendix
Clinical Explainable AI Guidelines (Full Version)
In an effort to guide the design and evaluation of clinical XAI to meet both clinical and technical requirements, we present a checklist including five canonical criteria which we believe may serve as guidelines for developing clinically-oriented XAI. The guidelines were developed with a collective effort from both clinical and technical aspects with complementary expertise in AI, human factor analysis, and clinical practice. In addition, it was driven and supported by the findings from our physician user study, pilot XAI evaluation experiments [Jin et al., 2022, 2021b], and literature. We sought feedback from two physicians and several researchers on medical image analysis as a heuristic evaluation of the guidelines.
To acquire physicians’ requirements for clinical XAI, we conducted a physician user study with 30 neurosurgeons to elicit their clinical requirements by using a clinical XAI prototype. The low-fidelity prototype is a clinical decision-support AI system that provides suggestions from a CNN model to differentiate lower-grade gliomas from high-grade ones based on multi-modal MRI. For each AI suggestion, it also shows a heatmap explanation that highlights the important features for model prediction. The user study consisted of an online survey that embedded the XAI prototype and collected physicians’ quantitative ratings of the heatmaps, and an optional post-survey interview where physicians comment on the clinical XAI system. Five physicians participated in the interview, and seven physicians provided comments in the survey by answering open-ended questions. We analyzed the qualitative data collected from interview sessions and open-ended questions in the survey as the main support to develop the guidelines from the clinical aspect. The detailed user study findings and method are in Supplementary Material S1, and its related supporting sections were referred to in the guidelines starting with ‘U’.
Next, we present the Clinical XAI Guidelines, which consist of five evaluation objectives to optimize a clinical XAI technique. They are categorized into three considerations on clinical usability, evaluation, and operation. For each objective in the guidelines, we list its key references from our user study or literature. We also analyze examples that follow the objective and/or counterexamples that violate it. Ways of assessment are also described to help identify if the objective is met. The guidelines and their key points are summarized in Table 1.
8.1 Clinical usability considerations
Guideline 1: Understandability.
The form and context of an explanation should be easily understandable by its clinical users. Users do not need to have technical knowledge in machine learning, AI, or programming to interpret the explanation.
-
•
Example:
Physicians find the feature attribution maps (heatmaps) used in our user study easily understandable. Other explanation forms on medical image analysis tasks such as similar examples [Cai et al., 2019b], counterfactual examples [Bigolin Lanfredi et al., 2019], scoring (linear feature attribution) [Kawahara et al., 2019], or rule-based explanation, are shown in prior physician user studies in the literature. [Jin et al., 2021a] summarized 12 end-user-friendly explanation forms that do not require technical knowledge, including feature-based (feature attribution, feature shape, feature interaction), example-based (similar, prototypical, and counterfactual example), rule-based explanation (rules, decision tree), and contextual information (input, output, performance, dataset). In addition to the explanation that reveals the model decision process, in our user study, physicians also required other information that makes the AI model transparent, such as model performance, training dataset, and prediction confidence (U3.3. Making AI transparent by providing information on performance, training dataset, and decision confidence). An XAI system may use one or a combination of multiple explanation forms that are friendly to clinical users.
-
•
Counterexample:
A counterexample of understandability is to explain by visualizing the learned representation of neurons in DNN [Olah et al., 2017]. Although the form of neuron visualization as images is intuitive to look at, interpreting the images requires users to have prior knowledge on DNN model and neuron to understand the context of neuron visualization.
-
•
Assessment method:
To assess if the understandability objective is met, AI designers can conduct a self-assessment on an XAI technique to inspect its AI knowledge prerequisites, conduct a pilot physician usability study using low-fidelity prototypes, or have informal conversations with clinical users to understand their minimal AI literary, and choose proper explanation techniques accordingly. Low-fidelity prototypes such as sketches can be used as a quick trial-and-error tool and help clinical users better vision an explanation in a clinical context. As a reference, [Jin et al., 2021a] provides users’ understandability from 32 laypersons on 12 end-user-friendly explanation forms, and prototyping support to identify clinical user-friendly explanations. This assessment is usually one-time, conducted at the initial phase of a project.
Guideline 2: Clinical relevance.
The way physicians use explanations is to inspect the AI-based evidence provided by the explanation, and incorporate such evidence in their clinical reasoning process for downstream tasks, such as assessing the validity of AI decision, making a final decision on the case, improving their problem-solving skills, or making scientific discoveries (U2. Clinical utility of explainable AI; U1. Clinical utility of AI). To make XAI clinically useful, the explanation information should be relevant to physicians’ clinical decision-making pattern, and can support their clinical reasoning process.
For diagnostic/predictive tasks on clinical images, physicians’ image interpretation process includes two general steps: 1) feature extraction: physicians first perform pattern recognition to localize key features and identify pathology of these features; 2) reasoning on the extracted features: physicians perform medical reasoning and construct diagnostic hypotheses (differential diagnosis) based on the image feature evidence. A clinically relevant explanation should provide information corresponding to the above process, so that physicians can incorporate the explanation information into their medical image interpretation process (U3. Clinical requirements of explainable AI).
“What (explanation) we get currently, when a radiologist read it, they point out the significant features, and then they integrate those knowledge, and say, to my best guess, this is a GBM. And I have the same expectations of AI (explanation).” (N3)
-
•
Example:
In the user study, physicians visioned the ideal explanations that are clinically relevant (U3.2. Desirable explanation), such as using radiologists’ language, a linear scoring model, or a rule-based explanation. Those explanations are composed of clinically meaningful features. And their form of text, rule, or linear model corresponds to the second step of the reasoning process on the extracted features in the above clinical image interpretation process.
-
•
Counterexample:
The heatmap explanation is not completely clinically relevant, as physicians were perplexed by the highlighted areas, regardless of whether the areas align with their prior knowledge or not. Because the heatmap explanation only performs half of the clinical image interpretation step 1) of feature localization, it lacks the description of important features, let alone to perform reasoning on these features (U3.1. Limitations of existing heatmap explanation).
“Though the heatmap is drawing your eyes to many different spots, but I feel like I didn’t understand why my eyes were being driven to those spots, like why were these very specific components important? And I think that’s where all my confusion was.” (N2)
-
•
Assessment method:
A user study with the target clinical users can be conducted in a formal or informal manner, to understand the clinical decision-making pattern or workflow for the target task, and inspect whether the explanation form corresponds to such pattern, and can help physicians answer their questions on the rationale of the model decision, how do users incorporate the explanation information into their decision process. The above information can be collected via an interview or conversation with users, a field visit and observation, or a focus group, etc. Low-fidelity prototypes (such as sketches) [Jin et al., 2021a] of explanation form candidates can be used to elicit more in-context feedback from clinical users’ communication. The G2 assessment can be co-conducted with G1 assessment at the initial phase of a project, and it is also a one-time assessment. As a reference, our user study finding (U2 and U3 in Supplementary Material S1) provides G2 assessment results for the explanation form of heatmap.
8.2 Evaluation considerations
Guideline 3: Truthfulness.
Explanation should truthfully reflect the model decision process. This is the fundamental requirement for a clinically-oriented explanation, and an explanation method should fulfill the truthfulness requirement first prior to other evaluation requirements such as G4: Informative plausibility in the guidelines.
-
•
Counterexample:
One of the main clinical utilities of explanation is that clinical users intuitively use explanation plausibility assessment (G4) to verify AI decisions for a case to decide whether to take or reject the AI suggestion, and calibrate their trust in AI’s current prediction on the case, or the AI model in general accordingly (U2.3). Users do so with an implicit assumption that explanations are the true representation of the model decision process. Violating truthfulness can lead to two significant consequences during the human assessment on explanation plausibility (G4):
1. Clinical users may mistakenly reject AI’s correct suggestion merely for the poor performance of the XAI method, which shows an unreasonable explanation.
2. If an XAI method is proposed or selected based on explanation plausibility objective only, rather than help clinical users to verify the decision quality, the explanation can be optimized to deceive clinical users with its seemingly plausible explanation, despite the wrong prediction from AI [Critch and Krueger, 2020], as illustrated by the physician participant N1’s quote:
“If a system made its prediction based upon these areas (outside the tumor), I would definitely not trust that system, but I would be very reassured that the system is telling me that. …So I’m less likely to use this model, but I’m more likely to use a model that does a better job than this, because I am reassured that when I see that better model, that I will be able to have access to that back-end explanation. ” (N1)
-
•
Assessment method:
As stated in [Jacovi and Goldberg, 2020], the truthfulness or faithfulness objective cannot and should not be assessed by human judgment on the explanation quality or annotations of the human prior knowledge, because humans do not know the model’s underlying decision process.
The most common way to assess explanation truthfulness for feature attribution XAI methods in the literature is to gradually add or remove features from the most to the least important ones according to an explanation, and measure the model performance change [Yin et al., 2021, Yeh et al., 2019, Hooker et al., 2019, Samek et al., 2017, Lundberg et al., 2020, Alvarez-Melis and Jaakkola, 2018]. Another way is to construct synthetic evaluation datasets in which the ground truth knowledge on the model decision process from input features to prediction is known and controlled [Doshi-Velez and Kim, 2017, Kim et al., 2018, Gilpin et al., 2018].
Guideline 4: Informative plausibility.
The ultimate use of an explanation is to be interpreted and assessed by clinical users. Physicians intuitively use the assessment of explanation plausibility or reasonableness (i.e.: how reasonable the explanation is based on its agreement with human prior knowledge on the task) as a way to evaluate AI decision quality, so that to achieve multifaceted clinical utilities with XAI, including verifying AI’s decisions (U2.3), calibrating trust in AI (U2.3), ensuring the safe use of AI, resolving disagreement with AI (U2.2), identifying potential biases, and making medical discoveries (U2.4). Informative plausibility aims to validate whether an XAI method can achieve its utility in helping users to identify potential AI decision flaws and/or biases, i.e.: a plausible explanation for a right decision, and an implausible explanation for a wrong decision of AI. G3 Truthfulness is the gatekeeper of G4 Informative plausibility to warrant the explanation truthfully represents the AI decision process.
-
•
Example:
In our evaluation, we abstract physicians’ clinical requirements for multi-modal medical image explanation (U4) into the MSFI metric. It regards the most plausible heatmap explanation as some maps that can both localize the important image feature on each imaging modality, and highlight the important modalities for decision. We evaluate how well MSFI metric corresponds to physicians’ assessment by quantitative measure to calculate the correlation between the two, and showcase the visual examples as a qualitative measure. We then inspect the subsequent utility of the MSFI metric on verifying model decisions, by measuring its correlation with decision correctness.
-
•
Assessment method:
To test whether explanation plausibility is informative to help users identify AI decision errors and biases, AI designers can assess the correlation between AI decision quality measures (such as model performance, calibrated prediction uncertainty, prediction correctness, and quantification of biased patterns) with plausibility measures [Adebayo et al., 2022, Saporta et al., 2021].
Since human assessment of explanation plausibility is usually subjective and susceptible to biases (U5.2. Bias and limitation of physicians’ quantitative rating), AI designers may consider quantifying the plausibility measure by abstracting the human assessment criteria into computation metrics for a given task. The quantification of human assessment is not meant to directly select or optimize XAI methods for clinical use. Rather, XAI methods should be optimized for their truthfulness measures (G3). Plausibility quantification is meant to validate the capability of XAI methods on their subsequent clinical utility to reveal AI decision flaws and/or biases, providing their high truthfulness score. Quantifying plausibility can make such a validation process automatic, reproducible, standardizable, and computationally efficient. Similarly, the human annotation of important features according to physicians’ prior knowledge, which is used to quantify plausibility, cannot be regarded as the “ground truth” of explanation, because explanations (given that they fulfill G3 Truthfulness) are still acceptable even if they are not aligned with human prior knowledge, but reveal the model decision quality or help humans to identify new patterns and make medical discoveries.
Many approaches were proposed to quantify explanation plausibility measure. These measures calculate the agreement of explanation with human prior knowledge annotations for a given task [Taghanaki et al., 2019, Bau et al., 2017, Arun et al., 2021]. To evaluate whether the quantified plausibility measure is a good substitute for human assessment, AI designers can use a quantitative measure by calculating the correlation between the plausibility metric and clinical users’ assessment score, or use a qualitative measure by showing physicians different explanations and their plausibility score, and ask them to judge.
8.3 Operational consideration
Guideline 5: Computational efficiency.
Since many AI-assisted clinical tasks are time-sensitive decisions (U1.2.1. Decision support for time-sensitive cases, and hard cases), the selection or proposal of clinical XAI techniques needs to consider the computational time and resources. The wait time for an explanation should not be a bottleneck for the clinical task workflow.
-
•
Example:
In our evaluation, some gradient-based XAI methods that use backpropagation can generate near real-time explanations with an upper limit of up to 10 seconds. This also enables their clinical use in generating real-time interactive explanations.
-
•
Counterexample:
For XAI techniques that require sampling input-output pairs, their computational time may be too long for physicians to wait for an explanation. In our evaluation, it took about 30 minutes for Shapley Value Sampling method to generate one heatmap on a typical desktop computer with GPU.
-
•
Assessment method:
AI designers can record the computational time and resources for XAI method to assess whether the requirement of computational efficiency is met. AI designers may also need to talk to clinical users to understand whether their clinical task includes time-sensitive decisions, and their maximum tolerable waiting time for an explanation on the task. For some XAI methods, the computational time depends on the settings of some specific parameters, such as the number and size of feature masks to generate the perturbed samples, and the number of samples. AI designers need to identify the optimal set of parameters to balance explanation accuracy and computational efficiency.
References
- Adebayo et al. [2018] J. Adebayo, J. Gilmer, M. Muelly, I. Goodfellow, M. Hardt, and B. Kim. Sanity checks for saliency maps. In S. Bengio, H. Wallach, H. Larochelle, K. Grauman, N. Cesa-Bianchi, and R. Garnett, editors, Advances in Neural Information Processing Systems, volume 31. Curran Associates, Inc., 2018. URL https://proceedings.neurips.cc/paper/2018/file/294a8ed24b1ad22ec2e7efea049b8737-Paper.pdf.
- Adebayo et al. [2020] J. Adebayo, M. Muelly, I. Liccardi, and B. Kim. Debugging tests for model explanations. In Proceedings of the 34th International Conference on Neural Information Processing Systems, NIPS’20, Red Hook, NY, USA, 2020. Curran Associates Inc. ISBN 9781713829546.
- Adebayo et al. [2022] J. Adebayo, M. Muelly, H. Abelson, and B. Kim. Post hoc explanations may be ineffective for detecting unknown spurious correlation. In International Conference on Learning Representations, 2022. URL https://openreview.net/forum?id=xNOVfCCvDpM.
- Alvarez-Melis and Jaakkola [2018] D. Alvarez-Melis and T. S. Jaakkola. Towards robust interpretability with self-explaining neural networks. In Proceedings of the 32nd International Conference on Neural Information Processing Systems, NIPS’18, page 7786–7795, Red Hook, NY, USA, 2018. Curran Associates Inc.
- Alvarez-Melis and Jaakkola [2018] D. Alvarez-Melis and T. S. Jaakkola. On the robustness of interpretability methods. CoRR, abs/1806.08049, 2018. URL http://arxiv.org/abs/1806.08049.
- Amann et al. [2020] J. Amann, A. Blasimme, E. Vayena, D. Frey, and V. I. Madai. Explainability for artificial intelligence in healthcare: a multidisciplinary perspective. BMC Medical Informatics and Decision Making, 20(1):310, dec 2020. ISSN 14726947. doi: 10.1186/s12911-020-01332-6. URL https://bmcmedinformdecismak.biomedcentral.com/articles/10.1186/s12911-020-01332-6.
- Arun et al. [2021] N. Arun, N. Gaw, P. Singh, K. Chang, M. Aggarwal, B. Chen, K. Hoebel, S. Gupta, J. Patel, M. Gidwani, J. Adebayo, M. D. Li, and J. Kalpathy-Cramer. Assessing the trustworthiness of saliency maps for localizing abnormalities in medical imaging. Radiology: Artificial Intelligence, 3(6), Nov. 2021. doi: 10.1148/ryai.2021200267. URL https://doi.org/10.1148/ryai.2021200267.
- Bakas et al. [2017] S. Bakas, H. Akbari, A. Sotiras, M. Bilello, M. Rozycki, J. S. Kirby, J. B. Freymann, K. Farahani, and C. Davatzikos. Advancing the cancer genome atlas glioma MRI collections with expert segmentation labels and radiomic features. Scientific Data, 4(1), Sept. 2017. doi: 10.1038/sdata.2017.117. URL https://doi.org/10.1038/sdata.2017.117.
- Barredo Arrieta et al. [2020] A. Barredo Arrieta, N. Díaz-Rodríguez, J. Del Ser, A. Bennetot, S. Tabik, A. Barbado, S. Garcia, S. Gil-Lopez, D. Molina, R. Benjamins, R. Chatila, and F. Herrera. Explainable artificial intelligence (xai): Concepts, taxonomies, opportunities and challenges toward responsible ai. Information Fusion, 58:82–115, 2020. ISSN 1566-2535. doi: https://doi.org/10.1016/j.inffus.2019.12.012. URL https://www.sciencedirect.com/science/article/pii/S1566253519308103.
- Bau et al. [2017] D. Bau, B. Zhou, A. Khosla, A. Oliva, and A. Torralba. Network dissection: Quantifying interpretability of deep visual representations. In Computer Vision and Pattern Recognition, 2017.
- Bello et al. [2019] G. A. Bello, T. J. W. Dawes, J. Duan, C. Biffi, A. de Marvao, L. S. G. E. Howard, J. S. R. Gibbs, M. R. Wilkins, S. A. Cook, D. Rueckert, and D. P. O’Regan. Deep-learning cardiac motion analysis for human survival prediction. Nature Machine Intelligence, 1(2):95–104, 2019. ISSN 2522-5839. doi: 10.1038/s42256-019-0019-2. URL https://doi.org/10.1038/s42256-019-0019-2.
- Beyer et al. [2002] T. Beyer, D. W. Townsend, and T. M. Blodgett. Dual-modality PET/CT tomography for clinical oncology. Q J Nucl Med, 46(1):24–34, Mar 2002.
- Bien et al. [2018] N. Bien, P. Rajpurkar, R. L. Ball, J. Irvin, A. Park, E. Jones, M. Bereket, B. N. Patel, K. W. Yeom, K. Shpanskaya, S. Halabi, E. Zucker, G. Fanton, D. F. Amanatullah, C. F. Beaulieu, G. M. Riley, R. J. Stewart, F. G. Blankenberg, D. B. Larson, R. H. Jones, C. P. Langlotz, A. Y. Ng, and M. P. Lungren. Deep-learning-assisted diagnosis for knee magnetic resonance imaging: Development and retrospective validation of MRNet. PLOS Medicine, 15(11):e1002699, nov 2018. ISSN 1549-1676. doi: 10.1371/journal.pmed.1002699. URL http://dx.plos.org/10.1371/journal.pmed.1002699.
- Bigolin Lanfredi et al. [2019] R. Bigolin Lanfredi, J. D. Schroeder, C. Vachet, and T. Tasdizen. Adversarial regression training for visualizing the progression of chronic obstructive pulmonary disease with chest x-rays. In D. Shen, T. Liu, T. M. Peters, L. H. Staib, C. Essert, S. Zhou, P.-T. Yap, and A. Khan, editors, Medical Image Computing and Computer Assisted Intervention – MICCAI 2019, pages 685–693, Cham, 2019. Springer International Publishing. ISBN 978-3-030-32226-7.
- Bitar et al. [2006] R. Bitar, G. Leung, R. Perng, S. Tadros, A. R. Moody, J. Sarrazin, C. McGregor, M. Christakis, S. Symons, A. Nelson, and T. P. Roberts. MR pulse sequences: What every radiologist wants to know but is afraid to ask. RadioGraphics, 26(2):513–537, Mar. 2006. doi: 10.1148/rg.262055063. URL https://doi.org/10.1148/rg.262055063.
- Bussone et al. [2015] A. Bussone, S. Stumpf, and D. O’Sullivan. The role of explanations on trust and reliance in clinical decision support systems. In 2015 International Conference on Healthcare Informatics, pages 160–169, 2015. doi: 10.1109/ICHI.2015.26.
- Cai et al. [2019a] C. J. Cai, J. Jongejan, and J. Holbrook. The effects of example-based explanations in a machine learning interface. In Proceedings of the 24th International Conference on Intelligent User Interfaces, IUI ’19, page 258–262, New York, NY, USA, 2019a. Association for Computing Machinery. ISBN 9781450362726. doi: 10.1145/3301275.3302289. URL https://doi.org/10.1145/3301275.3302289.
- Cai et al. [2019b] C. J. Cai, E. Reif, N. Hegde, J. Hipp, B. Kim, D. Smilkov, M. Wattenberg, F. Viegas, G. S. Corrado, M. C. Stumpe, and M. Terry. Human-centered tools for coping with imperfect algorithms during medical decision-making. In Proceedings of the 2019 CHI Conference on Human Factors in Computing Systems, CHI ’19, page 1–14, New York, NY, USA, 2019b. Association for Computing Machinery. ISBN 9781450359702. doi: 10.1145/3290605.3300234. URL https://doi.org/10.1145/3290605.3300234.
- Cai et al. [2019c] C. J. Cai, S. Winter, D. Steiner, L. Wilcox, and M. Terry. ”hello ai”: Uncovering the onboarding needs of medical practitioners for human-ai collaborative decision-making. Proc. ACM Hum.-Comput. Interact., 3(CSCW), Nov. 2019c. doi: 10.1145/3359206. URL https://doi.org/10.1145/3359206.
- Carter and Nielsen [2017] S. Carter and M. Nielsen. Using artificial intelligence to augment human intelligence. Distill, 2(12), Dec. 2017. doi: 10.23915/distill.00009. URL https://doi.org/10.23915/distill.00009.
- Caruana et al. [2015] R. Caruana, Y. Lou, J. Gehrke, P. Koch, M. Sturm, and N. Elhadad. Intelligible models for healthcare: Predicting pneumonia risk and hospital 30-day readmission. In Proceedings of the ACM SIGKDD International Conference on Knowledge Discovery and Data Mining, volume 2015-Augus, pages 1721–1730, New York, New York, USA, aug 2015. Association for Computing Machinery. ISBN 9781450336642. doi: 10.1145/2783258.2788613. URL http://dl.acm.org/citation.cfm?doid=2783258.2788613.
- Castro et al. [2009] J. Castro, D. Gómez, and J. Tejada. Polynomial calculation of the shapley value based on sampling. Computers & Operations Research, 36(5):1726–1730, 2009. ISSN 0305-0548. doi: https://doi.org/10.1016/j.cor.2008.04.004. URL https://www.sciencedirect.com/science/article/pii/S0305054808000804. Selected papers presented at the Tenth International Symposium on Locational Decisions (ISOLDE X).
- Chen et al. [2019] C. Chen, O. Li, C. Tao, A. J. Barnett, J. Su, and C. Rudin. ¡i¿This¡/i¿ Looks like ¡i¿That¡/i¿: Deep Learning for Interpretable Image Recognition. Curran Associates Inc., Red Hook, NY, USA, 2019.
- Chen et al. [2021] R. J. Chen, T. Y. Chen, J. Lipková, J. J. Wang, D. F. K. Williamson, M. Y. Lu, S. Sahai, and F. Mahmood. Algorithm fairness in AI for medicine and healthcare. CoRR, abs/2110.00603, 2021. URL https://arxiv.org/abs/2110.00603.
- Chen et al. [2020] Z. Chen, Y. Bei, and C. Rudin. Concept whitening for interpretable image recognition. Nature Machine Intelligence, 2(12):772–782, Dec. 2020. doi: 10.1038/s42256-020-00265-z. URL https://doi.org/10.1038/s42256-020-00265-z.
- Cochard and Netter [2012] L. R. Cochard and F. H. Netter. Netters introduction to imaging. Elsevier Saunders, 2012.
- Critch and Krueger [2020] A. Critch and D. Krueger. AI research considerations for human existential safety (ARCHES). CoRR, abs/2006.04948, 2020. URL https://arxiv.org/abs/2006.04948.
- De Fauw et al. [2018] J. De Fauw, J. R. Ledsam, B. Romera-Paredes, S. Nikolov, N. Tomasev, S. Blackwell, H. Askham, X. Glorot, B. O’Donoghue, D. Visentin, G. van den Driessche, B. Lakshminarayanan, C. Meyer, F. Mackinder, S. Bouton, K. Ayoub, R. Chopra, D. King, A. Karthikesalingam, C. O. Hughes, R. Raine, J. Hughes, D. A. Sim, C. Egan, A. Tufail, H. Montgomery, D. Hassabis, G. Rees, T. Back, P. T. Khaw, M. Suleyman, J. Cornebise, P. A. Keane, and O. Ronneberger. Clinically applicable deep learning for diagnosis and referral in retinal disease. Nature Medicine, 24(9):1342–1350, Sept 2018. ISSN 1078-8956. doi: 10.1038/s41591-018-0107-6. URL http://www.ncbi.nlm.nih.gov/pubmed/30104768http://www.nature.com/articles/s41591-018-0107-6.
- de Souza et al. [2021] L. A. de Souza, R. Mendel, S. Strasser, A. Ebigbo, A. Probst, H. Messmann, J. P. Papa, and C. Palm. Convolutional neural networks for the evaluation of cancer in barrett’s esophagus: Explainable ai to lighten up the black-box. Computers in Biology and Medicine, 135:104578, 2021. ISSN 0010-4825. doi: [https://doi.org/10.1016/j.compbiomed.2021.104578](https://doi.org/10.1016/j.compbiomed.2021.104578). URL [https://www.sciencedirect.com/science/article/pii/S0010482521003723](https://www.sciencedirect.com/science/article/pii/S0010482521003723).
- DeYoung et al. [2020] J. DeYoung, S. Jain, N. F. Rajani, E. Lehman, C. Xiong, R. Socher, and B. C. Wallace. ERASER: A benchmark to evaluate rationalized NLP models. In Proceedings of the 58th Annual Meeting of the Association for Computational Linguistics, pages 4443–4458, Online, July 2020. Association for Computational Linguistics. doi: 10.18653/v1/2020.acl-main.408. URL https://aclanthology.org/2020.acl-main.408.
- Doshi-Velez and Kim [2017] F. Doshi-Velez and B. Kim. Towards a rigorous science of interpretable machine learning, 2017.
- Doshi-Velez and Kim [2018] F. Doshi-Velez and B. Kim. Considerations for Evaluation and Generalization in Interpretable Machine Learning, pages 3–17. Springer International Publishing, Cham, 2018. ISBN 978-3-319-98131-4. doi: 10.1007/978-3-319-98131-4˙1. URL https://doi.org/10.1007/978-3-319-98131-4_1.
- Došilović et al. [2018] F. K. Došilović, M. Brčić, and N. Hlupić. Explainable artificial intelligence: A survey. In 2018 41st International Convention on Information and Communication Technology, Electronics and Microelectronics (MIPRO), pages 0210–0215, 2018. doi: 10.23919/MIPRO.2018.8400040.
- Fisher et al. [2019] A. Fisher, C. Rudin, and F. Dominici. All models are wrong, but many are useful: Learning a variable’s importance by studying an entire class of prediction models simultaneously. Journal of Machine Learning Research, 20(177):1–81, 2019. URL http://jmlr.org/papers/v20/18-760.html.
- Frye et al. [2021] C. Frye, D. de Mijolla, T. Begley, L. Cowton, M. Stanley, and I. Feige. Shapley explainability on the data manifold. In International Conference on Learning Representations, 2021. URL https://openreview.net/forum?id=OPyWRrcjVQw.
- Fujisawa et al. [2018] Y. Fujisawa, Y. Otomo, Y. Ogata, Y. Nakamura, R. Fujita, Y. Ishitsuka, R. Watanabe, N. Okiyama, K. Ohara, and M. Fujimoto. Deep-learning-based, computer-aided classifier developed with a small dataset of clinical images surpasses board-certified dermatologists in skin tumour diagnosis. British Journal of Dermatology, 180(2):373–381, Sept. 2018. doi: 10.1111/bjd.16924. URL https://doi.org/10.1111/bjd.16924.
- Futoma et al. [2020] J. Futoma, M. Simons, T. Panch, F. Doshi-Velez, and L. A. Celi. The myth of generalisability in clinical research and machine learning in health care. The Lancet Digital Health, 2(9):e489–e492, sep 2020. ISSN 2589-7500. doi: 10.1016/S2589-7500(20)30186-2. URL https://doi.org/10.1016/S2589-7500(20)30186-2.
- Gal and Ghahramani [2016] Y. Gal and Z. Ghahramani. Dropout as a bayesian approximation: Representing model uncertainty in deep learning. In Proceedings of the 33rd International Conference on International Conference on Machine Learning - Volume 48, ICML’16, page 1050–1059. JMLR.org, 2016.
- Gilpin et al. [2018] L. H. Gilpin, D. Bau, B. Z. Yuan, A. Bajwa, M. A. Specter, and L. Kagal. Explaining explanations: An approach to evaluating interpretability of machine learning. CoRR, abs/1806.00069, 2018. URL http://arxiv.org/abs/1806.00069.
- Guidotti et al. [2018] R. Guidotti, A. Monreale, S. Ruggieri, F. Turini, F. Giannotti, and D. Pedreschi. A survey of methods for explaining black box models. ACM Comput. Surv., 51(5), aug 2018. ISSN 0360-0300. doi: 10.1145/3236009. URL https://doi.org/10.1145/3236009.
- Guo et al. [2017] C. Guo, G. Pleiss, Y. Sun, and K. Q. Weinberger. On calibration of modern neural networks. CoRR, abs/1706.04599, 2017. URL http://arxiv.org/abs/1706.04599.
- Harris et al. [1993] K. Harris, H. Adams, D. Lloyd, and D. Harvey. The effect on apparent size of simulated pulmonary nodules of using three standard ct window settings. Clinical Radiology, 47(4):241–244, 1993. ISSN 0009-9260. doi: https://doi.org/10.1016/S0009-9260(05)81130-4. URL https://www.sciencedirect.com/science/article/pii/S0009926005811304.
- Hase and Bansal [2020] P. Hase and M. Bansal. Evaluating explainable AI: Which algorithmic explanations help users predict model behavior? In Proceedings of the 58th Annual Meeting of the Association for Computational Linguistics, pages 5540–5552, Online, July 2020. Association for Computational Linguistics. doi: 10.18653/v1/2020.acl-main.491. URL https://aclanthology.org/2020.acl-main.491.
- He et al. [2019] J. He, S. L. Baxter, J. Xu, J. Xu, X. Zhou, and K. Zhang. The practical implementation of artificial intelligence technologies in medicine. Nature Medicine, 25(1):30–36, Jan. 2019. doi: 10.1038/s41591-018-0307-0. URL https://doi.org/10.1038/s41591-018-0307-0.
- ho Cho et al. [2018] H. ho Cho, S. hak Lee, J. Kim, and H. Park. Classification of the glioma grading using radiomics analysis. PeerJ, 6:e5982, Nov. 2018. doi: 10.7717/peerj.5982. URL https://doi.org/10.7717/peerj.5982.
- Hooker et al. [2019] S. Hooker, D. Erhan, P.-J. Kindermans, and B. Kim. A benchmark for interpretability methods in deep neural networks. In NeurIPS, pages 9734–9745, 2019. URL http://papers.nips.cc/paper/9167-a-benchmark-for-interpretability-methods-in-deep-neural-networks.
- Huang et al. [2017] G. Huang, Z. Liu, L. Van Der Maaten, and K. Q. Weinberger. Densely connected convolutional networks. In 2017 IEEE Conference on Computer Vision and Pattern Recognition (CVPR), pages 2261–2269, 2017. doi: 10.1109/CVPR.2017.243.
- Jacovi and Goldberg [2020] A. Jacovi and Y. Goldberg. Towards faithfully interpretable NLP systems: How should we define and evaluate faithfulness? In Proceedings of the 58th Annual Meeting of the Association for Computational Linguistics, pages 4198–4205, Online, July 2020. Association for Computational Linguistics. doi: 10.18653/v1/2020.acl-main.386. URL https://aclanthology.org/2020.acl-main.386.
- [49] W. Jin and G. Hamarneh. What explanations do doctors require from artificial intelligence? In Manuscript in preparation.
- Jin et al. [2020] W. Jin, M. Fatehi, K. Abhishek, M. Mallya, B. Toyota, and G. Hamarneh. Artificial intelligence in glioma imaging: challenges and advances. Journal of Neural Engineering, 17(2):21002, apr 2020. doi: 10.1088/1741-2552/ab8131.
- Jin et al. [2021a] W. Jin, J. Fan, D. Gromala, P. Pasquier, and G. Hamarneh. EUCA: the end-user-centered explainable AI framework, 2021a.
- Jin et al. [2021b] W. Jin, X. Li, and G. Hamarneh. One map does not fit all: Evaluating saliency map explanation on multi-modal medical images. CoRR, abs/2107.05047, 2021b. URL https://arxiv.org/abs/2107.05047.
- Jin et al. [2022] W. Jin, X. Li, and G. Hamarneh. Evaluating explainable AI on a multi-modal medical imaging task: Can existing algorithms fulfill clinical requirements? Proceedings of the AAAI Conference on Artificial Intelligence, 36(11):11945–11953, Jun. 2022. doi: 10.1609/aaai.v36i11.21452. URL https://ojs.aaai.org/index.php/AAAI/article/view/21452.
- Kawahara et al. [2019] J. Kawahara, S. Daneshvar, G. Argenziano, and G. Hamarneh. Seven-point checklist and skin lesion classification using multitask multimodal neural nets. IEEE Journal of Biomedical and Health Informatics, 23(2):538–546, 2019. doi: 10.1109/JBHI.2018.2824327.
- Kelly et al. [2019] C. J. Kelly, A. Karthikesalingam, M. Suleyman, G. Corrado, and D. King. Key challenges for delivering clinical impact with artificial intelligence. BMC Medicine, 17(1):195, 2019. ISSN 1741-7015. doi: 10.1186/s12916-019-1426-2. URL https://doi.org/10.1186/s12916-019-1426-2.
- Kim et al. [2018] B. Kim, M. Wattenberg, J. Gilmer, C. Cai, J. Wexler, F. Viegas, and R. sayres. Interpretability beyond feature attribution: Quantitative testing with concept activation vectors (TCAV). In J. Dy and A. Krause, editors, Proceedings of the 35th International Conference on Machine Learning, volume 80 of Proceedings of Machine Learning Research, pages 2668–2677. PMLR, 10–15 Jul 2018. URL http://proceedings.mlr.press/v80/kim18d.html.
- Kim et al. [2021] S. Kim, B. Kim, and H. Park. Synthesis of brain tumor multicontrast MR images for improved data augmentation. Medical Physics, Mar. 2021. doi: 10.1002/mp.14701. URL https://doi.org/10.1002/mp.14701.
- Krippendorff [2004] K. Krippendorff. Content analysis : an introduction to its methodology. Sage, Thousand Oaks, Calif, 2004. ISBN 0761915451.
- Lagioia [2020] G. Lagioia, Francesca;Sartor. The impact of the General Data Protection Regulation (GDPR) on artificial intelligence. 2020. doi: 10.2861/293. URL http://www.europarl.europa.eu/thinktank.
- Lansberg et al. [2000] M. G. Lansberg, G. W. Albers, C. Beaulieu, and M. P. Marks. Comparison of diffusion-weighted MRI and CT in acute stroke. Neurology, 54(8):1557–1561, Apr. 2000. doi: 10.1212/wnl.54.8.1557. URL https://doi.org/10.1212/wnl.54.8.1557.
- Li et al. [2020] X. Li, Y. Zhou, N. C. Dvornek, Y. Gu, P. Ventola, and J. S. Duncan. Efficient shapley explanation for features importance estimation under uncertainty. In A. L. Martel, P. Abolmaesumi, D. Stoyanov, D. Mateus, M. A. Zuluaga, S. K. Zhou, D. Racoceanu, and L. Joskowicz, editors, Medical Image Computing and Computer Assisted Intervention – MICCAI 2020, pages 792–801, Cham, 2020. Springer International Publishing. ISBN 978-3-030-59710-8.
- Long et al. [2020] R. K. M. Long, K. P. Moriarty, B. Cardoen, G. Gao, A. W. Vogl, F. Jean, G. Hamarneh, and I. R. Nabi. Super resolution microscopy and deep learning identify zika virus reorganization of the endoplasmic reticulum. Scientific Reports, 10(1), Dec. 2020. doi: 10.1038/s41598-020-77170-3. URL https://doi.org/10.1038/s41598-020-77170-3.
- Lundberg and Lee [2017] S. M. Lundberg and S.-I. Lee. A unified approach to interpreting model predictions. In I. Guyon, U. V. Luxburg, S. Bengio, H. Wallach, R. Fergus, S. Vishwanathan, and R. Garnett, editors, Advances in Neural Information Processing Systems, volume 30. Curran Associates, Inc., 2017. URL https://proceedings.neurips.cc/paper/2017/file/8a20a8621978632d76c43dfd28b67767-Paper.pdf.
- Lundberg et al. [2020] S. M. Lundberg, G. Erion, H. Chen, A. DeGrave, J. M. Prutkin, B. Nair, R. Katz, J. Himmelfarb, N. Bansal, and S.-I. Lee. From local explanations to global understanding with explainable AI for trees. Nature Machine Intelligence, 2(1):56–67, Jan. 2020. doi: 10.1038/s42256-019-0138-9. URL https://doi.org/10.1038/s42256-019-0138-9.
- Mann and Whitney [1947] H. B. Mann and D. R. Whitney. On a test of whether one of two random variables is stochastically larger than the other. The Annals of Mathematical Statistics, 18(1):50–60, 1947. ISSN 00034851. URL http://www.jstor.org/stable/2236101.
- Martí-Bonmatí et al. [2010] L. Martí-Bonmatí, R. Sopena, P. Bartumeus, and P. Sopena. Multimodality imaging techniques. Contrast Media & Molecular Imaging, 5(4):180–189, July 2010. doi: 10.1002/cmmi.393. URL https://doi.org/10.1002/cmmi.393.
- Masic et al. [2008] I. Masic, M. Miokovic, and B. Muhamedagic. Evidence based medicine - new approaches and challenges. Acta Informatica Medica, 16(4):219, 2008. doi: 10.5455/aim.2008.16.219-225. URL https://doi.org/10.5455/aim.2008.16.219-225.
- Mohan et al. [2020] B. P. Mohan, A. Facciorusso, S. R. Khan, S. Chandan, L. L. Kassab, P. Gkolfakis, G. Tziatzios, K. Triantafyllou, and D. G. Adler. Real-time computer aided colonoscopy versus standard colonoscopy for improving adenoma detection rate: A meta-analysis of randomized-controlled trials. EClinicalMedicine, 29-30:100622, Dec. 2020. doi: 10.1016/j.eclinm.2020.100622. URL https://doi.org/10.1016/j.eclinm.2020.100622.
- Mohseni et al. [2021] S. Mohseni, N. Zarei, and E. D. Ragan. A multidisciplinary survey and framework for design and evaluation of explainable ai systems. ACM Trans. Interact. Intell. Syst., 11(3–4), Aug. 2021. ISSN 2160-6455. doi: 10.1145/3387166. URL https://doi.org/10.1145/3387166.
- Nan et al. [2022] Y. Nan, J. D. Ser, S. Walsh, C. Schönlieb, M. Roberts, I. Selby, K. Howard, J. Owen, J. Neville, J. Guiot, B. Ernst, A. Pastor, A. Alberich-Bayarri, M. I. Menzel, S. Walsh, W. Vos, N. Flerin, J.-P. Charbonnier, E. van Rikxoort, A. Chatterjee, H. Woodruff, P. Lambin, L. Cerdá-Alberich, L. Martí-Bonmatí, F. Herrera, and G. Yang. Data harmonisation for information fusion in digital healthcare: A state-of-the-art systematic review, meta-analysis and future research directions. Information Fusion, 82:99–122, 2022. ISSN 1566-2535. doi: https://doi.org/10.1016/j.inffus.2022.01.001. URL https://www.sciencedirect.com/science/article/pii/S156625352200015X.
- Olah et al. [2017] C. Olah, A. Mordvintsev, and L. Schubert. Feature visualization. Distill, 2(11), Nov. 2017. doi: 10.23915/distill.00007. URL https://doi.org/10.23915/distill.00007.
- Patel et al. [2016] A. Patel, C. Silverberg, D. Becker-Weidman, C. Roth, and S. Deshmukh. Understanding body MRI sequences and their ability to characterize tissues. Universal Journal of Medical Science, 4(1):1–9, Jan. 2016. doi: 10.13189/ujmsj.2016.040101. URL https://doi.org/10.13189/ujmsj.2016.040101.
- Patro et al. [2019] B. N. Patro, M. Lunayach, S. Patel, and V. P. Namboodiri. U-cam: Visual explanation using uncertainty based class activation maps. In Proceedings of the IEEE/CVF International Conference on Computer Vision (ICCV), October 2019.
- Pereira et al. [2018] S. Pereira, R. Meier, R. McKinley, R. Wiest, V. Alves, C. A. Silva, and M. Reyes. Enhancing interpretability of automatically extracted machine learning features: application to a rbm-random forest system on brain lesion segmentation. Medical Image Analysis, 44:228–244, 2018. ISSN 1361-8415. doi: https://doi.org/10.1016/j.media.2017.12.009. URL https://www.sciencedirect.com/science/article/pii/S1361841517301901.
- Rajpurkar et al. [2022] P. Rajpurkar, E. Chen, O. Banerjee, and E. J. Topol. AI in health and medicine. Nature Medicine, 28(1):31–38, Jan. 2022. doi: 10.1038/s41591-021-01614-0. URL https://doi.org/10.1038/s41591-021-01614-0.
- Ray [2017] K. Ray. Modelling human stomach development with gastric organoids. Nature Reviews Gastroenterology & Hepatology, 14(2):68–68, Jan. 2017. doi: 10.1038/nrgastro.2017.4. URL https://doi.org/10.1038/nrgastro.2017.4.
- Ren et al. [2021] J. Ren, Z. Zhou, Q. Chen, and Q. Zhang. Learning baseline values for shapley values. CoRR, abs/2105.10719, 2021. URL https://arxiv.org/abs/2105.10719.
- Ribeiro et al. [2016] M. T. Ribeiro, S. Singh, and C. Guestrin. ”Why Should I Trust You?”: Explaining the Predictions of Any Classifier. In Proceedings of the 22nd ACM SIGKDD International Conference on Knowledge Discovery and Data Mining - KDD ’16, pages 1135–1144, New York, New York, USA, 2016. ACM Press. ISBN 9781450342322. doi: 10.1145/2939672.2939778. URL http://dl.acm.org/citation.cfm?doid=2939672.2939778.
- Rosas and Smet [2009] H. G. Rosas and A. A. D. Smet. Magnetic resonance imaging of the meniscus. Topics in Magnetic Resonance Imaging, 20(3):151–173, June 2009. doi: 10.1097/rmr.0b013e3181d657d1. URL https://doi.org/10.1097/rmr.0b013e3181d657d1.
- Rudin [2019] C. Rudin. Stop explaining black box machine learning models for high stakes decisions and use interpretable models instead. Nature Machine Intelligence, 1(5):206–215, May 2019. doi: 10.1038/s42256-019-0048-x. URL https://doi.org/10.1038/s42256-019-0048-x.
- Sackett et al. [1996] D. L. Sackett, W. M. C. Rosenberg, J. A. M. Gray, R. B. Haynes, and W. S. Richardson. Evidence based medicine: what it is and what it isn’t. BMJ, 312(7023):71–72, 1996. ISSN 0959-8138. doi: 10.1136/bmj.312.7023.71. URL https://www.bmj.com/content/312/7023/71.
- Samek et al. [2017] W. Samek, A. Binder, G. Montavon, S. Lapuschkin, and K. Müller. Evaluating the visualization of what a deep neural network has learned. IEEE Transactions on Neural Networks and Learning Systems, 28(11):2660–2673, 2017. doi: 10.1109/TNNLS.2016.2599820.
- Saporta et al. [2021] A. Saporta, X. Gui, A. Agrawal, A. Pareek, S. Q. Truong, C. D. Nguyen, V.-D. Ngo, J. Seekins, F. G. Blankenberg, A. Y. Ng, M. P. Lungren, and P. Rajpurkar. Deep learning saliency maps do not accurately highlight diagnostically relevant regions for medical image interpretation. medRxiv, 2021. doi: 10.1101/2021.02.28.21252634. URL https://www.medrxiv.org/content/early/2021/03/02/2021.02.28.21252634.
- Selvaraju et al. [2017] R. R. Selvaraju, M. Cogswell, A. Das, R. Vedantam, D. Parikh, and D. Batra. Grad-cam: Visual explanations from deep networks via gradient-based localization. In 2017 IEEE International Conference on Computer Vision (ICCV), pages 618–626, 2017. doi: 10.1109/ICCV.2017.74.
- Shapley [1951] L. S. Shapley. Notes on the n-Person Game – II: The Value of an n-Person Game. RAND Corporation, Santa Monica, CA, 1951.
- Shrikumar et al. [2017a] A. Shrikumar, P. Greenside, and A. Kundaje. Learning important features through propagating activation differences. In Proceedings of the 34th International Conference on Machine Learning - Volume 70, ICML’17, page 3145–3153. JMLR.org, 2017a.
- Shrikumar et al. [2017b] A. Shrikumar, P. Greenside, A. Shcherbina, and A. Kundaje. Not just a black box: Learning important features through propagating activation differences, 2017b.
- Simonyan and Zisserman [2015] K. Simonyan and A. Zisserman. Very deep convolutional networks for large-scale image recognition. In Y. Bengio and Y. LeCun, editors, 3rd International Conference on Learning Representations, ICLR 2015, San Diego, CA, USA, May 7-9, 2015, Conference Track Proceedings, 2015. URL http://arxiv.org/abs/1409.1556.
- Simonyan et al. [2014] K. Simonyan, A. Vedaldi, and A. Zisserman. Deep inside convolutional networks: Visualising image classification models and saliency maps, 2014.
- Singh et al. [2020a] A. Singh, S. Sengupta, J. B. J., A. R. Mohammed, I. Faruq, V. Jayakumar, J. Zelek, and V. Lakshminarayanan. What is the optimal attribution method for explainable ophthalmic disease classification? In H. Fu, M. K. Garvin, T. MacGillivray, Y. Xu, and Y. Zheng, editors, Ophthalmic Medical Image Analysis, pages 21–31, Cham, 2020a. Springer International Publishing. ISBN 978-3-030-63419-3.
- Singh et al. [2020b] A. Singh, S. Sengupta, and V. Lakshminarayanan. Explainable deep learning models in medical image analysis. Journal of Imaging, 6(6):52, June 2020b. doi: 10.3390/jimaging6060052. URL https://doi.org/10.3390/jimaging6060052.
- Slack et al. [2021] D. Slack, A. Hilgard, S. Singh, and H. Lakkaraju. Reliable post hoc explanations: Modeling uncertainty in explainability. In M. Ranzato, A. Beygelzimer, Y. Dauphin, P. Liang, and J. W. Vaughan, editors, Advances in Neural Information Processing Systems, volume 34, pages 9391–9404. Curran Associates, Inc., 2021. URL https://proceedings.neurips.cc/paper/2021/file/4e246a381baf2ce038b3b0f82c7d6fb4-Paper.pdf.
- Smilkov et al. [2017] D. Smilkov, N. Thorat, B. Kim, F. Viégas, and M. Wattenberg. Smoothgrad: removing noise by adding noise, 2017.
- Sokol and Flach [2020] K. Sokol and P. Flach. Explainability fact sheets: A framework for systematic assessment of explainable approaches. FAT* 2020 - Proceedings of the 2020 Conference on Fairness, Accountability, and Transparency, pages 56–67, 2020. doi: 10.1145/3351095.3372870.
- Song et al. [2013] Y. Song, D. Treanor, A. Bulpitt, and D. Magee. 3d reconstruction of multiple stained histology images. Journal of Pathology Informatics, 4(2):7, 2013. doi: 10.4103/2153-3539.109864. URL https://doi.org/10.4103/2153-3539.109864.
- Springenberg et al. [2015] J. T. Springenberg, A. Dosovitskiy, T. Brox, and M. Riedmiller. Striving for simplicity: The all convolutional net, 2015.
- Sundararajan et al. [2017] M. Sundararajan, A. Taly, and Q. Yan. Axiomatic attribution for deep networks. In Proceedings of the 34th International Conference on Machine Learning - Volume 70, ICML’17, page 3319–3328. JMLR.org, 2017.
- Taghanaki et al. [2019] S. A. Taghanaki, M. Havaei, T. Berthier, F. Dutil, L. Di Jorio, G. Hamarneh, and Y. Bengio. Infomask: Masked variational latent representation to localize chest disease. In D. Shen, T. Liu, T. M. Peters, L. H. Staib, C. Essert, S. Zhou, P.-T. Yap, and A. Khan, editors, Medical Image Computing and Computer Assisted Intervention – MICCAI 2019, pages 739–747, Cham, 2019. Springer International Publishing. ISBN 978-3-030-32226-7.
- Topaloglu et al. [2021] M. Y. Topaloglu, E. M. Morrell, S. Rajendran, and U. Topaloglu. In the pursuit of privacy: The promises and predicaments of federated learning in healthcare. Frontiers in Artificial Intelligence, 4, 2021. ISSN 2624-8212. doi: 10.3389/frai.2021.746497. URL https://www.frontiersin.org/article/10.3389/frai.2021.746497.
- Topol [2019] E. J. Topol. High-performance medicine: the convergence of human and artificial intelligence. Nature Medicine, 25(1):44–56, 2019. ISSN 1546-170X. doi: 10.1038/s41591-018-0300-7. URL https://doi.org/10.1038/s41591-018-0300-7.
- Vilone and Longo [2021] G. Vilone and L. Longo. Notions of explainability and evaluation approaches for explainable artificial intelligence. Information Fusion, 76:89–106, 2021. ISSN 1566-2535. doi: https://doi.org/10.1016/j.inffus.2021.05.009. URL https://www.sciencedirect.com/science/article/pii/S1566253521001093.
- Viviano et al. [2021] J. D. Viviano, B. Simpson, F. Dutil, Y. Bengio, and J. P. Cohen. Saliency is a possible red herring when diagnosing poor generalization. In International Conference on Learning Representations, 2021. URL https://openreview.net/forum?id=c9-WeM-ceB.
- Wang et al. [2021] D. Wang, L. Wang, Z. Zhang, D. Wang, H. Zhu, Y. Gao, X. Fan, and F. Tian. ”brilliant ai doctor” in rural china: Tensions and challenges in ai-powered cdss deployment. 2021. doi: 10.1145/3411764.3445432.
- Woo et al. [2017] C.-W. Woo, L. J. Chang, M. A. Lindquist, and T. D. Wager. Building better biomarkers: brain models in translational neuroimaging. Nature Neuroscience, 20(3):365–377, Feb. 2017. doi: 10.1038/nn.4478. URL https://doi.org/10.1038/nn.4478.
- Wu et al. [2019] M. Wu, X. Zhong, Q. Peng, M. Xu, S. Huang, J. Yuan, J. Ma, and T. Tan. Prediction of molecular subtypes of breast cancer using BI-RADS features based on a “white box” machine learning approach in a multi-modal imaging setting. European Journal of Radiology, 114:175–184, may 2019. URL https://www-sciencedirect-com.proxy.lib.sfu.ca/science/article/pii/S0720048X1930110X{#}fig0005http://www.ncbi.nlm.nih.gov/pubmed/31005170https://linkinghub.elsevier.com/retrieve/pii/S0720048X1930110X.
- Xu [2019] Y. Xu. Deep learning in multimodal medical image analysis. In H. Wang, S. Siuly, R. Zhou, F. Martin-Sanchez, Y. Zhang, and Z. Huang, editors, Health Information Science, pages 193–200, Cham, 2019. Springer International Publishing. ISBN 978-3-030-32962-4.
- Yang et al. [2022] G. Yang, Q. Ye, and J. Xia. Unbox the black-box for the medical explainable ai via multi-modal and multi-centre data fusion: A mini-review, two showcases and beyond. Information Fusion, 77:29–52, 2022. ISSN 1566-2535. doi: https://doi.org/10.1016/j.inffus.2021.07.016. URL https://www.sciencedirect.com/science/article/pii/S1566253521001597.
- Ye et al. [2022] Q. Ye, Y. Gao, W. Ding, Z. Niu, C. Wang, Y. Jiang, M. Wang, E. F. Fang, W. Menpes-Smith, J. Xia, and G. Yang. Robust weakly supervised learning for covid-19 recognition using multi-center ct images. Applied Soft Computing, 116:108291, 2022. ISSN 1568-4946. doi: https://doi.org/10.1016/j.asoc.2021.108291. URL https://www.sciencedirect.com/science/article/pii/S1568494621010966.
- Yeh et al. [2019] C.-K. Yeh, C.-Y. Hsieh, A. Suggala, D. I. Inouye, and P. K. Ravikumar. On the (in)fidelity and sensitivity of explanations. In H. Wallach, H. Larochelle, A. Beygelzimer, F. d'Alché-Buc, E. Fox, and R. Garnett, editors, Advances in Neural Information Processing Systems, volume 32. Curran Associates, Inc., 2019. URL https://proceedings.neurips.cc/paper/2019/file/a7471fdc77b3435276507cc8f2dc2569-Paper.pdf.
- Yin et al. [2021] F. Yin, Z. Shi, C. Hsieh, and K. Chang. On the faithfulness measurements for model interpretations. CoRR, abs/2104.08782, 2021. URL https://arxiv.org/abs/2104.08782.
- Zeiler and Fergus [2014] M. D. Zeiler and R. Fergus. Visualizing and understanding convolutional networks. In D. Fleet, T. Pajdla, B. Schiele, and T. Tuytelaars, editors, Computer Vision – ECCV 2014, pages 818–833, Cham, 2014. Springer International Publishing. ISBN 978-3-319-10590-1.
- Zhang and Zhu [2018] Q. Zhang and S. Zhu. Visual Interpretability for Deep Learning: a Survey. Frontiers of Information Technology and Electronic Engineering, 19(1):27–39, feb 2018. ISSN 20959230. doi: 10.1631/FITEE.1700808. URL https://arxiv.org/abs/1802.00614.
- Zhang et al. [2020] Y. Zhang, Q. Vera Liao, and R. K. Bellamy. Efect of confidence and explanation on accuracy and trust calibration in AI-assisted decision making. FAT* 2020 - Proceedings of the 2020 Conference on Fairness, Accountability, and Transparency, pages 295–305, 2020. doi: 10.1145/3351095.3372852.
- Zhang et al. [2019] Z. Zhang, P. Chen, M. McGough, F. Xing, C. Wang, M. Bui, Y. Xie, M. Sapkota, L. Cui, J. Dhillon, N. Ahmad, F. K. Khalil, S. I. Dickinson, X. Shi, F. Liu, H. Su, J. Cai, and L. Yang. Pathologist-level interpretable whole-slide cancer diagnosis with deep learning. Nature Machine Intelligence, 1(5):236–245, May 2019. doi: 10.1038/s42256-019-0052-1. URL https://doi.org/10.1038/s42256-019-0052-1.
- Zherebtsov et al. [2019] E. Zherebtsov, V. Dremin, A. Popov, A. Doronin, D. Kurakina, M. Kirillin, I. Meglinski, and A. Bykov. Hyperspectral imaging of human skin aided by artificial neural networks. Biomedical Optics Express, 10(7):3545, June 2019. doi: 10.1364/boe.10.003545. URL https://doi.org/10.1364/boe.10.003545.
- Zhou et al. [2021] Y. Zhou, S. Booth, M. T. Ribeiro, and J. Shah. Do feature attribution methods correctly attribute features? CoRR, abs/2104.14403, 2021. URL https://arxiv.org/abs/2104.14403.
- Zintgraf et al. [2017] L. M. Zintgraf, T. S. Cohen, T. Adel, and M. Welling. Visualizing deep neural network decisions: Prediction difference analysis. In 5th International Conference on Learning Representations, ICLR 2017, Toulon, France, April 24-26, 2017, Conference Track Proceedings. OpenReview.net, 2017. URL https://openreview.net/forum?id=BJ5UeU9xx.