Various Activities above Sunspot Light Bridges in IRIS Observations: Classification and Comparison
Abstract
Light bridges (LBs) are among the most striking sub-structures in sunspots, where various activities have been revealed by recent high-resolution observations from the Interface Region Imaging Spectrograph (IRIS). According to the variety of physical properties, we classified these activities into four distinct categories: transient brightening (TB), intermittent jet (IJ), type-I light wall (LW-I), and type-II light wall (LW-II). In IRIS 1400/1330 Å observations, TBs are characterized by abrupt emission enhancements, and IJs appear as collimated plasma ejections with a width of 1–2 Mm at some LB sites. Most observed TBs are associated with IJs and show superpositions of some chromosphere absorption lines on enhanced and broadened wings of C ii and Si iv lines, which could be driven by intermittent magnetic reconnection in the lower atmosphere. LW-I and LW-II are wall-shaped structures with bright fronts above the whole LB. An LW-I has a continuous oscillating front with a typical height of several Mm and an almost stationary period of 4–5 minutes. On the contrary, an LW-II has a indented front with a height of over 10 Mm, which has no stable period and is accompanied by recurrent TBs in the entire LB. These results support that LW-IIs are driven by frequent reconnection occurring along the whole LB due to large-scale magnetic flux emergence or intrusion, rather than the leakage of waves producing LW-Is. Our observations reveal a highly dynamical scenario of activities above LBs driven by different basic physical processes, including magneto-convection, magnetic reconnection, and wave leakage.
1 Introduction
Sunspots are the most prominent magnetic features on the Sun, which is the only star close enough to be currently observed by humans in great detail (Thomas & Weiss, 2004). As manifestations of solar magnetic field concentrations, sunspots appear dark in solar photospheric observations because the strong magnetic fields they contain inhibit the normal convective energy transport from the solar interior to the surface (Solanki, 2003; Borrero & Ichimoto, 2011). In a typical sunspot, there are an inner dark umbra and an outer less dark filamentary penumbra. It is commonly accepted that the magnetic fields are almost vertical at the center umbra of a sunspot and become more inclined in the surrounding penumbra (Thomas et al., 2002). In actual observations, besides the large-scale difference between the umbra and penumbra, conditions of magnetic field and convection (thus the brightness and temperature) also change at many sub-structures of sunspots with relatively smaller scales (Solanki, 2003). For example, in some sunspots, bright elongated features are detected to penetrate into the dark umbra, and strong ones can even cross the umbra completely. These features are known as light bridges (LBs) and are among the most striking sub-structures in sunspots (Beckers & Schröter, 1969; Muller, 1979; Sobotka et al., 1994; Leka, 1997).
In high-resolution photospheric observations, sunspot LBs are usually composed of some bright “grains” separated by a central dark lane along the LB axis and narrow transverse intergranular dark lanes (Berger & Berdyugina, 2003; Zhang et al., 2018). In addition, Lites et al. (2004) found that some LBs do not always exhibit these segmented bright grains but show elongated filamentary structures along the length of the bridge, near whose edges small-scale barb-like features are often detected (Rimmele, 2008; Louis et al., 2008; Schlichenmaier et al., 2016; Yang et al., 2019a; Hou et al., 2020). It is widely accepted that compared with the surrounding umbra, LBs have generally weaker and more inclined magnetic fields (Beckers & Schröter, 1969; Rueedi et al., 1995; Leka, 1997). In addition, weakly twisted and emerging magnetic fields were also found in LBs (Louis et al., 2015; Toriumi et al., 2015a, b; Yuan & Walsh, 2016; Lim et al., 2020). In a 3D frame, forced by the intrusion of hot and weakly magnetized plasma, the umbral magnetic fields around the LB form a magnetic canopy extending from both sides of the LB and merging at the top (Spruit & Scharmer, 2006; Jurčák et al., 2006; Lagg et al., 2014; Felipe et al., 2016). Analyzing spectral properties of a sample of 60 LBs observed with the Interface Region Imaging Spectrograph (IRIS; De Pontieu et al., 2014), Rezaei (2018) found that LBs are multi-thermal, dynamic, and coherent structures extending up to the transition region, where diverse heating mechanisms operate in different layers.
Regarding the LB formation, Schlichenmaier et al. (2010) and Rezaei et al. (2012) witnessed the formation of a thick LB within a sunspot caused by coalescence of two pores with the same magnetic polarity (Garcia de La Rosa, 1987; Berger & Berdyugina, 2003). LBs can also form through the rapid intrusion of sunspot penumbral filaments into the umbra, accompanied by many umbral dots emerging from the leading edges of the filaments (Katsukawa et al., 2007; Li et al., 2021b). It is worth noting that within the special delta-type sunspot, the collision of two rotating umbrae of opposite polarities can produce a delta-spot LB with very strong and sheared horizontal magnetic fields (Zirin & Wang, 1993; Livingston et al., 2006; Okamoto & Sakurai, 2018; Toriumi & Hotta, 2019; Castellanos Durán et al., 2020).
It is obvious that the LB is a special sub-structure within a sunspot, where the magnetic field and convection conditions greatly deviate from the ambient sunspot background. Such divergence provides a favorable environment for various dynamic activities, e.g., brightenings in ultraviolet (UV), G-band, and Ca ii H channels (Berger & Berdyugina, 2003; Louis et al., 2008; Toriumi et al., 2015b; Felipe et al., 2017; Hou et al., 2020); and jets or surges (Roy, 1973; Asai et al., 2001; Shimizu et al., 2009; Louis et al., 2014; Robustini et al., 2016; Yang et al., 2019a). Based on high-resolution observations from the Hinode, Louis et al. (2014) observed small-scale short-lived chromospheric jets above a sunspot LB, where the magnetic field orientation sharply changes. It is already firmly established that this type of activities are produced by magnetic reconnection between small-scale magnetic structures emerging in the LB and nearby umbral magnetic fields (Shimizu et al., 2009; Robustini et al., 2016; Toriumi et al., 2015b; Tian et al., 2018; Yang et al., 2019b). Transient brightenings are usually detected around footpoints of these jets, and intermittency is a characteristic property of these two types of activities.
In addition, recent observations from the IRIS revealed another type of bright wall-shaped structure above sunspot LBs. Their most prominent feature is the coherently oscillating bright front in the IRIS 1400/1330 Å channel. These structures are called light walls (LWs) and are interpreted as the result of upward shocked p-mode waves leaked from the sub-photosphere (Yang et al., 2015; Bharti, 2015; Zhang et al., 2017; Hou et al., 2017). It has also been found that external disturbances, such as flares, could change the amplitudes of LW oscillations (Hou et al., 2016a; Yang et al., 2016, 2017). More recently, Li et al. (2021a) reported small-scale bright blobs ejected from an oscillating bright front above an LB, which together with other earlier reported activities, exposes a highly dynamical scenario of sunspot LBs.
Although part of the various activities above sunspot LBs have been deeply investigated, due to the limitation of previous observation condition and the lack of comparative studies, several open questions still remain: How many types of activities could appear above sunspot LBs? What are the differences between these activities? How one type of activity is linked to another one? What is the frequency distribution of these different activities? Insights into these questions are necessary to understand the essential physical processes shaping the sunspot LB dynamics and call for a comprehensive and comparative investigation on the different types of activities above sunspot LBs. In this paper, we collate these activities and analyze their different properties mainly based on the IRIS observations for a complete understanding of the dynamics of sunspot LBs. We report a new type of activity above LBs, which together with other activities reported previously are classified into four distinct categories. Furthermore, a detailed comparative study of these activities are carried out for the first time.
2 Observations and data analysis
In this work, we mainly analyzed IRIS and Solar Dynamics Observatory (SDO; Pesnell et al., 2012) observations over four days: 2019 May 12, 2015 January 11, 2014 October 25, and 2014 October 28. The detailed information is summarized in Table 1. Different types of activities above sunspot LBs are shown and compared through these observations. In addition, IRIS 1400/1330 Å observations of sunspots in the whole year of 2014 were checked to investigate frequency distributions of the different activities.
| Date | Time (UT) | Telescope | IRIS Pointing (x,y) | Passbands & Data products | Cadence | Pixel size | Figures |
|---|---|---|---|---|---|---|---|
| 2019 May 12 | 13:54–15:21 | IRIS | (-91″, 134″) | 1400, 2796 Å | 65 s | 0.″33 | 1 |
| Raster (Very large dense 320-step) | 16.2 s | 0.″35 | 1, 5, 6 | ||||
| SDO/AIA | / | 1700 Å | 24 s | 0.″6 | 1 | ||
| 171, 94 Å | 12 s | 0.″6 | 1 | ||||
| SDO/HMI | / | SHARP vector magnetic field | 720 s | 0.″5 | 10 | ||
| 18:29–19:28 | IRIS | (-39″, 141″) | 1400, 2796 Å | 18 s | 0.″33 | 1 | |
| SDO/AIA | / | 1700 Å | 24 s | 0.″6 | 1 | ||
| 171, 94 Å | 12 s | 0.″6 | 1 | ||||
| 2015 Jan 11 | 03:34–04:19 | IRIS | (-632″, -218″) | 1400, 2796, 2832 Å | 38 s | 0.″17 | 2, 8 |
| Raster (Dense synoptic) | 9.5 s | 0.″35 | 2, 5, 6 | ||||
| SDO/AIA | / | 1700 Å | 24 s | 0.″6 | 2 | ||
| 171, 94 Å | 12 s | 0.″6 | 2 | ||||
| SDO/HMI | / | LOS magnetogram | 45 s | 0.″5 | 8 | ||
| SHARP vector magnetic field | 720 s | 0.″5 | 10 | ||||
| 11:41–12:36 | IRIS | (-611″, -239″) | 1400, 2796, 2832 Å | 20 s | 0.″33 | 4, 8 | |
| SDO/AIA | / | 1700 Å | 24 s | 0.″6 | 4 | ||
| 171, 94 Å | 12 s | 0.″6 | 4 | ||||
| SDO/HMI | / | LOS magnetogram | 45 s | 0.″5 | 8 | ||
| SHARP vector magnetic field | 720 s | 0.″5 | 10 | ||||
| 2014 Oct 25 | 05:17–06:30 | IRIS | (257″, -318″) | 1400 Å | 7 s | 0.″17 | 3 |
| SDO/AIA | / | 1700 Å | 24 s | 0.″6 | 3 | ||
| 171, 94 Å | 12 s | 0.″6 | 3 | ||||
| SDO/HMI | / | LOS magnetogram | 45 s | 0.″5 | 3 | ||
| SHARP vector magnetic field | 720 s | 0.″5 | 10 | ||||
| 2014 Oct 28 | 08:20–09:11 | IRIS | (787″, -316″) | 1400 Å | 39 s | 0.″17 | 7 |
| Raster (Large sparse 4-step) | 9.7 s | 1.″0 | 7 | ||||
| 22:16–22:58 | IRIS | (852″, -308″) | 1400, 2796 Å | 39 s | 0.″17 | 9 | |
| SDO/AIA | / | 1700 Å | 24 s | 0.″6 | 9 | ||
| SDO/HMI | / | Continuum intensity | 45 s | 0.″5 | 9 | ||
| SHARP vector magnetic field | 720 s | 0.″5 | 10 |
The IRIS was pointed at AR 12741 on 2019 May 12, AR 12259 on 2015 January 11, AR 12192 on 2014 October 25 and 28. Various activities above the sunspot LBs of these ARs are clearly visible from the high-quality IRIS observations. Here we used Level 2 IRIS data, including the slit-jaw images (SJIs) of 1400 Å, 2796 Å, and 2832 Å passbands. The emission of the 1400 Å channel mainly comes from the Si iv 1394 Å and 1403 Å lines formed in the transition region (80,000 K) and the UV continuum emissions from the lower chromosphere. The 2796 Å filter is dominated by the Mg ii k 2796 Å line that is formed in the upper chromosphere at a temperature of 10,000 K. The 2832 Å passband samples the wing of Mg ii 2830 Å emissions in the upper photosphere. In addition, the IRIS spectra in different windows were analyzed when the IRIS slit crossed the features of interest.
We also used observations from the Atmospheric Imaging Assembly (AIA; Lemen et al., 2012) and Helioseismic and Magnetic Imager (HMI; Schou et al., 2012) on board the SDO. The AIA successively takes images of the solar atmosphere in seven extreme ultraviolet (EUV) channels and three UV and visible channels. The HMI offers full-disk line-of-sight (LOS) magnetograms, continuum intensitygrams, and photospheric vector magnetograms. Here, we analyzed the AIA 1700 Å, 171 Å, and 94 Å images as well as the HMI LOS magnetograms, continuum intensitygrams, and vector magnetic field data product called Space-weather HMI Active Region Patches (SHARP; Bobra et al., 2014). The 1700 Å filter mainly samples the UV continuum emission formed around the temperature minimum region (TMR). The 171 Å and 94 Å passbands are dominated by the Fe ix 171.07 Å line formed at a temperature of 700,000 K and the Fe xviii 93.93 Å line formed at a temperature of 7,000,000 K, respectively. The HMI continuum intensitygrams and magnetograms can depict sunspots and LBs as well as their magnetic polarity characteristics. Furthermore, the IRIS and SDO observations are carefully co-aligned by matching locations of some specific features that can be simultaneously detected in different channels.
3 Classification of Various Activities above Sunspot Light Bridges in IRIS Observations
Based on the different physical properties and dynamic evolution of the activities above sunspot LBs observed by the IRIS, we classified them into four distinct categories: transient brightening (TB), intermittent jet (IJ), type-I light wall (LW-I), and type-II light wall (LW-II). The former three have been extensively studied through recent high-resolution observations, e.g., Hinode, SDO, and IRIS observations, while the concept of LW-II is first proposed in the present work. Note that we cannot exclude the possibilities that some rare phenomena are missed due to the gap of IRIS observations or more activities would be discovered in future observations. In the following four subsections, typical events for each type of activities are shown in Figures 1–4, where their morphological, temporal, thermal, and spectral properties are described and investigated through IRIS and SDO observations. We remark that the LW-I event shown here was reported by Yang et al. (2015) and Bharti (2015), and the related Figure 3 is adapted from Figures 1–3 of Yang et al. (2015).
3.1 Transient Brightening (TB)
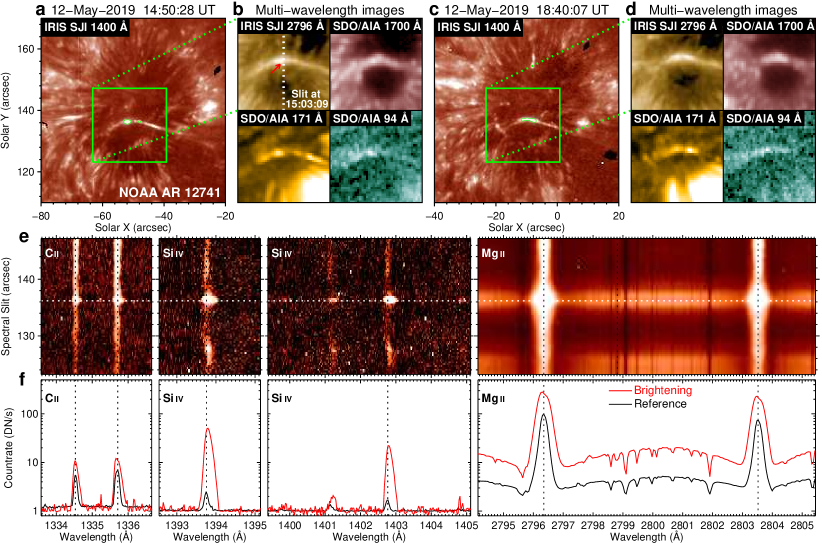
Figure 1 shows a typical event of TB in the LB of the main sunspot of NOAA AR 12741. This AR was located around the solar disk center and was observed by the IRIS several times on 2019 May 12. Here, we focus on two IRIS data sets: 13:54 UT to 15:21 UT and 18:29 UT to 19:28 UT. The associated online animation reveals that an LB crossed the main sunspot, where TBs appeared at different sites and sometimes repeatedly occurred at the same location. Figure 1(a) displays a remarkable TB with a spot shape (see green contour) around 14:50 UT in the IRIS 1400 Å channel. The spatial scale of this TB is approximately 1–2 Mm. Signatures of this brightening can also be clearly identified from simultaneous IRIS 2796 Å, SDO/AIA 171 Å, and 94 Å observations (see panel (b)). Because these (E)UV filters mainly sample the emission from plasma with temperatures ranging from 10,000 to 7,000,000 K, these observations indicate that the TB is multi-thermal and that local materials could be heated to 7,000,000 K. From the animation, the brightenings could last for several minutes. Figure 1(c) shows another TB with an elongated shape (see green contour) around 18:40 UT. This TB extended along the bridge for about 3–4 Mm and lasted for several minutes in the 1400 Å and 2796 Å images. In the corresponding 171 Å and 94 Å observations, the emission strengthening could also be identified (panel (d)).
From 13:54 UT to 15:21 UT, the IRIS spectrograph slit scanned the region of interest from east to west in a very large dense 320-step mode and crossed a TB in the LB around 15:03 UT. Figure 1(e) shows the detector images of the C ii 1334.53/1335.71 Å, Si iv 1393.76/1402.77 Å, and Mg ii h&k 2796.35/2803.52 Å windows taken through the slit. The white dashed line marks the TB location, along which the profiles of UV emission lines of C ii, Si iv, and Mg ii ions are measured and exemplified by the red curves in panel (f). Additionally, we averaged the spectra within a quiet plage region around the sunspot and took the resultant profiles as reference profiles (see black curves in panel (f)). It is obvious that compared with the reference profiles, the profiles of these spectral lines measured at the TB are enhanced and broadened towards both the red and blue wings. Similar line profiles have recently been reported for transition region explosive events (Huang et al., 2014; Gupta & Tripathi, 2015; Chen et al., 2019), UV burst (Peter et al., 2014; Tian et al., 2016; Young et al., 2018), and TBs in LBs (Toriumi et al., 2015b; Tian et al., 2018; Hou et al., 2020) through IRIS observations. In these works, such spectral line profiles were interpreted as the local heating of plasma and bidirectional outflows derived from magnetic reconnection. Therefore, it is reasonable to suggest that the TBs in the LB and related enhanced and broadened line profiles shown in Figure 1 represent reconnection-related heating, which is further supported by the observational feature of intermittency described above.
Figures 1(b) and (d) show that compared with other (E)UV channels, the signatures of both TBs are much weaker in the 1700 Å channel, which samples emissions mainly from the TMR in the upper photosphere. This implies that the magnetic reconnection driving the TBs reported here might occur mainly above the TMR. Regarding the height of the reconnection, more details of the IRIS spectral observations will be presented and discussed in Section 4.
3.2 Intermittent Jet (IJ)
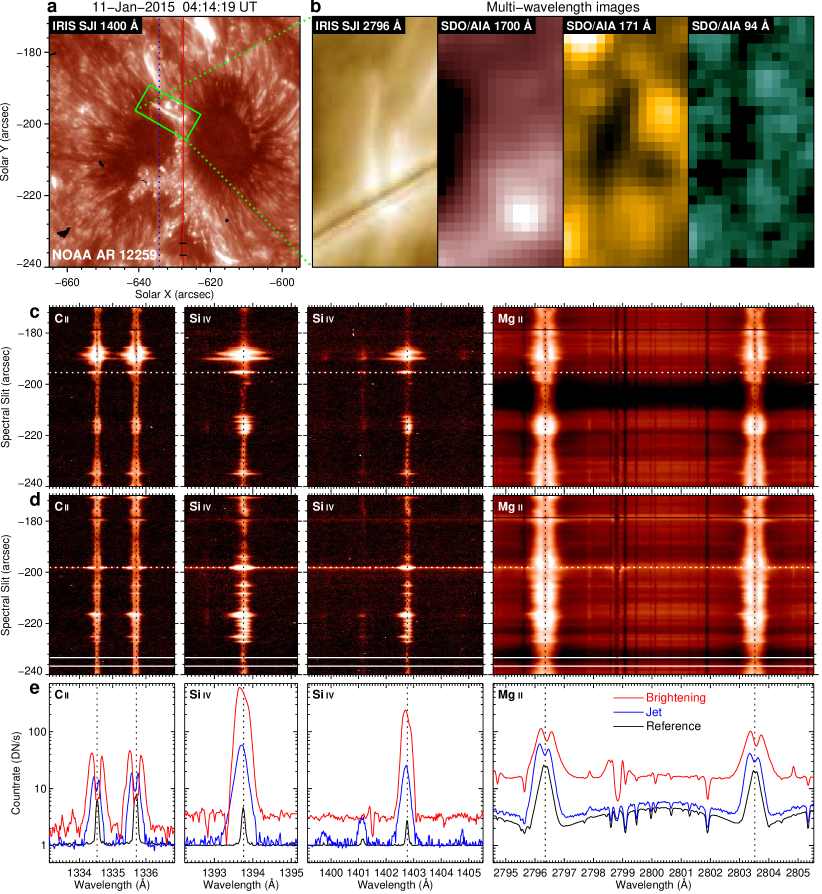
Figure 2 exhibits an example of an IJ above the LB occurring in the main sunspot of NOAA AR 12259 on 2015 January 11. The IRIS observations show that jets intermittently appeared at the north end of this LB (see the associated online animation). Figures 2(a) and (b) show an IJ around 04:14 UT in different filters. This IJ can be clearly identified in emission accompanied by a footpoint brightening with a width of about 1–2 Mm in the IRIS 1400 Å and 2796 Å images. However, in the simultaneous SDO/AIA 171 Å and 94 Å observations, this IJ was seen in absorption. This difference indicates that the IJ plasma was heated to at least 80,000 K but well below 700,000 K. We note here that the temperature of 80,000 K is only applicable under coronal ionization equilibrium and may not be used for high-density atmospheres, where the formation temperature of Si iv lines could be 15,000–20,000 K (Rutten, 2016; Toriumi et al., 2017). In addition, around the tips of the IJ, enhanced emission can be dimly seen in the 1400 Å, 171 Å, and 94 Å images, indicating local heating that is likely due to IJ-related shock fronts or compression between the IJ and overlying atmosphere. The jet footpoint brightening reported here is clearly visible in the SDO/AIA 1700 Å channel but dimly visible in the 171 Å and 94 Å observations, which is contrary to the TBs shown in Figure 1. This is possibly due to that the brightening detected here could take place in the lower atmosphere around the TMR.
From the animation, this jet reached its maximum heights of about 10 Mm within 200 s, revealing an apparent velocity of 50 km s-1. Considering the deceleration caused by the solar effective gravity or resistance from the upper atmosphere as well as the projection effect, the initial true speed of the upward jets should be much higher than 50 km s-1. Here we estimated the Alfvén speed () according to the formula , where is the magnetic field permeability of a vacuum and is the mass density. Assuming that the particle number density is of the order of 1015 cm-3 and the magnetic field strength () is 1000 Gauss in the sunspot LB near the TMR, the Alfvén speed should be 70 km s-1. The estimated Alfvén speed around the TMR is comparable to the lower limit (50 km s-1) of the initial speed of the observed IJ, which suggests the possible role of magnetic reconnection in driving the IJ reported here.
In this event, the IRIS spectrograph slit scanned the region of interest from east to west in a dense synoptic mode and crossed the IJ and compact brightening around the jet base. Similar to Figures 1(e) and (f), we show the detector images of four spectral windows for the jet and brightening in Figures 2(c) and (d) and the line profiles of both features in Figure 2(e). The black curves in panel (e) represent the reference profiles obtained through averaging the spectra within a relatively quiet region marked by the black bars in panel (a). It is shown that the profiles of UV emission lines of C ii, Si iv, and Mg ii ions sampled at the jet (blue curves) all present a distinct intensity enhancement of the blue wing, indicating excess emission contributed by moving plasma with a velocity component towards the observer. The profiles measured at the jet footpoint brightening are notably enhanced and broadened at both wings of each emission line, just like those of the TB shown in Figure 1, which represents the existence of plasma heating and bidirectional outflows.
The above-mentioned results imply that magnetic reconnection might occur in the lower atmosphere around the TMR in this event. After magnetic reconnection happened around the TMR, the released magnetic energy was converted into the thermal and kinetic energy of the local plasma, which manifested as TBs and upward IJs (seen as bright jets in the warm 2796 Å and 1400 Å channels but dark surges in the much hotter 171 Å and 94 Å channels), respectively. In addition, although not constant and stable, the typical timescale of IJs are approximately 10–20 minutes, suggesting a convective origin. Similar observations and interpretations have also been presented in recent works on the IRIS observations (Toriumi et al., 2015b; Tian et al., 2018).
3.3 Type-I Light Wall (LW-I)
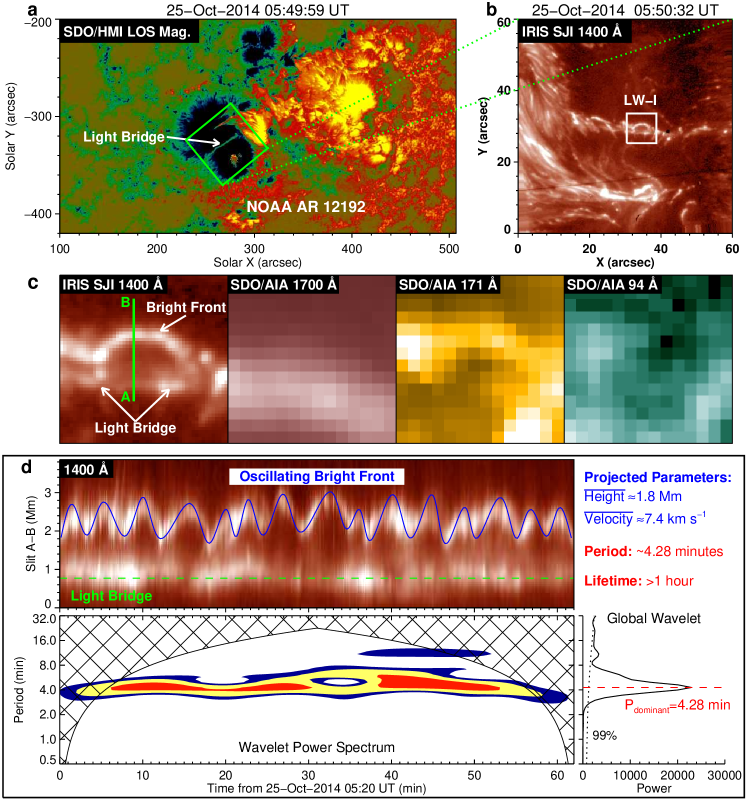
Figure 3 shows a typical LW above the sunspot LB of NOAA AR 12192 on 2014 October 25, which was also reported by Yang et al. (2015) and Bharti (2015). Panel (a) shows an overview of AR 12192, where the following sunspot with negative magnetic polarity was divided by a strong LB. The associated animation shows that this LW was rooted in the whole LB and can be seen during most of the IRIS observation period from 05:17 UT to 06:30 UT. The field of view (FOV) outlined by the green square is rotated 141° counterclockwise and extended in panels (b) and (c) to show this LW in different channels. The most prominent feature of this activity is a continuous bright oscillating front detected in the IRIS 1400 Å channel. This front is also clear in the SDO/AIA 171 Å image but invisible in the 1700 Å and 94 Å channels, suggesting heating of the front plasma to at least 700,000 K but well below 7,000,000 K. Between the front and wall base (i.e., LB), a bubble-like void forms. In addition, there are no obvious TBs around the wall base, ruling out the existence of a violent release of energy.
Unlike the intermittence of the TB and IJ shown in Figures 1 and 2, respectively, the LW has clear oscillating periods of a few minutes. In Figure 3(d), the time-distance plot reveals long-lasting (more than one hour) and continuous oscillations of the bright front, which is approximated by the blue curve. The distance between the LB and bright front was calculated as the projected height of the LW, with a mean value of about 1.6 Mm; the mean rising velocity of the front is about 7 km s-1. Based on the time-distance plot, we applied the Morlet wavelet method to the heights of the bright front to obtain a wavelet power spectrum, and found a period of about 4.28 minutes for the front oscillation.
The LW shows significant differences in many aspects compared with the reconnection-driven IJ. For example, the LW is rooted in the whole LB and has a continuous bright front, which shows well-coordinated oscillations with an almost stationary period of 4.28 minutes during a relatively long time (up to several days, as reported in Hou et al., 2016a). Moreover, no obvious TB takes place around the base of the LW. The height of the bright front is only about 1.6 Mm, and its rising velocity is 7 km s-1, which is much lower than the local Alfvén speed. These observational features support the interpretation of the LW as wave-driven activity instead of a reconnection scenario (Yang et al., 2015; Bharti, 2015; Hou et al., 2017; Tian et al., 2018). Through analyzing IRIS spectral data of an oscillating LW, Zhang et al. (2017) found that the Mg ii k 2796.35 Å line core of the LW bright front repeatedly experiences a fast excursion to the blue followed by a gradual shift to the red, indicating the nature of shock waves generated by the upward p-mode waves. A more detailed comparison between the IJ and LW is made in Section 4.4.
Based on the IRIS 1400 Å observations, Hou et al. (2016b) reported an LW with a bright front above the umbral-penumbral boundary and found that it was rooted in an emerging magnetic field with a line-like shape. The maximum of this LW was over 10 Mm, and recurrent brightenings were observed at the base of this LW, indicating that the reconnection could play a key role in driving this activity. This type of LW is distinctly different from that shown in Figure 3 here and those reported by Yang et al. (2015, 2017) and Hou et al. (2016a, 2017). In the present work, we also report such a special LW above a sunspot LB (see Figure 4 in the following subsection). To distinguish between these two types of LWs with different properties, LWs like that shown in Figure 3 are hereafter referred to as type-I LWs (LW-Is), and LWs like that shown in Figure 4 are referred to as type-II LWs (LW-IIs).
3.4 Type-II Light Wall (LW-II)
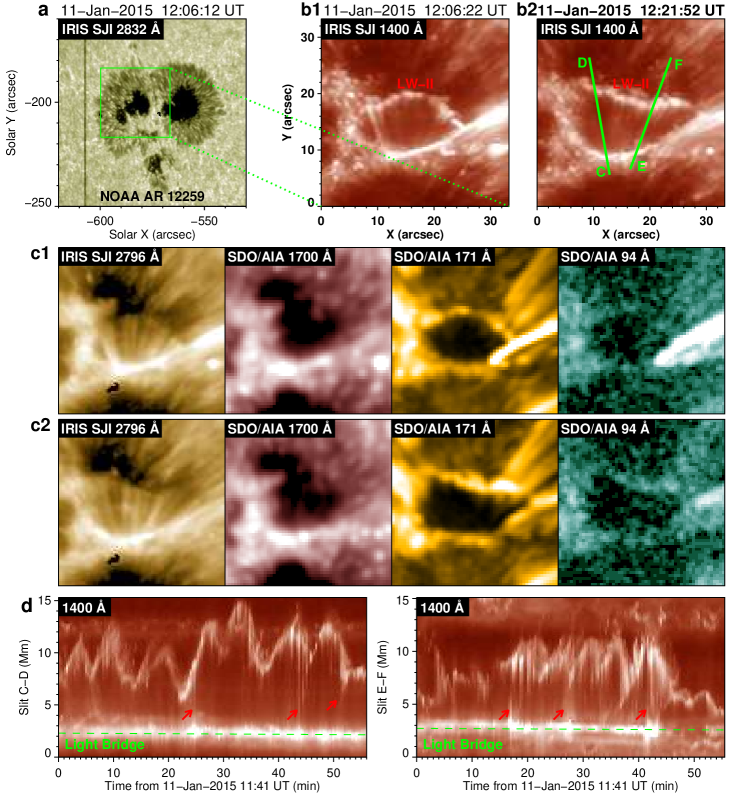
Figure 4 exhibits a type-II light wall above the sunspot LB of NOAA AR 12259 on 2015 January 11, which was also shown in Figure 2 to represent an IJ event. The associated animation reveals that this LW-II was rooted in the whole LB and had an oscillating bright front with a height of 10 Mm in the IRIS 1400 Å channel, which is broken at some sites rather than a continuous line. This LW-II went off in an ordered way as if one touches all piano keys in a row, or as if a sea wave hits the harbor at an angle. Panels (b1)–(c2) display this LW-II in different channels around 12:06 UT and 12:21 UT, respectively. The bright front of this LW-II is also remarkable in the SDO/AIA 171 Å image but dim in the 2796 Å, 1700 Å, and 94 Å channels, suggesting that the temperature of the front plasma is at least 700,000 K, similar to the enhanced emission at the IJ tips. Around the base of this LW-II, recurrent brightenings were detected along the LB. In the 2796 Å and 1400 Å observations, these base brightenings and the jagged bright front are connected by serried bright threads, whose emissions are weaker than the bright front. But in the 171 Å and 94 Å channels, between the front and wall base, there is a dark region similar to the IJ shown in Figure 2(b).
Along the two cuts “C–D” and “E–F” marked in panel (b2), we obtained two time–distance plots from sequences of the 1400 Å images (see panel (d)). It is shown that the bright front oscillated at two different sites but showed different patterns. Along cut “C–D”, the bright front kept oscillating during most of the period. However, along cut “E–F”, the oscillation of the front was not continuous, and the oscillations at both sites had no stationary periods. The different performances of the LW-II above two sites of the LB imply that the physical process dominating the LW-II can not be the leaked p-mode wave that shapes the whole LB and drives the coherent oscillation of the LW-I. Note that plasma ejections were frequently launched from the brightenings in the LB (see red arrows in panel (d)). The trajectories of these ejections appear to be nearly vertical in the time–distance diagrams, indicating that these ejections reach the bright front very quickly. In successive IRIS observations, these ejections could correspond to the serried bright threads connecting the base brightenings and the bright front.
The results mentioned above reveal that although the LW-II is similar to the LW-I in terms of the oscillating bright front, these two types of LWs are distinctly different in many other ways: (1) The bright front of the LW-II is broken or indented rather than a continuous one like that of the LW-I. (2) Compared to LW-Is with typical heights of 2–5 Mm, the LW-IIs have much larger heights of 10 Mm. (3) Around the base of an LW-I, there are usually no obvious TBs, but they recurrently appear in the whole bridge for an LW-II. (4) Between the bright front and the LB, a bubble-like void forms in an LW-I. However, the main body of an LW-II consists of serried bright threads caused by the fast upward ejections in the 1400 Å channel, which appears as a dark region in the 171 Å and 94 Å channels. (5) An LW-I rises with a projected velocity of 7 km s-1 while the LW-II has a rising velocity of 50 km s-1. (6) An LW-I performs coherent oscillation with a nearly stationary oscillating period of 4–5 minutes, while the oscillation of an LW-II at two sites shows different patterns without constant period. In terms of these aspects, an LW-II actually resembles an IJ. As a result, it is reasonable to speculate that an LW-II could be dominated by magnetic reconnection over a certain spatial range, and the indented bright front might be caused by local plasma heating due to reconnection-related shock fronts or compression between the upward ejections and overlying atmosphere. In Section 4, the TB, IJ, and two types of LWs are analyzed and compared with each other.
4 Comparison of Various Activities above Sunspot Light Bridges in IRIS Observations
In the following subsections, we first compare these four types of activities pairwise. There are 6 comparisons in total: TB vs. IJ, TB vs. LW-I, TB vs. LW-II, IJ vs. LW-I, IJ vs. LW-II, and LW-I vs. LW-II. Because some groups of comparisons are closely related to each other, we discuss them together out of the order mentioned above. Meanwhile, these activities reported here are also compared with those observed previously by other observatories, such as Hinode. Possible connections between the phenomena observed by different observatories at different ages are discussed. In the end of this Section, we further compare the four types of activities from the aspect of magnetic field and frequency distribution.
4.1 TB Versus IJ
TB and IJ are the most common activities observed in sunspot LBs and have been extensively investigated in many previous works. Generally, an IJ is accompanied by a TB around its footpoint, which is interpreted as the result of magnetic reconnection occurring in the low solar atmosphere (Asai et al., 2001; Shimizu et al., 2009; Louis et al., 2014; Robustini et al., 2016; Bai et al., 2019). As discussed in Section 3.2, after the occurrence of reconnection, the released magnetic energy will heat and accelerate local plasma. As a result, TBs appear in the lower atmosphere, where IJs are launched into the higher layer. However, as shown in Figure 1, not all TBs are associated with IJs. Similar observations have also been presented in Hou et al. (2020), where the magnetic topology and occurrence height of the reconnection (and thus the plasma density) were considered as key factors. These two kinds of TBs (associated with IJs or not) show interesting similarities and differences, both of which are closely related to the magnetic reconnection. To further explore the mechanisms driving these two types of TBs, we take the two events shown in Figures 1 and 2 as samples and compare their multi-wavelength imaging and IRIS spectral observations in detail.
The TBs shown in Figure 1 are clearly observed in the 2796 Å, 1400 Å, 171 Å, and 94 Å channels but are weaker in 1700 Å images, suggesting that these TBs are located above the TMR and heated up to coronal temperatures. For the TB exhibited in Figure 2, the related signatures are obvious in the 2796 Å and 1400 Å channels and are particularly strong in the 1700 Å channel. However, in the hotter 171 Å and 94 Å images, the TB is absent. Besides, this TB is associated with an IJ with a velocity comparable to the local Alfvén speed. Thus, we suggest that the TB shown in Figure 2 is located around the TMR and is heated to only transition region temperature.
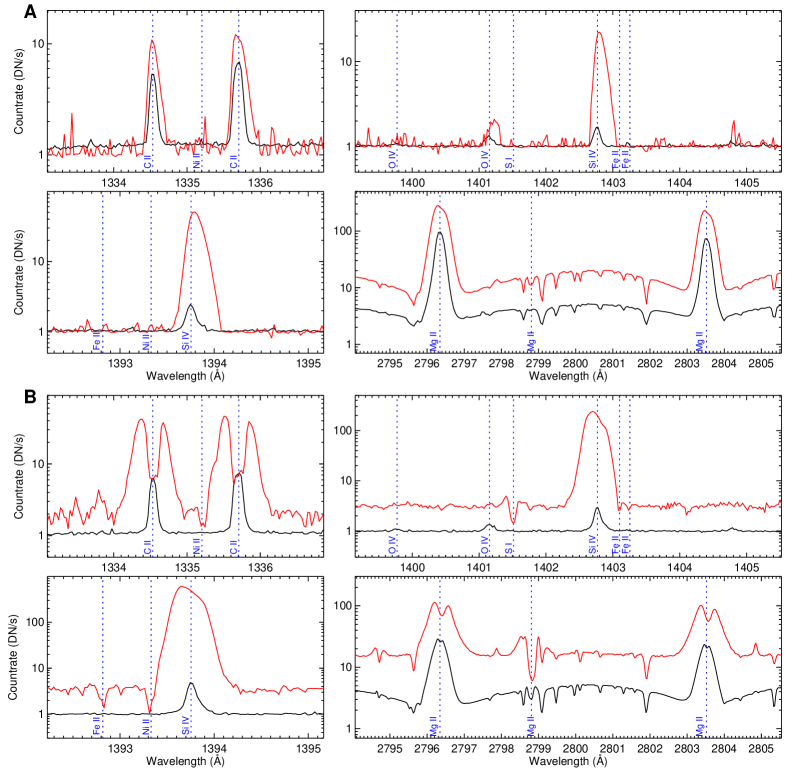
Typical line profiles of these two types of TBs are shown in Figures 5(A) and (B), respectively. Both TBs show enhanced and broadened profiles of the C ii, Si iv, and Mg ii lines, which are usually suggested to be related to reconnection heating and outflows (Peter et al., 2014; Toriumi et al., 2015b; Young et al., 2018). The most prominent feature in the spectra of a TB associated with a jet is the superposition of some absorption lines on the greatly broadened wings of the C ii and Si iv line profiles (see panel (B)). These lines include Ni ii 1335.203 Å, Fe ii 1392.817 Å, Ni ii 1393.33 Å, Fe ii 1403.101 Å, and Fe ii 1403.255 Å, which are typically formed in the upper chromosphere. In addition, these absorption lines reveal a slight blueshift. It is well established that these absorption lines with slight blue shifts are the result of upward expanding cold chromosphere material overlying a hot reconnection process (with a temperature up to 80,000 K) in the lower atmosphere (Peter et al., 2014; Tian et al., 2016). Another remarkable feature of this TB is that the Mg ii 2798.809 Å line changes from absorption to emission, implying the existence of lower chromosphere heating (Pereira et al., 2015; Hou et al., 2020). Moreover, the O iv 1399.77 Å and 1401.16 Å lines are absent for this TB, which implies that the TB is in a high-density environment (Peter et al., 2014; Tian et al., 2016, 2018). These spectral features further reinforce our conclusion that the TB associated with the jet shown in Figure 2 was produced by magnetic reconnection occurring in the lower atmosphere around the TMR.
On the contrary, as shown in Figure 5(A), the spectra of the TB without a jet do not reveal the obvious signatures mentioned above, e.g., superpositions of chromospheric absorption lines, change of the Mg ii 2798.809 Å line, and absence of the O iv 1399.77 Å and 1401.16 Å lines. Here, we should mention the possibility that the relatively weaker enhancement and broadening of the C ii and Si iv line profiles could make the chromospheric absorption lines difficult to identify. However, to a certain extent, the normal profiles of the Mg ii 2798.809 Å, O iv 1399.77 Å, and 1401.16 Å lines here could rule out the possibility that this TB without a jet is located in the lower atmosphere. Moreover, it is shown that two Si iv line profiles show obvious redshifts, which could be caused by the downflows from the reconnection region around the transition region. Similar observations were found in the transition region explosive events around the footpoints of network jets (Chen et al., 2019; Hou et al., 2021). Naturally, one may wonder why the TB detected here did not produce a jet. We propose that because the TB reported here is located above the sunspot LB, the plasma density around the TB is much lower than the environment hosting network jets. As a result, the reconnection outflows could barely be detected as jets. Another possible explanation for the absence of jets might be their direction towards the observer along the LOS, but this possibility is ruled out by the redshift of the Si iv line profiles.
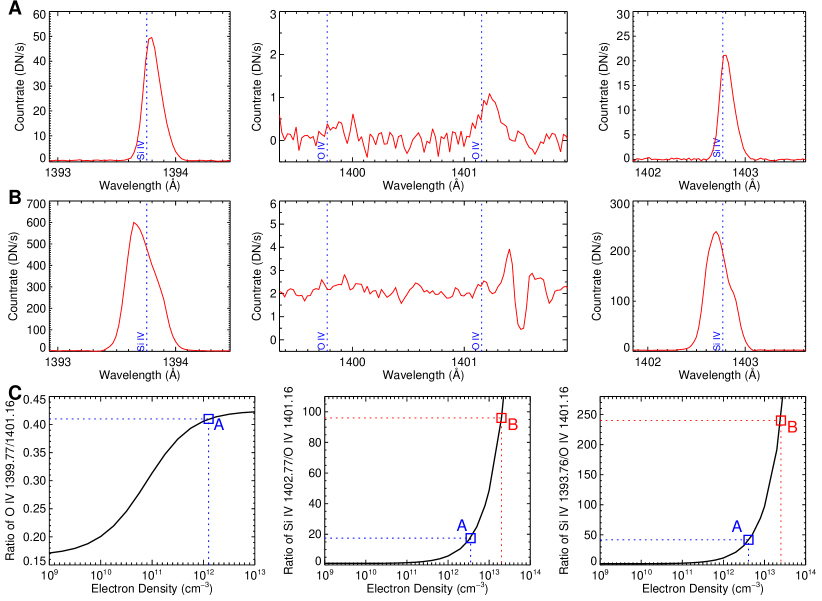
Furthermore, through the density diagnostics based on intensity ratios of different lines, we can obtain the electron densities of the two types of TBs, thus inferring their heights. As shown in Figure 6(A), Si iv 1393.76 Å, O iv 1399.77/1401.16 Å, and Si iv 1402.77 Å can be identified from the spectra of the TB without a jet. Therefore, we derived the electron density based on the line intensity ratios of O iv 1399.77/1401.16 Å, Si iv 1402.77/O iv 1401.16 Å, and Si iv 1393.76/O iv 1401.16 Å, where the theoretical relationship between the electron density and intensity ratio was obtained under the assumption of ionization equilibrium (Peter et al., 2014; Del Zanna et al., 2015; Xue et al., 2018; Cai et al., 2019; Huang et al., 2020). However, for the TB with a jet (panel (B)), the O iv 1399.77 Å and 1401.16 Å lines are both weak, so their line intensity ratio is unreliable. Thus, we just estimate its electron density based on the line intensity ratios of Si iv 1402.77/O iv 1401.16 Å and Si iv 1393.76/O iv 1401.16 Å. Note that due to the uncertainty of the observed line intensity and the theoretical relationship itself, the electron density derived here should only be used for a qualitative comparison between the two types of TBs. As shown in Figure 6(C), the electron density of the TB without a jet is in the range of 1012–1013 cm-3, which is significantly lower than that of the IJ-related TB ( cm-3). These results, together with the features discussed above, suggest that the fundamental difference between the IJ- and non-IJ-related TBs may be the formation height: the former are produced by reconnection in the lower atmosphere around the TMR, and the latter are produced by reconnection in the higher transition region.
According to existing observations and studies, IJ-related TBs are dominant in sunspot LBs and are suggested to be driven by the reconnection between small-scale emerging magnetic arcades in the LB and surrounding umbral near-vertical fields. Due to the constraint of the magnetic canopy above the LB, the emerging fields in the bridge can barely rise to the chromosphere or higher layers without interacting with the surrounding umbral fields (Jurčák et al., 2006; Tian et al., 2018). Thus, in most cases, the reconnection takes place in the lower atmosphere around the TMR, making observations of IJ-related TBs much more frequent than those of TBs without IJs. Although relatively rare, the existence of the latter TB indicates that small-scale emerging magnetic structures driven by vigorous convection upflows in the LB could sometimes reach a higher layer and then reconnect with the surrounding fields, which is likely due to different magnetic environments of different LBs. In future work, more cases of TBs without IJs should be investigated with spectral observations to examine whether this scenario agrees with our results.
4.2 TB Versus LW-I
As discussed above, an LW-I is characteristic of a continuous bright front oscillating with a stationary period, which is distinctly different from a TB. Around the base of an LW-I, there is usually no obvious TB. It is natural and reasonable that TBs and LW-Is are not closely related due to the difference between their driving mechanisms. Because IJs are always associated with TBs, TBs, IJs, and LW-Is are further discussed together in the next subsection.
4.3 IJ Versus LW-I
As shown in Figures 2 and 3, IJ and LW-I are two vastly different activities. The following differences are obvious:
-
1.
In the IRIS 1400 Å observations, LW-Is have a continuous bright front, and a bubble-like void forms in the wall body without obvious brightenings detected around the base, while IJs are identified as emission features accompanied by a footpoint TB.
-
2.
An LW-I is rooted in the whole LB over a spatial range of about tens of Mm, while an IJ has a typical width of approximately 1–2 Mm.
-
3.
Compared to LW-Is with typical heights of 2–5 Mm, IJs have much larger heights of 10 Mm.
-
4.
An LW-I rises with a projected velocity of 7 km s-1, while an IJ has a projected velocity of 50 km/s.
-
5.
The lifetime of an IJ is several minutes, while an LW-I could exist for a relatively long time, even up to several days.
-
6.
Unlike the intermittence of an IJ, an LW-I has an almost stationary oscillating period of 4–5 minutes.
These observational features support the interpretation of an LW-I as a wave-driven activity and that an IJ is caused by intermittent reconnection. Studying two events with the coexistence of an LW-I and an IJ above the same LB, Hou et al. (2017) proposed that in some LBs where the leaked p-mode waves consistently driving the oscillating LW-I above the whole LB, intermittent magnetic reconnection between the emerging fields and surrounding umbral fields could occur in some sites and produce an upward IJ accompanied by the footpoint TB. Similar results were also reported by Tian et al. (2018) through combining the observations from the GST and IRIS, where strong evidence for two components of the surge-like activity above LBs were found. Moreover, persistent short LW-Is are likely related to the upward leakage of magneto-acoustic waves from the photosphere. In addition, Li et al. (2021a) found that some IJs launched from a TB in an LB could break through the bright front of an LW-I, where small-scale bright blobs ejected from the oscillating bright front are detected. These results reveal that although LW-Is and IJs (always associated with a TB) are caused by different mechanisms and thus show two distinct groups of observational features, they could simultaneously appear in the same LB in some events.
Recent high-resolution photospheric observations have revealed that in some LBs, filamentary and granular features could be observed simultaneously at different parts (Schlichenmaier et al., 2016; Yang et al., 2019a; Hou et al., 2020). As a result, the co-existence of different types of activities naturally raises a question: if such co-existence has anything to do with different LB structures observed in the photosphere? It seems self-evident that the answer is yes because the photospheric observations of LBs directly reflect the information of convective energy transport, which is one of the basic physical processes driving the dynamic activities above LBs. We also point out that a comprehensive study about this topic in the future needs more events which must satisfy the following two conditions: (1) the same LB should host more than one type of activities driven by different mechanisms in the IRIS or SDO (E)UV imaging observations; (2) the LB should be simultaneously observed in photospheric channels by some observatories with high spatial resolution, such as Hinode, GREGOR, GST, NVST, and upcoming DKIST. However, to our best knowledge, the number of such cases is very limited at the moment.
4.4 TB Versus LW-II
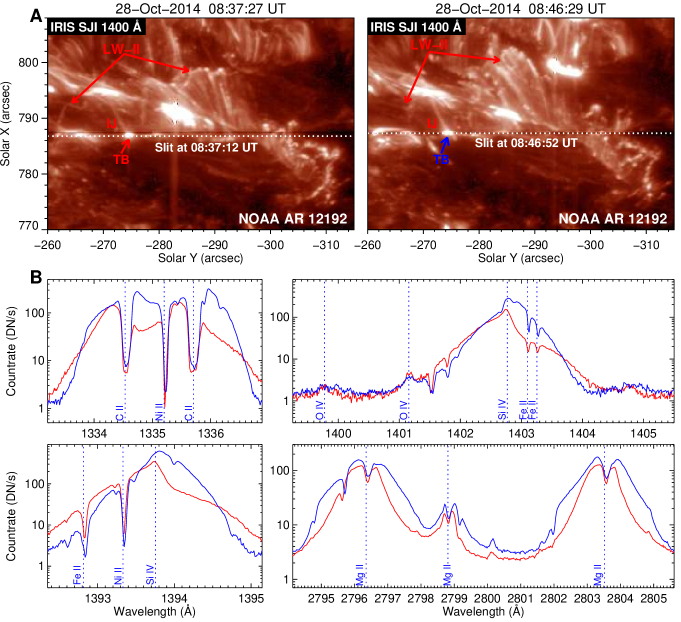
Because the LW-II shown in Figure 4 was not crossed by the IRIS slit, further spectral analysis is not possible. For more information about the LW-II, in Figure 7, we show another typical LW-II above the sunspot LB of NOAA AR 12192 on 2014 October 28. This LW-II was crossed by the IRIS slit several times and was investigated in detail by Tian et al. (2018). The successive IRIS observations reveal that from 08:20 UT to 09:11 UT, this LW-II was rooted in the whole LB and had an oscillating indented bright front with a height of 10 Mm in the 1400 Å channel. TBs were also frequently detected around the bases of this LW-II, above which ejections appeared as serried bright threads connecting to the bright front. Panel (A) displays this LW-II around 08:06 UT and 08:46 UT, when the IRIS slit crossed a recurrent TB. The profiles of the C ii, Si iv, and Mg ii lines of this TB measured at two time points are shown by red and blue curves in panel (B). Both of them are remarkably enhanced and broadened at both wings of each emission line. Besides, signatures such as superpositions of chromospheric absorption lines and change of the Mg ii 2798.809 Å line are also obvious here, just like those of the IJ-related TBs shown in Figures 2 and 5(B).
Combining the imaging observational results shown in Section 3.4 and the spectral results analyzed here, one can see that different from the LW-I, the LW-II shows recurrent brightenings at the base along the whole LB, which are driven by frequent reconnection occurring in the lower atmosphere. Then, plasma ejections are launched above these brightenings and appear as serried bright threads, forming a wall-shaped structure in the IRIS 2796 Å and 1400 Å images. It is obvious that the LW-II is closely related to the brightenings as well as IJs. Further discussion of the relations between these three activities is presented in the next subsection.
4.5 IJ Versus LW-II
As shown in Figures 2, 4, 5(B), and 7, LW-IIs resemble IJs in many aspects:
-
1.
Around the footpoint, TBs with similar spectral properties are detected.
-
2.
The main body is seen in emission in the 2796 Å and 1400 Å channels but appears as a dark void region at the 171 Å and 94 Å passbands.
-
3.
Around the front, enhanced emissions can be dimly seen in the 1400 Å, 171 Å and 94 Å images.
-
4.
The ejections launched from TBs moved upwards very quickly and reached a height of 10 Mm.
-
5.
The occurrence is intermittent without a nearly stationary period.
It seems that the only difference between an IJ and an LW-II is their spatial ranges along the LB: an IJ has a typical width of about 1–2 Mm, while an LW-II has a spatial range over the whole LB.
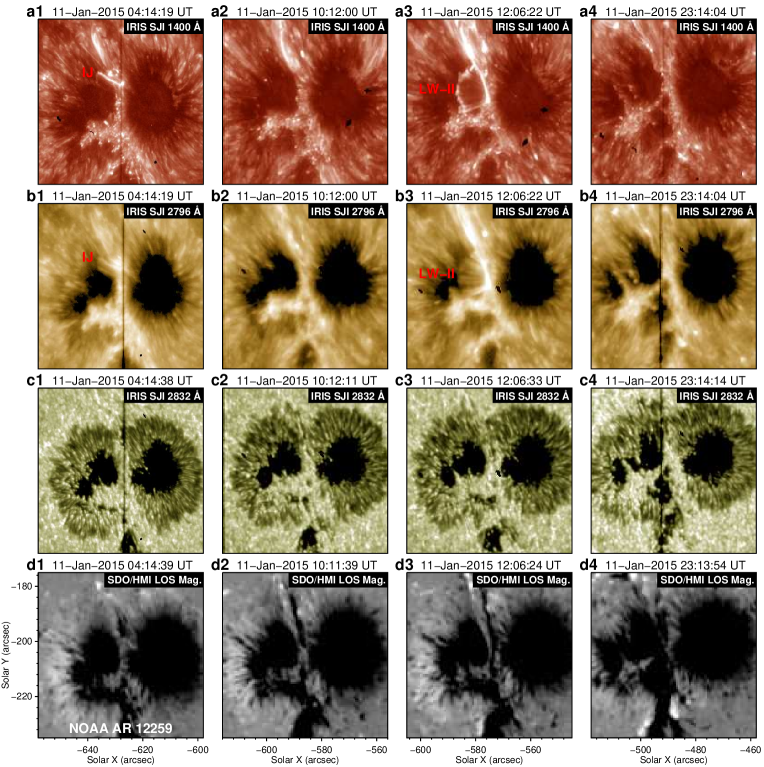
To explore the relation between IJs and LW-IIs, in Figure 8, we display the evolution of the main sunspot of AR 12259 on 2015 January 11, where the LW-II exhibited in Figure 4 and IJ shown in Figure 2 are located in the same LB. Around 04:00 UT, IJs were detected at the north end of this LB but were invisible in the next data set of IRIS 1400 Å and 2796 Å around 10:00 UT. Around 12:00 UT, the LW-II appeared above the same LB but subsequently disappeared in the next IRIS observations around 23:00 UT. Due to the gap in the IRIS observations, it is difficult to determine the exact lifetime of these two activities. However, their disappearances in the next IRIS observation period reveal that their typical lifetimes could be a few hours at most. Simultaneous IRIS 2832 Å images and SDO/HMI magnetograms reveal that when the IJ and LW-II were observed, an elongated dark structure with negative magnetic polarity gradually intruded into the LB from its north end, around which some TBs were detected in the 2832 Å images.
These results indicate that the IJ and LW-II could essentially belong to the same category from the perspective of the driving mechanism. The only difference between them is the spatial scope of reconnection occurring in the LB: the IJ is produced by small-scale reconnection intermittently occurring at some localized sites of the LB, and the LW-II is caused by the frequent reconnection occurring over the whole LB. Specifically, if the emerging magnetic field in the LB has a line-like shape or is widely distributed in the entire bridge, the magnetic reconnection could frequently takes place in the lower atmosphere of the LB over a large spatial range. Then, a dense row of IJs associated with footpoint TBs would be launched along the bridge during some period of time. These IJs slam into the higher atmosphere and compress the local plasma in front, thus producing a wall-shaped LW-II with a bright front. Because the reconnection cannot appear at all locations on the LB and at any time, the IJs should be triggered randomly at a limited temporal and spatial scale. As a result, the bright front of an LW-II appears as a broken or indented line rather than a continuous one like that of an LW-I.
Although the concept of LW-II is proposed in the present work for the first time, we speculate that such type of activity actually has been reported in part of previous works. For example, as shown in Figure 2 of Robustini et al. (2016), fan-shaped jets above a sunspot LB were clear in the SST and Hinode observations, with lengths of about 7–38 Mm and an initial speed of 100 km s-1. A bright front was also observed ahead these fan-shaped jets and was interpreted by the compression of coronal material due to the upward jet. Despite lack of IRIS observations of these fan-shaped jets, we infer that such piano-like jets could fall into the category of LW-IIs reported here according to their similar morphological, thermal, and dynamical properties. Similarly, Shimizu et al. (2009) and Louis et al. (2014) reported a row of short jets above sunspot LBs and further investigated the corresponding photospheric magnetic field by using Hinode SOT and SP observations, respectively. We suggest that the LW-II analyzed here by the IRIS and SDO observations could be the transition region and coronal counterparts of the activity studied by Shimizu et al. (2009) and Louis et al. (2014).
4.6 LW-I Versus LW-II
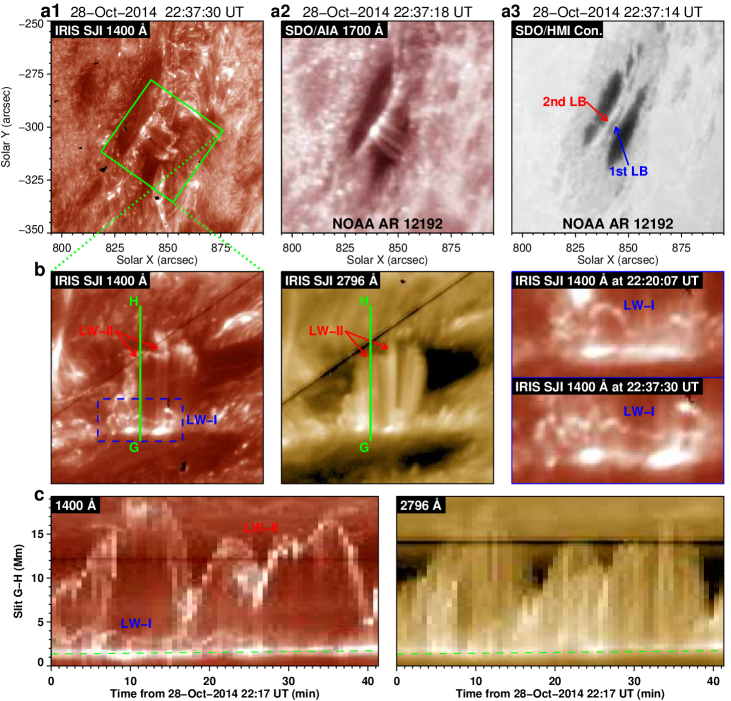
LW-Is and LW-IIs as well as their relations have been analyzed in detail above. These two types of activities above LBs share a notable feature of an oscillating bright front, and they have similar wall-like shapes, from which their names were derived. However, they also show distinctly different properties and are driven by leakage of p-mode wave and magnetic reconnection, respectively, which is why they are distinguished as type-I and type-II. Due to the different preferences for the forming environment, these two types of LWs could not normally appear in the same sunspot LB. Figure 9 displays a unique event where an LW-I and LW-II were simultaneously detected in the same sunspot of AR 12192 on 2014 October 28. After checking the evolution of this sunspot a few days before, we found that there were two LBs close and parallel to each other in the sunspot on October 28. The west LB (1st LB in panel (a3)) formed at first and already produced an LW-I around October 25 (see Figure 4). Over the following days, an additional LB (2nd LB) gradually formed besides, which was accompanied by dynamical activities, such as TBs, IJs, and an LW-II. As this sunspot rotated to a location near the solar limb on October 28, it provides an excellent viewpoint for us to observe the LW-I above the west LB and LW-II in the east LB in the same FOV. Figures 9(b) and (c) show that the LW-I has a continuous oscillating bright front with a typical height of several Mm and a nearly stationary period of several minutes. Meanwhile, the LW-II has a jagged bright front with a height of over 10 Mm, which oscillates without a stable period and is accompanied by frequent ejections from the base.
Together with the results from the preceding sections, here we conclude the observational similarities and differences of the two types of LWs as follows:
-
•
Similarities
-
1.
Oscillating bright front in IRIS 1400/1330 Å observations.
-
2.
Spatial range over the entire LB.
-
1.
-
•
Differences
-
1.
An LW-I has a continuous bright front, but the bright front of an LW-II is broken or indented.
-
2.
Around the base of an LW-I, there are usually no obvious TBs, but they recurrently appear in the whole bridge for an LW-II.
-
3.
Between the bright front and LB, a bubble-like void forms in an LW-I, while the main body of an LW-II consists of serried bright threads caused by the fast upward ejections.
-
4.
Compared to an LW-I with typical heights of 2–5 Mm, an LW-II has much a larger height of 10 Mm.
-
5.
An LW-I rises with a projected velocity of 7 km s-1, while an LW-II has a projected velocity of 50 km s-1.
-
6.
The lifetime of an LW-I ranges from several hours to several days, while an LW-II usually exists for several hours.
-
7.
An LW-I performs coherent oscillation with a nearly stationary oscillating period of 4–5 minutes, while the oscillation of an LW-II at two sites shows different patterns without constant period.
-
1.
Based on these results, we speculate that in a developing sunspot LB, where large-scale magnetic flux emergence is driven by vigorous convection upflows, magnetic reconnection will frequently occur along the whole bridge, and an LW-II could be a dominant activity. However, an LW-I with a long lifetime and stable oscillating period should be located in an LB with a generally stable magnetic environment.
4.7 Magnetic Field Comparison of the Four Types of Activities
Figure 10 shows the photospheric vector magnetic field and the vertical current density distribution of the LBs producing four types of activities, which are exhibited in Figures 1, 2, 3, and 4, respectively. The vertical current density Jz is calculated as follows:
| (1) |
where is the magnetic permeability. Since Jz is determined by the spatial gradient of BH, it is natural that Jz is large in LBs with relatively strong BH, especially narrow ones, where BH significantly changes in a very small area. In addition, the sustained emergence or intrusion of horizontal magnetic fields would also produce strong electric currents (Louis et al., 2021). Figure 10 reveals that LBs of these four events are all characterized by highly inclined magnetic field and strong vertical current density Jz around the sites where activities are detected, showing no obvious differences with each other. However, Figures 10(B) and 2 reveal that the IJ was located at the north end of the LB, where a magnetic patch with strong and inclined fields was intruding into the LB. For the LW-II observed later in the same LB, the LB at that time had been occupied by the intruding magnetic patch and showed a dynamical evolution. The LW-II was located between the west part of umbra and the elongated intruding magnetic patch, where the vertical and horizontal components of the vector magnetic field all changes sharply (see Figures 10(D) and 4). But for the TB and LW-I, there are no remarkable signals of magnetic flux emergence or intrusion in the corresponding LBs (see Figures 10(A) and (C)), where the magnetic environment is generally stable.
4.8 Frequency Distribution Comparison of the Four Types of Activities
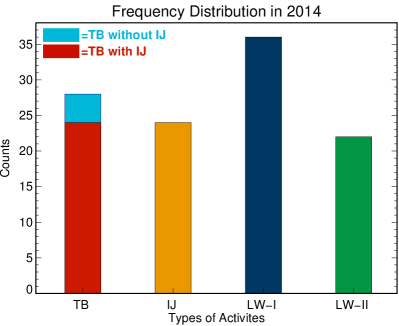
To investigate frequency distributions of the different activities above sunspot LBs, we checked the IRIS 1400/1330 Å observations of sunspot LBs in the whole year of 2014 and counted these activities. The counts of four types of activities follow the two principles below: (1) An LW-I or LW-II above the same LB is counted only once, even if they lasts for a long time and are shown in multiple IRIS data sets. (2) IJs or TBs above the same LB are counted only once, even if they appear at different sites of this LB or occur recurrently during the observing period. Figure 11 reveals that in IRIS 1400/1330 Å observations of 2014, occurrence frequencies of TB without IJ, IJ-related TB, IJ, LW-I, and LW-II are 4, 24, 24, 36, and 22, respectively. It is shown that of TBs are associated with IJs, and all IJs are accompanied by TBs. We also find that most of IJs are detected in LW-IIs, and sometimes observed to be superimposed on some LW-Is or appear alone. LW-I is more frequently observed above sunspot LBs then LW-II.
5 Summary
| Activities | Size | Lifetime | Period | Velocity | Driving Mechanism | References |
| TB | Spot: 1–2 Mm | several minutes | / | / | Magnetic reconnection | Toriumi et al. (2015b) |
| Elongated: 3–4 Mm | Hou et al. (2020) | |||||
| IJ | Height: 10 Mm | several minutes | / | 50 km/s | Magnetic reconnection | Toriumi et al. (2015b) |
| Width: 1–2 Mm | – several hours | Hou et al. (2017, 2020) | ||||
| Tian et al. (2018) | ||||||
| LW-I | Height: 2–5 Mm | several hours | 4–5 minutes | 10 km/s | Leakage of waves | Yang et al. (2015, 2017) |
| Width: entire LB | – several days | Bharti (2015) | ||||
| Hou et al. (2016a, 2017) | ||||||
| Zhang et al. (2017) | ||||||
| Tian et al. (2018) | ||||||
| LW-II | Height: 10 Mm | several hours | / | 50 km/s | Magnetic reconnection | The present work |
| Width: entire LB |
Based on the high-resolution observations from the IRIS, we investigated various activities in sunspot LBs. Because these activities display a wide variety of physical properties, we classified them into four distinct categories: TB, IJ, LW-I, and LW-II. The observational characteristics, possible driving mechanisms, and recent works based on the IRIS observations of the four types of activities are summarized in Table 2.
The four types of activities were further analyzed in comparison with each other. We summarize the results as follows:
-
1.
In a sunspot LB, most observed TBs are associated with IJs and could be driven by magnetic reconnection between emerging small-scale fields and surrounding umbral fields occurring in the lower atmosphere around the TMR. However, in a few cases, the emerging magnetic structures might reach a higher layer and then reconnect with surrounding fields, producing TBs without IJs due to the low local plasma density.
-
2.
IJs and LW-Is above LBs are two vastly different activities and are caused by intermittent reconnection in lower atmosphere and persistent upward leakage of magneto-acoustic waves from the photosphere, respectively. However, in some events, these two mechanisms could simultaneously play roles in the LB and lead to the superimposition of IJs on an oscillating LW-I at some sites.
-
3.
The IJ and LW-II could essentially be the same category from the perspective of the driving mechanism. The only difference between them is the spatial scope of reconnection driving them: an IJ is produced by small-scale reconnection intermittently occurring at some localized sites of the LB, while an LW-II is caused by frequent reconnection occurring over almost the entire LB.
-
4.
When the emerging magnetic field has a line-like shape or is widely distributed along the entire LB, magnetic reconnection could frequently take place, leading to recurrent TBs in the lower atmosphere of nearly the whole LB. Then, a dense row of IJs would be launched above these TBs, which would slam into the higher atmosphere and compress the local plasma in front, thus producing the bright front of a wall-shaped LW-II. Because the reconnection cannot simultaneously occur at all locations in the LB, the bright front of the LW-II appears as a broken or indented line rather than a continuous one like that of an LW-I.
-
5.
Although the LW-II is similar to the LW-I in the terms of oscillating bright front, they are essentially two different types of activities from the perspective of the driving mechanism. The long lifetime and stable oscillating period of LW-I indicate that the magnetic environment of an LW-I is generally stable. However, an LW-II is more likely to be detected in a dynamically evolving sunspot LB, where large-scale magnetic flux emergence or intrusion are driven by vigorous magneto-convection and magnetic reconnection frequently occurs along the whole bridge.
Although sunspot LBs have been extensively studied for more than half a century, our understanding of this kind of special sub-structure within a sunspot and its dynamics is still evolving, especially with the rapid development of solar observatories in past decades. In the present work, we concentrated on the classification and comparison of the various activities above LBs. However, the key factors that determine the occurrence of these activities and their possible relations to evolution of a sunspot LB still remain unclear. To find these factors and eventually build a complete physical picture of the LBs and associated activities, we need carefully investigate the physical linkage between the subphotospheric evolution and the atmospheric dynamics above in the future works. More efforts ought to be focused on clarifying the regularities of these activities and their exact relations to the general properties of sunspot LBs, especially from a statistical perspective. For instance, the analyzing method applied in Rezaei (2018) can comprehensively quantify the general physical properties of the LBs producing different types of activities, and thus contribute to finding the key factors of interest.
In addition, there is another important topic that is not discussed in this paper: what happens above the LBs along the polarity inversion line (PIL) of the delta-type sunspots or the LBs formed by coalescence of two pores with the same magnetic polarity? We have noticed that in IRIS 1400/1330 Å images, there are no typical LB features (i.e., bright lane penetrating into the umbra) in the delta-type sunspots. Instead, frequent flashing and dense bright loops dominate PIL region of the delta-type sunspot. The properties of these activities above the LB of delta-type sunspots will be discussed in detail in an upcoming paper (Hou et al. 2022, in preparation). As for the LBs through coalescence of two pores with the same magnetic polarity, the results of Zhong et al. (2019) could be regarded as a reference: they found that the collision of two magnetic patches with the same polarity would launch fan-shaped activities observed in H channel. These fan-shaped activities ascended from the collision sites between the two patches and then decayed within about 10 minutes. For achieving these topics, high-resolution data from other observatories, such as Hinode and the upcoming DKIST, will definitely be helpful. Besides, since we have learned a lot about LBs from the realistic sunspot simulations (Cheung et al., 2010; Rempel & Cheung, 2014; Toriumi & Hotta, 2019), with the advance of computational power, more insights into sunspot LBs will be brought by further simulation works in the near future.
References
- Asai et al. (2001) Asai, A., Ishii, T. T., & Kurokawa, H. 2001, ApJ, 555, L65, doi: 10.1086/321738
- Bai et al. (2019) Bai, X., Socas-Navarro, H., Nóbrega-Siverio, D., et al. 2019, ApJ, 870, 90, doi: 10.3847/1538-4357/aaf1d1
- Beckers & Schröter (1969) Beckers, J. M., & Schröter, E. H. 1969, Sol. Phys., 10, 384, doi: 10.1007/BF00145526
- Berger & Berdyugina (2003) Berger, T. E., & Berdyugina, S. V. 2003, ApJ, 589, L117, doi: 10.1086/376494
- Bharti (2015) Bharti, L. 2015, MNRAS, 452, L16, doi: 10.1093/mnrasl/slv071
- Bobra et al. (2014) Bobra, M. G., Sun, X., Hoeksema, J. T., et al. 2014, Sol. Phys., 289, 3549, doi: 10.1007/s11207-014-0529-3
- Borrero & Ichimoto (2011) Borrero, J. M., & Ichimoto, K. 2011, Living Reviews in Solar Physics, 8, 4, doi: 10.12942/lrsp-2011-4
- Cai et al. (2019) Cai, Q., Shen, C., Ni, L., et al. 2019, Journal of Geophysical Research (Space Physics), 124, 9824, doi: 10.1029/2019JA027017
- Castellanos Durán et al. (2020) Castellanos Durán, J. S., Lagg, A., Solanki, S. K., & van Noort, M. 2020, ApJ, 895, 129, doi: 10.3847/1538-4357/ab83f1
- Chen et al. (2019) Chen, Y., Tian, H., Huang, Z., Peter, H., & Samanta, T. 2019, ApJ, 873, 79, doi: 10.3847/1538-4357/ab0417
- Cheung et al. (2010) Cheung, M. C. M., Rempel, M., Title, A. M., & Schüssler, M. 2010, ApJ, 720, 233, doi: 10.1088/0004-637X/720/1/233
- De Pontieu et al. (2014) De Pontieu, B., Title, A. M., Lemen, J. R., et al. 2014, Sol. Phys., 289, 2733, doi: 10.1007/s11207-014-0485-y
- Del Zanna et al. (2015) Del Zanna, G., Dere, K. P., Young, P. R., Landi, E., & Mason, H. E. 2015, A&A, 582, A56, doi: 10.1051/0004-6361/201526827
- Felipe et al. (2017) Felipe, T., Collados, M., Khomenko, E., et al. 2017, A&A, 608, A97, doi: 10.1051/0004-6361/201731374
- Felipe et al. (2016) —. 2016, A&A, 596, A59, doi: 10.1051/0004-6361/201629586
- Garcia de La Rosa (1987) Garcia de La Rosa, J. I. 1987, Sol. Phys., 112, 49, doi: 10.1007/BF00148486
- Gupta & Tripathi (2015) Gupta, G. R., & Tripathi, D. 2015, ApJ, 809, 82, doi: 10.1088/0004-637X/809/1/82
- Hou et al. (2016a) Hou, Y., Zhang, J., Li, T., et al. 2016a, ApJ, 829, L29, doi: 10.3847/2041-8205/829/2/L29
- Hou et al. (2017) Hou, Y., Zhang, J., Li, T., Yang, S., & Li, X. 2017, ApJ, 848, L9, doi: 10.3847/2041-8213/aa8edd
- Hou et al. (2016b) Hou, Y. J., Li, T., Yang, S. H., & Zhang, J. 2016b, A&A, 589, L7, doi: 10.1051/0004-6361/201628216
- Hou et al. (2020) Hou, Y. J., Li, T., Zhong, S. H., et al. 2020, A&A, 642, A44, doi: 10.1051/0004-6361/202038668
- Hou et al. (2021) Hou, Z., Tian, H., Berghmans, D., et al. 2021, ApJ, 918, L20, doi: 10.3847/2041-8213/ac1f30
- Huang et al. (2014) Huang, Z., Madjarska, M. S., Xia, L., et al. 2014, ApJ, 797, 88, doi: 10.1088/0004-637X/797/2/88
- Huang et al. (2020) Huang, Z., Zhang, Q., Xia, L., et al. 2020, ApJ, 897, 113, doi: 10.3847/1538-4357/ab96bd
- Jurčák et al. (2006) Jurčák, J., Martínez Pillet, V., & Sobotka, M. 2006, A&A, 453, 1079, doi: 10.1051/0004-6361:20054471
- Katsukawa et al. (2007) Katsukawa, Y., Yokoyama, T., Berger, T. E., et al. 2007, PASJ, 59, S577, doi: 10.1093/pasj/59.sp3.S577
- Lagg et al. (2014) Lagg, A., Solanki, S. K., van Noort, M., & Danilovic, S. 2014, A&A, 568, A60, doi: 10.1051/0004-6361/201424071
- Leka (1997) Leka, K. D. 1997, ApJ, 484, 900, doi: 10.1086/304363
- Lemen et al. (2012) Lemen, J. R., Title, A. M., Akin, D. J., et al. 2012, Sol. Phys., 275, 17, doi: 10.1007/s11207-011-9776-8
- Li et al. (2021a) Li, F., Chen, Y., Hou, Y., et al. 2021a, ApJ, 908, 201, doi: 10.3847/1538-4357/abd322
- Li et al. (2021b) Li, F.-Y., Chen, Y.-H., Song, Y.-L., Hou, Z.-Y., & Tian, H. 2021b, Research in Astronomy and Astrophysics, 21, 144, doi: 10.1088/1674-4527/21/6/144
- Lim et al. (2020) Lim, E.-K., Yang, H., Yurchyshyn, V., et al. 2020, ApJ, 904, 84, doi: 10.3847/1538-4357/abc1e0
- Lites et al. (2004) Lites, B. W., Scharmer, G. B., Berger, T. E., & Title, A. M. 2004, Sol. Phys., 221, 65, doi: 10.1023/B:SOLA.0000033355.24845.5a
- Livingston et al. (2006) Livingston, W., Harvey, J. W., Malanushenko, O. V., & Webster, L. 2006, Sol. Phys., 239, 41, doi: 10.1007/s11207-006-0265-4
- Louis et al. (2008) Louis, R. E., Bayanna, A. R., Mathew, S. K., & Venkatakrishnan, P. 2008, Sol. Phys., 252, 43, doi: 10.1007/s11207-008-9247-z
- Louis et al. (2014) Louis, R. E., Beck, C., & Ichimoto, K. 2014, A&A, 567, A96, doi: 10.1051/0004-6361/201423756
- Louis et al. (2015) Louis, R. E., Bellot Rubio, L. R., de la Cruz Rodríguez, J., Socas-Navarro, H., & Ortiz, A. 2015, A&A, 584, A1, doi: 10.1051/0004-6361/201526854
- Louis et al. (2021) Louis, R. E., Prasad, A., Beck, C., Choudhary, D. P., & Yalim, M. S. 2021, A&A, 652, L4, doi: 10.1051/0004-6361/202141456
- Muller (1979) Muller, R. 1979, Sol. Phys., 61, 297, doi: 10.1007/BF00150414
- Okamoto & Sakurai (2018) Okamoto, T. J., & Sakurai, T. 2018, ApJ, 852, L16, doi: 10.3847/2041-8213/aaa3d8
- Pereira et al. (2015) Pereira, T. M. D., Carlsson, M., De Pontieu, B., & Hansteen, V. 2015, ApJ, 806, 14, doi: 10.1088/0004-637X/806/1/14
- Pesnell et al. (2012) Pesnell, W. D., Thompson, B. J., & Chamberlin, P. C. 2012, Sol. Phys., 275, 3, doi: 10.1007/s11207-011-9841-3
- Peter et al. (2014) Peter, H., Tian, H., Curdt, W., et al. 2014, Science, 346, 1255726, doi: 10.1126/science.1255726
- Rempel & Cheung (2014) Rempel, M., & Cheung, M. C. M. 2014, ApJ, 785, 90, doi: 10.1088/0004-637X/785/2/90
- Rezaei (2018) Rezaei, R. 2018, A&A, 609, A73, doi: 10.1051/0004-6361/201629828
- Rezaei et al. (2012) Rezaei, R., Bello González, N., & Schlichenmaier, R. 2012, A&A, 537, A19, doi: 10.1051/0004-6361/201117485
- Rimmele (2008) Rimmele, T. 2008, ApJ, 672, 684, doi: 10.1086/523702
- Robustini et al. (2016) Robustini, C., Leenaarts, J., de la Cruz Rodriguez, J., & Rouppe van der Voort, L. 2016, A&A, 590, A57, doi: 10.1051/0004-6361/201528022
- Roy (1973) Roy, J. R. 1973, Sol. Phys., 28, 95, doi: 10.1007/BF00152915
- Rueedi et al. (1995) Rueedi, I., Solanki, S. K., & Livingston, W. 1995, A&A, 302, 543
- Rutten (2016) Rutten, R. J. 2016, A&A, 590, A124, doi: 10.1051/0004-6361/201526489
- Schlichenmaier et al. (2010) Schlichenmaier, R., Bello González, N., Rezaei, R., & Waldmann, T. A. 2010, Astronomische Nachrichten, 331, 563, doi: 10.1002/asna.201011372
- Schlichenmaier et al. (2016) Schlichenmaier, R., von der Lühe, O., Hoch, S., et al. 2016, A&A, 596, A7, doi: 10.1051/0004-6361/201628561
- Schou et al. (2012) Schou, J., Scherrer, P. H., Bush, R. I., et al. 2012, Sol. Phys., 275, 229, doi: 10.1007/s11207-011-9842-2
- Shimizu et al. (2009) Shimizu, T., Katsukawa, Y., Kubo, M., et al. 2009, ApJ, 696, L66, doi: 10.1088/0004-637X/696/1/L66
- Sobotka et al. (1994) Sobotka, M., Bonet, J. A., & Vazquez, M. 1994, ApJ, 426, 404, doi: 10.1086/174076
- Solanki (2003) Solanki, S. K. 2003, A&A Rev., 11, 153, doi: 10.1007/s00159-003-0018-4
- Spruit & Scharmer (2006) Spruit, H. C., & Scharmer, G. B. 2006, A&A, 447, 343, doi: 10.1051/0004-6361:20054000
- Thomas & Weiss (2004) Thomas, J. H., & Weiss, N. O. 2004, ARA&A, 42, 517, doi: 10.1146/annurev.astro.42.010803.115226
- Thomas et al. (2002) Thomas, J. H., Weiss, N. O., Tobias, S. M., & Brummell, N. H. 2002, Nature, 420, 390, doi: 10.1038/nature01174
- Tian et al. (2016) Tian, H., Xu, Z., He, J., & Madsen, C. 2016, ApJ, 824, 96, doi: 10.3847/0004-637X/824/2/96
- Tian et al. (2018) Tian, H., Yurchyshyn, V., Peter, H., et al. 2018, ApJ, 854, 92, doi: 10.3847/1538-4357/aaa89d
- Toriumi et al. (2015a) Toriumi, S., Cheung, M. C. M., & Katsukawa, Y. 2015a, ApJ, 811, 138, doi: 10.1088/0004-637X/811/2/138
- Toriumi & Hotta (2019) Toriumi, S., & Hotta, H. 2019, ApJ, 886, L21, doi: 10.3847/2041-8213/ab55e7
- Toriumi et al. (2015b) Toriumi, S., Katsukawa, Y., & Cheung, M. C. M. 2015b, ApJ, 811, 137, doi: 10.1088/0004-637X/811/2/137
- Toriumi et al. (2017) —. 2017, ApJ, 836, 63, doi: 10.3847/1538-4357/836/1/63
- Xue et al. (2018) Xue, Z., Yan, X., Yang, L., et al. 2018, ApJ, 858, L4, doi: 10.3847/2041-8213/aabe77
- Yang et al. (2019a) Yang, H., Lim, E.-K., Iijima, H., et al. 2019a, ApJ, 882, 175, doi: 10.3847/1538-4357/ab36b7
- Yang et al. (2016) Yang, S., Zhang, J., & Erdélyi, R. 2016, ApJ, 833, L18, doi: 10.3847/2041-8213/833/2/L18
- Yang et al. (2017) Yang, S., Zhang, J., Erdélyi, R., et al. 2017, ApJ, 843, L15, doi: 10.3847/2041-8213/aa7b2c
- Yang et al. (2015) Yang, S., Zhang, J., Jiang, F., & Xiang, Y. 2015, ApJ, 804, L27, doi: 10.1088/2041-8205/804/2/L27
- Yang et al. (2019b) Yang, X., Yurchyshyn, V., Ahn, K., Penn, M., & Cao, W. 2019b, ApJ, 886, 64, doi: 10.3847/1538-4357/ab4a7d
- Young et al. (2018) Young, P. R., Tian, H., Peter, H., et al. 2018, Space Sci. Rev., 214, 120, doi: 10.1007/s11214-018-0551-0
- Yuan & Walsh (2016) Yuan, D., & Walsh, R. W. 2016, A&A, 594, A101, doi: 10.1051/0004-6361/201629258
- Zhang et al. (2017) Zhang, J., Tian, H., He, J., & Wang, L. 2017, ApJ, 838, 2, doi: 10.3847/1538-4357/aa63e8
- Zhang et al. (2018) Zhang, J., Tian, H., Solanki, S. K., et al. 2018, ApJ, 865, 29, doi: 10.3847/1538-4357/aada0a
- Zhong et al. (2019) Zhong, S., Hou, Y., Li, L., Zhang, J., & Xiang, Y. 2019, ApJ, 882, 110, doi: 10.3847/1538-4357/ab345c
- Zirin & Wang (1993) Zirin, H., & Wang, H. 1993, Sol. Phys., 144, 37, doi: 10.1007/BF00667980