Dynamical phases in growing populations: understanding recovery from bottlenecks
Abstract
Since steep declines in a population’s size also typically alter its composition, population bottlenecks are considered highly important for evolution. However, despite such significance, the mechanisms governing the impact of a given population bottleneck remain poorly understood. In this context, we show that long-term post-bottleneck outcomes can depend crucially on the rate at which a diminished population grows whilst recovering. That is, two otherwise identical populations, each having undergone the same bottleneck, can fixate on dramatically different demographics due to different rates of post-bottleneck growth. This behaviour is moreover shown to change non-trivially with different levels of mutation. The underlying mechanism can be traced to intrinsic fluctuations whose standard deviation decreases in time with the inverse square root of the growing population size. Crucially, such decreasing fluctuations couple to the underlying dynamics and result in distinct regimes of (non-equilibrium) demographic behaviour, delimited by abrupt transitions at critical population sizes. Seen through this lens, growth and mutation alter evolutionary outcomes by changing the duration and character of dynamical phases; a feature that we speculate may be of generic importance across many systems.
I Introduction
Population bottlenecks involve a steep decline in population size due to exogenous events, such as disease, changes to the climate, or population fracture (often referred-to as a founder event) mayr_change_1954 ; Nei1975 . They are widely accepted as an important facet in the modern understanding of evolution, and have been implicated in the reduction of both genetic and phenotypic variation across a variety of organisms, including viruses domingo2012viral ; weaver2021population , song sparrows Keller2001 ; Keller1994a , tropical surgeonfish Doherty2004 , elephant seals Hoelzel2002a and humans Manica2007a .
Despite such conceptual importance, the relationship between the short-term restriction of a population and its subsequent long-term evolutionary outcomes is still poorly understood, with a lack of both representative models and/or classifying phenomenology. This is particularly relevant since post-bottleneck recovery is typically characterised by rapid or sustained population growth, which several pioneering works have now shown can lead to a variety of ostensibly counter-intuitive behaviours. These include driving novel demographic transients Melbinger2010 ; facilitating cooperation Cremer2011 ; Huang2015 , even when deterministic selection favours defection Constable2016 ; and altering the success of invading variants Ashcroft2017 .
We therefore set out to disentangle the effects of a bottleneck itself—manifest as the population’s initial size and demographic mix following the bottleneck—and those of post-bottleneck characteristics, such as the rates of growth and mutation. To do this, we use evolutionary game theory smith1982evolution ; hofbauer1998evolutionary ; szabo2007evolutionary and, specifically, a growing variant of the otherwise well-studied Iterated Prisoner’s Dilemma (IPD) under replicator-mutator dynamics Imhof2005 ; Bladon2010 .
The growing IPD has several appealing characteristics; it is at once minimal, facilitating both analysis and simulation, but it is also sufficiently rich as to act as an effective ‘toy’ system for understanding broader phenomenology. For example, the IPD includes two stable attractors, one of which is a limit cycle, which speaks to models of stable population diversity, such as that observed in Escherichia coli durrett1997allelopathy ; kerr2002local ; kirkup2004antibiotic and side-blotched lizards sinervo1996rock that are understood via cyclic dominance szolnoki2014cyclic . The IPD also crudely captures the effects of mutation, which have so far been overlooked in the literature concerning growth, but are shown here to be crucial.
Ultimately, we demonstrate that the post-bottleneck rates of population growth and/or mutation critically determine how fixation probabilities are conditioned on initial population size and demographic mix. This means that even marginal differences to the rates of growth or mutation can result in dramatically different likelihoods of long-term outcomes, despite starting from the same founding population. For example, a bottleneck that restricts the population’s composition to the location of one of the two stable attractors typically results in long-term fixation to the same attractor. However, for certain combinations of the rates growth and mutation, this is turned on its head, and long-term fixation to the other attractor occurs with almost certainty. This counter-intuitive and critical-like behaviour broadly interpolates between known behaviours in the deterministic, large population limit, where fixation is fully determined by initial conditions, and systems at finite population size, that cannot fixate due to persistent fluctuations.
The underlying mechanism, generic across well-mixed populations, is an intrinsic noise whose standard deviation decreases in time with the inverse square root of the growing population size, . This ensures that, as a population grows, its dynamics will eventually fixate upon the stable attractors that characterise the system in the limit of very large population size. However, it also permits a diverging correlation time, so that long-term outcomes can depend on early events, even as , despite the ostensibly randomising effects of intervening fluctuations Klymko2017 . Moreover, the rate at which fluctuations are suppressed turns out to be vital to understanding the statistics of long-term fixation.
Crucially, the decreasing scale of the fluctuations couples to the geometry of the deterministic attractors, manifesting in distinct regimes of demographic behaviour. These can be explained in terms of effective non-equilibrium phases, which capture the transient characteristics of fixed- systems by averaging over large but finite times (hence excluding the disproportionate effect of certain highly rare events). Such phases are moreover shown to be delimited by transitions at critical values of . This is reminiscent of the classical study of non-equilibrium phase transitions Hinrichsen2000a ; Odor2004a , which have previously been implicated across a number of areas, including directed percolation Broadbent1957 , self-organisation of particle suspensions Corte2008 , surface growth Tu1997a , epidemiology Cardy1985a and even hard sphere packing Wilken2021 . It is within this framework that we understand the importance of the rates of population growth and mutation, which together alter the character and duration of such regimes, and hence determine the long-term impact of bottlenecks.
Our results are organised as follows. In Section II.1 we introduce the growing IPD as a toy model for understanding recovery from bottlenecks. We demonstrate that there are only three possible outcomes in the long-time limit: fixation on one of the two attractors or extinction. In Section II.2 we compute the likelihood of such fixation as a function of bottleneck (initial conditions), and the rates of growth and mutation. This illustrates our first key message: growth and mutation can critically dictate the impact of a given bottleneck on evolutionary outcomes (long-term fixation probabilities). To understand these results, Section II.3 outlines our second key message: dynamical behaviour can always be characterised by one of three effective non-equilibrium phases, dependent on the population size. These are:
-
1.
a stochastically-induced phase, at small population sizes, where state-dependent fluctuations dominate, and crossings between both basins of attraction are permitted;
-
2.
an asymmetric phase at intermediate population sizes, where crossings between the two basins of attraction are overwhelmingly likely to be in one direction only, and;
-
3.
a locked-in phase, at large population sizes, where escape from the basins of attraction is extremely unlikely.
Section II.4 then shows how a growing population exhibits these phases sequentially, in a manner controlled by the rates of growth and mutation. This suggests that our first message can be explained in terms of the second. Finally, Section II.5 validates this conjecture by satisfactorily reconstructing the outcome statistics of Section II.2 using a decomposition of conditional probabilities motivated by the observed dynamical phases.
II Results
II.1 Growing frequency-dependent IPD
The frequency-dependent IPD is a well-established evolutionary game involving three strategies. It abstracts the key facets of biological evolution and population dynamics (e.g., birth, death, and mutation) into a tractable framework whereby the fitness of individuals is determined by their relative successes and/or failures when playing each other in the repeated game, the IPD.
In the classical formulation, each player of the repeated IPD assumes one of three strategies: “always cooperate” (AllC), who cooperate in every round; “always defect” (AllD), who defect in every round, or; “tit-for-tat” (TFT), who default to cooperation for the first round and then, at a small complexity cost, copy their opponents’ moves thereafter. In a single repeated game, players accumulate payoff over the rounds according to the standard Prisoner’s Dilemma rules: if both players cooperate, they receive a larger pay-off than if they both defect, but if one player cooperates and the other defects, then the defector receives the highest possible pay-off whilst the cooperator gets the lowest payoff. The accumulated payoffs for an -round repeated game are encoded by the matrix Imhof2005 :
where and . We use , , , , and .
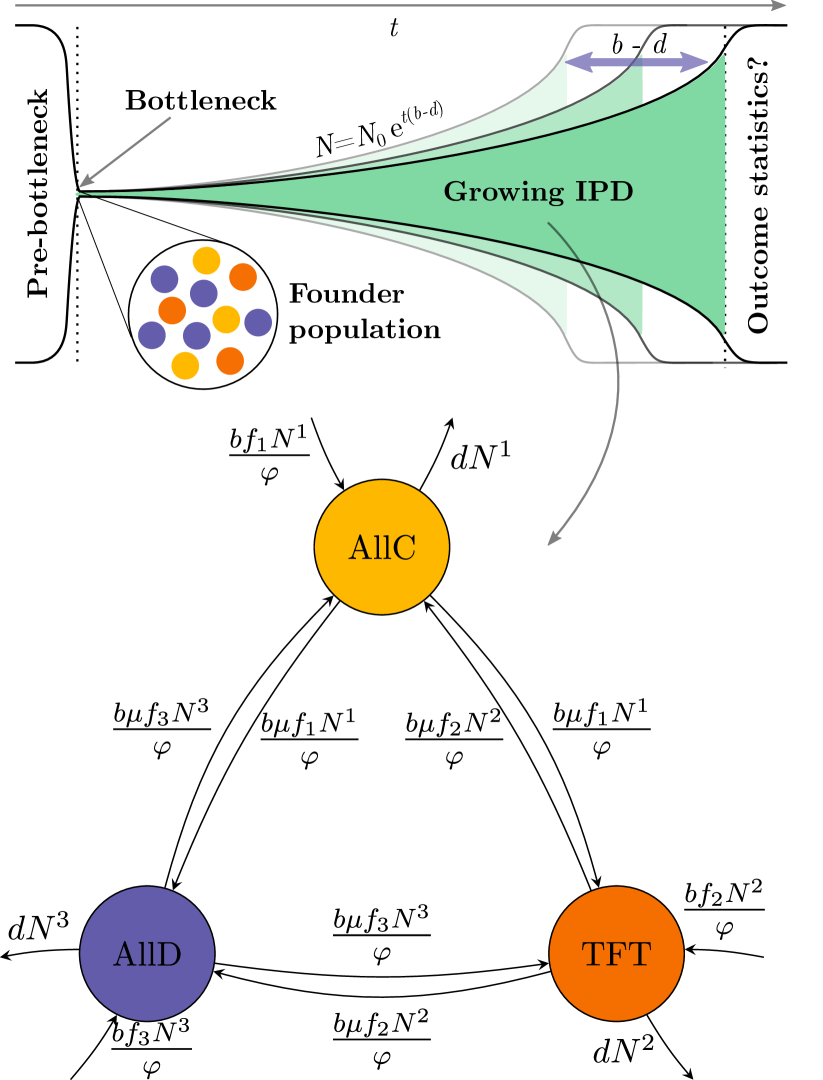
This game is then set against a backdrop of birth, death and mutation (Fig. 1). With a rate , the fraction of players born into a given strategy is proportional to the fraction of the total pay-off accumulated by that strategy when all players play each other. This is given by , where
| (1) |
is the average fitness of a given strategy when played against the whole population (including individuals of the same strategy). Here, Latin indices denote the three different strategies, i.e., , and such that the are the components of the above payoff matrix and is the number of individuals playing each strategy. In our analysis, but not in simulations, we use the simplification that
| (2) |
which, although including self-interactions, still retains all the relevant features associated with the IPD Bladon2010 . In either case, the mean fitness is . As a result, the higher the relative fitness associated with a strategy, the more likely that individuals are born with that strategy. A small fraction of births further undergo mutation and are assigned a different strategy. Death also occurs at random, with a rate .
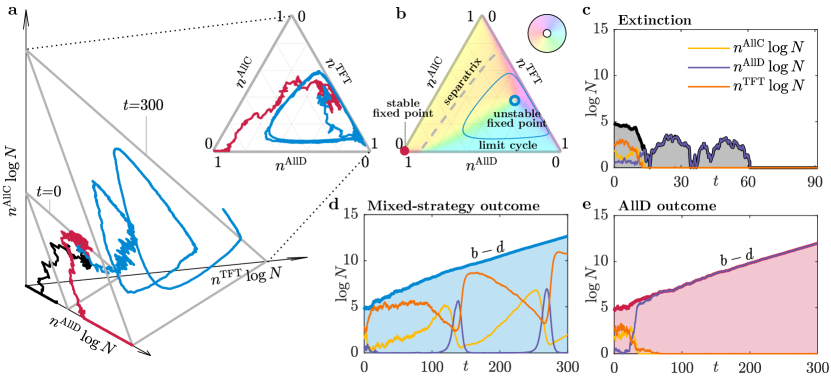
Choosing a population birth rate that is greater than the death rate gives rise to unbounded exponential (i.e., Malthusian) population growth (Fig. 2a). This rapidly suppresses fluctuations and converges to well-studied deterministic behaviour (represented on the unit simplex in Fig. 2a, inset). In particular, for values of mutation rate in the interval , there are two stable deterministic attractors Imhof2005 : a stable ‘AllD’ fixed point, where a small fraction of TFT players (who mutually cooperate) are exploited by a large population of AllD defectors, and; a stable limit cycle around an unstable ‘mixed-strategy’ fixed point (Fig. 2b & Supplementary Information, Sec. .2). The latter is characterised by a three-phase cycle whose handedness is anti-clockwise in the traditional presentation of the state-space simplex; players of TFT can out-compete those playing AllD due to their capacity for mutual cooperation, however: they are then susceptible to invasion by players of AllC due to the complexity cost, whereby; AllC players can be exploited by those playing AllD, completing the cycle.
As a consequence, only three outcomes are possible as . Either i) the population goes extinct in the early stages due to finite size fluctuations (Figs. 2a-black & c) or, its demographic mix converges on ii) the mixed-strategy limit cycle (Figs. 2a-blue & d) or iii) the AllD fixed point (Figs. 2a-red & e).
II.2 Statistics of evolutionary outcomes
Since the growing IPD is both non-linear and time-inhomogeneous, it resists most standard approaches to probabilistic analysis. Computing the statistics of the aforementioned outcomes—i.e., the fixation probabilities—therefore involves using a high performance computing facility Smith_Betbeder_Matibet_2010 to perform stochastic simulations.
Specifically, we employ a hybrid Gillespie-Itô approach (see Supplementary Information, Sec. .1) to approximate the following fixation probability:
| (3) |
where . This is the limiting probability, after long times, that the system converges to the AllD fixed point, given specified post-bottleneck initial conditions, and conditioned on populations that do not become extinct.
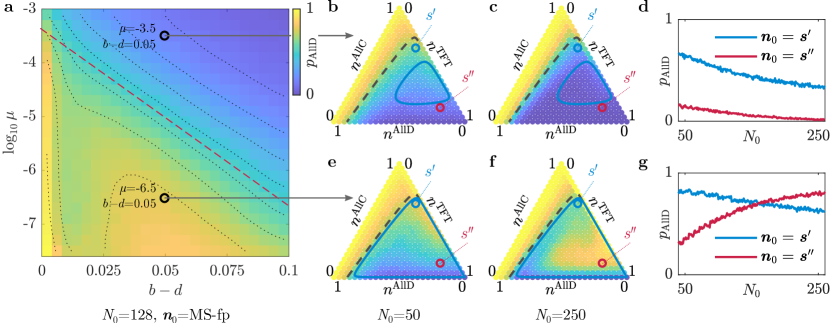
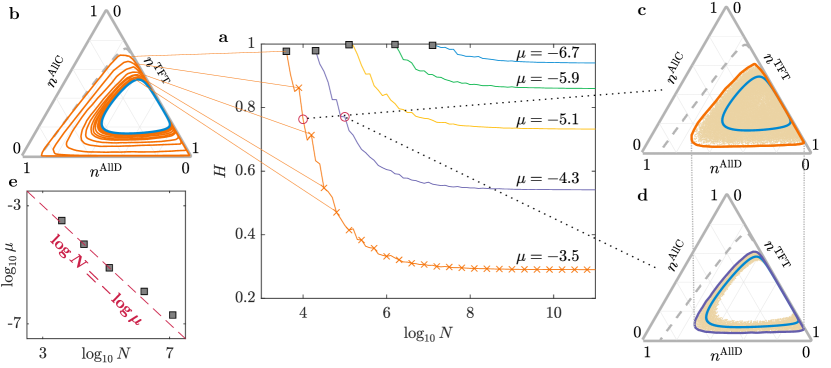
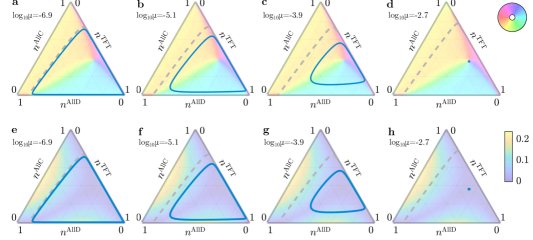
The results demonstrate several interesting features. For instance, choosing to be the unstable mixed-strategy fixed point, we see that depends on both the rate of population growth and the rate of mutation (Fig. 3a). Similarly, fixing the rates of population growth and mutation reveals sensitivity to initial conditions, where depends on both initial demographic mix, , and initial population size, (Figs. 3b-g).
The parameter space of mutation and growth rates can moreover be divided into two qualitative regions (panel a, red dashed line).
In the upper region, behaviour agrees with the expectation that faster growth rates reduce intrinsic fluctuations more rapidly and therefore increase the likelihood of fixation within the same basin of attraction that the system started (panel a). Similarly, as the initial population size, , increases, the system experiences fewer large fluctuations at early times and hence this also increases the likelihood of fixation within the starting basin of attraction (Figs. 3b-d).
In the lower region, however, behaviour is more complex. There are high likelihoods of an AllD outcome at both low () and intermediate () rates of growth (panel a). This results in a non-monotonic dependence of as a function of population growth. That is, despite more rapidly reducing the fluctuations that are ostensibly required to cross the separatrix between mixed-strategy and AllD basins, growth can actually increase the likelihood of fixating on the AllD fixed point. Similarly, rather than decreasing the likelihood of crossing the separatrix and fixating there, increasing can actually increase this likelihood for certain initial states, confounding expectations regarding the role of fluctuations at early times when populations remain small (Figs. 3e-g).
In the context of population bottlenecks, this demonstrates that the long-term ramifications of reducing a population to a particular size and demographic mix can depend, critically, on the rates of post-bottleneck growth and mutation.
II.3 Effective non-equilibrium phases
To understand the non-trivial behaviour in Fig. 3, we repeatedly simulate the fixed population size IPD (Supplementary Information, Secs. .1 & .7), computing a so-called empirical distribution touchette_introduction_2018 . Specifically, we calculate the mean fraction of time spent in the AllD basin,
| (4) |
where is the indicator function, denotes the size of the ensemble over which the average is taken, and the integration is understood in the Itô sense. The time exceeds the entire duration of our growing simulations (which we stop at ) and represents an effective cutoff, so that the statistics of fixed size simulations are not skewed by events that are highly unlikely to occur in the growing simulations (i.e., with characteristic rates ). Such a large but finite therefore aims to capture the average transient behaviour of a growing population at a particular .
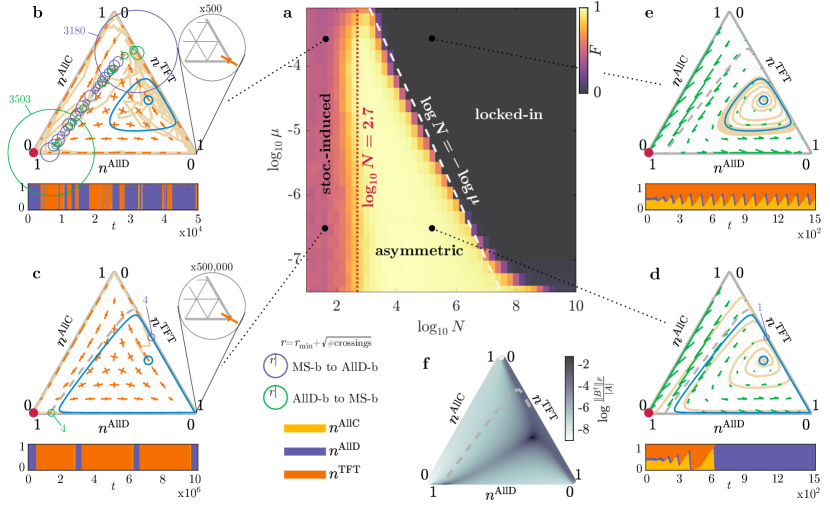
Our results (Fig. 4a) are suggestive of a large deviation principle, such that , where is a convex rate function. Although determining the precise functional form of is considered out-of-scope for this article, our data suggests that it has only three zeros, despite varying over ten orders of magnitude:
| (5) |
This means that, depending on the population size, there are three statistically distinct types of characteristic demographic behaviour. Due to the finite size of , we call these effective non-equilibrium phases. The three effective phases are characterised as follows:
-
1.
Stochastically-induced phase— Demographic trajectories at small population sizes are characterised by large intrinsic fluctuations and an intermediate value of (Fig. 4a in magenta, Figs. 4b & c). Fluctuations are both correlated and state-dependent; features that are captured by the symmetric correlation matrix, , that can be obtained by performing a Van Kampen system-size expansion van_kampen and projecting the results onto the unit simplex using Itô’s lemma (Fig. 4b & c, orange crosses, and Supplementary Information, Sec. .5). The frequency-dependent nature of births means that fluctuations at the centre of the simplex are large and isotropic, whilst the components normal to the boundaries decrease rapidly as the edges and corners are approached. This gives rise to stochastically-induced effects Horsethemke2006 ; Jhawar2020 , where fluctuation gradients bias stochastic trajectories, driving them towards the simplex edges and corners, on average (Fig. 4b & c and Supplementary Information Secs. .3-.5). Despite such overall behaviour, is not symmetric under the interchange of , and , and stochastic trajectories retain characteristics encoded by the payoff matrix; including a bias for anti-clockwise motion, and a comparatively low likelihood of reaching the AllC corner (when compared to AllD and TFT corners). These behaviours are crucial to understanding the precise -dependent mechanisms that underpin the value .
-
2.
Asymmetric phase— Increasing , the magnitude of fluctuations decreases, and the relative geometry of the underlying attractors becomes increasingly important. In particular, the system enters an asymmetric regime at populations above , for which (Fig. 4a, yellow). Here, state-dependent fluctuations permit the system to cross from the mixed-strategy limit cycle to the AllD basin, but not from the AllD fixed point to the basin of the limit cycle (Fig. 4d). In other words, once the separatrix has been crossed, trajectories are extremely unlikely to come back within the time .
-
3.
Locked-in phase— Once is sufficiently large, fluctuations are small and demographic trajectories are effectively locked into the mixed-strategy basin for times , implying (Fig. 4e, dark gray).
The aforementioned effective phases moreover couple to mutation, which alters both the character of the stochastically-induced phase (Figs. 4b & c), and the population size at which the system transitions from asymmetric to locked-in phases (Fig. 4a, white dashed line).
The origin of the former is that the standard deviation of fluctuations normal to the boundaries is (Supplementary Information, Sec..6). Evolutionary trajectories therefore become increasingly confined to the boundaries as decreases (Figs. 4b & c). This not only exacerbates stochastically-induced effects, but also increases the mean residence times associated with the corners. In particular, at comparatively high levels of mutation, residence times are less than , which results in a stochastic cycling between TFT and AllD corners (recall that there is a lower likelihood of finding the AllC corner) (Fig. 4b). Since these two corners have comparable mean rates of escape to the opposite basin of attraction (Supplementary Information, Sec..8), takes a value of approximately . By contrast, lower rates of mutation imply dwell times greater than (Fig. 4c). On average, therefore, the system will find either the AllD or TFT corner and then remain there. Here, the value of results from the position of the mixed strategy fixed point, and the correspondingly equal probability that trajectories are expelled to either the AllD or TFT corners (typically, via the AllC-TFT edge, see Fig. 4f).
For the latter, the dependence of the asymmetric to locked-in transition can be understood in terms of the stochastic ‘footprint’ of evolutionary trajectories in the locked-in regime— i.e., those that repeatedly (and stochastically) navigate the limit cycle (Fig. 5). In particular, due to the finite nature of , the convex hull of this footprint is well-defined, reflecting the shape of the limit cycle at a different value of (Fig. 5a-d). The result is a family of scaling relations, where the footprint of small populations with high levels of mutation (i.e., high noise, small limit cycle, Fig. 5c) is approximately equivalent to that of large populations with low levels of mutation (i.e., low noise, large limit cycle, Fig. 5d). The critical scaling that defines the onset of the regime occurs when the stochastic footprint fills the mixed-strategy basin (Figs. 5a & e), therefore facilitating the crossing of the separatrix. Here, fluctuations must be equivalent to the deterministic repulsion in the direction normal to the AllC-TFT edge (Supplementary Information, Sec. .6), implying , which agrees with both ensemble statistics and convex hull analysis (cf. Figs. 4a & 5e).
This behaviour can be recast as a size-dependent antagonistic relationship between mutation and intrinsic noise, where the former favours population heterogeneity (expelling towards the simplex boundaries) and the second homogeneity (attracting towards the centre of the simplex). This is particularly important in growing populations, since the balance between the two factors changes over time.
II.4 Dynamical regimes in growing populations
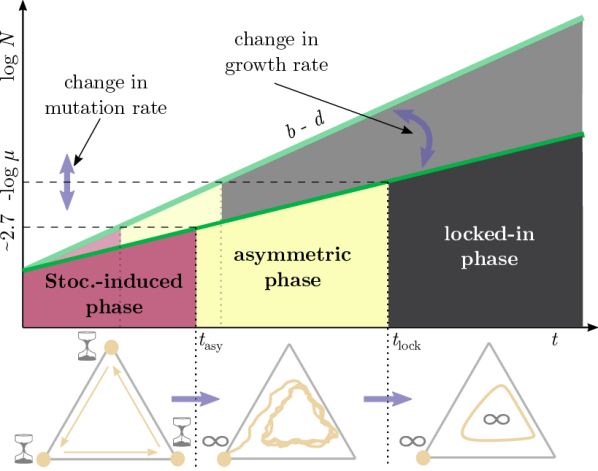
As a population grows, it exhibits the three effective phases in sequence, with transitions occurring abruptly at critical population sizes (Fig. 6). Thus, despite the population size steadily increasing, dynamical behaviour manifests in three distinct regimes.
Seen through this lens, it is clear that changing the rate of growth changes the duration of the stochastically-induced and asymmetric phases by an overall factor (the locked-in phase is, in principle, open-ended). By contrast, the rate of mutation changes only the duration of the asymmetric phase (by virtue of the -dependent transition to the locked-in phase).
The asymmetric phase is especially important for determining fixation probabilities. If the separatrix is crossed from the mixed-strategy basin during this phase, then the system remains in the basin of the AllD fixed point until the onset of the locked-in phase, where it remains for all until the population reaches . Therefore, the longer the duration of the asymmetric phase, the greater the likelihood of crossing the separatrix.
However, despite the appeal of this heuristic, we must also account for the fact that this likelihood is also conditioned on the state at which the system enters the asymmetric regime. This is determined by the duration of preceding stochastically-induced regime, which is set by the rate of growth. It is also determined by the character of that regime, which is set by mutation. Despite the presence of two -dependent mechanisms in the fixed- ensemble (see previous Section) it should be stressed that, in a growing system the duration of the stochastically-induced regime is sufficiently short in comparison to corner dwell times that, for all but pathologically slow growth rates or very large , the separatrix is only ever likely to be crossed once. In turn, this puts greater emphasis on the role of the system’s initial conditions.
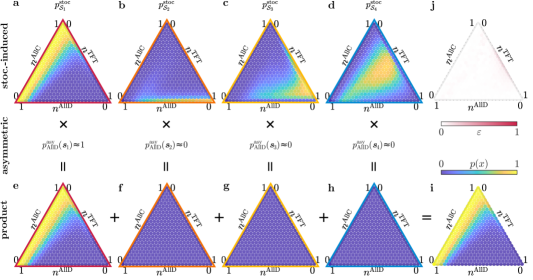
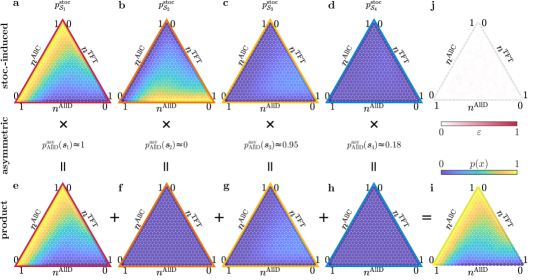
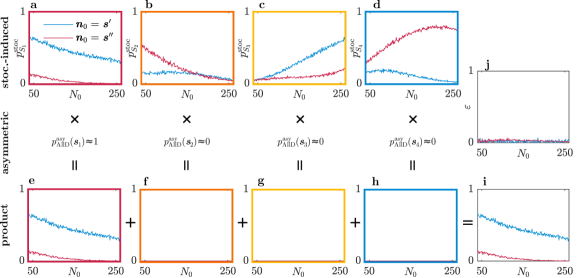
To test our understanding of this complex interplay, we construct an approximation to the full outcome statistics. This is based on a decomposition in terms of conditional probabilities associated with each phase, and four ‘equivalence classes’ of states at the start of the asymmetric phase.
II.5 Equivalence classes
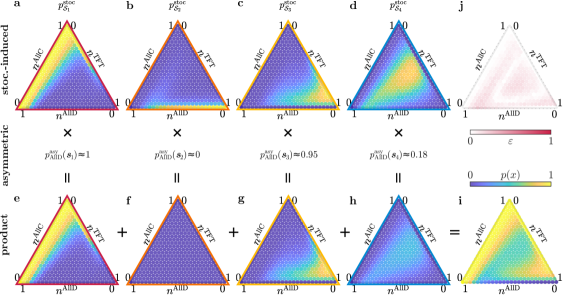
Consider the conditional probability , where avoidance of extinction is now assumed implicitly. That is, the likelihood of being in the AllD basin at the onset of the locked-in phase, , given that the system was in a state at the onset of the asymmetric phase, . Computing this probability via stochastic simulation demonstrates the existence of three approximate equivalence classes, , such that is agnostic to the demographic mix , at the onset of the asymmetric phase (Fig. 7a and Supplementary Information, Fig. 11). These are: those states in the AllD basin, ; those along the AllD-TFT edge that stretch from the separatrix to the TFT corner, , and; those along the TFT-AllC edge (excluding the TFT corner) on the mixed-strategy side of the separatrix, . The remaining states of the mixed-strategy basin are labelled . Whilst these do not form an equivalence class, we assume (and later show) that they only minimally contribute to overall fixation probabilities.
The existence of equivalence classes prompts the following simplification (Supplementary Information, Sec. .9):
| (6) |
where (again, with avoidance of extinction assumed implicitly), and states can be chosen arbitrarily from . This approximation allows us to verify our heuristic understanding of how the rates of growth and mutation impact fixation probabilities by controlling the duration and stochastic character of dynamical phases and therefore the likelihood of (stochastic) behaviours, such as crossing the separatrix, that are crucial in dictating long-term outcomes. It also dramatically reduces the computational time needed to calculate for a range of different initial conditions, since we only need to recalculate the four likelihoods that the stochastically-induced regime finishes in each of the equivalence classes, respectively. The conditional probability , by contrast, does not depend on the specific initial conditions (but rather in which equivalence class the system is at time ).
Growth and mutation
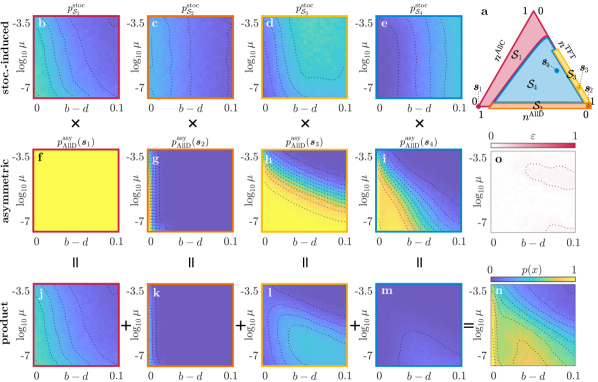
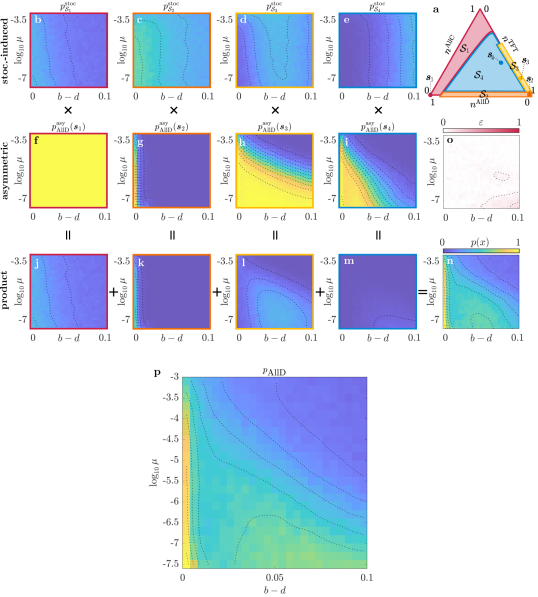
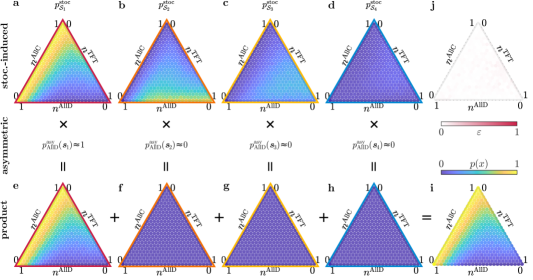
Fixing the mixed-strategy fixed point as the initial demographic mix, we can use Eq. (6) to deconstruct the dependence of on the rates of growth and mutation (Fig. 7).
In the stochastically-induced regime, fluctuation gradients ‘drive’ trajectories from the centre of the mixed-strategy basin towards the simplex edges and then the corners. As a result, the growth-dependent (average) duration of the regime, , dictates in which class the trajectories are likely to start the asymmetric phase: rapid growth rates are required to confine trajectories that end in the mixed-strategy basin to the region, whilst intermediate and slow growth rates suffice for the and regions, respectively (Figs. 7c-e). Although the average time spent in the two basins by such trajectories during the stochastically-induced regime is independent of (Fig. 4a), the likelihood that the system is in at time actually increases with decreasing (Fig. 7b). The reason is that decreasing changes the shape of the separatrix, therefore reducing the the size of the region (Supplementary Information, Sec. .10).
The asymmetric regime, by contrast, has a duration that is both growth- and -dependent: . Here, the probability of crossing the separatrix hinges, principally, on the likelihood of avoiding the TFT corner and its associated large confinement times (Figs. 7g-i). For example, must be extremely long in order to permit crossings from the region, since populations starting the asymmetric regime from this region encounter the TFT corner with almost certainty. Crossings from the region, however, occur at more modest — achieved by either low growth and high , or modest growth and low — reflecting the possibility that trajectories might avoid the TFT corner. Those from the region can happen at the smallest , since there is a high likelihood that trajectories will avoid the TFT corner (recall the anti-clockwise dynamics) and the ratio of the magnitude of stochastic effects to the magnitude of the deterministic flow is large in (see Fig. 4f).
Combining these conditional probabilities using Eq. (6) satisfactorily reproduces the overall statistics of demographic outcomes (cf. Fig. 7n and Fig. 3a): the difference between our approximation and the full simulations have a mean value of , when averaged over growth and mutation rates, and a maximum value of (Fig. 7o). This also confirms our assertion that the trajectories that start the asymmetric phase from the region do not impact long-term outcomes. The reason is that this only happens with significant likelihood when growth rates are high, which simultaneously ensures that such trajectories never cross the separatrix (Figs. 7e, i & m). The same decomposition is shown for initial demographic mixes other than the mixed-strategy fixed point in Supplementary, Sec. .11.
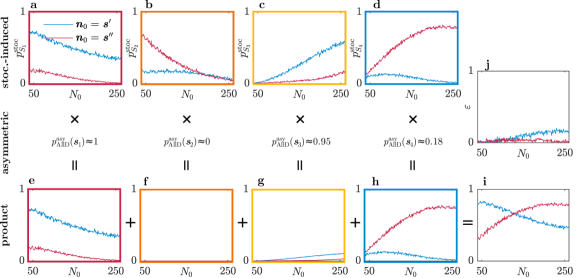
Initial conditions
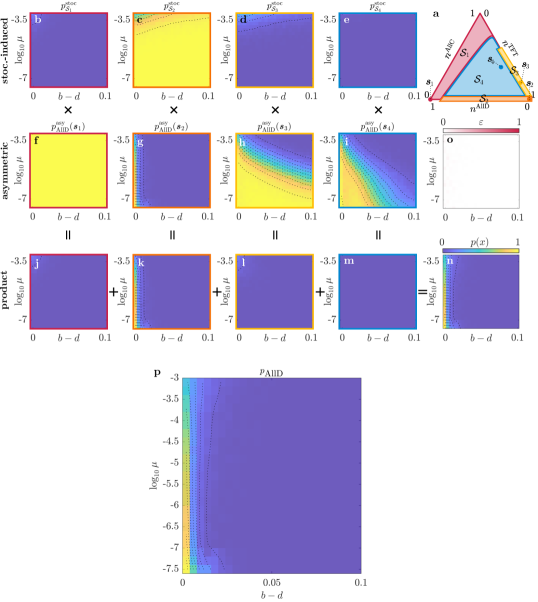
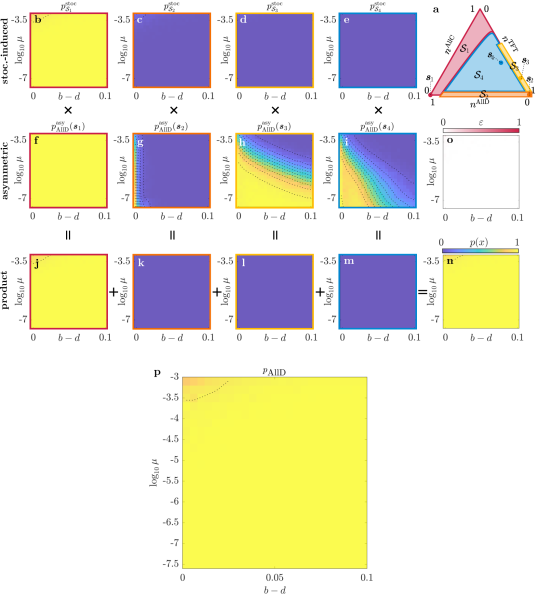
The approximation in Eq. (6) further provides insight into the founder-like dependence of fixation probabilities on initial conditions (Fig. 8 and Supplementary Information, Figs. 16-18). At high values of , the asymmetric phase has negligible duration and behaviour is trivial (Figs. 3b & c, Supplementary Information, Figs. 16 & 17). At low values of , however, the asymmetric regime cannot be ignored and has a significant bearing on fixation probabilities.
In this case, if the initial population size is small (Fig. 3e, Supplementary Information, Fig. 18), then the stochastically-induced phase is sufficiently long as to expel trajectories to the AllD or TFT corners from the AllD or mixed-strategy basins, respectively. Only the former trajectories impact fixation probabilities, however, since for all but the slowest growth rates, trajectories stuck in the TFT corner have a residence time longer than the duration of the asymmetric regime.
By contrast, if the initial population size is large (Fig. 3f and Fig. 8), then the duration of the stochastically-induced phase is not long enough to expel trajectories to the boundaries and/or corners, resulting in a non-zero likelihood of starting the asymmetric regime from either the or regions. For the former, there is a high probability of crossing to the AllD basin during the asymmetric regime, since the deterministic flows direct demographic trajectories towards the separatrix. For the latter, this probability is much lower, since trajectories are more likely to be entrained to the limit cycle. Nevertheless, the small contribution that results from the region breaks one of the assumptions on which Eq. (6) is based, which also explains why the error in our decomposition increases with for certain values of and (the mean value of the error in Fig. 8j is , while the maximum value is ). Of note, the values shown in Fig. 8 are the worst case of those we have simulated (Supplementary Information, Sec. .12).
III Discussion
Using a growing variant of an iconic model of evolutionary game theory, we have demonstrated the existence of non-trivial fluctuation-mediated effects in growing populations, whereby the rates of growth and mutation critically determine how fixation probabilities are conditioned on initial population size and demographic mix. This has ramifications for the understanding of population bottlenecks and their long-term impact. The implication is that the population growth commonly associated with post-bottleneck recovery can, in fact, be as important as the effects of the bottleneck on population size and demographic mix.
Our findings apply to populations that are well-mixed, and as such pertain to systems that combine short-range interactions with a mechanism for mixing that is fast on the timescales of the population dynamics, or those that otherwise have effectively long-range interactions, either explicitly or via the mutual interaction with public resource (although some of these assumptions have recently been brought into question Herrerias-Azcue2018a ).
In this context, we follow several pioneering works that have characterised various effects of growth in well-mixed populations Melbinger2010 ; Cremer2011 ; Huang2015 ; Constable2016 ; Ashcroft2017 . Although they do not explicitly examine the role of initial conditions, the behaviours appearing in two of these works Constable2016 ; Ashcroft2017 are related to the those reported here. As are several studies concerning growing systems of binary ‘spins’ RGMTCR14 ; Klymko2017 ; Jack2019 .
The shared mechanism in all these cases is the presence of intrinsic fluctuations that decrease as the system grows. This has two main ramifications: first, ergodicity is broken, implying that a population fixates even in the presence of non-zero mutation, and; second, there is a decreasing scale by which fluctuations can couple dynamically to the geometry of underlying deterministic attractors of the system. It is the combination of these effects that gives rise to our headline behaviour: fixation probabilities that depend non-trivially on initial conditions (or otherwise stochastic events at early times), even as .
Such fluctuation-mediated effects are further characterised by a dependence on the rates of growth and mutation, which we explain by putting forward the notion of effective non-equilibrium phase transitions, and showing that these delimit distinct demographic regimes in our model. The rate of growth controls the overall rate at which intrinsic fluctuations decrease, and therefore also the relative duration of such demographic regimes. Mutation, by contrast, has two related effects. First, it changes the nature of the underlying deterministic attractors (the size of the mixed-strategy limit cycle, in our case) and hence the structure to which decreasing fluctuations couple. Second, it also changes the state-dependence of the fluctuations. Whilst the former impacts the character of the initial stochastically-induced phase, it is the combination of both of these effects that sets the dependence of the critical transition between the intermediate asymmetric and the final locked-in phases.
The latter behaviour is an example of a potentially interesting and unexpected antagonistic relationship between two sources of stochasticity: mutation and the intrinsic effects of finite-sized populations. In our model and other studies, mutation promotes heterogeneity, whilst intrinsic fluctuations typically drive the system towards homogeneity RGMTCR14 . This is particularly important in the context of population growth, since the effects of mutation do not depend on the population size, whereas the stochastically-induced forcing due to intrinsic noise decreases with increasing population size. As a result, we speculate the other growing systems may also exhibit mutation-dependent critical transitions, where the effects of intrinsic fluctuations are balanced by those of mutation.
More generally, for growing well-mixed populations with all but the simplest of deterministic attractors—i.e., fixed points, limit cycles and stable manifolds etc.—the implication is that growth may be synonymous with effective non-equilibrium phase transitions. Understanding whether and how these fit into the existing literature is an open question. Of potential interest is the ongoing challenge to classify non-equilibrium phase transitions by their universality classes Odor2004a . Work has been undertaken to describe single absorbing state transitions (of the directed-percolation type) Hinrichsen2000a ; Janssen1981 ; Grassberger1981 and also symmetric absorbing state transitions AlHammal2005 , but there appears to be very little literature on asymmetric absorbing state transitions.
Theoretical considerations aside, we put forward that our ideas may be examined within the context of directed evolution romero2009exploring ; tracewell2009directed . Here, another, albeit direct, interplay between growth and mutation has already been demonstrated: mutations occurring at the genetic loci associated with growth-control promote so-called genetic instabilities coelho2019heterozygous . Our results also appear relevant to state-of-the-art in silico representations of directed evolution, where the role of intrinsic fluctuations during growth has so far been overlooked chang2021engineering . A further setting that may prove relevant is that of quasispecies such as viruses. Viruses have both high rates of mutation and growth (cf. Fig. 3a, upper region), and appear to be largely unaffected by the many population bottlenecks involved in host-to-host transmission, as well as its intra-host (e.g., plaque-to-plaque) spreading domingo2012viral ; domingo2021historical ; weaver2021population .
Nevertheless, bridging the gap between the abstract setting of the present work and the aforementioned applications will undoubtedly involve significant work. The extent to which this will be possible remains an open question, and may hinge on features that are not included in our model, such as spatial structure and/or other physical constraints lieberman2005evolutionary ; allesina2011competitive ; hindersin2015most ; marrec2021toward . So-called “patch” models of interacting locally well-mixed subpopulations is one avenue that may prove promising. Exploring how the ideas set out here translate across a wider class of systems is therefore an important avenue of future research, and we welcome further work in the area.
Author contributions
EC and JP performed simulations and analysis, under the guidance of ST and RM. EC and RM wrote the manuscript, with help from JP and ST. The project initially arose from discussions between JP, ST and RM.
Acknowledgements.
The authors would like to thank V. Guttal for helpful discussions at the project’s outset. RGM and EC acknowledge EMBL Australia for funding. We further acknowledge support from the Simons Foundation (Grant No. 287975 to ST), the Max Planck Society through a Max-Planck-Partner-Group at NCBS-TIFR (ST) and the Department of Atomic Energy, Government of India, under projects RTI4001 and RTI4006. This research includes computations using the computational cluster Katana supported by Research Technology Services at UNSW Sydney.References
- (1) Mayr, E. Change of genetic environment and evolution (1954).
- (2) Nei, M., Maruyama, T. & Chakraborty, R. The Bottleneck Effect and Genetic Variability in Populations. Evolution 29, 1 (1975). URL https://www.jstor.org/stable/2407137?origin=crossref.
- (3) Domingo, E., Sheldon, J. & Perales, C. Viral quasispecies evolution. Microbiology and Molecular Biology Reviews 76, 159–216 (2012).
- (4) Weaver, S. C., Forrester, N. L., Liu, J. & Vasilakis, N. Population bottlenecks and founder effects: implications for mosquito-borne arboviral emergence. Nature Reviews Microbiology 19, 184–195 (2021).
- (5) Keller, L. F. et al. Immigration and the ephemerality of a natural population bottleneck: evidence from molecular markers. Proceedings of the Royal Society of London. Series B: Biological Sciences 268, 1387–1394 (2001). URL https://royalsocietypublishing.org/doi/10.1098/rspb.2001.1607.
- (6) Keller, L. F., Arcese, P., Smith, J. N. M., Hochachka, W. M. & Stearns, S. C. Selection against inbred song sparrows during a natural population bottleneck. Nature 372, 356–357 (1994). URL http://www.nature.com/articles/372356a0.
- (7) Doherty, P. J. et al. High mortality during settlement is a population bottleneck for a tropical surgeonfish. Ecology 85, 2422–2428 (2004). URL http://doi.wiley.com/10.1890/04-0366.
- (8) Hoelzel, A. R., Fleischer, R. C., Campagna, C., Le Boeuf, B. J. & Alvord, G. Impact of a population bottleneck on symmetry and genetic diversity in the northern elephant seal. Journal of Evolutionary Biology 15, 567–575 (2002). URL http://doi.wiley.com/10.1046/j.1420-9101.2002.00419.x.
- (9) Manica, A., Amos, W., Balloux, F. & Hanihara, T. The effect of ancient population bottlenecks on human phenotypic variation. Nature 448, 346–348 (2007). URL http://www.nature.com/articles/nature05951.
- (10) Melbinger, A., Cremer, J. & Frey, E. Evolutionary Game Theory in Growing Populations. Physical Review Letters 105, 178101 (2010). URL https://link.aps.org/doi/10.1103/PhysRevLett.105.178101.
- (11) Cremer, J., Melbinger, A. & Frey, E. Evolutionary and population dynamics: A coupled approach. Physical Review E 84, 051921 (2011). URL https://link.aps.org/doi/10.1103/PhysRevE.84.051921.
- (12) Huang, W., Hauert, C. & Traulsen, A. Stochastic game dynamics under demographic fluctuations. Proceedings of the National Academy of Sciences 112, 9064–9069 (2015). URL http://www.pnas.org/lookup/doi/10.1073/pnas.1418745112.
- (13) Constable, G. W. A., Rogers, T., McKane, A. J. & Tarnita, C. E. Demographic noise can reverse the direction of deterministic selection. Proceedings of the National Academy of Sciences 113, E4745–E4754 (2016). URL http://www.pnas.org/lookup/doi/10.1073/pnas.1603693113.
- (14) Ashcroft, P., Smith, C. E., Garrod, M. & Galla, T. Effects of population growth on the success of invading mutants. Journal of Theoretical Biology 420, 232–240 (2017). URL https://linkinghub.elsevier.com/retrieve/pii/S0022519317301261.
- (15) Smith, J. M. Evolution and the Theory of Games (Cambridge university press, 1982).
- (16) Hofbauer, J., Sigmund, K. et al. Evolutionary games and population dynamics (Cambridge university press, 1998).
- (17) Szabó, G. & Fath, G. Evolutionary games on graphs. Physics reports 446, 97–216 (2007).
- (18) Imhof, L. A., Fudenberg, D. & Nowak, M. A. Evolutionary cycles of cooperation and defection. Proceedings of the National Academy of Sciences 102, 10797–10800 (2005). URL http://www.pnas.org/cgi/doi/10.1073/pnas.0502589102.
- (19) Bladon, A. J., Galla, T. & McKane, A. J. Evolutionary dynamics, intrinsic noise, and cycles of cooperation. Physical Review E 81, 066122 (2010). URL https://link.aps.org/doi/10.1103/PhysRevE.81.066122.
- (20) Durrett, R. & Levin, S. Allelopathy in spatially distributed populations. Journal of theoretical biology 185, 165–171 (1997).
- (21) Kerr, B., Riley, M. A., Feldman, M. W. & Bohannan, B. J. Local dispersal promotes biodiversity in a real-life game of rock–paper–scissors. Nature 418, 171–174 (2002).
- (22) Kirkup, B. C. & Riley, M. A. Antibiotic-mediated antagonism leads to a bacterial game of rock–paper–scissors in vivo. Nature 428, 412–414 (2004).
- (23) Sinervo, B. & Lively, C. M. The rock–paper–scissors game and the evolution of alternative male strategies. Nature 380, 240–243 (1996).
- (24) Szolnoki, A. et al. Cyclic dominance in evolutionary games: a review. Journal of the Royal Society Interface 11, 20140735 (2014).
- (25) Klymko, K., Garrahan, J. P. & Whitelam, S. Similarity of ensembles of trajectories of reversible and irreversible growth processes. Physical Review E 96, 042126 (2017). URL https://link.aps.org/doi/10.1103/PhysRevE.96.042126.
- (26) Hinrichsen, H. Non-equilibrium critical phenomena and phase transitions into absorbing states. Advances in Physics 49, 815–958 (2000). URL http://www.tandfonline.com/doi/abs/10.1080/00018730050198152.
- (27) Ódor, G. Universality classes in nonequilibrium lattice systems. Reviews of Modern Physics 76, 663–724 (2004). URL https://link.aps.org/doi/10.1103/RevModPhys.76.663.
- (28) Broadbent, S. R. & Hammersley, J. M. Percolation processes. Mathematical Proceedings of the Cambridge Philosophical Society 53, 629–641 (1957). URL https://www.cambridge.org/core/product/identifier/S0305004100032680/type/journal{_}article.
- (29) Corté, L., Chaikin, P. M., Gollub, J. P. & Pine, D. J. Random organization in periodically driven systems. Nature Physics 4, 420–424 (2008). URL http://www.nature.com/articles/nphys891.
- (30) Tu, Y., Grinstein, G. & Muñoz, M. A. Systems with Multiplicative Noise: Critical Behavior from KPZ Equation and Numerics. Physical Review Letters 78, 274–277 (1997). URL https://link.aps.org/doi/10.1103/PhysRevLett.78.274.
- (31) Cardy, J. L. & Grassberger, P. Epidemic models and percolation. Journal of Physics A: Mathematical and General 18, L267–L271 (1985). URL https://iopscience.iop.org/article/10.1088/0305-4470/18/6/001.
- (32) Wilken, S., Guerra, R. E., Levine, D. & Chaikin, P. M. Random Close Packing as a Dynamical Phase Transition. Physical Review Letters 127, 038002 (2021). URL https://link.aps.org/doi/10.1103/PhysRevLett.127.038002.
- (33) Smith, D. & Betbeder-Matibet, L. Katana. Tech. Rep. (2010).
- (34) Touchette, H. Introduction to dynamical large deviations of markov processes. Physica A: Statistical Mechanics and its Applications 504, 5–19 (2018).
- (35) van Kampen, N. G. Stochastic processes in physics and chemistry (Elsevier, Amsterdam, 1992).
- (36) Horsethemke, W. & Lefever, R. Noise-Induced Transitions, vol. 15 of Springer Series in Synergetics (Springer Berlin Heidelberg, 2006). URL http://link.springer.com/10.1007/3-540-36852-3.
- (37) Jhawar, J. et al. Noise-induced schooling of fish. Nature Physics (2020). URL http://www.nature.com/articles/s41567-020-0787-y.
- (38) Herrerías-Azcué, F., Pérez-Muñuzuri, V. & Galla, T. Stirring does not make populations well mixed. Scientific Reports 8, 4068 (2018). URL http://www.nature.com/articles/s41598-018-22062-w.
- (39) Morris, R. G. & Rogers, T. Growth-induced breaking and unbreaking of ergodicity in fully-connected spin systems. Journal of Physics A: Mathematical and Theoretical 47, 342003 (2014). URL http://stacks.iop.org/1751-8121/47/i=34/a=342003?key=crossref.80b743c6ffee60b17655974228dcf8f9.
- (40) Jack, R. L. Large deviations in models of growing clusters with symmetry-breaking transitions. Physical Review E 100, 012140 (2019). URL https://link.aps.org/doi/10.1103/PhysRevE.100.012140.
- (41) Janssen, H.-K. On the nonequilibrium phase transition in reaction-diffusion systems with an absorbing stationary state. Zeitschrift für Physik B Condensed Matter 42, 151–154 (1981).
- (42) Grassberger, P. On Phase Transitions in Schlögl’s Second Model. 262–262 (1981). URL http://link.springer.com/10.1007/978-3-642-81778-6{_}49.
- (43) Al Hammal, O., Chaté, H., Dornic, I. & Muñoz, M. A. Langevin Description of Critical Phenomena with Two Symmetric Absorbing States. Physical Review Letters 94, 230601 (2005). URL https://link.aps.org/doi/10.1103/PhysRevLett.94.230601.
- (44) Romero, P. A. & Arnold, F. H. Exploring protein fitness landscapes by directed evolution. Nature reviews Molecular cell biology 10, 866–876 (2009).
- (45) Tracewell, C. A. & Arnold, F. H. Directed enzyme evolution: climbing fitness peaks one amino acid at a time. Current opinion in chemical biology 13, 3–9 (2009).
- (46) Coelho, M. C., Pinto, R. M. & Murray, A. W. Heterozygous mutations cause genetic instability in a yeast model of cancer evolution. Nature 566, 275–278 (2019). URL http://www.nature.com/articles/s41586-019-0887-y.
- (47) Chang, C.-Y. et al. Engineering complex communities by directed evolution. Nature ecology & evolution 5, 1011–1023 (2021).
- (48) Domingo, E., García-Crespo, C. & Perales, C. Historical perspective on the discovery of the quasispecies concept. Annual Review of Virology 8, 51–72 (2021).
- (49) Lieberman, E., Hauert, C. & Nowak, M. A. Evolutionary dynamics on graphs. Nature 433, 312–316 (2005).
- (50) Allesina, S. & Levine, J. M. A competitive network theory of species diversity. Proceedings of the National Academy of Sciences 108, 5638–5642 (2011).
- (51) Hindersin, L. & Traulsen, A. Most undirected random graphs are amplifiers of selection for birth-death dynamics, but suppressors of selection for death-birth dynamics. PLoS computational biology 11, e1004437 (2015).
- (52) Marrec, L., Lamberti, I. & Bitbol, A.-F. Toward a universal model for spatially structured populations. Physical Review Letters 127, 218102 (2021).
- (53) Gillespie, D. T. Exact stochastic simulation of coupled chemical reactions. The journal of physical chemistry 81, 2340–2361 (1977).
- (54) Gillespie, D. T. The chemical Langevin equation. The Journal of Chemical Physics 113, 297–306 (2000). URL http://aip.scitation.org/doi/10.1063/1.481811.
- (55) Gardiner, C. W. Handbook of stochastic methods (Springer, 2003), 3rd edn.
Supplementary Information
.1 Gillespie-Itô simulations
The Gillespie algorithm gillespie1977exact ; Gillespie2000a allows the exact simulation of the stochastic dynamics of the growing IPD when is small, i.e., when such dynamics cannot be approximated by simply integrating the SDEs (see Secs. .3 & .4). The downside of this algorithm is that its computational time scales linearly with , becoming impractical as the population grows. We therefore adopt a hybrid approach: when is smaller than a chosen threshold the system’s dynamics are simulated with the Gillespie algorithm, and when the threshold is exceeded they are simulated by numerically integrating the SDEs (Euler-Maruyama). Since the latter method results in values of along the real line, rounding is required if stochastic fluctuations trigger a switch back to the Gillespie algorithm.
Our choice for the algorithm switch threshold is . This is motivated by the existence of the locked-in phase, which begins when (see Fig. 4). During this phase, the risk that the SDE approximation would lead to an ‘accidental’ crossing of the separatrix is extremely small. A minimum threshold of is used for simulations with large .
All results were obtained using the High Performance Computing facility Katana Smith_Betbeder_Matibet_2010 . The results in Fig. 3a (and Figs. 13-15, panel p), were obtained with repetitions of the hybrid Gillespie-Itô simulations for each combination of and (fixing ). Each repetition was carried out until . The results in Fig. 3b-g were similarly obtained with repetitions for each initial condition. The results in Fig. 7b-i (and Figs. 13-15, panels b-i) were obtained with repetitions for each combination of and . repetitions were also used to obtain the results in Figs. 8a-d and Sec. .12.
The fixed size dynamics were also simulated using the hybrid Gillespie-Itô approach. The Gillespie algorithm was modified by setting and ‘killing’ a randomly selected player at every birth. The Itô part of the algorithm involved replacing the noise correlation matrix (see details in Sec. .7). The results in Fig. 4 were obtained by running the fixed size Gillespie-Itô algorithm times for seconds for each combination of and .
.2 The deterministic limit
In the limit, the behaviour of the growing Iterated Prisoner Dilemma described in the main text is equivalent to that of the following continuous, deterministic system:
| (7) |
where . These equations can be easily derived from Fig. 1.
As shown in Fig. 9 (see also Imhof2005 ), the mutation rate has a clear effect on the dynamics of the continuous system. For , the system exhibits two stable attractors: a fixed point characterised by a population of almost entirely AllD players and a stable mixed-strategy limit cycle. The most notable effect of varying within this range is the resizing of the limit cycle: the smaller the mutation rate, the larger the limit cycle (panels a-c and e-g). For large values of (approximately ), the limit cycle collapses into a point, although the separatrix still exists (panels d and h). Varying also slightly changes the shape of the separatrix, especially in the proximity of the AllC-TFT edge of the simplex.
.3 System-Size Expansion
Following van_kampen ; Gar03 , we derive a set of coupled SDEs that approximate the dynamics of the underlying protocol when . In terms of step-operators, the Master-equation has the form:
| (8) |
Expanding the step-operators in the usual fashion, and retaining only the leading and next-to-leading order terms, gives
| (9) |
where . Substituting Eq. (9) into Eq. (8) results in an equation of the Fokker-Planck type Gar03 :
| (10) |
After some manipulation, it can be shown that
| (11) |
and
| (12) |
Equation (10) implies an SDE for the variables :
| (13) |
The deterministic part of Eq. (13) is equivalent to Eq. (7). The noise sources that appear in Eq. (13) have zero mean (i.e., ) and are correlated according to:
| (14) |
Summing over index in Eq. (13), we have
| (15) |
where is a single source of zero-mean Gaussian white noise.
.4 Multiplicative delta-correlated noise
Eqn. (13) can be re-written in terms of delta-correlated noise and multiplicative pre-factors. To do this we must choose a matrix that satisfies . For to be square, this requires a Cholesky decompostion, and ensures no more independent noise sources than there are variables in the system. However, a more natural approach is to decompose according to the rules set out in Gillespie’s CLE approach Gillespie2000a . This results is SDEs of the following form:
| (16) |
where the index runs from and correspond to the reactions in Fig. 1. The twelve independent noise sources each have mean zero, and are delta-correlated— i.e., and . The matrix is given by
| (17) |
.5 Projected dynamics
We wish to project the dynamics onto the unit simplex— i.e., in terms of variables . For this, we require the multivariate form of Itô’s lemma Gar03 . For finite , we have
| (18) |
where the shorthand has been used. First, we deal with the deterministic parts. Using
| (19) |
alongside (11), it can be shown that
| (20) |
Similarly, using
| (21) |
gives
| (22) |
Notice that, when summed over , both (20) and (22) are zero by virtue of the fact that . Also, trivially, (22) goes to zero in the deterministic limit. For the stochastic part of (18), define a new matrix such that (18) can be re-cast in terms of correlated noise sources— i.e.,
| (23) |
with and , where
| (24) |
To understand the impact of these correlations, (24) can be computationally decomposed into an eigenbasis for different values of . This always results in one zero-eigenvalue eigenvector pointing perpendicular to the simplex. The remaining in-simplex eigenvalues reveal that populations towards the centre of the simplex experience large uncorrelated fluctuations whilst, closer to the simplex boundary, correlations suppress fluctuations in the direction normal to the boundary (Fig. 4b-c, orange crosses). Moreover, the magnitude of along-boundary fluctuations decrease as a corner is approached.
.6 Boundary effects
Equation (23) can be evaluated at the simplex edges, where we are particularly interested in the both deterministic drift and fluctuations in the direction of the bulk, which is captured by the dynamics of the strategy who’s concentration is zero along a given edge.
-
•
AllD-AllC edge: setting and , gives , where
(25) -
•
AllC-TFT edge: setting and , gives , where
(26) -
•
TFT-AllD edge: setting and , gives , where
(27)
In all three of the above cases, the deterministic repulsion from the edge is . The fluctuations (positive and negative) in the same direction are . The implication, in the context of the convex hull analysis of the main manuscript, is that, very close to the AllD-TFT edge, fluctuations can overcome the deterministic forces only if .
.7 Langevin equation for the fixed size model
The dynamics of the system were were simulated using the hybrid Gillespie-Itô approach (see Sec. .1). A fixed size version of the system was also used in our analysis (see Figs. 4 & 5): The Gillespie algorithm was modified by setting and ‘killing’ a randomly selected player at every birth, while the Itô part of the algorithm involved replacing the matrix in Eq. (17) with
| (28) |
.8 Escape time from corners in the stochastically-induced regime
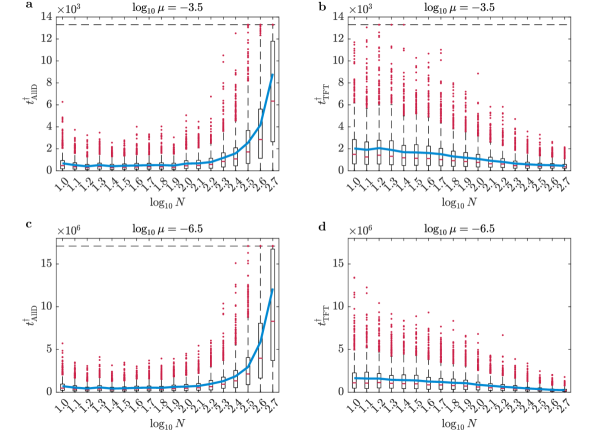
Here we show the statistics of the time that is needed by the fixed-size system to cross the separatrix for the first time (Fig. 10). We compare the cases of the systems starting from the AllD corner (panels a and c) and the TFT corner (panels b and d). In both cases, is proportional to : in the order of thousands of seconds when (panels a-b) and in the order of millions of seconds when (panels c-d). However, the influence of the population size on is different in the two cases. On the one hand, the crossing time starting from the AllD corner increases very rapidly when approaches the onset of the asymmetric regime at around (panels a and c), indeed showing that crossing the separatrix from the AllD basin to the mixed-strategy basin becomes extremely unlikely in the asymmetric regime. On the other hand, the crossing time starting from the TFT corner decreases with .
.9 Equivalence classes decomposition
Consider a trajectory of the growing IPD that starts from an arbitrary state in the stochastically-induced phase (i.e., ) at time , enters the asymmetric phase at time and the locked-in phase at time . Due to the nature of the locked-in phase, the evolutionary outcome at is already known at time , and thus Eq. (3) can be simplified:
| (29) |
where avoidance of extinction is implicitly assumed and AllD-b indicates the AllD basin of the simplex.
Moreover, since the growing IPD is a Markovian process, can be decomposed as follows:
| (30) |
where is the set of all possible states of the system at time .
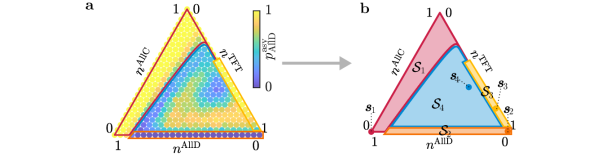
Eq. (30) is impractical, since it requires the numerical estimation of the probabilities and for all in the very large set, . However, the approximation given in Eq. (6) can be made by inspecting in Fig. 11a, which was numerically estimated for a subset of all points (for illustration purposes we only show the case of and ).
A first area of the simplex, (outlined in red), corresponding to the AllD basin, can be immediately identified as it is characterised by a homogenous probability of AllD outcomes of approximately 1. If the system is anywhere within at time , then it is expected never to move to the mixed-strategy basin, since the crossing of the separatrix in this direction is extremely unlikely. Any point would be good candidate for representing the entire area , however, we chose the AllD corner (red dot in Fig. 11b) as the system is in the proximity of such point for the vast majority of the time spent in .
A second area can similarly be identified: (orange), corresponding to the mixed-strategy part of the AllD-TFT edge (including the TFT corner) and characterised by a homogenous probability of AllD outcomes of approximately 0. If the system is in this area at time , then it is very unlikely to cross the separatrix because of the long time (inversely proportional to ) spent in the TFT corner while growing (i.e., as the fluctuations become smaller and smaller). Again, any point can represent the area , but we chose the TFT corner (orange dot in Fig. 11b).
A third area, (yellow), corresponding to the mixed-strategy part of the AllC-TFT edge with exclusion of the TFT corner, also stands out: here we see the probability of AllD outcomes quickly increases with the fraction of AllC players. Due to the anti-clockwise dynamics, in the system directed towards the point where the separatrix meets the AllC-TFT edge, which is where a move from the mixed-strategy basin to the AllD basin is most likely (see Fig. 4f). Since the probability of AllD outcomes is less homogeneous, an approximation must be made for . The dynamics along the AllC-TFT edges are slow, and they get even slower close to the corners. We observe that a good proxy for the average position of the system over time during a climb of the AllC-TFT edge from the TFT corner to the separatrix is around and (yellow dot in Fig. 11b).
Within the remainder of the simplex, (blue), can be very heterogeneous, however, as discussed in the main text, this contributes very little to the outcome statistics for small values of . We chose to represented this area (blue dot in Fig. 11b).
Fig. 11a was obtained with and . Different values of these parameters produce different values of , however, the four areas can always be identified. This decomposition is validated by the successful reconstruction (see Figs. 7 & 8 as well as Figs 13-20) of the all statistics of the evolutionary outcomes obtained via full simulations (Fig. 3). The conditional probability decomposition is always very accurate except for the case of low mutation rate (e.g., ), growth rates around and large initial populations (e.g., ), for which it begins to produce less accurate results (Fig. 8 panel o).
.10 Statistics of the stochastically-induced regime in detail
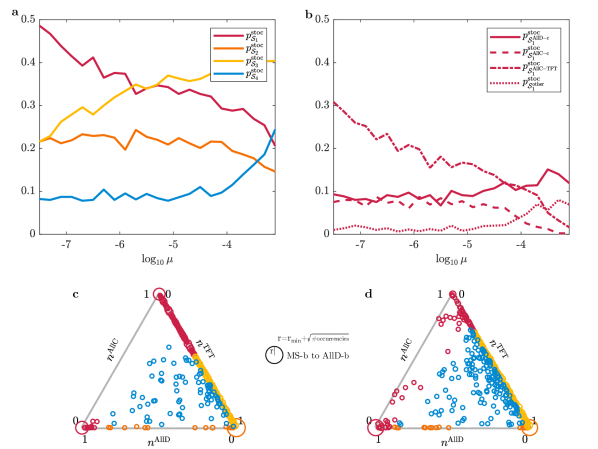
In this section we describe the effect of the mutation rate on the statistics of the stochastically-induced regime outcomes more in detail. Fig. 12a shows the same probabilities shown in Figs. 7b-e, but for a single value of (we remind that and ). We can see that all probabilities depend on for high mutation rates (i.e., ), but only and depend on for lower mutation rates.
For a more detailed analysis, we decompose into , the probability of being the AllD corner, , the probability of being the AllC corner, , the probability of being in the AllD basin side of the AllC-TFT edge excluding the AllC corner and , the probability of being anywhere else within the AllD basin. We can now see that decreases with , in contrast with , which instead increases with . This is explained by the shape of the separatrix changing with : the point where the separatrix meets the AllC-TFT edge moves towards the TFT corner as decreases (see panels c & d).
At the same time, we also see that the probability of the system being in one of the two corners at time , and , are independent on the mutation rate for . However, for higher mutation rates it becomes more and more likely for the system to be in the AllD corner rather than in the AllC corner (see also panels c & d). Finally, for mutation rates the probability of the system being away from the boundaries of the simplex becomes higher (the same of course can be observed for ).
.11 Outcome statistics over growth/mutation rates: more initial mixes
Here we show that our decomposition of the outcome statistics based on equivalence classes holds not only for but in general. We consider other three cases that are very different: , i.e., (Fig. 13); , i,e., , (Fig. 14); and , i,e., , (Fig. 15). In all figures, comparing the results obtained via decomposition (panels n) against those obtained via full simulation (panels p) yields a low error (panels o), demonstrates the validity of our method. The average error over all the considered values of growth and mutation is approximately for the , for , and for .
.12 Outcome statistics over initial population’s size and mix
In this section we illustrate how the outcome statistics in Fig. 3 panels b, c, d, e and g can be reconstructed using our probability decomposition method.
At high mutation rate (Figs. 3b-c), the asymmetric phase is very short. This is reflected in the probability decomposition in Figs. 16 and 17, where the probabilities in panels f-h are all zeros, i.e., the statistics of the outcome are given exclusively by the fixation of the system into one of the two basins during the stochastically induced phase (panels a). The accuracy of the probability decomposition is very high for both small (Fig. 16) and large (Fig. 17) initial populations, as illustrated in panels j.
At low mutation rate the asymmetric regime is very long, however, such regime has little effect on the outcome statistics for small initial populations. This is explained by the probability decomposition in Fig. 18. For some starting points the system can be in the equivalence class at the end of the stochastically-induced regime (panel b), however, from this area of the simplex it is extremely unlikely for the system to cross the separatrix towards the AllD basin, even if the asymmetric regime is long (panel f). Moreover, it very unlikely for the system to be in at the of the stochastically induced regime, since with a small initial population such regime is longer and fluctuations are likely to drive the systems towards the edges and corners (panels d). Thus, even if the system can cross the separatrix from during the asymmetric regime, the combined probability in panel h is approximately zero for every initial condition. Finally, we can see that for some initial state the system has a small chance of being in at the end of the stochastically-induced regime (panel c). From this area the system is very likely to cross the separatrix during the asymmetric regime, leading to the small outcome probability contribution in panel g.
Since the probabilities in panel h are very low, the accuracy of the probability decomposition is very high (panel j) also in this case. The accuracy gets worse only for middle values of growth rate (around ), very small mutation rates (e.g., ) and large initial populations (e.g., ). This case is reported in Fig. 8, which shows that the probability of AllD outcomes is underestimated for some initial starts around the mixed-strategy unstable fixed point.