Investigating the low-flux states in six Intermediate Polars
Abstract
We present optical photometry of six intermediate polars that exhibit transitions to a low-flux state. For four of these systems, DW Cnc, V515 And, V1223 Sgr and RX J2133.75107, we are able to perform timing analysis in and out of the low states. We find that, for DW Cnc and V515 And, the dominant periodicities in the light curves change as the flux decreases, indicating a change in the sources’ accretion properties as they transition to the low state. For V1223 Sgr we find that the variability is almost completely quenched at the lowest flux, but do not find evidence for a changing accretion geometry. For RX J2133.75107, the temporal properties do not change in the low state, but we do see a period of enhanced accretion that is coincident with increased variability on the beat frequency, which we do not associate with a change in the accretion mechanisms in the system.
1 Introduction
Intermediate polars (IPs) are a subclass of cataclysmic variables (CVs) in which a white dwarf (WD) accretes matter from a main sequence companion. In IPs the magnetic field of the WD is strong enough ( G) to disrupt the innermost regions of the accretion disk such that, at the magnetospheric boundary, matter flows along the magnetic field lines on to the poles of the WD (see e.g. Patterson, 1994, for a review). Unlike polars, another class of magnetic CV (mCV), the spin period of the WD () and binary orbital period () are not synchronized. As a result, the power spectra of IP light curves are typically dominated by the WD spin frequency (), the orbital frequency () and the beat frequency () and their respective harmonics.
Timing analysis of IP light curves, both at optical and X-ray wavelengths, can reveal a lot about the dominant mode of accretion in the system. Typically, IPs have a residual disk whose inner edge is truncated at the magnetospheric radius, and matter is forced along the field lines in so-called ‘accretion curtains.’ This is the ‘disk-fed’ model, and applies to almost all IPs. In the ‘stream-fed’ model (Hameury et al., 1986), on the other hand, there is no viscous accretion disk, and matter flows directly from the companion on to the WD magnetosphere. The diskless IP V2400 Oph is often cited as the prototypical stream-fed system (Hellier & Beardmore, 2002). A third accretion mode, the ‘disk-overflow’ model, is a hybrid of the two, where there is simultaneous stream- and disk-fed accretion on to the WD (Lubow, 1989; Hellier, 1993; Armitage & Livio, 1996, 1998).
Wynn & King (1992) and Ferrario & Wickramasinghe (1999) both showed that the strengths of the different peaks in the power spectra of IP light curves (both optical and X-ray) could be used to determine the dominant accretion mode in the system. A typical, disk-fed IP will show strong variability on the spin period of the WD, thus the strongest peak in the (optical and X-ray) power spectrum will be at . This is because, in the disk-fed mode, material is being forced on to field lines at a nearly uniform rate from a Keplerian disk. However, in the stream-fed model, the power spectra start to become dominated by multiples of the beat between the spin and orbital frequencies, due to the matter flowing directly from a fixed point in the binary rest frame rather than in the frame of the rotating WD. Ferrario & Wickramasinghe (1999) show that, for diskless IPs, the X-ray light curves will show variability at , and , with the strength of the peaks varying with viewing angle. The optical power spectra, on the other hand shows strong peaks at , and , with the power spectra of a lower inclination () system almost completely dominated by the peak.
Recently, observations of the IP FO Aqr have shown the system to fade by up to 2 magnitudes in the -band, with comparable decreases in flux at X-ray energies (Kennedy et al., 2017; Littlefield et al., 2020). These so-called ‘low states’ are relatively uncommon in IPs (see e.g. Garnavich & Szkody, 1988) compared to polars and are thought to be due to a temporary reduction in mass transfer from the donor (potentially from starspots transiting the point on the surface of the donor; Livio & Pringle, 1994). FO Aqr has shown three such low states since 2015, offering the opportunity to study one in real time. Kennedy et al. (2017) and Littlefield et al. (2020) found that the timing signatures, at both optical and X-ray wavelengths, changed as the source progressed through its low states, indicative of a change in the dominant accretion mechanism from exclusively disk-fed to disk-overflow accretion as the flux decreased. Optical spectroscopy of the 2016 and 2017 low states confirmed this switch in accretion mode (Kennedy et al., 2020).
However, FO Aqr is only one of 50 confirmed IPs111according to the 2014 version of the IP catalog https://asd.gsfc.nasa.gov/Koji.Mukai/iphome/catalog
/omegaomega.html and more IPs are starting to be observed in low states. For example, DW Cnc exhibited a low state that lasted 2 years, during which time optical spectroscopy revealed that the spin variability had dramatically weakened (Segura Montero et al., 2020). In addition, the IP DO Dra was not detected in a 55.4ks observation with the Nuclear Spectroscopic Telescope Array ( NuSTAR; Harrison et al., 2013) in July 2018 (Shaw et al., 2020), a low state that was also detected at optical wavelengths (Andronov & Mishevskiy, 2018). However, in the case of DO Dra, no coherent oscillations were detected. We also note that the IP TX Col has shown transitions to states of enhanced accretion (Rawat et al., 2021; Littlefield et al., 2021), during which time strong quasi-periodic oscillations (QPOs) dominated the optical light curves. These QPOs have been interpreted as due to a torus of diamagnetic blobs circling the (usually disk-overflow accreting) WD in unstable orbits (Littlefield et al., 2021).
It is becoming evident that low states are more common in IPs than previously anticipated, and it has been shown that variability studies hold the key to understanding the accretion processes and how they may change. Therefore, in this work we present optical photometry of several IPs that exhibit low states and, where possible, present timing analysis in order to investigate the accretion processes at work.
2 Observations and Analysis
We utilized the public photometry database of the All-Sky Automated Survey for Supernovae (ASAS-SN; Shappee et al., 2014; Kochanek et al., 2017) and downloaded long-term light - and -band light curves of the IPs that have a 2–10 keV X-ray flux erg cm-2 s-1 in their ‘normal’ state.222https://asd.gsfc.nasa.gov/Koji.Mukai/iphome/catalog
/omegaomega.html Such a sample can be assumed to be representative of the intrinsic IP population (Pretorius & Mukai, 2014). We checked for potential low states (which we define as a sustained drop in flux of mag from the average) in each light curve. Upon finding evidence for a low state in a source, we then checked the photometry database of the American Association of Variable Star Observers (AAVSO) for higher cadence data with which we could perform timing analysis. The AAVSO data also often went back further than ASAS-SN, opening up the possibility of probing multiple low states (see e.g. V515 And). Additionally, AAVSO light curves often allowed us to probe higher frequencies than allowed by ASAS-SN, which has a typical cadence of d for many objects, thus allowing us to study variability on the spin and beat frequencies. The majority of AAVSO data presented in this work is photometry in the -band, i.e. unfiltered data with a -band zeropoint. However, we do include some -, - and -band (unfiltered with an -band zeropoint) photometry too. The sources we focus on in this work are introduced in Section 2.1. Full details of the AAVSO observations we used in this work are presented in Table 1.
For one source, DO Dra (see Section 2.1), we also include photometry from the Neil Gehrels Swift Observatory Ultraviolet/Optical Telescope (Swift/UVOT; Roming et al., 2005). Swift/UVOT is a 30cm diameter telescope that operates simultaneously with the spacecraft’s X-ray Telescope. There are 17 Swift observations of DO Dra in the archive for a total of 54 exposures split between the UV filters (,,,). Aperture photometry was performed using uvotsource as part of heasoft v6.27.2. We extracted photons from a 5″ radius circular region centered on the source and the background was measured using a 20″ radius circular region centered on a source free region of the CCD. All reported magnitudes are in the Vega system and uncertainties include the statistical error and a systematic uncertainty that accounts for the uncertainty in the shape of the UVOT point spread function (PSF).
For sources with sufficient AAVSO data we split the data in to several observing epochs, typically separated by prolonged gaps between observing campaigns by AAVSO observers (usually due to visibility). To construct the AAVSO light curves we then filtered data in each epoch so that no data overlapped in time in the case of two or more observers observing a source simultaneously. Photometric data that overlap in time but have slight differences in calibration may manifest as false signals in the timing analysis on the time-scales that we are probing, so we filtered the data by observer for each light curve epoch. For each epoch we first prioritized the observer who provided the most data, then included non-simultaneous data from all other observers that observed the source during the same epoch.
We performed timing analysis on the AAVSO light curves to search for changes in the dominant periodicity across observing epochs. To search for these periodicities we use Lomb Scargle periodogram analysis (Lomb, 1976; Scargle, 1982), which utilizes least-squares fitting of sinusoids to the light curve to determine the power at each frequency in a given range. We implement this analysis using the LombScargle class included in the astropy python package (Astropy Collaboration et al., 2013, 2018). Before performing the Lomb Scargle analysis, we applied a heliocentric correction to the data using the time package available in astropy. As AAVSO data are from telescopes distributed around the world, we corrected all photometric data as if they were observed from the W. M. Keck observatory on Mauna Kea, USA. This is a reasonable correction to make, as the maximum time correction for two antipodean observers observing the same source at the same time (if that were possible) is only s, and we are searching for periodicity differences on s timescales.
For each periodogram we calculated a 99.9% significance threshold for the power. We did this by randomly shuffling the light curve magnitudes but keeping the time-stamps the same for each epoch, effectively creating a randomized light curve with the same sampling as the original data. We calculated the peak Lomb Scargle power for 10,000 of these randomized light curves, again for every epoch of AAVSO data, from which we derived the 99.9% significance. Lomb Scargle periodograms are presented for four of the six sources studied in this work.
| Source | MJD range | Bands | AAVSO observer codes |
|---|---|---|---|
| DW Cnc | 57044 – 59235 | CDZ, COO, CWT, DFS, DKS, GFB, JJI, | |
| MGW, MZK, RJWB, SRIC, UJHA, VMT | |||
| V515 And | 55464 – 59251 | BDG, BJAA, BPO, BSM, CDK, CDZ, COO, | |
| CWT, DFS, DKS, GCHB, JJI, MEV, OYE, | |||
| RJWB, SGEA, SJIA, UJHA, VMT | |||
| V1223 Sgr | 56860 – 59181 | , | CROA, DKS, HMB, MGW, NLX |
| RX J21335107 | 55460 – 59333 | BDG, BJAA, BPO, CDZ, COO, DFS, DKS, | |
| GFB, JJI, MEV, RJWB, SRIC, VMT | |||
| DO Dra | 55668 – 59011 | , , | COO, MEV, MNIC, JJI, JSJA, UJHA |
| V1025 Cen | 55211 – 59165 | MLF |
2.1 Sources
In this work we focus on 6 sources that showed at least one low state in ASAS-SN data since the project began in 2014. We choose not to include FO Aqr in this analysis as its low states have been well-studied previously (Kennedy et al., 2017; Littlefield et al., 2020; Kennedy et al., 2020).
DW Cnc is classified as a low luminosity IP (LLIP; Mukai, 2017), a subclass of IPs so named for their low X-ray luminosities ( erg s-1) relative to most IPs. Patterson et al. (2004) reported spectroscopic periods of 86.1 and 38.6 min, interpreted as and , respectively (see also Rodríguez-Gil et al., 2004), as well as a 69.9 min photometric period consistent with the beat period (). As discussed in Section 1, DW Cnc underwent a transition to a low state in 2018, accompanied by a weakening of the WD spin signal in time resolved optical spectra. Segura Montero et al. (2020) hypothesize that DW Cnc is a magnetic analog of VY Scl systems - a class of CVs that exhibit occasional low states due to episodes of reduced mass transfer from the companion star. In this work we supplement the spectroscopic study of DW Cnc by Segura Montero et al. (2020) with timing analysis of the AAVSO -band photometry in and out of the low state.
V515 And was identified as the optical counterpart to the X-ray source XSS J005644548, with strong oscillations on a period of s (Bikmaev et al., 2006). This was later refined to s and , inferring h (Kozhevnikov, 2012). Prior to this work, no low states of V515 And have been reported.
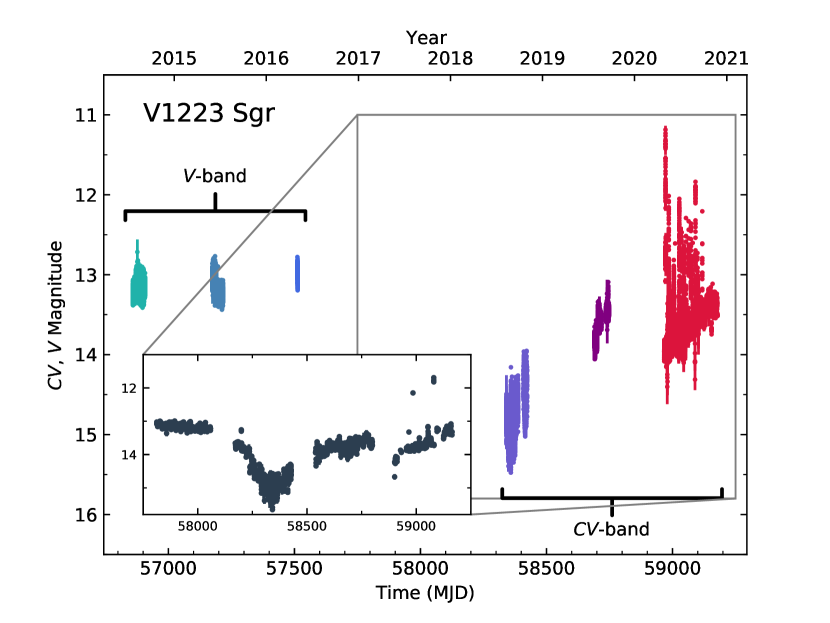
V1223 Sgr is arguably one of the most well-studied IPs, it was identified as the optical counterpart to the Uhuru X-ray source 4U 184941 (Steiner et al., 1981). The WD spin variability is more prominent in the X-ray light curves ( s; Osborne et al., 1985) than in the optical. However, Jablonski & Steiner (1987) note that is stronger in the optical band. V1223 Sgr has a well-documented history of low states, having shown numerous excursions to low fluxes (fainter than its typical ) in photographic plate observations since 1931 (Garnavich & Szkody, 1988; Šimon, 2014). None of the low-state studies thus far have included timing analysis down to the level of . However, Šimon (2014) did find a typical recurrence period of d for low states during the period of observations spanning 1999-2009. In this work, we focus on the two most recent low states exhibited by V1223 Sgr, one of which lasted year and showed a decrease in flux of mag and the second of which was a much shorter duration, lower amplitude low state that occurred almost immediately after the source had recovered from the previous one.
RX J2133.75107 (1RXS J213344.1510725) was discovered in the ROSAT Galactic Plane Survey as an optically bright CV (Motch et al., 1998). It was confirmed as an IP with s and h (Bonnet-Bidaud et al., 2006; Thorstensen et al., 2010). Prior to this work, no low states have been reported for this system.
DO Dra (often also referred to as YY Dra in literature) is, like DW Cnc, classified as a LLIP (Mukai, 2017), with h and s (Haswell et al., 1997). However, unusually for an IP, only harmonics of the spin and beat are typically observed in the power spectra of DO Dra, and often goes unseen, at X-ray, optical and UV wavelengths (see e.g. Patterson & Szkody, 1993; Haswell et al., 1997). The source has been seen to transition to a low state (Andronov & Mishevskiy, 2018), though no coherent oscillations were seen in the -band.
The LLIP V1025 Cen was identified as the optical counterpart to the X-ray source RX J123838, with min and h (Buckley et al., 1998; Hellier et al., 1998), making the source one of the few IPs below the period gap. Ferrario & Wickramasinghe (1999) note that V1025 Cen poses a problem to simple disk-fed and stream-fed models of accretion in IPs, as the system exhibits characteristics of both (see also Hellier et al., 2002). Prior to this work, no low states of V1025 Cen have been studied in detail(though see Littlefield et al., 2022, who probe the source at optical wavelengths during its recovery from the low state).
3 Results
3.1 DW Cnc
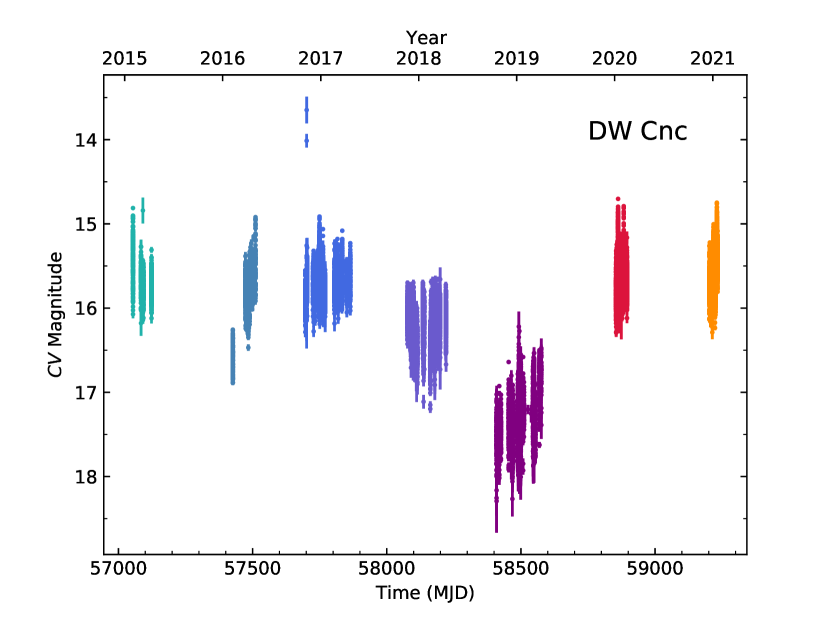
The AAVSO -band light curve of DW Cnc is shown in Fig. 1. This is similar to the light curve presented by Segura Montero et al. (2020), but over a shorter time period. We focus on the 2015-2021 date range, where there are a high concentration of observations with well-constrained uncertainties. DW Cnc appears to begin to decline in flux around or before MJD58080 (Fig. 1), before it reached its lowest flux (17.5) around MJD and began to rise again. The source had recovered to its typical optical flux (15.5) by MJD 58850. We also note the possibility of a short-lived transition to a lower-than-typical flux (though not as low as the 2018–2019) low state) in early 2016.
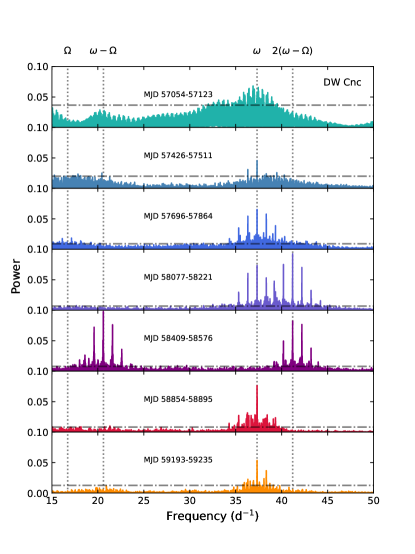
Lomb Scargle periodograms of each colored epoch are presented in Fig. 2. Labeled are characteristic frequencies associated with the system, d-1 ( min), d-1 ( min) and integer multiples of the beat frequency (Rodríguez-Gil et al., 2004; Patterson et al., 2004). In the majority of the panels of Fig. 2 we see that the light curves are dominated by (though in the top panel, the power at is severely aliased). However, as the source flux starts its decline to the low state in 2018 (fourth panel), we see strong variability emerge at , before the signal from the spin of the WD completely disappears at the lowest flux (fifth panel) and the periodogram is dominated by power at and . By the time the flux recovers, the optical light curve of DW Cnc is once again dominated by .
Changes in the dominant periodicities in DW Cnc are also noted by Segura Montero et al. (2020), who performed optical spectroscopy of the source during the decline to the low state (MJD 58308 and 58137–58143). They noted that the beat and spin periods were much weaker than typical. From analysing the photometry, we confirm the weakening, even disappearance, of the spin variability in the low state. However we find that the beat (and double the beat) frequency, does not weaken, in fact it becomes much stronger as the source flux declines. Segura Montero et al. (2020) predicted that DW Cnc would regain its IP characteristics (i.e. show strong variability on ) after the low state had finished. We show here that this prediction was indeed fulfilled in the final two epochs of AAVSO photometry. Duffy et al. (2021) also report the return of the spin signal and also note three short-lived outbursts that are not covered by the AAVSO observations.
3.2 V515 And
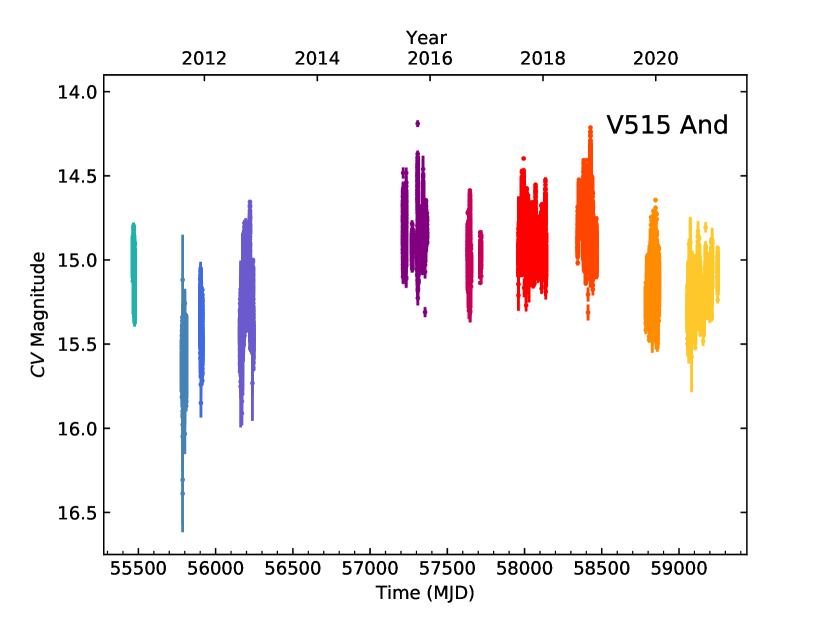
The -band light curve of V515 And is displayed in Fig. 3, showing 10 years of AAVSO observations. The light curve shows that the source had already begun declining when observations began, and that the source reached mag by MJD before recovering to by MJD . V515 And remained in this brighter state for years, before appearing to decline in flux again prior to the end of the AAVSO observations. It is unclear just from Fig. 3 whether these are discrete transitions to a low state or if this is a continuous modulation in optical flux. However, we will use the terminology ‘low state’ in this work.
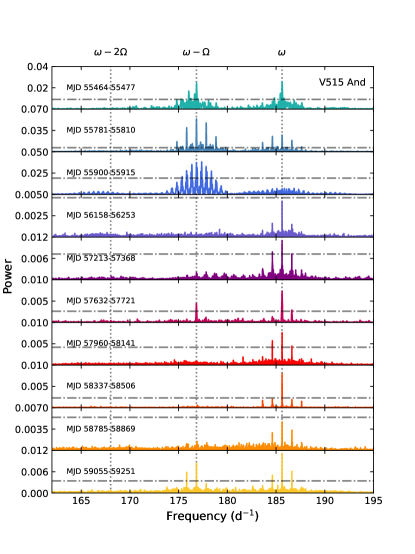
As with DW Cnc, we present Lomb Scargle periodograms of each epoch in Fig. 4. We label some characteristic frequencies associated with the system, d-1 ( s) and orbital sidebands d-1 and d-1 (Kozhevnikov, 2012). At the beginning of the observation period, we find the source entering a low state, and the periodograms at first show and exhibiting equal power. As the low state progresses, the spin becomes weaker, until it is no longer significant in the third epoch, where the beat instead dominates the periodogram. The source flux then recovers, and with it so does the dominance of (fourth and fifth panels). A strong component does appear once more in the sixth epoch, possibly associated with a slight decrease in flux, but soon disappears. In the final two epochs, we see a decline in source flux once more, though not to the levels of the first low state. Coincident with this decline we find that the beat variability starts to emerge in the periodograms once more, as seen in the final panel of Fig. 4.
3.3 V1223 Sgr
The - and -band light curve of V1223 Sgr is shown in Fig. 5, covering the observing period from 2014–2021. V1223 Sgr appears to decline in flux around or before MJD (Fig. 5; inset) before reaching its lowest flux () around MJD. The inset of Fig. 5 shows that the source flux apparently recovers to near pre-low-state levels, but almost immediately declines again, reaching a local minimum at MJD. This second low state is of shorter duration and lower amplitude than the first. Note in the AAVSO light curve during the recovery from the second low state, we see strong variability of up to 3 magnitudes on short ( d) timescales. This is reminiscent of the short duration activity that has been observed once before in the system (van Amerongen & van Paradijs, 1989; Hameury & Lasota, 2017). However, why this activity is (a) recurrent on timescales of weeks rather than seen as a single outburst and (b) coincident with the recovery from a low state and not seen during any other epochs remains unclear. We present a possible mechanism for the outbursts in Section 4.
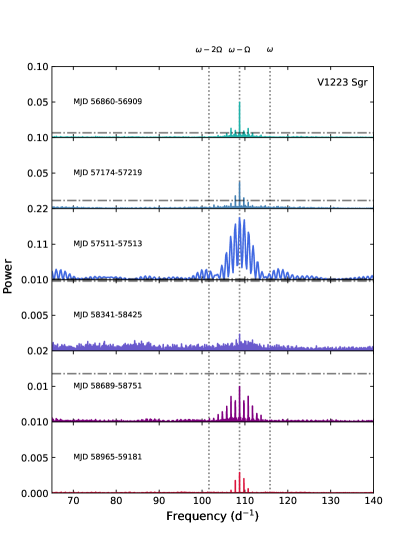
In the same manner as the other sources, we present Lomb Scargle periodograms of each epoch in Fig. 6. Labeled are characteristic frequencies associated with the system, = 115.875 d-1 ( s) and orbital sidebands = 108.744 d-1 and = 101.615 d-1. In the first three epochs, we see that the periodogram is dominated by the signal, with some power at in the third epoch. However, in the fourth epoch, when the optical flux is at its lowest, the power at all but disappears (the peak is well below the 99.9% confidence line). The power never recovers above that confidence line again - though it nearly does in the fifth epoch - despite the source flux recovering. Indeed, during the final AAVSO epoch, when the source exhibits strong variability, the signal at remains weak.
3.4 RX J2133.75107
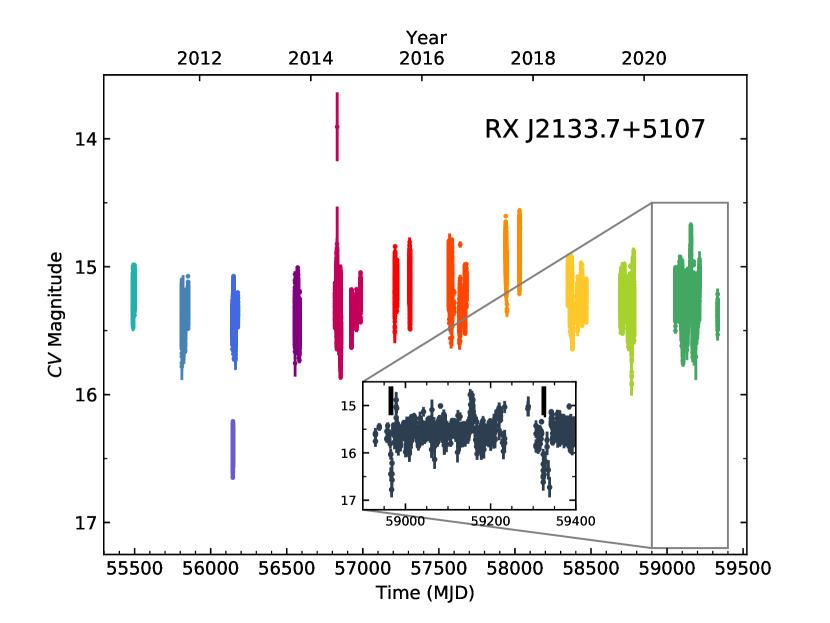
The AAVSO -band light curve of RX J2133.75107 is shown in Fig. 7. Over the years of regular observations by the AAVSO community, the source is mostly stable, with an average and showing minor sinusoidal super-orbital variability. However, the source appeared to make a brief excursion to a lower flux () in August 2012 (MJD 56145–56147), before returning to its typical flux days later. We consider the possibility that these photometric data are anomalous or calibrated incorrectly. However, we conclude that the flux decrease is real for two reasons: (a) the observer who made the putative low state measurements (B. Goff) also observed the source at later epochs, measuring magnitudes consistent with those derived by other observers during the same epochs and (b) the ASAS-SN light curve (Fig. 7; inset) shows two short-lived (days) decreases in -band flux (from to ) in 2020 and 2021 (MJD and ), suggesting that the August 2012 incident was not a one-off event.
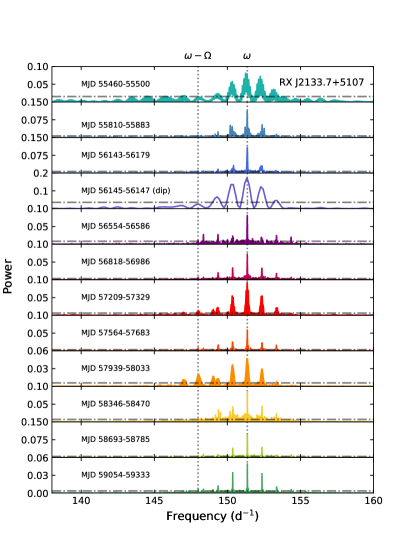
The Lomb Scargle periodograms of RX J2133.75107 are shown in Fig. 8. In all epochs there is strong variability at d-1 ( s), and we do not see this change during the short-lived low state. Interestingly, in the ninth epoch, we see that a signal at d-1 emerges, but it is apparently not correlated with a drastic change in optical flux, though we note that the source is mag brighter than the following (tenth) epoch. On closer inspection, 9 of the 12 epochs of AAVSO data show power (above the 99.9% confidence threshold) at , but only in epoch 9 is it of comparable strength (% power) to the spin modulation.
3.5 Other sources showing low states
Below we present results from two sources that exhibit definite transitions to low-flux states, but the timing analysis was inclusive either due to either a lack of periodic modulations (DO Dra), or not enough high-cadence (i.e. spin-resolved) photometry (V1025 Cen). Nevertheless we present the light curves of these sources here to maintain a record of their low states. In the case of V1025 Cen, this work represents the first published instance of the system in a low state.
3.5.1 DO Dra

Multi-band light curves of DO Dra are shown in Fig. 9. In the top panel of Fig. 9 we show the Swift/UVOT light curve in four UV filters. Swift performed just one or two exposures per visit, rather than time series observations, such that the light curve provides a better idea of the overall behavior of the average flux. As a result, we are able to see that DO Dra fades by mag in the -band. The remaining panels in Fig. 9 show the optical light curve in the -, - and -bands as observed by members of the AAVSO. The 2017–2018 low state is covered in all three bands, though we note strong ( mag) variability, particularly in the -band.
Despite the evidence of variability and sufficient high-cadence AAVSO data, a Lomb Scargle period search failed to recover any coherent signals. Though a distinct lack of periodic variability is contradictory to what has been exhibited the other sources studied in this work thus far, it is perhaps not unexpected. The spin variability in DO Dra has been known to be difficult to detect across all bands (see e.g. Patterson & Szkody, 1993; Haswell et al., 1997), and often only harmonics (usually ) are detected (Haswell et al., 1997). We do not detect variability at or any other harmonics in the AAVSO light curves, consistent with the findings of Andronov & Mishevskiy (2018), whose -band light curves are in the AAVSO database and included in Fig. 9. Hill et al. 2022 (submitted) also investigated the timing properties of DO Dra with the Transiting Exoplanet Survey Satellite (TESS) and find an additional, extremely short-lived ( d) low state in 2020.
3.5.2 V1025 Cen
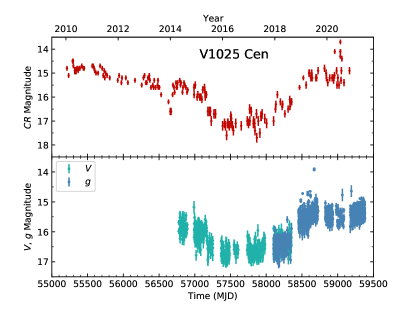
Optical light curves of V1025 Cen are shown in Fig. 10. Both ASAS-SN and AAVSO show a long-lived ( yr), high amplitude (up to mag) low state. This is the first time a low state has been reported for this source. Unfortunately, there are not enough high-cadence data on which to perform timing analysis, so we are unable to investigate the properties of V1025 Cen beyond cataloging the low state. According to the AAVSO archive, V1025 Cen appears to have exhibited at least one more low state prior to the multi-year one shown in Fig. 10, with the source reaching as faint as in 2002. Additionally, the ASAS-SN light curve in the lower panel of Fig. 10 shows evidence of outbursting behavior as the source flux recovers. This behavior is reminiscent of what we observe in V1223 Sgr, which also showed rapid outbursts during a recovery stage. ASAS-SN does not have the cadence required to study the outbursts in detail, such that we cannot draw accurate comparisons with V1223 Sgr. However, Littlefield et al. (2022) investigated the outbursts with TESS and find them to be consistent with magnetically gated accretion (see Section 4).
4 Discussion
We have presented optical light curves of six IPs that have shown decreases in optical flux known as low states. If we also consider FO Aqr, which has been extensively discussed in literature (e.g. Kennedy et al., 2017; Littlefield et al., 2020), and AO Psc, which was seen to be in a low state in 1946 (Garnavich & Szkody, 1988), it is becoming clear that low states in IPs are not uncommon events. The light curves also show that there is diversity in the amplitude of the observed low states, with some sources exhibiting decreases in flux of mag (e.g. DW Cnc, V1223 Sgr) and others mag (V515 And, RX J2133.75107). In addition, the duration of the low states varies greatly from source to source, with those of RX J2133.75107 typically lasting weeks (Fig. 7), whilst DW Cnc remained in a low state for over a year (Fig. 1).
We have also presented Lomb Scargle periodograms four of the six IPs. Timing analysis is often the key to understanding the accretion processes in IPs, and has been seen to be a useful diagnostic in the multiple low states of FO Aqr, both at X-ray (Kennedy et al., 2017) and optical (Littlefield et al., 2016, 2020) wavelengths. As the flux of FO Aqr decreased, the optical power spectra shifted from being dominated by the spin of the WD, , to a dominant and component, indicative of a transition to either a disk-overflow or stream-fed accretion geometry (Littlefield et al., 2020).
The classic picture of an IP is one in which the WD accretes via a partial accretion disk whose inner edge terminates at the magnetospheric boundary (assuming spin equilibrium). This disk-fed geometry only occurs if the minimum distance of closest approach to the WD by the ballistic stream from , is greater than the radius of the WD , otherwise no disk is able to form. Similarly, if , the ballistic stream will simply flow along the magnetic field lines on to the magnetic poles of the WD, as no disk will be able to form. King & Lasota (1991) calculated that, for IPs in spin equilibrium (a reasonable assumption for most systems), then partial disks are expected to exist in systems where . If this inequality is broken, then either the system is severely out of spin equilibrium, or the accretion flow is unlike the standard Keplerian disk we typically assume when we study IPs and other CVs. The overflow of matter in an accretion disk is a long-predicted feature of mass transfer in both magnetic and non-magnetic semi-detached binaries (Lubow, 1989). Lubow (1989) notes that the scale-height of the ballistic stream is typically a factor 2–3 larger than that of the disk, such that, as the gas hits the disk, it is possible for it to overflow at its outermost edge before being incorporated into the rest of the disk. However, for disk-overflow accretion on to the WD itself to occur, the ballistic stream needs to approach the inner edge of the disk, i.e. the condition needs to be satisfied. As predicted by King & Lasota (1991), and noted above, this occurs in systems where . We need to consider the ratio of when discussing the IPs studied in this work.
Wynn & King (1992) presented power spectra of simulated X-ray light curves of diskless IPs, finding strong peaks at orbital sidebands , and harmonics. Ferrario & Wickramasinghe (1999) found similar results, but also showed that at certain viewing angles one might still see power at . In addition, Ferrario & Wickramasinghe (1999) calculated theoretical power spectra of diskless IPs in the optical band, finding that still dominates for high inclination systems, but integer multiples of dominate in low inclination IPs. In (low inclination) stream-fed IPs where the magnetic field is a perfectly symmetric dipole, Ferrario & Wickramasinghe (1999) find that the power spectrum will be dominated by a peak at 2(. However, if this symmetry is broken in any way (i.e. material preferentially accretes on to one pole) then the light curves will be modulated on . Despite the many permutations of orbital inclination and inclinations of the dipole magnetic field (which affects the visibility of the hotspots), it is clear that stream-fed, disk-fed and disk-overflow IPs can have very specific timing properties. We therefore discuss the timing properties of DW Cnc, V515 And, V1223 Sgr and RX J2133.75107 in the context of their low states.
4.1 DW Cnc
The four IPs of which we present Lomb Scargle periodograms all exhibit changing timing properties with time. DW Cnc is one of the clearest examples of this in this work. DW Cnc is one of the few IPs in which , where min and min (Patterson et al., 2004). According to King & Lasota (1991), this implies that, even in the high state, the WD probably does not accrete from a standard Keplerian disk. Despite this, during epochs 1–3 and 6 and 7, the power spectra in Fig. 2 are indicative of a typical, disk-dominated IP with power at . Archival X-ray observations support this, showing the strongest variability at (Nucita et al., 2019), typical of disk-fed IPs (Ferrario & Wickramasinghe, 1999). Norton et al. (2004) find that, for IPs where , accretion may be fed from a ring-like structure at the edge of the WD’s Roche lobe, possibly in the form of diamagnetic blobs (King & Wynn, 1999). DW Cnc falls into this category (Patterson et al., 2004; Norton et al., 2008), so we suggest here that the strong power seen at in epochs 1–3 and 6 and 7 may be due to accretion from this non-Keplerian structure. However, if, despite the apparent theoretical difficulties, a Keplerian disk did manage to form in DW Cnc, said disk would be a valid interpretation of the observed timing signatures in epochs 1–3, 6 and 7. Time-resolved optical photometry is not able to distinguish between the two scenarios.
In epoch 4 (MJD 58077–58221; 2017 Nov–2018 Apr) the emergence of a strong signal at , with a slightly higher peak power than that at , implies a change in accretion geometry. In the context of the Ferrario & Wickramasinghe (1999) model, power at and/or in the optical power spectrum points to a stream-fed accretion flow.333This applies if the system is at a low inclination angle, which is implied by the lack of complete occulations in the X-ray light curves of DW Cnc (Nucita et al., 2019) The presence of power at both and would typically imply a disk-overflow geometry. However, we have established previously that DW Cnc should not be able to form a Keplerian disk, according to published theory. Instead, if accretion from the non-Keplerian ring-like structure of Norton et al. (2004, 2008) is the typical accretion mode of DW Cnc, we suggest that the WD in DW Cnc was accreting via both the stream and the ring-like structure in epoch 4. Again, we emphasize that, if a Keplerian disk is able to form in this system, then a disk-overflow geometry would be a valid interpretation of the data.
During epoch 5 (MJD 58409–58576; 2018 Oct–2019 Apr), the disappearance of from the periodogram gave way to almost equal power from and , implying a transition to a purely stream-fed accretion mode. Much like with FO Aqr (Littlefield et al., 2020) we find that the mode of accretion in DW Cnc is intimately related to the luminosity of the system, implying that mass-transfer rate () and accretion mode are linked.
The appearance of strong variability on both and can be explained in the Ferrario & Wickramasinghe (1999) framework by an asymmetry between the upper and lower hemispheres of the magnetosphere. However, the lack of a peak at in epoch 4 is puzzling. It is possible that the stream-fed component of the accretion flow in epoch 4 is being accreted equally on to both poles, but why the stream-fed accretion flow would then become asymmetric in the following epoch is unclear. Splitting epochs 4 and 5 into shorter segments of d each (depending on the amount of available data) and performing Lomb Scargle timing analysis reveals that there was no evolution from to with time, i.e. epoch 4 always shows and and epoch 5 always shows and with no change in relative power. We can only gain a complete picture of the accretion flow in these epochs with simultaneous X-ray observations, which do not exist for DW Cnc.
4.2 V515 And
V515 And, like DW Cnc, also shows clear evolution in its timing properties in Fig. 4. At the beginning of the AAVSO coverage of the system, it appeared to be in the midst of a transition to a low state, and the first three epochs seem to imply a transition from a disk-overflow to a stream-fed geometry as the flux declined. With (Kozhevnikov, 2012), V515 And is able to form a partial disk. The declining flux implies a shrinking of the Keplerian disk in epochs 1–2, allowing the stream to overflow, before the disk diminished completely and accretion was mostly stream-fed in epoch 3. As the flux returned to its typical high state in the fourth and fifth epochs, the WD spin re-emerged, suggesting that the disk had been replenished, though the periodogram in the fourth epoch does not quite surpass the 99.9% confidence level line.
V515 And showed two more epochs of likely disk-overflow accretion: in the sixth and tenth epochs, with the transition in the sixth epoch associated with only a magnitude decrease relative to the preceding and following epochs, a decrease which is also present in the public ASAS-SN light curves. The transition in the tenth epoch is associated with a more appreciable decline in source flux of magnitudes relative to the typical high-state flux, though still not as large a decrease as the one seen in the second and third epochs. Much like DW Cnc, the relative importance of the stream in V515 And appears to be correlated with . We note that our disk-overflow hypothesis is based entirely on the periodograms of optical data, and that beat modulations at optical wavelengths can also arise from reprocessing in the binary rest frame (Warner, 1986). However, we prefer the disk-overflow interpretation in V515 And because the change from a spin-dominated to a beat-dominated regime, coincident with a decrease in flux, is more indicative of a change in accretion geometry than of a sudden onset of reprocessing in the system. We acknowledge that this interpretation isn’t as definitive as if we had observed (simultaneous) beat-modulated X-rays.
4.3 V1223 Sgr
V1223 Sgr is where the interpretation becomes much more complicated. From Fig. 6 we see that is never detected in the periodogram. This is not a new property of V1223 Sgr as the orbital sidebands ( and occasionally ) are usually the dominant modulations at optical wavelengths (Watts et al., 1985; Warner, 1986, e.g.). In the context of the Ferrario & Wickramasinghe (1999) model, the lack of in the power spectrum, combined with the implied low inclination (; Watts et al., 1985) might lead us to conclude that the source is a pure stream-fed system. However, the presence of a strong component in the X-ray light curves (Osborne et al., 1985) is compatible with a disk-fed accretion flow where the optical emission modulated on is a result of spin-modulated X-rays reprocessed in the binary orbital frame, either by the hotspot or the secondary itself (Warner, 1986). It is also worth noting that disk-overflow accretion is unlikely, at least in the high state, as (Osborne et al., 1985; Jablonski & Steiner, 1987), such that the stream should not reach the inner-edge of the disk.444However, Patterson et al. (2020) note that V1223 Sgr shows prolonged episodes of spin-down, so perhaps the source is not in spin-equilibrium. Unfortunately, without simultaneous X-ray observations during the low state, we are unable to assess whether V1223 Sgr showed evidence of transitioning between accretion modes.
The low state and subsequent recovery of the optical flux of V1223 Sgr was followed by an additional, smaller drop in flux, characterized by an almost complete quenching of the modulation. Though the power is higher in epoch 5 than it is in epoch 4 and 6, it is still not significant (at the 99.9% level). It is possible that the lack of the periodic signal seen in epoch 4 indicates that accretion on to the WD had ceased almost entirely and only the donor and WD were responsible for the measured optical light. To investigate this we utilized the distance to V1223 Sgr as measured by Gaia ( pc; Bailer-Jones et al., 2021), along with the measured extinction (from ; Bonnet-Bidaud et al., 1982), to calculate the absolute -band magnitude of the source at its lowest flux during the 2018 low state. We measure from the ASAS-SN -band light curve, a value typical of a K0V type star (Pecaut & Mamajek, 2013). The companion star has never been detected in the V1223 Sgr system (see e.g. Watts et al., 1985), so we cannot confirm its spectral type. However, the measured h (Jablonski & Steiner, 1987) implies that the donor must be of spectral type M4V with , and the WD itself should be brighter, at (Knigge et al., 2011). As is much brighter than what is expected for a CV with the orbital parameters of V1223 Sgr, we therefore conclude that accretion was still ongoing during the deep low state in 2018, though at a lower rate than typical. The reasoning behind the weakened signal during the low state is therefore unclear. One possible scenario is that the site at which reprocessing takes place (i.e. the hotspot on the edge of the disk Osborne et al., 1985) is smaller at lower . Furthermore, it is also possible that there were simply fewer X-ray photons to reprocess during the low state.
During the recovery from the second flux drop, V1223 Sgr underwent intense outbursting behavior and the large scale variations could wash out any detected periodic variability. Hameury & Lasota (2017) note that the disk instability model, which has been very successful in explaining dwarf novae (DNe) in most CVs, cannot reproduce the short duration outbursts seen in some IPs, including V1223 Sgr. It is likely that the rapid, short-lived outbursts in V1223 Sgr occur via another mechanism and we therefore stop short of giving them the designation of DNe here. For example, the strong magnetic field of the WD could interact with the inner disk, acting as a centrifugal barrier and preventing accretion until enough gas accumulates in the inner disk to cross the barrier and be accreted by the WD (D’Angelo & Spruit, 2010, 2011, 2012). This magnetically gated accretion mechanism is thought to be responsible for the short-duration outbursts seen during the low states of MV Lyr (Scaringi et al., 2017) and TW Pic (Scaringi et al., 2021). In addition, we note in Section 3.5.2 that the ASAS-SN light curve of V1025 Cen (Fig. 10; lower panel) also shows evidence of similar behavior during the recovery from its low state. Littlefield et al. (2022) investigate the outbursts in V1025 Cen and do indeed find them to be consistent with the magnetically gated accretion scenario. A detailed study of the outbursts in the recovery state of V1223 Sgr is beyond the scope of this work, but bears further investigation through modeling the outburst profiles.
4.4 RX J2133.75107
The flux of RX J2133.75107 remained relatively constant throughout the AAVSO observations presented in Fig. 7 aside from a brief decrease in 2012. The duration of the 2012 low state is consistent with similarly short-lived ( week) flux decreases seen in ASAS-SN data (Fig. 7; inset).
The WD spin dominates the power spectra of RX J2133.75107 at all times, implying a standard, disk-fed accretion mode (; Bonnet-Bidaud et al., 2006; Thorstensen et al., 2010), even during the short low state. Of particular interest is the ninth epoch of the AAVSO light curve, which appears to show variability on at % that of the power at . This increase in power at the beat is seen to be coincident with a minor increase in optical flux, rather than the decrease in flux that was seen in DW Cnc and V515 And. However, it must be noted that the majority of the AAVSO photometry does show variability on (above the 99% confidence interval). In the context of the Ferrario & Wickramasinghe (1999) model, power at is indicative of a not-insignificant contribution from the stream and might be suggestive of disk-overflow accretion. However, the ratio for RX J2133.75107 is , meaning that the overflow stream should not be close to the inner edge of the disk, especially during a time of enhanced mass-transfer, and disk-overflow accretion is therefore unlikely. Instead, a more likely scenario for the enhanced power at in the higher epoch 9 is increased reprocessing of the enhanced emission by parts of the system rotating in the binary frame.
4.5 DO Dra and V1025 Cen
In the final two systems presented in this work, V1025 Cen and DO Dra, we cannot draw many conclusions without detailed timing analysis. DO Dra showed very high-amplitude (up to mag) variability even when it was ostensibly in a low state in 2018 and Lomb Scargle timing analysis revealed no coherent signals in the data. The low state of DO Dra is not ‘well-behaved’ like the other sources discussed in this work, showing evidence of a varying that can even be as high as in the ‘normal’ high state, but also low enough for the optical flux to drop to within a matter of days (see the lower panel of Fig. 9). An apparent , combined with the derived pc (Bailer-Jones et al., 2021) implies an absolute . Mateo et al. (1991) derive a spectral type of MV, which agrees with the expected M3.5V donor as predicted by the Knigge et al. (2011) model, given the measured h (Haswell et al., 1997) of DO Dra. The donor should therefore exhibit and the WD itself (Knigge et al., 2011), very close to the observed properties of DO Dra. It is therefore possible that, when DO Dra was at its lowest flux, accretion on to the WD had ceased, and the optical flux originated from the companion star and the WD only. This is supported by the non-detections in both soft (Swift X-ray Telescope, coincident with the UVOT observations in Fig. 9) and hard (NuSTAR; Shaw et al., 2020) X-rays. Hill et al. 2022 (submitted) present 65 d of TESS observations of DO Dra and find that the only periodic signal during a 28 h low state at the beginning of 2020 is the ellipsoidal modulation of the binary, further supporting the hypothesis that accretion can completely cease in this system.
Similarly, V1025 Cen also reached as low as , and has a similar distance to DO Dra ( pc Bailer-Jones et al., 2018), again implying . Unlike DO Dra, there is no published spectral type of the companion in V1025 Cen, though the measured h (Buckley et al., 1998) implies M7.5V Knigge et al. (2011), which would suggest according to the model. However, Knigge et al. (2011) also computes the expected for the WD, finding that we should expect for a WD in a h binary, with the exact value dependent on the effective temperature and radius of the WD. Though this is still fainter than the measured of V1025 Cen during its low state, we must note that the source is likely blended in ASAS-SN (Littlefield et al., 2022), which uses a radius circular aperture for photometry (Kochanek et al., 2017). A search of the Gaia Early Data Release 3 database (Gaia Collaboration et al., 2016, 2021) reveals two stars within of V1025 Cen, one of which is only mag fainter than V1025 Cen itself. The true magnitude of V1205 Cen during its low state is therefore likely fainter than , such that it is indeed possible that the flux was originating from only the WD and its companion, i.e. a cessation of accretion. However, we are unable to confirm this without available timing analysis or X-ray observations during the low state.
V1025 Cen remains a source of high interest, as it has been noted before that the timing properties do not align particularly well with stream-fed, disk-fed or disk-overflow accretion models (Hellier et al., 2002). The ratio (Buckley et al., 1998), like DW Cnc, implies that the system shouldn’t be able to form a Keplerian disk, unless the system is severely out of spin equilibrium. In addition, the X-ray light curve does not vary on the orbital or beat frequencies, which argues against a purely stream-fed accretion mode (Hellier et al., 1998). However, considering that we have shown the source to exhibit multi-year low states, it is possible that early observations took place when the system was transitioning between accretion modes. Buckley et al. (1998) presented simultaneous photometry of V1025 Cen in the - and -bands, where the color is close to zero. Furthermore, Fig. 10 also suggests a Vega-like color. The photometry presented by Buckley et al. (1998) took place in April 1995 and showed V1025 Cen at an average , lower than the typical high state (Fig. 10). The spectroscopy that Hellier et al. (2002) used to conclude that the source does not align with any one accretion model took place in May 1996. Considering how long V1025 Cen takes to transition between its low and high states, it is possible that the Hellier et al. (2002) observations did indeed occur when V1025 Cen was in a transitional phase.
4.6 The changing mass-transfer rate
We have shown that for all the sources discussed in this work the source flux, and therefore , can drop to levels well below what is considered ‘typical’ of those systems. For DW Cnc, V515 And and V1223 Sgr we can confirm that the flux decrease can be correlated with changes in their timing properties. For DW Cnc and V515 And the pattern is clear: a reduction in is coincident with a transition to a stream-fed accretion mode, via an accretion mode that is either disk-overflow (V515 And) or possibly a hybrid between stream-fed and accretion from a non-Keplerian ring-like structure (DW Cnc). In V1223 Sgr, the timing signatures do not suggest a transition between accretion modes, but we do see the periodic signal associated with the beat weaken as the flux decreases. In RX J2133.75107, we do not see any changes in the timing signatures associated with the low state, although we do see an increased reprocessing component coincident with a minor increase in source flux.
The physical mechanism behind the decreases in remains unknown, though we are able to speculate. Livio & Pringle (1994) proposed that starspots on the companion passing in front of the point are the cause of the observed drop in mass-transfer rate in VY Scl stars, and by extension this could be applied to the IPs that show similar behavior. Starspots can remain on the stellar surface for months to several years, depending on their size (see e.g. Hall & Henry, 1994; Hatzes, 1995), which can explain the multi-year low states observed in e.g. DW Cnc and V1223 Sgr.
Another possibility for the reduction in could be variations in the radius of the secondary. Bianchini (1990) noted that the late-type donors in CVs can exhibit solar-type cycles, resulting in periodic variations of the quiescent luminosity of the binary. The author attributed this to fractional variations in stellar radius in the range . Any change in the radius of the donor would cause a variation in owing to the Roche lobe overflow nature of accretion in CVs.
It is not clear which, if either, of the two above scenarios are responsible for the low states we have presented in this work. However, both are linked to a Sun-like cycle of activity in the donor star. In future observations of low states, we may be able to test for variations in using optical spectroscopy, which would be indicative of a change in the donor radius (Bianchini, 1990), but it is possible that an entirely different mechanism is responsible for the observed behavior of these IPs.
4.7 A census of IP low states
Beside the six sources presented in this paper, there are numerous other IPs or candidate IPs that appear to exhibit low states. In this section we attempt to present an exhaustive list of all candidate and confirmed IPs that have historically shown this behavior.
Confirmed IPs: AO Psc (Garnavich & Szkody, 1988), FO Aqr (Garnavich & Szkody, 1988; Kennedy et al., 2017; Littlefield et al., 2020), V1223 Sgr (Garnavich & Szkody, 1988, and this work), DW Cnc (Segura Montero et al., 2020, and this work), V515 And (this work), RX J2133.75107 (this work), DO Dra (Andronov & Mishevskiy, 2018, Hill et al. 2022, submitted, and this work), V1025 Cen (Littlefield et al., 2022, and this work), V1323 Her (Andronov et al., 2014), 1RXS J211336.1542226 (Halpern et al., 2018), V1062 Tau (Lipkin et al., 2004).
5 Conclusions
We have presented optical observations of 6 intermediate polars that have shown decreases in flux known as low-states, two of which, V515 And, RX J2133.75107 have not previously been reported to exhibit such behavior. We summarize our findings below:
-
•
Timing analysis of DW Cnc suggests that the source transitions to a completely stream-fed geometry at its lowest flux, before recovering its original timing properties with the recovery of the flux. According to theoretical interpretations of the ratio, DW Cnc should not be a disk-fed system in its normal, high state. We thus hypothesise that it could accrete from a ring-like structure, which dissipates as the flux decreases.
-
•
The temporal properties of V515 And suggest that the two decreases in optical flux that we see are related to a transition between disk-fed, stream-fed and disk-overflow accretion geometries.
-
•
The timing signatures in V1223 Sgr almost completely disappeared as the source entered its first of the two low states presented in this work. We investigate whether accretion on to the WD had almost entirely stopped in this phase but conclude that it was still ongoing, though at a lower than typical for the system. We find no evidence for a changing accretion mode in V1223 Sgr. However, the source did show rapid outbursts during its recovery from the second, shallower low state, which we suggest could be due to episodes of magnetically gated accretion.
-
•
RX J2133.75107 is unusual in that the low states only lasted a matter of days, and the only change in the timing signatures came when the optical flux was slightly higher than typical, during which time we conclude that the system’s increased led to increased reprocessing in the binary orbital frame.
-
•
DO Dra shows high-amplitude variability within its low state and we see no timing signatures in the Lomb Scargle periodograms. We hypothesise that, at the source’s lowest flux (), accretion on to the WD had stopped.
-
•
Similarly, V1025 Cen reached an absolute at its lowest flux, possibly indicating that only the WD (and companion star) were visible and accretion had ceased, though we are unable to confirm this without available timing analysis or X-ray observations.
There are a variety of low state behaviors presented in this work, and in future we must combine optical spectroscopy, photometry and X-ray observations to gain a complete understanding of the physical mechanisms at work.
Acknowledgments
The authors thank the anonymous referee for comments that helped improve the manuscript. AEC acknowledges partial support from the Nevada Undergraduate Research Award. AWS thanks Jean-Marie Hameury for fruitful discussions on the outbursts in V1223 Sgr. We acknowledge with thanks the variable star observations from the AAVSO International Database contributed by observers worldwide and used in this research. AWS thanks Elizabeth Waagen of the AAVSO for facilitating the inclusion of AAVSO observers as co-authors.
References
- Andronov et al. (2014) Andronov, I. L., Dubovsky, P., Yoon, J.-N., & Kim, Y. 2014, The Astronomer’s Telegram, 5944, 1
- Andronov & Mishevskiy (2018) Andronov, I. L., & Mishevskiy, N. N. 2018, Research Notes of the AAS, 2, 197, doi: 10.3847/2515-5172/aaeb8b
- Armitage & Livio (1996) Armitage, P. J., & Livio, M. 1996, ApJ, 470, 1024, doi: 10.1086/177928
- Armitage & Livio (1998) —. 1998, ApJ, 493, 898, doi: 10.1086/305149
- Astropy Collaboration et al. (2013) Astropy Collaboration, Robitaille, T. P., Tollerud, E. J., et al. 2013, A&A, 558, A33, doi: 10.1051/0004-6361/201322068
- Astropy Collaboration et al. (2018) Astropy Collaboration, Price-Whelan, A. M., Sipőcz, B. M., et al. 2018, AJ, 156, 123, doi: 10.3847/1538-3881/aabc4f
- Bailer-Jones et al. (2021) Bailer-Jones, C. A. L., Rybizki, J., Fouesneau, M., Demleitner, M., & Andrae, R. 2021, AJ, 161, 147, doi: 10.3847/1538-3881/abd806
- Bailer-Jones et al. (2018) Bailer-Jones, C. A. L., Rybizki, J., Fouesneau, M., Mantelet, G., & Andrae, R. 2018, AJ, 156, 58, doi: 10.3847/1538-3881/aacb21
- Bernardini et al. (2019) Bernardini, F., de Martino, D., Mukai, K., & Falanga, M. 2019, MNRAS, 484, 101, doi: 10.1093/mnras/sty3499
- Beuermann et al. (2021) Beuermann, K., Breitenstein, P., & Schwab, E. 2021, arXiv e-prints, arXiv:2111.02752. https://arxiv.org/abs/2111.02752
- Bianchini (1990) Bianchini, A. 1990, AJ, 99, 1941, doi: 10.1086/115476
- Bikmaev et al. (2006) Bikmaev, I. F., Revnivtsev, M. G., Burenin, R. A., & Sunyaev, R. A. 2006, Astronomy Letters, 32, 588, doi: 10.1134/S1063773706090039
- Bonnet-Bidaud et al. (2006) Bonnet-Bidaud, J. M., Mouchet, M., de Martino, D., Silvotti, R., & Motch, C. 2006, A&A, 445, 1037, doi: 10.1051/0004-6361:20053303
- Bonnet-Bidaud et al. (1982) Bonnet-Bidaud, J. M., Mouchet, M., & Motch, C. 1982, A&A, 112, 355
- Buckley et al. (1998) Buckley, D. A. H., Cropper, M., Ramsay, G., & Wickramasinghe, D. T. 1998, MNRAS, 299, 83, doi: 10.1046/j.1365-8711.1998.01744.x
- D’Angelo & Spruit (2010) D’Angelo, C. R., & Spruit, H. C. 2010, MNRAS, 406, 1208, doi: 10.1111/j.1365-2966.2010.16749.x
- D’Angelo & Spruit (2011) —. 2011, MNRAS, 416, 893, doi: 10.1111/j.1365-2966.2011.19029.x
- D’Angelo & Spruit (2012) —. 2012, MNRAS, 420, 416, doi: 10.1111/j.1365-2966.2011.20046.x
- Duffy et al. (2021) Duffy, C., Ramsay, G., Steeghs, D., et al. 2021, arXiv e-prints, arXiv:2111.10416. https://arxiv.org/abs/2111.10416
- Ferrario & Wickramasinghe (1999) Ferrario, L., & Wickramasinghe, D. T. 1999, MNRAS, 309, 517, doi: 10.1046/j.1365-8711.1999.02860.x
- Gaia Collaboration et al. (2016) Gaia Collaboration, Prusti, T., de Bruijne, J. H. J., et al. 2016, A&A, 595, A1, doi: 10.1051/0004-6361/201629272
- Gaia Collaboration et al. (2021) Gaia Collaboration, Brown, A. G. A., Vallenari, A., et al. 2021, A&A, 649, A1, doi: 10.1051/0004-6361/202039657
- Garnavich & Szkody (1988) Garnavich, P., & Szkody, P. 1988, PASP, 100, 1522, doi: 10.1086/132358
- Hall & Henry (1994) Hall, D. S., & Henry, G. W. 1994, International Amateur-Professional Photoelectric Photometry Communications, 55, 51
- Halpern et al. (2018) Halpern, J. P., Thorstensen, J. R., Cho, P., et al. 2018, AJ, 155, 247, doi: 10.3847/1538-3881/aabfd0
- Hameury et al. (1986) Hameury, J. M., King, A. R., & Lasota, J. P. 1986, MNRAS, 218, 695, doi: 10.1093/mnras/218.4.695
- Hameury & Lasota (2017) Hameury, J. M., & Lasota, J. P. 2017, A&A, 602, A102, doi: 10.1051/0004-6361/201730760
- Harrison et al. (2013) Harrison, F. A., Craig, W. W., Christensen, F. E., et al. 2013, ApJ, 770, 103, doi: 10.1088/0004-637X/770/2/103
- Haswell et al. (1997) Haswell, C. A., Patterson, J., Thorstensen, J. R., Hellier, C., & Skillman, D. R. 1997, ApJ, 476, 847, doi: 10.1086/303630
- Hatzes (1995) Hatzes, A. P. 1995, ApJ, 451, 784, doi: 10.1086/176265
- Hellier (1993) Hellier, C. 1993, MNRAS, 265, L35, doi: 10.1093/mnras/265.1.L35
- Hellier & Beardmore (2002) Hellier, C., & Beardmore, A. P. 2002, MNRAS, 331, 407, doi: 10.1046/j.1365-8711.2002.05199.x
- Hellier et al. (1998) Hellier, C., Beardmore, A. P., & Buckley, D. A. H. 1998, MNRAS, 299, 851, doi: 10.1046/j.1365-8711.1998.01850.x
- Hellier et al. (2002) Hellier, C., Wynn, G. A., & Buckley, D. A. H. 2002, MNRAS, 333, 84, doi: 10.1046/j.1365-8711.2002.05381.x
- Jablonski & Steiner (1987) Jablonski, F., & Steiner, J. E. 1987, ApJ, 323, 672, doi: 10.1086/165862
- Kennedy et al. (2017) Kennedy, M. R., Garnavich, P. M., Littlefield, C., et al. 2017, MNRAS, 469, 956, doi: 10.1093/mnras/stx880
- Kennedy et al. (2020) —. 2020, MNRAS, 495, 4445, doi: 10.1093/mnras/staa1415
- King & Lasota (1991) King, A. R., & Lasota, J.-P. 1991, ApJ, 378, 674, doi: 10.1086/170467
- King & Wynn (1999) King, A. R., & Wynn, G. A. 1999, MNRAS, 310, 203, doi: 10.1046/j.1365-8711.1999.02974.x
- Knigge et al. (2011) Knigge, C., Baraffe, I., & Patterson, J. 2011, ApJS, 194, 28, doi: 10.1088/0067-0049/194/2/28
- Kochanek et al. (2017) Kochanek, C. S., Shappee, B. J., Stanek, K. Z., et al. 2017, PASP, 129, 104502, doi: 10.1088/1538-3873/aa80d9
- Kozhevnikov (2012) Kozhevnikov, V. P. 2012, MNRAS, 422, 1518, doi: 10.1111/j.1365-2966.2012.20725.x
- Lipkin et al. (2004) Lipkin, Y., Leibowitz, E. M., & Orio, M. 2004, in Astronomical Society of the Pacific Conference Series, Vol. 315, IAU Colloq. 190: Magnetic Cataclysmic Variables, ed. S. Vrielmann & M. Cropper, 243
- Littlefield et al. (2022) Littlefield, C., Lasota, J.-P., Hameury, J.-M., et al. 2022, ApJ, 924, L8, doi: 10.3847/2041-8213/ac4262
- Littlefield et al. (2021) Littlefield, C., Scaringi, S., Garnavich, P., et al. 2021, AJ, 162, 49, doi: 10.3847/1538-3881/ac062b
- Littlefield et al. (2016) Littlefield, C., Garnavich, P., Kennedy, M. R., et al. 2016, ApJ, 833, 93, doi: 10.3847/1538-4357/833/1/93
- Littlefield et al. (2020) —. 2020, ApJ, 896, 116, doi: 10.3847/1538-4357/ab9197
- Livio & Pringle (1994) Livio, M., & Pringle, J. E. 1994, ApJ, 427, 956, doi: 10.1086/174202
- Lomb (1976) Lomb, N. R. 1976, Ap&SS, 39, 447, doi: 10.1007/BF00648343
- Lubow (1989) Lubow, S. H. 1989, ApJ, 340, 1064, doi: 10.1086/167458
- Mateo et al. (1991) Mateo, M., Szkody, P., & Garnavich, P. 1991, ApJ, 370, 370, doi: 10.1086/169823
- Motch et al. (1998) Motch, C., Guillout, P., Haberl, F., et al. 1998, A&AS, 132, 341, doi: 10.1051/aas:1998299
- Mukai (2017) Mukai, K. 2017, PASP, 129, 062001, doi: 10.1088/1538-3873/aa6736
- Norton et al. (2008) Norton, A. J., Butters, O. W., Parker, T. L., & Wynn, G. A. 2008, ApJ, 672, 524, doi: 10.1086/523932
- Norton et al. (2004) Norton, A. J., Wynn, G. A., & Somerscales, R. V. 2004, ApJ, 614, 349, doi: 10.1086/423333
- Nucita et al. (2019) Nucita, A. A., Conversi, L., & Licchelli, D. 2019, MNRAS, 484, 3119, doi: 10.1093/mnras/stz118
- Osborne et al. (1985) Osborne, J. P., Rosen, R., Mason, K. O., & Beuermann, K. 1985, Space Sci. Rev., 40, 143, doi: 10.1007/BF00212878
- Patterson (1994) Patterson, J. 1994, PASP, 106, 209, doi: 10.1086/133375
- Patterson & Szkody (1993) Patterson, J., & Szkody, P. 1993, PASP, 105, 1116, doi: 10.1086/133289
- Patterson et al. (2004) Patterson, J., Thorstensen, J. R., Vanmunster, T., et al. 2004, PASP, 116, 516, doi: 10.1086/421034
- Patterson et al. (2020) Patterson, J., de Miguel, E., Kemp, J., et al. 2020, ApJ, 897, 70, doi: 10.3847/1538-4357/ab863d
- Pecaut & Mamajek (2013) Pecaut, M. J., & Mamajek, E. E. 2013, ApJS, 208, 9, doi: 10.1088/0067-0049/208/1/9
- Pretorius & Mukai (2014) Pretorius, M. L., & Mukai, K. 2014, MNRAS, 442, 2580, doi: 10.1093/mnras/stu990
- Rawat et al. (2021) Rawat, N., Pandey, J. C., & Joshi, A. 2021, ApJ, 912, 78, doi: 10.3847/1538-4357/abedae
- Rodríguez-Gil et al. (2004) Rodríguez-Gil, P., Gänsicke, B. T., Araujo-Betancor, S., & Casares, J. 2004, MNRAS, 349, 367, doi: 10.1111/j.1365-2966.2004.07512.x
- Roming et al. (2005) Roming, P. W. A., Kennedy, T. E., Mason, K. O., et al. 2005, Space Sci. Rev., 120, 95, doi: 10.1007/s11214-005-5095-4
- Scargle (1982) Scargle, J. D. 1982, ApJ, 263, 835, doi: 10.1086/160554
- Scaringi et al. (2017) Scaringi, S., Maccarone, T. J., D’Angelo, C., Knigge, C., & Groot, P. J. 2017, Nature, 552, 210, doi: 10.1038/nature24653
- Scaringi et al. (2021) Scaringi, S., de Martino, D., Buckley, D. A. H., et al. 2021, Nature Astronomy, doi: 10.1038/s41550-021-01494-x
- Segura Montero et al. (2020) Segura Montero, O., Ramírez, S. H., & Echevarría, J. 2020, MNRAS, 494, 4110, doi: 10.1093/mnras/staa856
- Shappee et al. (2014) Shappee, B. J., Prieto, J. L., Grupe, D., et al. 2014, ApJ, 788, 48, doi: 10.1088/0004-637X/788/1/48
- Shaw et al. (2020) Shaw, A. W., Heinke, C. O., Mukai, K., et al. 2020, MNRAS, 498, 3457, doi: 10.1093/mnras/staa2592
- Steiner et al. (1981) Steiner, J. E., Schwartz, D. A., Jablonski, F. J., et al. 1981, ApJ, 249, L21, doi: 10.1086/183650
- Thorstensen et al. (2010) Thorstensen, J. R., Peters, C. S., & Skinner, J. N. 2010, PASP, 122, 1285, doi: 10.1086/657021
- van Amerongen & van Paradijs (1989) van Amerongen, S., & van Paradijs, J. 1989, A&A, 219, 195
- Šimon (2014) Šimon, V. 2014, New A, 33, 44, doi: 10.1016/j.newast.2014.04.005
- Warner (1986) Warner, B. 1986, MNRAS, 219, 347, doi: 10.1093/mnras/219.2.347
- Watts et al. (1985) Watts, D. J., Giles, A. B., Greenhill, J. G., Hill, K., & Bailey, J. 1985, MNRAS, 215, 83, doi: 10.1093/mnras/215.1.83
- Wynn & King (1992) Wynn, G. A., & King, A. R. 1992, MNRAS, 255, 83, doi: 10.1093/mnras/255.1.83