Transition from localized to mean field behaviour of cascading failures in the fiber bundle model on complex networks
Abstract
We study the failure process of fiber bundles on complex networks focusing on the effect of the degree of disorder of fibers’ strength on the transition from localized to mean field behaviour. Starting from a regular square lattice we apply the Watts-Strogatz rewiring technique to introduce long range random connections in the load transmission network and analyze how the ultimate strength of the bundle and the statistics of the size of failure cascades change when the rewiring probability is gradually increased. Our calculations revealed that the degree of strength disorder of nodes of the network has a substantial effect on the localized to mean field transition. In particular, we show that the transition sets on at a finite value of the rewiring probability, which shifts to higher values as the degree of disorder is reduced. The transition is limited to a well defined range of disorder, so that there exists a threshold disorder of nodes’ strength below which the randomization of the network structure does not provide any improvement neither of the overall load bearing capacity nor of the cascade tolerance of the system. At low strength disorder the fully random network is the most stable one, while at high disorder best cascade tolerance is obtained at a lower structural randomness. Based on the interplay of the network structure and strength disorder we construct an analytical argument which provides a reasonable description of the numerical findings.
keywords:
cascading failure , fiber bundle model , Watts-Strogatz rewiring , disorder of failure strength[unideb]organization=University of Debrecen, Faculty of Science and Technology, Doctoral School of Physics, Department of Theoretical Physics, addressline=P.O. Box 400, city=Debrecen, postcode=H-4002, country=Hungary \affiliation[atomki]organization=Institute of Nuclear Research (Atomki), addressline=Poroszlay út 6/c, city=Debrecen, postcode=H-4026, country=Hungary
A transition from localized to mean field behaviour of the failure dynamics of fiber bundles is revealed as the structure of the network of load transmitting connections is varied.
The transition is limited to a well defined range of disorder of the failure strength of nodes (fibers) of the network.
A threshold disorder is determined below which the randomization of the network structure does not provide any improvement neither of the load bearing capacity nor of the cascade tolerance of the system.
An optimal network structure is identified with the highest stability against cascading failure.
1 Introduction
Load redistribution following local damage often drives the cascading failure of connected elements in complex systems [1, 2]. From crackling bursts accompanying materials breakdown, through the failure avalanches of transportation and communication networks, to the cascading blackouts of electric transmission grids, the statistical features of failure cascades, and the overall performance of the damaged system strongly depend on the structure of the underlying network of load transmitting connections between elements of the system [3, 4, 5, 6, 7, 8, 9, 10]. The interplay of the cascading dynamics and of the network topology has recently been studied using discrete models on various types of complex networks. In these approaches either the nodes [5, 8] or the links [11] of the network are assumed to undergo a degradation process accompanied by a mechanism of load rearrangement on the intact elements which can give rise to cascades of failure events. Among these approaches the so-called fiber bundle model (FBM), widely used to study materials breakdown phenomena [12, 13, 14], has proven very useful since it grasps the essential mechanisms of the intermittent failure spreading yet being simple enough to offer analytic solutions in certain limiting cases [15, 16, 12].
In the basic setup, an FBM is composed of a set of parallel fibers organized on a regular lattice [13, 17]. Under a slowly increasing external load the fibers fail irreversibly when the local load on them exceeds their strength value, which is assumed to have a certain degree of randomness. Under the constraint of load conservation, the load dropped by the failed fiber gets redistributed over the remaining intact ones. Recently, two limiting cases of load sharing have been subject to intensive investigations both with a high practical relevance: in case of equal load sharing (ELS) all intact fibers receive the same fraction of load irrespective of their distance from the failed one, while for localized load sharing (LLS) only the intact nearest neighbors share equally the load of the broken element [18, 19, 16, 12, 20]. In both cases the load increments can cause further breakings so that a single broken fiber may trigger an entire cascade of failure events. Due to the generality of this failure spreading mechanism, fibers of the model can easily be replaced by roads carrying traffic [21, 22], flow channels [23], or electric power stations [24, 2, 25, 26, 10] on a high voltage transmission grid, making FBMs a basic modelling framework for cascading failure with widespread applications on complex networks [14].
During the past decades it has been shown that for a broad class of the distributions of fibers’ strength, FBMs exhibit universal behaviour with two distinct universality classes according to the range of load redistribution: for long range load sharing (ELS class) the size of failure cascades proved to be power law distributed with a universal exponent [18, 16, 12] and the bundle has a finite asymptotic strength in the limit of large system sizes [27, 28, 13]. For equal load sharing conditions the fibers always keep the same load, no stress concentration can arise, hence, ELS realizes the mean field limit of FBMs. Under short range load sharing (LLS class) the distribution of cascade sizes is a significantly steeper (non universal) power law or exponential, and additionally, for large system sizes the ultimate strength of the bundle tends to zero [29, 30, 31, 32]. Recently, LLS FBMS have been analyzed on complex networks where fibers were assigned to the nodes and localized load sharing was realized along the links of the network [33]. Based on the statistics of cascade sizes and on the ultimate strength of the system, it was demonstrated for scale-free, Erdős-Rényi (ER) and Watts-Strogatz (WS) rewired networks that LLS FBMs on complex networks fall in the ELS universality class [33]. Later on it was shown on a ring graph with two nearest neighbor links that adding a single random load transmitting connection to each fiber, the localized load sharing FBM exhibits ELS behaviour in terms of the size distribution of failure cascades and global strength [34]. However, all these studies of FBMs on complex networks were limited to a high disorder of node strength and considered only networks with a high degree of randomness in their structure even in the case when all fibers had the same degree.
Here we present a detailed numerical and analytical study of the transition of the failure process of the fiber bundle model from the LLS to the ELS universality class when an initially regular lattice of load transmitting connections is gradually randomized. Starting from a square lattice we apply the Watts-Strogats rewiring technique [35, 36] to introduce long range random connections and study how the critical load and strain of the bundle, furthermore, the statistics of the size of failure cascades change when the rewiring probability is gradually increased at different degrees of disorder of the strength of nodes (fibers). Our calculations revealed that the degree of strength disorder of nodes of the network has a substantial effect on the transition. In particular, we show that the LLS-ELS transition sets on at a finite value of the rewiring probability, which shifts to higher values as the degree of disorder is reduced. The transition is limited to a well defined range of disorder, i.e. there exists a threshold disorder of nodes’ strength below which the randomization of the network structure does not provide any improvement neither of the overall load bearing capacity nor of the cascade tolerance of the system. Based on the interplay of the network structure and strength disorder we construct an analytical argument which provides a reasonable description of the numerical findings.
2 Fiber bundle model on a rewired square lattice
To study cascading failures we consider a bundle of parallel fibers which are assigned to the nodes of a complex network. The bundle is subject to a slowly increasing external mechanical load parallel to the fibers’ direction. To connect the model to the mechanics of materials, we assume that the fibers are linearly elastic up to a threshold load where they break irreversibly. The Young modulus of fibers has a fixed value , however, their local strength is a random variable sampled from a probability density function . When a fiber fails its load has to be overtaken by the remaining intact fibers. We assume localized load sharing (LLS), i.e. load is redistributed along the links of the underlying load transmission networks. In the following details of the model construction are presented:
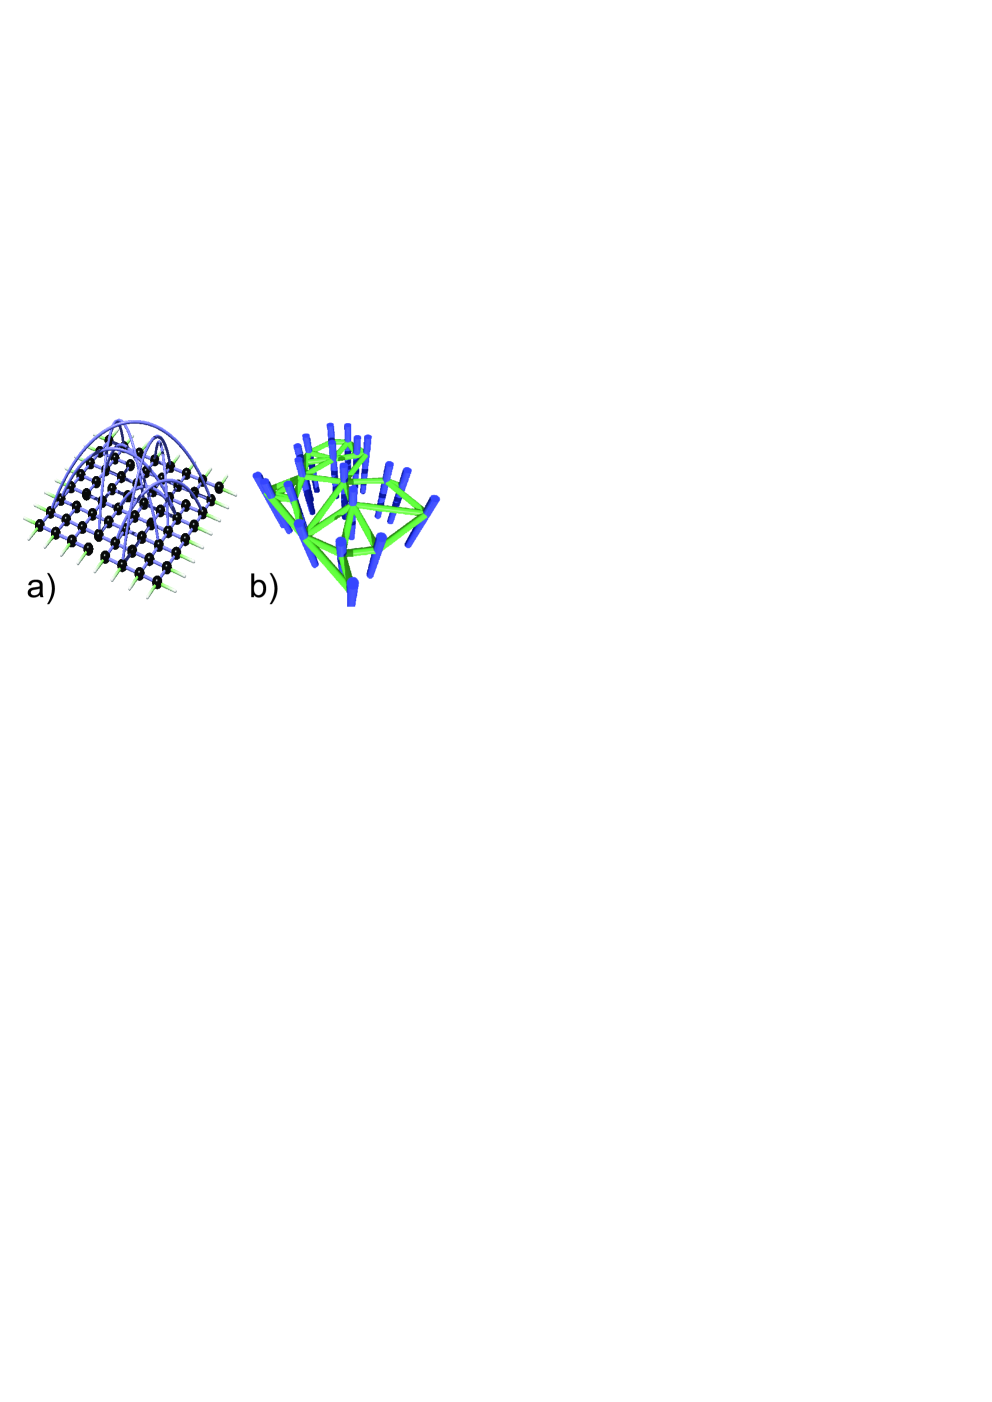
To generate the network of connections along which load is redistributed over fibers, we start from a regular square lattice of side length with fibers, and apply the Watts-Strogatz rewiring technique to randomize the connections [35, 36]. The fibers are assigned to the nodes oriented perpendicular to the plane of the lattice. Figure 1 provides an overview of the model construction. On the square lattice with periodic boundary condition in both directions, all fibers (nodes) are connected to their four nearest neighbors, hence, initially the degree distribution of fibers has the simple form
| (3) |
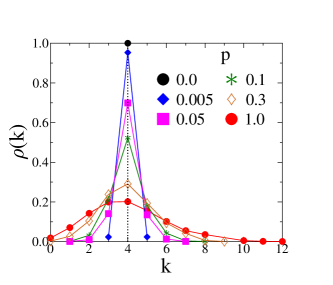
As to the next, each of the initially existing connections is rewired with a probability which spans the interval . For both ends of a rewired link a new fiber is selected randomly in the bundle with the constraint that neither multiple links nor loops are allowed between fibers (see Fig. 1 for illustration). As a consequence, long range randomized connections are introduced in the bundle and the degree distributions broadens while the average degree of nodes , i.e. the average number of interacting partners of fibers, remains the same . The degree distribution of the network is presented in Fig. 2 for several values of the rewiring probability . For large values of in the vicinity of 1, isolated fibers and small clusters of a few fibers may occur due to rewiring. In order to exclude their effect, after the rewiring process we identify all clusters of nodes of the bundle and keep the largest one for further calculations.
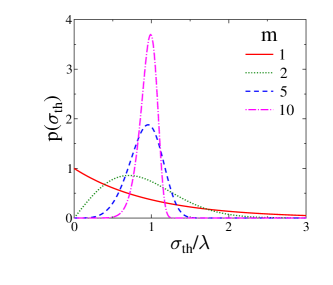
The load bearing capacity of nodes, i.e. the threshold load where fibers fail, is a random variable which is sampled from a Weibull distribution
| (4) |
over the interval . Here the parameter sets the scale of strength values, while controlls the shape of the distribution. The choice of the distribution Eq. (4) has two motivations: the failure behaviour of FBMs with such a fast decaying strength distribution, shows a high degree of robustness which has been well understood both in the equal load sharing and localized load sharing limits on regular square lattices [37, 13]. Varying the Weibull shape parameter in the range , the degree of strength disorder can be controlled in the sense that increasing reduces the width of the distribution making the response of the bundle more brittle. This feature of the distribution is illustrated in Fig. 3 for several values. It is an important characteristics of our model that the strength and the degree of fibers (nodes) () are uncorrelated.
As the load gradually increases on the bundle, initially all fibers keep the same load, hence, the weakest fiber with the lowest breaking threshold breaks first. We assume that fibers have a nearest neighbor interaction so that the load dropped by a broken fiber is equally shared by its intact nearest neighbors on the underlying network. As a consequence, the updated load of the neighboring fibers may exceed their local breaking threshold resulting in additional breakings which are then followed again by load redistribution. As a results of subsequent breaking and load redistribution steps a single fiber failure can trigger an entire cascade of failures, which stops when all the fibers receiving load in a load redistribution step, can sustain the elevated load. This so called localized load sharing has the consequence that fibers breaking in an avalanche form a connected cluster on the underlying network in such a way that on the intact fibers along the cluster perimeter a large amount of load can accumulate.
The system has two sources of disorder, i.e. the stochastic strength of fibers and the randomness of the underlying network of connections, which are both quenched. The interplay of the two gives rise to an inhomogeneous stress field on the fibers, which evolves as the failure of the system proceeds. If fiber of load fails, then its intact nearest neighbors all receive the load increment , so that the load of a neighboring fiber will have the updated value
| (5) |
It follows that , where is the initial degree of the node . During an avalanche the external load is kept constant so that the failure spreading is solely driven by the redistribution of load through the transmission network.
After a cascade stops the external load is further increased to provoke the breaking of a single element: the load of each intact fiber is incremented by the same amount
| (6) |
where is determined as the smallest difference between the load and strength of intact fibers . Ultimate failure of the system occurs when a load increment triggers a catastrophic cascade breaking all the intact fibers.
Simulations of the failure dynamics were performed starting from a square lattice of size with fibers using periodic boundary condition in both directions, which results in load transmitting connections. To controll the degree of strength disorder, the scale parameter of the Weibull distribution was fixed to , while the shape parameter was varied in the range . For the rewiring probability we considered 30 different values in the interval . At each parameter set averages were calculated over 2000 samples.
3 Macroscopic response of fiber bundles on complex networks
The macroscopic response of the bundle can be characterized by determining the relation of its stress and strain . In the limit of equal load sharing, where all fibers interact with each other and keep the same load, this constitutive relation can be obtained analytically as
| (7) |
where denotes the cumulative distribution of failure thresholds [17, 13]. Since at a given strain all the fibers keep the same load , the total load on the system is the product of the load of single fibers and of the fraction of intact fibers . Substituting the Weibull distribution of thresholds Eq. (4) we obtain the mean field constitutive equation of our model
| (8) |
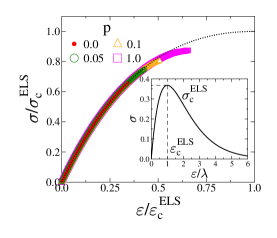
which is presented by the inset of Fig. 4 for . In a load controlled experiment the constitutive curve can only be realized up to the maximum, where immediate failure occurs in the form of a catastrophic cascade. Hence, the value and the position of the maximum define the critical load and strain of the bundle, respectively.
In computer simulations of finite bundles of localized load sharing, the stress and strain of the system
can be obtained on any network topology by summing up the load of fibers (nodes) and dividing it by the bundle size and by the total number of intact fibers , respectively. It has been shown by means of computer simulations that for localized load sharing on regular lattices the constitutive curve of the bundle follows the mean field solution Eq. (7) [38, 19]. However, the response becomes more brittle in the sense that the curve stops earlier at lower and closer to the initial linear regime. Figure 4 demonstrates that this behaviour remains valid for all the networks considered, however, as the rewiring probability increases, the constitutive curves reach to higher and values.
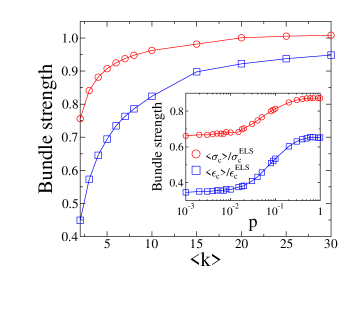
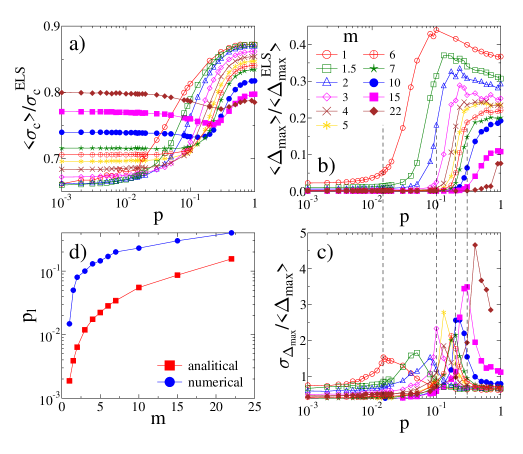
To have a more transparent view on the effect of the network structure on the strength of the bundle, we determined the average value of the critical load and strain as function of the rewiring probability . It can be observed in the inset of Fig. 5 for the Weibull parameter that for small values of the randomized contacts hardly have any effect on the strength of the bundle so that both the critical load and strain retain their original values characteristic for the square lattice at . However, when the rewiring probability exceeds a threshold value the strength starts to increase and saturates to a limit value for completely randomized networks . Note that in the figure the strength values are scaled with their mean field (equal load sharing) counterparts
| (9) | |||||
| (10) |
obtained as the position and value of the maximum of the curve of Eq. (8). This comparison shows that as random connections start to dominate the load transmission among fibers, the strength of the bundle approaches the equal load sharing limit but saturates at a lower value. The reason is that the average number of interacting partners of fibers is fixed to which still gives rise to a significant stress concentration on the network, and hence, reduces the fracture strength of the bundle compared to the mean field limit. To support this argument we performed computer simulations on random graphs corresponding to the limit of our system with the same number of nodes as the original square lattice varying the average number of neighbors in a broad range. Figure 5 demonstrates that increasing the average number of interacting partners of fibers in a completely random network the strength values and converge to their mean field counterparts as expected.
4 Size distribution of failure cascades
The microscopic mechanism of the failure of the system is the cascading failure of nodes (fibers) triggered by single
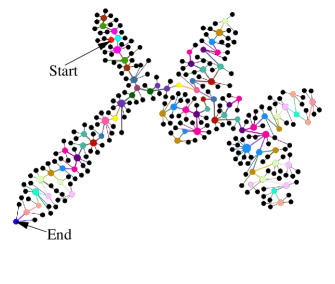
breaking events as a consequence of external load increments. Our simulations revealed that the structure of the load transmission network plays an essential role in the growth of avalanches which in turn also determines the macroscopic behaviour of the bundle. A cascade always starts from a single failing node and spreads over the transmission network, which is demonstrated in Fig. 6 for a network at the rewiring probability with the Weibull shape parameter of strength values. In the figure all fibers (nodes) which receive load from breaking fibers are indicated by black color, and among them those ones which suffer breaking are highlighted by colors different from black. Fibers breaking as a consequence of the same load redistribution step, are represented by the same color. Starting from the externally imposed fiber breaking in the top of the figure, one can easily follow the development of the cascade through the consecutive colors. Note that the cascade forms a connected cluster of broken fibers on the network, however, fibers breaking in the same sub-cascade can be far from each other. The number of fibers breaking in the cascade defines the cascade size .
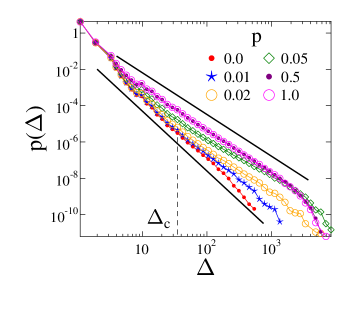
To characterize the statistics of failure cascades we determined the probability distribution of their size , which proved to have a strong dependence on the network topology of load transmitting connections. It can be observed in Fig. 7 for the Weibull parameter that on the regular square lattice () where strong spatial localization of load occurs around failed regions, the distribution can be approximated as a power law
| (11) |
which is followed by a finite size cutoff. The value of the exponent is rather high in agreement with former studies of the fiber bundle model [31, 38, 19]. The rapidly decreasing distribution and the low cutoff burst size clearly show that cascades are typically small compared to the system size . Due to the strong localization large avalanches would lead to immediate collapse of the bundle on the regular lattice. However, increasing the fraction of long range connections by increasing the rewiring probability , the stress localization gets gradually reduced, hence, the system can tolerate larger and larger failure cascades without suffering catastrophic collapse. As a consequence, the cutoff burst size increases and the distribution exhibits a crossover to a second power law regime with a lower exponent. The smaller value of shows the growing fraction of large size cascades in the failure dynamics of the system (see Fig. 7).
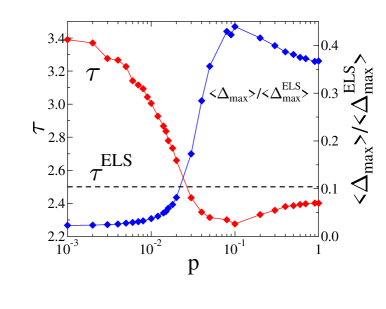
Of course, the crossover burst size , which separates the two power law regimes, depends on the rewiring probability, i.e. gradually shifts to smaller values with increasing in such a way that in the limit practically a single power law remains with a significantly lower exponent than that of the original square lattice at . To characterize this evolution of we determined the average size of the largest avalanche and the power law exponent of the regime of large avalanches as function of the rewiring probability . It can be observed in Fig. 8 for the Weibull parameter that up to the rewiring probability the cutoff cascade size is nearly constant, although the exponent suffered some change. This behaviour implies that the small fraction of randomized contacts has a minor effect on the cascading failure dynamics in this parameter range . However, above this threshold probability a rapid change of the cascade size distribution sets on indicated by the steep increase of and decrease of the exponent . For high values of the rewiring probability , the exponent converges to a constant , which falls very close to the mean field burst size exponent of FBMs [18, 12]. The result indicates that on sufficiently randomized load transmission networks the statistics of failure cascades of the localized load sharing FBM becomes equivalent to the mean field universality class of the system in agreement with the behaviour of the macroscopic strength of the bundle. The result is consistent with Ref. [33] where FBMs were analyzed on Watts-Strogatz networks in the range of high rewiring probabilities recovering the mean field behaviour.
It is interesting to note that in Fig. 8 the average largest cascade size has a maximum around the rewiring probability which practically coincides with the position of the minimum value of the exponent . This behaviour indicates that there exists a network topology determined by where the network can tolerate the largest cascades with a considerable frequency. The reason is that increasing the rewiring probability the growing randomness of the network increases the perimeter of the failed clusters, hence, reducing the load concentration on it. This mechanism stabilizes the system in the sense that cascades can reach larger sizes without becoming instable destroying the system. However, at higher a counter effect occurs that low degree fibers appear on the network with a growing fraction, which increases the load concentration in their vicinity and makes the system more vulnerable to cascades. The value provides the optimum for the cascade tolerance of the system.
5 Effect of the degree of threshold disorder on the LLS-ELS transition
We carried out a large amount of simulations of the failure process of the network of fibers at several values of the Weibull exponent varying the degree of strength disorder in a broad range. These calculations revealed that the LLS to ELS transition has a high complexity as the network structure is gradually changed where the degree of strength disorder of nodes plays a crucial role. Figure 9 demonstrates for the average critical load that as the strength disorder is reduced by increasing , the onset of the transition, i.e. the rewiring probability where the first significant deviation occurs from the LLS result of the regular lattice, shifts to higher values. For instance, for the transition starts at about , which is an order of magnitude higher than the corresponding value obtained at . The transition is completed at a rewiring probability beyond which the bundle strength practically does not change. With decreasing strength disorder the value of also increases and tends towards 1 in such a way that the transition regime shrinks. Note that the asymptotic strength decreases with increasing compared to its mean field counterpart , indicating that at lower threshold disorder randomization of the network structure provides less and less improvement of the overall load bearing capacity of the system. It is interesting to note that at the lowest disorders considered, starting from , the curves proved to be non-monotonous, i.e. for the onset of the increase of the ultimate strength of the system is preceded by a local minimum. Additionally, for the limit value of the strength attained at falls below the strength of the original square lattice. The result implies that when the strength of nodes is sampled from a sufficiently narrow interval the rewiring process gives rise to a reduction of the bundle strength at any rewiring probability.
The analysis of the statistics of cascade size revealed a similar effect of the strength disorder of fibers on the LLS-ELS transition of the failure process: It can be observed in Fig. 9 for the average size of the largest cascade that as the degree of threshold disorder gets reduced with increasing the value of remains constant keeping its value for a broader and broader range of the rewiring probability . The estimated lower bounds of the transition regime are consistent in Figs. 9 and 9 for the macroscopic and microscopic quantities showing that increases with decreasing threshold disorder. Note that the curves rise sharper than the bundle strength making the transition regime more transparent. It can be expected that at the onset of the LLS-ELS transition the value of has large fluctuations. To quantify this Fig. 9 presents the relative scatter of , i.e. the ratio of its standard deviation and average . For each degree of disorder , a sharp maximum can be observed whose position provides a good measure of . The vertical dashed lines highlight for a few Weibull exponents that indeed the maximum of the relative scatter of well coincides with the onset of the sharp rise of in Fig. 9.
It is important to note that as the strength disorder decreases the position of the maximum of where the network tolerates the largest avalanches, shifts to higher values. Additionally, the maximum gradually decreases and eventually disappears around , where the curves become monotonous. It follows that for threshold disorder in the range the fully random graph provides the highest tolerance of cascades. In agreement with the behaviour of the ultimate strength of the bundle, at lower strength disorder of the nodes, the randomization of the network structure provides less and less improvement compared to the LLS limit of regular lattices.
For each degree of disorder the size distribution of cascades goes over the same evolution as for in Fig. 7: below the rewiring probability the cascade size distribution practically remains the same as on the original regular lattice at . The second power law regime with a lower exponent emerges for networks with accompanied by the growth of the cutoff cascade size and by the gradual decrease of the crossover cascade size . When exceeds , the transition gets completed and a single power law remains of .
5.1 Rewiring probability of the onset of the transition
In order to understand how the transition emerges from LLS to ELS with the rewiring probability at different degrees of disorder , we construct an analytical argument based on the changing structure of the underlying load transmission network. On the original square lattice of fibers, localized load sharing dynamics leads to early failure of the entire bundle due to the strong stress concentration on the perimeter of failed clusters [39, 31, 38]. In the last stable configuration of the bundle failed clusters are very small compared to the system size so that the majority of fibers break in the last catastrophic cascade. Adding randomized long range connections leads to the reduction of the local stress concentration by increasing the perimeter of the growing failed cluster. As a consequence, the system can tolerate larger cascades and has a higher overall load bearing capacity.
At a given value of the average number of rewired connections can be estimated as since each of the initial links is rewired with probability . When is low only a very small fraction of fibers is affected in the bundle by the rewiring either by having a removed nearest neighbor link or by getting a newly established long range contact. So it is reasonable to assume that at low values the majority of spreading cascades have a high chance to avoid fibers with rewired links so that cascades remain small following the same statistics as on the original square lattice at . Those cascades which involve fibers with rewired connections may grow to larger sizes resulting in a statistics different from the one of the small avalanches. This mechanism leads to the emergence of a crossover in the distribution of the size of cascades presented in Fig. 7.
To estimate the crossover burst size , it is instructive to determine the probability that a randomly selected node of the network is affected by rewiring. The probability that none of the 4 nearest neighbor connections is rewired for a fiber is , while the probability that it does not get connected to any new fiber can be estimated as for large [40]. Hence, the probability that a node is affected by rewiring can be cast into the form
| (12) |
We assume that crossover occurs at a cascade size above which cascades involve on average at least one fiber affected by the rewiring process. Hence, the relation
| (13) |
follows between and the rewiring probability , from which we obtain
| (14) |
Note that for the crossover avalanche size diverges , while it tends to 1 for .
It follows from the above arguments that at very low rewiring probabilities the crossover cascade size is larger than the average largest avalanche on the original regular lattice at . It has the consequence that the dynamics and statistics of stable cascades is practically not affected by the rewiring in this range, no crossover occurs, so that the distributions of the cascade size remain practically the same as on the square lattice (see Fig. 7). Crossover of the distributions emerges for those values where the condition
| (15) |
holds. Note that of the original lattice also depends on the strength disorder . This first occurs at the lower bound of the transition regime
| (16) |
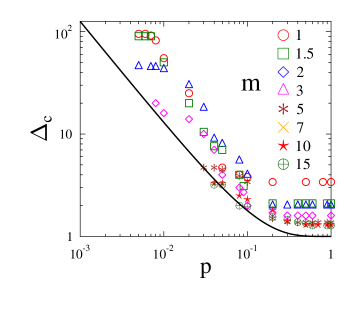
from which can be obtained as a function of the degree of strength disorder . In the regime the crossover cascade size separating the two power law regimes of different exponents can be approximated by Eq. (14). The smallest possible value of we could identify in our numerical measurements is , from which the upper bound of the crossover can be determined. Further increasing above no qualitative change of the failure process occurs so that the statistics of the size of cascades remains the same.
It follows from the above arguments that the dependence of the LLS-ELS transition on the degree of strength disorder of the fibers (nodes) originates from the disorder dependence of the cascade activity of the system on the unperturbed regular lattice. For each Weibull exponent we estimated numerically the crossover point of the cascade size distributions by determining the value of where the two fitted straight lines of the two power law regimes of the distributions cross each other at each rewiring probability . It can be observed in Fig. 10 that the analytical curve of obtained from Eq. (14) underestimates the numerical values, however, its functional form provides a reasonable description of the numerical findings. In Figure 10 the rewiring probability of the lower and upper bounds of the transition at a given disorder can be identified as the values where the crossover first occurs, and where becomes constant, respectively. To obtain a more precise estimate of the transition regime, we solved numerically Eq. (16) for substituting the value of the average largest cascade size at each . This semi-analytical value of is compared in Fig. 9 to the numerical one obtained as the position of the maximum of the relative scatter of in Fig. 9 . The analytical results again underestimate the numerical ones but they have the same functional form. The value of we can estimate from the numerical results falls between 0.2 and 1.
5.2 Failure triggered by low degree fibers
Our simulations revealed that the competition of two mechanisms determine the behaviour of the loaded network both on the micro- and macro-scales. At higher rewiring probabilities the growing randomness of the network reduces the local load concentration in the system. This mechanism can substantially increase the cascade tolerance and the overall load bearing capacity of the network especially at high disorder of the strength of nodes, see Fig. 9. However, as the degree distribution broadens with increasing rewiring probability , low degree nodes appear which have the counter effect of increasing the local load concentration when they fail. This effect becomes crucial at low node strength disorder, where the failure of a low degree node can easily trigger a catastrophic avalanche of failure events. In order to quantify this mechanism we characterize the degree of strength disorder of nodes by estimating the average of the smallest and largest failure thresholds in the bundle. Among independent random numbers sampled from the same probability distribution , the average of the smallest and largest values can be obtained as
| (17) |
where denotes the inverse of the cumulative distribution [41]. Substituting the Weibull distribution Eq. (4), the limit thresholds in a bundle of fibers can be cast into the form
| (18) |
The ratio of the two values provides a measure of the degree of threshold disorder of the nodes
| (19) |
For the stability of the bundle the worst case is when a node of degree has the smallest failure threshold , since at failure it will double the load on its neighbor right at the beginning of the failure process. This load sharing will definitely result in failure of the neighbor if the elevated load is greater than the largest threshold in the bundle so that the condition follows
| (20) |
Since this secondary failure event gives rise to a large load increment on its own neighbors, it is reasonable to assume that the cascade does not stop anymore and it becomes catastrophic. Equation (20) implies that this mechanism determines the response of the bundle only when the strength distribution is sufficiently narrow , and the rewiring probability is sufficiently high to have a finite fraction of nodes of degree . Using the expression of Eq. (19), the condition Eq. (20) can be cast into a condition for the Weibull shape parameter
| (21) |
which yields for the setup of our fiber bundle. It follows that the highest value we considered fulfills the condition so that the ultimate failure of the network at this should be dominantly triggered by fibers of degree 1 at sufficiently high rewiring probabilities. To support the above arguments Fig. 11 presents the average number of intact neighbors of fibers the failure of which initiated the catastrophic cascade along with its original degree . It can be observed that both quantities monotonically decrease with increasing rewiring probability , i.e. as the degree distribution of nodes gets broader with increasing the triggering node has a lower and lower degree. At high strength disorder (low Weibull exponent ) the original and final degrees of triggering fibers have a larger difference, however, as the strength disorder gets reduced with increasing both curves shift to lower values in such a way that their difference gets also smaller. It is important to emphasize that the and curves tend to 1, which confirms that at low strength
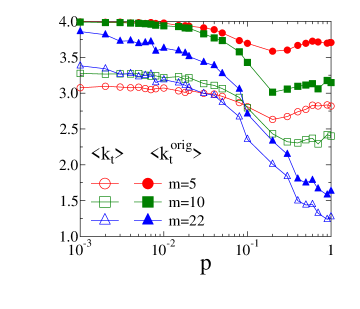
disorder the lowest degree nodes make the system vulnerable to cascading failure triggering the catastrophic breakdown of the system. The most remarkable outcome of these calculations is that the LLS-ELS transition is limited to a disorder range of the strength of nodes. At too low disorder rewiring makes the system more vulnerable to cascades which prevents any improvement of the strength and cascade tolerance of the system. For Weibull exponents fulfilling the condition Eq. (21) no LLS-ELS transition emerges.
6 Discussion and conclusions
We presented a theoretical study of the evolution of the failure dynamics of the fiber bundle model as the underlying network of load transmitting connections is gradually changed from a regular lattice to a random network. A complex network of fibers was constructed by randomizing a regular square lattice using the Watts-Strogatz rewiring technique. Fibers assigned to the nodes of the network are assumed to have a finite load bearing capacity which is a random variable. Initially all fibers are intact and their state is switched to failed when the local load on them exceeds their strength. The system was subject to a slowly increasing external load by adding the same load increment to each intact fiber in such a way that the failure of a single fiber is provoked. The load of failed fibers is transmitted to their intact nearest neighbors which may trigger an entire cascade of failure events under the constraint of load conservation.
Gradually increasing the rewiring probability, we showed that the changing network structure gives rise to a transition from the localized to the mean field behaviour of failure processes accompanied by a complex evolution both on the macro- and micro-scales. The first deviations from the LLS behaviour of the regular lattice appear at a threshold probability where the transition sets on and it gets completed by reaching the upper bound , beyond which no further change occurs in the system. In the transition regime the probability distribution of the size of failure cascades exhibits a crossover between two power laws of different exponents. On the macroscopic scale the curve of LLS bundles follow the mean field solution of the model at all rewiring probabilities but with a lower strength. The critical load and strain where ultimate failure occurs increase with the rewiring probability and tend towards limits which fall close to their mean field values.
We demonstrated that the degree of disorder of the strength of fibers has a substantial effect on the transition: as the disorder gets reduced the transition regime shrinks and shifts to higher rewiring probabilities. Most notably the LLS-ELS transition is limited to a well-defined range of disorder of the strength of nodes. In particular, there exists a threshold amount of node strength disorder below which the randomization of the network of load transmitting connections does not provide any improvement neither of the overall load bearing capacity nor of the cascade tolerance of the system. Computer simulations revealed that at low strength disorder the fully random network is the most stable one, while at high disorder best cascade tolerance is obtained at a lower structural randomness.
Based on the interplay of the network structure and node strength disorder we constructed an analytical argument which provided a reasonable description of the numerical findings. These calculations revealed that two competing mechanisms determine the response of the network: the rewiring of the underlying lattice introduces long range random connections in the load transmission network which reduce the load concentration around failed regions, and in turn allow the system to tolerate larger cascades without becoming instable. At low rewiring probabilities due to the low fraction of long range contacts, small sized cascades remain practically unaffected. However, beyond a characteristic size, cascades involve more and more fibers with rewired contacts which increase their stability. This mechanism leads to the increase of the cutoff cascade size and the emergence of a second power law regime of the distributions with a lower exponent than for the small cascades. However, as the rewiring probability increases the degree distribution broadens which increases the fraction of low degree nodes. This gives rise to the counter effect that in the vicinity of failing low degree nodes a large load concentration emerges, which can trigger catastrophic cascades. As a consequence, at high rewiring probabilities the network becomes vulnerable to early cascades when the strength of nodes is sampled from a narrow distribution.
The failure mechanism of the fiber bundle model we focused on is quite generic with four key elements: the total load on the system is increased by adding the same load increments to all the intact elements; nodes fail irreversibly such that they are removed from the bundle together with their links; failed nodes transfer their load to their intact nearest neighbors through their links; the load on the system is conserved during the spreading of failure cascades. The fiber bundle model has been used to study the emergence of cascading breakdown of roads carrying traffic, flow channels, and power grids. Due to the minimum amount of additional assumptions we made, our results should be relevant for these modelling approaches as well.
Acknowledgments
The work is supported by the EFOP-3.6.1-16-2016-00022 project. The project is co-financed by the European Union and the European Social Fund. This research was supported by the National Research, Development and Innovation Fund of Hungary, financed under the K-16 funding scheme Project no. K 119967. The research was supported by the Thematic Excellence Programme (TKP2020-NKA-04) of the Ministry for Innovation and Technology in Hungary.
References
- [1] S. Boccaletti, V. Latora, Y. Moreno, M. Chavez, D. Hwang, Complex networks: Structure and dynamics, Phys. Rep. 424 (2006) 175.
- [2] I. Dobson, B. A. Carreras, V. E. Lynch, D. E. Newman, Complex systems analysis of series of blackouts: Cascading failure, critical points, and self-organization, Chaos 17 (2) (2007) 026103.
- [3] B. Dou, X. Wang, S. Zhang, Robustness of networks against cascading failures, Physica A 389 (11) (2010) 2310–2317.
- [4] J. Borge-Holthoefer, R. A. Baños, S. González-Bailón, Y. Moreno, Cascading behaviour in complex socio-technical networks, Journal of Complex Networks 1 (1) (2013) 3–24.
- [5] S. Siddique, V. Volovoi, Failure mechanisms of load-sharing complex systems, Phys. Rev. E 89 (2014) 012816.
- [6] J. Gleeson, R. Durrett, Temporal profiles of avalanches on networks, Nat Commun 8 (2017) 1227.
- [7] N. Jung, Q. A. Le, K.-E. Lee, J. W. Lee, Avalanche size distribution of an integrate-and-fire neural model on complex networks, Chaos 30 (6) (2020) 063118.
- [8] J. Awrejcewicz, M. A. F. Sanjuán, Introduction to focus issue: Recent advances in modeling complex systems: Theory and applications, Chaos 31 (7) (2021) 070401.
- [9] B. Ouyang, Z. Teng, Q. Tang, Dynamics in local influence cascading models, Chaos, Solitons & Fractals 93 (2016) 182–186.
- [10] M. Frasca, L. V. Gambuzza, Control of cascading failures in dynamical models of power grids, Chaos, Solitons & Fractals 153 (2021) 111460.
- [11] D. V. Stäger, N. A. M. Araújo, H. J. Herrmann, Usage leading to an abrupt collapse of connectivity, Phys. Rev. E 90 (2014) 042148.
- [12] R. C. Hidalgo, F. Kun, K. Kovács, I. Pagonabarraga, Avalanche dynamics of fiber bundle models, Phys. Rev. E 80 (2009) 051108.
- [13] A. Hansen, P. Hemmer, S. Pradhan, The Fiber Bundle Model: Modeling Failure in Materials, Statistical Physics of Fracture and Breakdown, Wiley, 2015.
- [14] B. K. Chakrabarti, S. Biswas, S. Pradhan, Cooperative dynamics in the fiber bundle model, Frontiers in Physics 8 (2021) 664.
- [15] Y. Moreno, J. B. Gómez, A. F. Pacheco, Instability of scale-free networks under node-breaking avalanches, Europhysics Letters 58 (4) (2002) 630–636.
- [16] Y. Moreno, J. B. Gomez, A. F. Pacheco, Fracture and Second-Order phase transitions, Phys. Rev. Lett. 85 (14) (2000) 2865–2868.
- [17] F. Kun, F. Raischel, R. C. Hidalgo, H. J. Herrmann, Extensions of fiber bundle models, in: P. Bhattacharyya, B. K. Chakrabarti (Eds.), Modelling Critical and Catastrophic Phenomena in Geoscience: A Statistical Physics Approach, Lecture Notes in Physics, Springer-Verlag Berlin Heidelberg New York, 2006, pp. 57–92.
- [18] M. Kloster, A. Hansen, P. C. Hemmer, Burst avalanches in solvable models of fibrous materials, Phys. Rev. E 56 (1997) 2615–2625.
- [19] R. C. Hidalgo, Y. Moreno, F. Kun, H. J. Herrmann, Fracture model with variable range of interaction, Phys. Rev. E 65 (2002) 046148.
- [20] Z. Danku, F. Kun, Temporal and spacial evolution of bursts in creep rupture, Phys. Rev. Lett. 111 (2013) 084302.
- [21] B. K. Chakrabarti, A fiber bundle model of traffic jams, Physica A 372 (2006) 162–166.
- [22] J.-F. Zheng, Z.-Y. Gao, X.-M. Zhao, B.-B. Fu, Extended fiber bundle model for traffic jams on scale-free networks, Int. J. Mod. Phys. C 19 (11) (2008) 1727–1735.
- [23] C. Barré, J. Talbot, Cascading blockages in channel bundles, Phys. Rev. E 92 (2015) 052141.
- [24] O. Yağan, Robustness of power systems under a democratic-fiber-bundle-like model, Phys. Rev. E 91 (2015) 062811.
- [25] J. M. Reynolds-Barredo, D. E. Newman, B. A. Carreras, I. Dobson, The interplay of network structure and dispatch solutions in power grid cascading failures, Chaos 26 (11) (2016) 113111.
- [26] S. Biswas, L. Goehring, Load dependence of power outage statistics, Europhysics Letters 126 (4) (2019) 44002.
- [27] R. L. Smith, The Asymptotic Distribution of the Strength of a Series-Parallel System with Equal Load-Sharing, Ann. Probab. 10 (1) (1982) 137–171.
- [28] L. N. McCartney, R. L. Smith, Statistical Theory of the Strength of Fiber Bundles, J. Appl. Mech 50 (1983) 601–608.
- [29] P. C. Hemmer, A. Hansen, The distribution of simultaneous fiber failures in fiber bundles, J. Appl. Mech. 59 (1992) 909–914.
- [30] A. Hansen, P. C. Hemmer, Burst avalanches in bundles of fibers: Local versus global Load-Sharing, Phys. Lett. A 184 (1994) 394–396.
- [31] F. Raischel, F. Kun, H. J. Herrmann, Local load sharing fiber bundles with a lower cutoff of strength disorder, Phys. Rev. E 74 (2006) 035104.
- [32] K. Kovács, R. C. Hidalgo, I. Pagonabarraga, F. Kun, Brittle-to-ductile transition in a fiber bundle with strong heterogeneity, Phys. Rev. E 87 (2013) 042816.
- [33] D.-H.Kim, B. J. Kim, H. Jeong, Universality class of the fiber bundle model on complex networks, Phys. Rev. Lett. 94 (2005) 025501.
- [34] U. Divakaran, A. Dutta, Fibers on a graph with local load sharing, Int. J. Mod. Phys. C 18 (2007) 6.
- [35] D. Watts, S. Strogatz, Collective dynamics of ‘small-world’ networks, Nature 393 (1998) 440–442.
- [36] D. J. Watts, Networks, dynamics, and the Small‐World phenomenon, American Journal of Sociology 105 (2) (1999) 493–527.
- [37] J. V. Andersen, D. Sornette, K. Leung, Tricritical behaviour in rupture induced by disorder, Phys. Rev. Lett. 78 (1997) 2140–2143.
- [38] F. Kun, S. Zapperi, H. J. Herrmann, Damage in fiber bundle models, Eur. Phys. J. B 17 (2000) 269.
- [39] S. Zapperi, P. Ray, H. E. Stanley, A. Vespignani, Analysis of damage clusters in fracture processes, Physica A 270 (1999) 57.
- [40] M. E. J. Newman, The structure and function of complex networks, SIAM Review 45 (2003) 167–256.
- [41] A. Hansen, S. Roux, Statistical toolbox for damage and fracture, in: D. Krajcinovic, J. v. Mier (Eds.), Damage and Fracture of Disordered Materials, no. 410 in CISM Courses and Lectures, Springer Verlag, 2000, pp. 17–101.