Direct determination of the atomic mass difference of the pairs 76As-76Se and 155Tb-155Gd rules out 76As and 155Tb as possible candidates for electron (anti)neutrino mass measurements
Abstract
The first direct determination of the ground-state-to-ground-state values of the decay 76As 76Se and the electron-capture decay 155Tb 155Gd was performed utilizing the double Penning trap mass spectrometer JYFLTRAP. By measuring the atomic mass difference of the decay pairs via the phase-imaging ion-cyclotron-resonance (PI-ICR) technique, the values of 76As 76Se and 155Tb 155Gd were determined to be 2959.265(74) keV and 814.94(18) keV, respectively. The precision was increased relative to earlier measurements by factors of 12 and 57, respectively. The new values are 1.33 keV and 5 keV lower compared to the values adopted in the most recent Atomic Mass Evaluation 2020. With the newly determined ground-state-to-ground-state values combined with the excitation energy from -ray spectroscopy, the values for ground-state-to-excited-state transitions 76As (ground state) 76Se∗ (2968.4(7) keV) and 155Tb (ground state) 155Gd∗ (815.731(3) keV) were derived to be -9.13(70) keV and -0.79(18) keV. Thus we have confirmed that both of the -decay and EC-decay candidate transitions are energetically forbidden at a level of at least 4, thus definitely excluding these two cases from the list of potential candidates for the search of low--value or EC decays to determine the electron-(anti)neutrino mass.
I Introduction
The knowledge of the absolute neutrino-mass scale is extremely important both for cosmological models and for the fundamental understanding of the nature of particle masses. The information on neutrino masses from oscillation experiments is limited by the fact that these experiments are only able to measure the differences of squared neutrino masses and not their absolute mass scale. The only model-independent information on the neutrino masses, beyond just the mass differences, can be extracted from energy-momentum conservation relations in weak reactions like or electron-capture (EC) decay in which an antineutrino or a neutrino is involved Suhonen and Civitarese (1998); Avignone et al. (2008); Ejiri et al. (2019). Enrico Fermi proposed in 1933 such a kinematic search for the antineutrino mass in the endpoint region of the spectra in 3H decay, 3H(1/2+) 3He(1/2+) + + , with a value of of 18.59201(7) keV Myers et al. (2015). The KATRIN experiment Aker et al. (2021) sets an upper limit of < 0.8 eV, at 90% Confidence Level (CL), via this decay thus improving the previous bound from the Mainz Kraus et al. (2005) and Troitsk Aseev et al. (2011) experiments which managed to constrain < 2.2 eV at 95% CL. KATRIN will continue running to reach a design sensitivity limit of 0.2 eV after 5 calendar years of data taking. Project 8 is exploring a new technique for spectrometry based on cyclotron radiation utilizing molecular tritium as a source Monreal and Formaggio (2009). In a similar manner as the -decay end-point experiments, the sensitivity of EC experiments to the neutrino mass depends on the fraction of events near the end-point. This fraction increases with decreasing value and the (anti)neutrino-mass sensitivity increases accordingly.
An alternative isotope to tritium is 163Ho which has the advantage of a small value of 2.833(30)stat(15)sys keV Eliseev et al. (2015), decaying via EC to 163Dy. Currently, there are several next generation experiments, ECHo Gastaldo et al. (2017), HOLMES Faverzani et al. (2016), and NuMECS Croce et al. (2016), exploring this decay to probe the electron-neutrino mass. These experiments are complementary to tritium-based searches from the perspective of technology. In addition, the decay of 163Ho determines the electron-neutrino mass as opposed to the electron-antineutrino mass in tritium.
A low, especially ultra-low (< 1 keV), -value or EC decay is of great interest for possible future (anti)neutrino-mass determination experiments Mustonen and Suhonen (2010, 2011); Suhonen (2014); De Roubin et al. (2020); Ge et al. (2021a). If an excited state in the daughter nucleus can be found with an excitation energy close to the mass difference of the parent and decay-daughter atoms, which is equal to the ground-state-to-ground-state value, the decay energy of the corresponding transition can be very low. The ultra-low -value decay branch of 115In (9/2+) to the first excited state of 115Sn∗ (9/2+) was first revealed by Cattadori et al. Cattadori et al. (2005). Two independent measurements of the value of this branch, via Penning trap mass spectrometry (PTMS) at Florida State University Mount et al. (2009) and at the University of Jyväskylä Wieslander et al. (2009), confirmed it to be ultra-low. The value of this branch was further refined to be 0.147(10) keV using the accurately measured excitation energy of the first excited state of 115Sn from Zheltonozhsky et al. (2018).
The ground-state-to-ground-state decay value () for decay () and EC decay () is the difference of atomic masses of the decay parent () and the decay daughter ():
| (1) |
where is the speed of light in vacuum. Combining the value with the excitation energy of the decay-daughter state, yields the ground-state-to-excited-state value of :
| (2) |
For EC decay, the atomic binding energy , where denotes the atomic shell of the captured electron, needs to be taken into account to derive the released energy in the decay:
| (3) |
Two potential ultra-low value candidate transitions, decay 76As (ground-state) 76Se∗ (680.1035(17) keV NND (2021)) and EC 155Tb (ground-state) 155Gd∗ (2968.4(7) keV NND (2021)), are of particular interest. Both of the transitions are possibly of the allowed type as shown in Table 1. Emphasis should be given to the transitions of allowed type for the direct (anti)neutrino mass determination Suhonen (2014); Gamage et al. (2019). They are promising candidates due to two main reasons: first, they have larger branching ratios, enabling the accumulation of more data in a shorter time period and potentially making the case more lucrative for direct (anti)neutrino mass determination; second, the decay transition is driven by decay matrix element(s) such that the beta spectral shape is universal, which makes the analysis of the -decay spectrum nuclear-structure independent. The evaluated values in the Atomic Mass Evaluation 2020 Wang et al. (2021) (AME2020) and derived value of the candidate transitions are tabulated in Table 1. The excitation energies in the daughter nuclei are well-known with sub-keV precision NND (2021) while the values are poorly known and lack a value from a direct measurement. This results in the derived values of both decays a precision worse than 1 keV Gamage et al. (2019); Wang et al. (2021). Currently, PTMS is the most precise and accurate method for determining atomic masses and values, and it is capable of reaching a sub-keV precision in a direct manner. Hence, to confirm whether these two decays are energetically possible, direct PTMS determination of the values is called for. In order to solve this puzzle, we have performed in this work a direct -value determination for the two promising candidate nuclei, 76As and 155Tb, using the JYFLTRAP Penning-trap setup.
| Initial state | Final state | Decay type | (keV) | (keV) | E∗ (keV) | ||
| 76As (2-) | 26.24(9) h | 76Se ({2-, 3-, 4-}) | : Allowed{?} | 2960.6(9) | -7.8(11) | 2968.4(7) | |
| 155Tb (3/2+) | 5.32(6) dy | 155Gd ({3/2}+) | EC: Allowed{?} | 820(10) | 4(10) | 815.731(3) |
II Experimental method
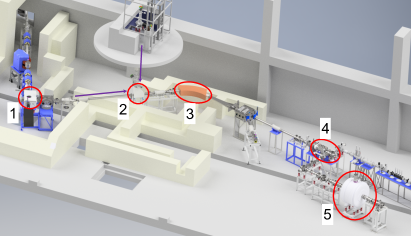
The experiments for the direct value determination were carried out at the Ion Guide Isotope Separator On-Line facility (IGISOL) using the JYFLTRAP double Penning trap mass spectrometer Eronen and Hardy (2012), located at the University of Jyväskylä Moore et al. (2013); Kolhinen et al. (2013). A schematic layout of the facility is shown in Fig. 1. For decay 76As 76Se, the value was deduced by measuring the cyclotron frequency ratio of singly charged 76As+ and 76Se+ ions. Similarly, for EC decay 155Tb 155Gd, the value was derived from the cyclotron frequency ratio measurements of 155Tb+ and 155Gd+ ions.
To produce the 76As+ and 76Se+ ions simultaneously at IGISOL, a thin germanium target with a thickness of about 2 mg/cm2 was bombarded with a 9-MeV deuteron beam from the K-130 cyclotron. The 155Tb+ and 155Gd+ ions were simultaneously produced with a 60-MeV proton beam bombarding a gadolinium target of about 2 mg/cm2 in thickness.
After production, the ions were stopped and thermalized inside the gas cell of the IGISOL light-ion ion guide Huikari et al. (2004). Therein, they were transported by means of helium gas flow (typical gas pressure of 100 mbar) through an extraction nozzle to the sextupole ion guide (SPIG) Karvonen et al. (2008) as a continuous ion beam. After extraction from the SPIG to a high-vacuum region, the ions were accelerated with a 30 kV potential. The ion beam was subsequently steered with an electrostatic kicker and guided through a magnetic dipole mass separator. The separator was sufficient to reject all non-isobaric contaminants but ions which were singly charged with a mass number of interest ( = 76 or 155). The separated and selected ions were then transported through an electrostatic switchyard, which also houses a fast kicker electrode that was used to chop the beam to have an optimum number of ions. After the switchyard, a radiofrequency quadrupole (RFQ) cooler-buncher Nieminen et al. (2001) was used to cool and bunch the injected ions. Finally, the bunched and cooled ions were transported to the downstream JYFLTRAP double Penning trap for the frequency ratio measurement to determine the values.
The JYFLTRAP double Penning trap consists of two cylindrical traps located in a 7-T superconducting magnet. Inside the traps, the homogeneous magnetic field and a quadrupolar electrostatic potential are used to confine the cooled and bunched ions from the RFQ. The first trap is the purification trap, which is used for purification and separation of ions of interest. While the second trap, the so-called precision trap, is utilized for a high-precision mass determination or a direct value measurement. Two techniques are typically used, of which one is the conventional time-of-flight ion-cyclotron-resonance (TOF-ICR) method König et al. (1995); Gräff et al. (1980), and another the phase-imaging ion-cyclotron-resonance (PI-ICR) technique Nesterenko et al. (2018); Eliseev et al. (2014, 2013).
The ions with = 76 from the deuteron-induced secondary beam, which consisted of 76As+, 76Ga+ and 76Se+, were purified via the mass-selective buffer gas cooling method Savard et al. (1991) in the first trap. A typical resolving power was enough to remove all neighbouring isobaric ions and any other ion species present in the beam, resulting in a clean sample of 76As+ or 76Se+. Ions of = 155 from the proton-induced secondary beam were injected to JYFLTRAP, consisting of 155Tb+, 155Gd+, 155Sm+ and 155Eu+. These were firstly purified via the mass-selective buffer gas cooling method. An additional higher resolving power Ramsey cleaning method Eronen et al. (2008) was utilized to selectively prepare a clean sample of 155Tb+ or 155Gd+.
After the well-prepared clean ion sample of either the decay parent or decay daughter entered the second trap, the measurement of cyclotron frequency
| (4) |
was performed. Here is the charge-to-mass ratio of the stored ion and the magnetic field strength.
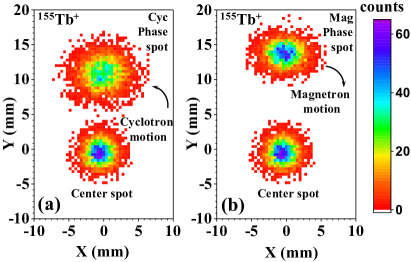
In this work, the PI-ICR technique was used to measure the cyclotron frequencies Nesterenko et al. (2018); Eliseev et al. (2014, 2013), a method which is about 25 times faster reaching a certain precision compared to the TOF-ICR method. In particular, the measurement scheme number 2 described in Eliseev et al. (2014) was utilized to directly measure the cyclotron frequency. Two timing patterns, one called “magnetron” and the other “cyclotron” pattern were used, see Nesterenko et al. (2018). These patterns are otherwise identical except for the switching-on instant of the -pulse that converts ions’ cyclotron motion to magnetron. In the “magnetron” pattern the ions revolve in the trap for an accumulation time with magnetron motion while in the “cyclotron” pattern the ions revolve with cyclotron motion. The exact knowledge of the switch-on time difference is essential. The used patterns produce so-called magnetron and cyclotron spots or phases on the position-sensitive micro-channel plate (MCP) detector PS- (2021). Additionally, it is necessary to measure the motional center spot. With these data, it is then possible to get the angle between the magnetron and cyclotron motion phases with respect to the center spot
| (5) |
where and are the polar angles of cyclotron and magnetron phases, respectively. Finally, the cyclotron frequency is deduced from
| (6) |
where is the number of complete revolutions during the phase accumulation time . The measurement is set up so that will be small in order to minimize systematic shifts due to image distortion by choosing to be as close to integer-multiples of the period as possible.
The accumulation time for both 76Ga+ and 76As+ ions during the interleaved measurement was chosen to be 310 ms in order to ensure that the cyclotron spot was not overlapping with any possible isobaric, excited or molecular contamination. For both 155Tb+ and 155Gd+ ions, the accumulation time was tuned to be 620 ms. The accumulation time was also tuned to the nearest integer-multiples of period of to minimize the angle . This ensured minimal influence from the interconversion of magnetron and cyclotron motions and also minimized the image distortion shift Eliseev et al. (2014); Kretzschmar (1999). In these measurements did not exceed a few degrees.
The collected “magnetron” and “cyclotron” phase spots of 155Tb+ ions are plotted in the left and right panels of Fig. 2. The delay of the cyclotron motion excitation was repeatedly scanned over one magnetron period and the final extraction delay was varied over one cyclotron period to account for any residual magnetron and cyclotron motions that could shift the different spots. These constituted in total scan points for both magnetron and cyclotron phase spots.
The decay value is determined from the cyclotron frequency measurements in form of the ratio :
| (7) |
where is the electron mass and the electron binding energy difference of the parent-daughter atoms, which is typically on the order of few eV. The cyclotron frequency ratio is
| (8) |
where is the cyclotron frequency for parent 76As+ and for daughter 76Se+ measured in the deuteron-induced experiment, while is the cyclotron frequency for 155Tb+ and for 155Gd+ measured in the proton-induced experiment. The ionization energies from the National Institute of Standards and Technology (NIST) Kramida et al. (2020) are used for the calculation of in this work. For the case of parent 76As+ and daughter 76Se+, = -2.607(10) eV. While for the case of parent 155Tb+ and daughter 155Gd+, = -0.563(28) eV. By measuring mass doublets (76As-76Se or 155Tb-155Gd), contributions to the measurement uncertainty arising from mass-dependent systematic effects due to frequency shifts, for example caused by field imperfections, become negligible compared to the typical statistical uncertainty achieved in the measurement. Additionally, as the mass differences of parent-daughter for both 76As-76Se and 155Tb-155Gd are smaller than , the contribution to the values from the mass uncertainties of the reference 76Se (0.08 keV/c2) and 155Gd (1.1 keV/c2) are negligible. Due to the fact that the magnetic field changes with time, an accurate calibration of the field is required for a frequency ratio determination. Thus, a linear interpolation of the neighbouring measurements of the cyclotron frequency of the daughter nuclide was performed to obtain the magnetic field at the moment of the parent cyclotron frequency measurement. During these two experiments, we alternated between parent ion and daughter ion cyclotron frequency measurements every few minutes to minimize the contribution of the magnetic field fluctuation to the measured cyclotron frequency ratio. Therefore, nonlinear changes of the magnetic field between two neighbouring frequency measurements are negligible on the level of frequency determination uncertainties.
III Results and discussion
The data were collected by a sequential measurement of the magnetron and cyclotron phase spots of ions of the parent nucleus and the daughter nucleus, followed by the center spot recording with daughter-nucleus ions. Each of the steps lasted about six minutes. For the case of 76As+-76Se+, two separate runs were recorded, one lasting for 2.1 hours and the other for 5.3 hours and in total 7.4 hours. For the case of 155Tb+-155Gd+, four runs were recorded. These lasted for 3.5 hours, 2.1 hours, 2.2 hours, and 1.7 hours for a total of 9.5 hours.
Before the determination of the positions of each spot, every four or eight rounds of data were grouped for analysis. For each group, positions of each spot—magnetron, cyclotron and center—were determined using the maximum likelihood method and were used to calculate the phase angles. The calculated phase angles were finally used to deduce the cyclotron frequencies via Eq. 6. The closest measured cyclotron frequencies of the daughter ions were linearly interpolated to the time of the measurement of parent ions in between. This interpolated frequency was used to deduce the cyclotron resonance frequency ratio via Eq. 8. The final ratio value is then calculated as the weighted mean of all individual ratios.
During the measurement, the incident ion rate was intentionally limited to a maximum 5 ions/bunch with a median value of around 2 ions/bunch. In order to reduce a possible cyclotron frequency shift due to ion-ion interactions Kellerbauer et al. (2003); Roux et al. (2013), only bunches with upto 5 ions or less were considered in the analysis. A countrate-class analysis Kellerbauer et al. (2003), an evaluation of the data with respect to the number of ions for given measurement cycles, was performed to confirm that the frequency was indeed not shifting with respect to the number of ions.
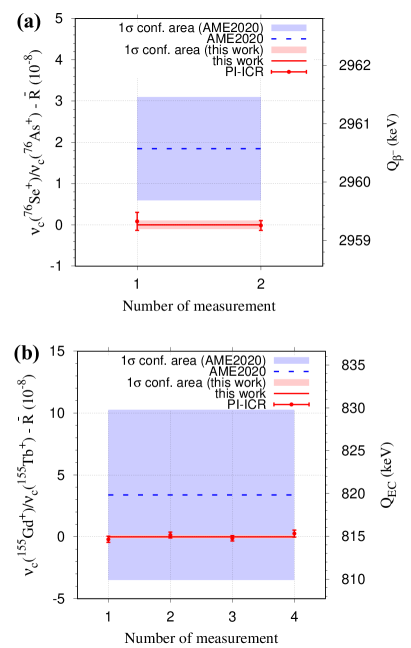
As the of Eq. (5) was kept as small as possible (typically below a few degrees) in the measurement, the frequency shifts due to ion image distortions were well below the statistical uncertainty. All individual ratios for the corresponding runs were calculated along with the inner and outer errors in the analysis of both 76As+-76Se+ and 155Tb+-155Gd+ measurements. The Birge ratio Birge (1932), the ratio of inner and outer errors, was calculated for each data set. The larger of the errors was taken as the final uncertainty. The final ratio was calculated as the weighted mean of all ratios of the data sets for the PI-ICR data. Table 2 lists the obtained frequency ratios of all runs and the final weighted mean ratio of both measurements. The final frequency ratio and the resulting value are and keV for 76As+-76Se+, respectively. and the value are and keV for 155Tb+-155Gd+, respectively. The final results of the analysis compared to literature values are also demonstrated in Fig. 3.
The reliability of the above interpolation method has been cross checked by a polynomial fitting method Nesterenko et al. (2018) to deduce the frequency ratio. The frequency ratio obtained from the polynomial fit agrees well with the value from the linear interpolation analysis within a combined 1 uncertainty for both 76As+-76Se+ and 155Tb+-155Gd+ measurements.
| Isobaric pair | |||
| 76As+/76Se+ | 1 | 1.000 041 847 5(22) | 1.000 041 846 2(10) |
| 2 | 1.000 041 845 8(12) | ||
| 155Tb+/155Gd+ | 1 | 1.000 005 645 1(25) | 1.000 005 647 2(12) |
| 2 | 1.000 005 648 7(23) | ||
| 3 | 1.000 005 646 0(22) | ||
| 4 | 1.000 005 649 8(28) |
| (keV) | ME (keV/) | |
| 76As (This Work) | 2959.265(74) | -72292.683(75) |
| 76As (AME2020) | 2960.6(9) | -72291.4(9) |
| 155Tb (This Work) | 814.94(18) | -71254.9(12) |
| 155Tb (AME2020) | 820(10) | -71250(10) |
The final values and the mass-excess values of 76As and 155Tb obtained from the mean cyclotron frequency ratio measurements are listed in Table 3. In AME2020, the value of 76As()76Se is deduced from the mass difference of 76As and 76Se. 76Se was measured directly with high precision via PTMS Wang et al. (2021). 76As mass is linked to the 75As(n,)76As reaction measurement with an influence of 100%. 75As mass was tied to 75As(p,n)75Se and 75Se(p,)75Se measurements with influences of 85.3% and 14.7%, respectively. These two reaction measurements give an evaluated uncertainty of 0.9 keV/ for the 75As mass, which is the main contribution to the uncertainty of the value of 76As()76Se. In AME2020, the value of 155Tb(EC)155Gd is evaluated from the mass difference of 155Tb and 155Gd. The atomic mass of 155Gd is deduced from three independent measurements 155Gd((n,)156Gd (70.1% influence), 154Gd(n,)155Gd (19.7% influence) and 155GdO-C15 (7.3% influence). An uncertainty of 1.2 keV for mass of 155Gd is given in AME2020. The atomic mass of 155Tb is primarily linked to 155Dy()155Tb. The 155Dy mass is related to 156Dy(d,t)155Dy (92.1% influence) and 155Ho()155Dy (7.9% influence). 156Dy mass is primarily determined by PTMS (99.3% influence) and 155Ho mass is linked to 155Ho()155Dy (60.9% influence) and partially (39.1% influence) evaluated from the directly determined mass with a large uncertainty of 30 keV Litvinov et al. (2005) via the storage ring using the time-resolved Schottky technique at GSI. Previous measurements show that the values determined with an indirect method may possibly be incorrect, and even deviate by more than 10 keV from high-precision PTMS measurements Fink et al. (2012); Nesterenko et al. (2019); Ge et al. (2021b).
As the values of both decay pairs are linked to indirect measurements, direct measurements of the values are strongly encouraged to confirm the accuracy with high precision. For the decay pair 76As-76Se, the value from this work is a factor of 12 more precise and 1.33(90) keV smaller than the value in AME2020 Huang et al. (2021). For the decay pair 155Tb-155Gd, the value from this work is a factor of 57 more precise and 5(10) keV smaller than the value in AME2020 Huang et al. (2021). The mass-excess values of 76As and 155Tb are improved by a factor of 12 and 8, respectively. The main contribution to the uncertainty in 76As is from the mass uncertainty (1.1 keV/c2) of the reference daughter 76Se. For 155Tb, an additional 0.08 keV/c2 uncertainty contribution to the mass-excess is added from the mass uncertainty of the reference daughter 155Gd.
| Daught | E∗ | (keV) (AME2020) | (keV) (This work) | (This work) |
| 76Se | 2968.4(7) | -7.8(11) | -9.13(70) | 13 |
| 155Gd | 815.731(3) | 4(10) | -0.79(18) | 4 |
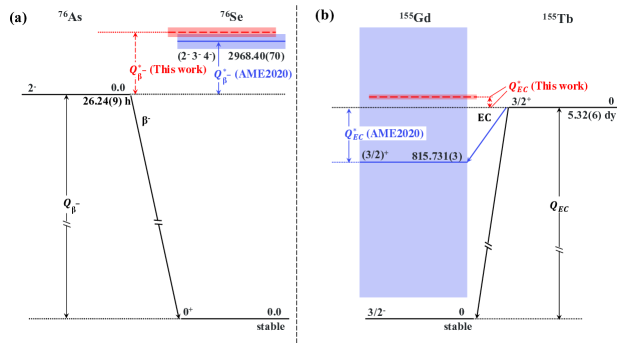
With the direct measurements of the values combined with the excitation energies from NND (2021), the values of the potential ultra-low -value decays from ground states to the excited states are derived and tabulated in table 4. A comparison of values derived from AME2020 with the newly determined values of this work is depicted in Fig. 4 as well. Our results confirm that the decay of the ground-state of 76As to the excited-state of 76Se (2968.4(7) keV) is an energetically-forbidden decay branch with a value below 0 at a 13 level. In addition, the EC decay of the ground-state of 155Tb to the excited-state of 155Gd (815.731(3) keV) is verified to be energetically forbidden at a level of 4.
While the small negative values exclude these nuclei as potential candidates for neutrino-mass measurements, they make studies of an interesting rare process, a radiative detour transition, possible. This second-order process, involving an additional photon, can have a non-negligible branching ratio when angular-momentum selection rules hinder the direct transition Longmire (1949). In Ref. Pfützner et al. (2015) the contribution of the virtual transition was estimated to be about 4% of the - decay in 59Ni. However, the negative -value there was 26 keV, and the probability of the virtual transition is proportional to the inverse of the square of this energy difference Longmire (1949). Thus, the smaller the energy difference, the better the candidate. Recently, another possible candidate, 72As, was discovered with a -value of -3.42(8) keV for a transition to an excited state Ge et al. (2021b).
IV Conclusion and Outlook
At the JYFLTRAP Penning-trap mass spectrometer, direct high-precision ground-state-to-ground-state /EC-decay -value measurements of 76As()76Se and 155Tb(EC)155Gd were performed using the PI-ICR technique. The values of the two decay pairs were determined to be 2959.265(74) keV and 814.94(18) keV, respectively. The precision of the 76As()76Se-decay value was improved by a factor of more than 50. A factor of 12 more precise value was obtained for the 155Tb(EC)155Gd decay. Combining with the high-precision energy-level data from -ray spectroscopy, we deduced with sub-keV precision the values for the potential ultra-low -value transition 76As (ground state) 76Se∗ (2968.4(7) keV) and EC transition 155Tb (ground state) 155Gd∗ (815.731(3) keV) to be -9.13(70) keV and -0.79(18) keV, respectively. Both of the decay and EC decay candidate transitions were confirmed to be energetically forbidden at least at the level of 4, thus definitely ruling out these two decay transitions as possible ultra-low -value candidates for the electron (anti)neutrino mass determination. On the other hand, the discovery of such small negative values makes these nuclei excellent candidates for the study of virtual - transitions.
Acknowledgements.
We acknowledge the staff of the accelerator laboratory of University of Jyväskylä (JYFL-ACCLAB) for providing stable online beam and J. Jaatinen and R. Seppälä for preparing the production targets. We thank the support by the Academy of Finland under the Finnish Centre of Excellence Programme 2012-2017 (Nuclear and Accelerator Based Physics Research at JYFL) and projects No. 306980, 312544, 275389, 284516, 295207, 314733, 318043, 327629 and 320062. The support by the EU Horizon 2020 research and innovation program under grant No. 771036 (ERC CoG MAIDEN) is acknowledged.References
- Suhonen and Civitarese (1998) J. Suhonen and O. Civitarese, Physics Reports 300, 123 (1998).
- Avignone et al. (2008) F. T. Avignone, S. R. Elliott, and J. Engel, Reviews of Modern Physics 80, 481 (2008), arXiv:0708.1033 .
- Ejiri et al. (2019) H. Ejiri, J. Suhonen, and K. Zuber, Physics Reports 797, 1 (2019).
- Myers et al. (2015) E. G. Myers, A. Wagner, H. Kracke, and B. A. Wesson, Physical Review Letters 114 (2015), 10.1103/PhysRevLett.114.013003.
- Aker et al. (2021) M. Aker, A. Beglarian, J. Behrens, A. Berlev, U. Besserer, B. Bieringer, F. Block, B. Bornschein, L. Bornschein, M. Böttcher, T. Brunst, T. S. Caldwell, R. M. D. Carney, L. L. Cascio, S. Chilingaryan, W. Choi, K. Debowski, M. Deffert, M. Descher, D. D. Barrero, P. J. Doe, O. Dragoun, G. Drexlin, K. Eitel, E. Ellinger, R. Engel, S. Enomoto, A. Felden, J. A. Formaggio, F. M. Fränkle, G. B. Franklin, F. Friedel, A. Fulst, K. Gauda, W. Gil, F. Glück, R. Grössle, R. Gumbsheimer, V. Gupta, T. Höhn, V. Hannen, N. Haußmann, K. Helbing, S. Hickford, R. Hiller, D. Hillesheimer, D. Hinz, T. Houdy, A. Huber, A. Jansen, C. Karl, F. Kellerer, J. Kellerer, M. Klein, C. Köhler, L. Köllenberger, A. Kopmann, M. Korzeczek, A. Kovalík, B. Krasch, H. Krause, N. Kunka, T. Lasserre, T. L. Le, O. Lebeda, B. Lehnert, A. Lokhov, M. Machatschek, E. Malcherek, M. Mark, A. Marsteller, E. L. Martin, C. Melzer, A. Menshikov, S. Mertens, J. Mostafa, K. Müller, S. Niemes, P. Oelpmann, D. S. Parno, A. W. P. Poon, J. M. L. Poyato, F. Priester, M. Röllig, C. Röttele, R. G. H. Robertson, W. Rodejohann, C. Rodenbeck, M. Ryšavý, R. Sack, A. Saenz, P. Schäfer, A. Schaller, L. Schimpf, K. Schlösser, M. Schlösser, L. Schlüter, S. Schneidewind, M. Schrank, B. Schulz, A. Schwemmer, M. Šefĉík, V. Sibille, D. Siegmann, M. Slezák, M. Steidl, M. Sturm, M. Sun, D. Tcherniakhovski, H. H. Telle, L. A. Thorne, T. Thümmler, N. Titov, I. Tkachev, K. Urban, K. Valerius, D. Vénos, A. P. V. Hernández, C. Weinheimer, S. Welte, J. Wendel, J. F. Wilkerson, J. Wolf, S. Wüstling, W. Xu, Y. R. Yen, S. Zadoroghny, and G. Zeller, “First direct neutrino-mass measurement with sub-eV sensitivity,” (2021), arXiv:2105.08533 [hep-ex] .
- Kraus et al. (2005) C. Kraus, B. Bornschein, L. Bornschein, J. Bonn, B. Flatt, A. Kovalik, B. Ostrick, E. W. Otten, J. P. Schall, T. Thümmler, and C. Weinheimer, European Physical Journal C 40, 447 (2005), arXiv:0412056 [hep-ex] .
- Aseev et al. (2011) V. N. Aseev, A. I. Belesev, A. I. Berlev, E. V. Geraskin, A. A. Golubev, N. A. Likhovid, V. M. Lobashev, A. A. Nozik, V. S. Pantuev, V. I. Parfenov, A. K. Skasyrskaya, F. V. Tkachov, and S. V. Zadorozhny, Physical Review D - Particles, Fields, Gravitation and Cosmology 84, 112003 (2011).
- Monreal and Formaggio (2009) B. Monreal and J. A. Formaggio, Physical Review D 80, 051301 (2009).
- Eliseev et al. (2015) S. Eliseev, K. Blaum, M. Block, S. Chenmarev, H. Dorrer, C. E. Düllmann, C. Enss, P. E. Filianin, L. Gastaldo, M. Goncharov, U. Köster, F. Lautenschläger, Y. N. Novikov, A. Rischka, R. X. Schüssler, L. Schweikhard, and A. Türler, Physical Review Letters 115, 62501 (2015), arXiv:1604.04210 .
- Gastaldo et al. (2017) L. Gastaldo, K. Blaum, K. Chrysalidis, T. Day Goodacre, A. Domula, M. Door, H. Dorrer, C. E. Düllmann, K. Eberhardt, S. Eliseev, C. Enss, A. Faessler, P. Filianin, A. Fleischmann, D. Fonnesu, L. Gamer, R. Haas, C. Hassel, D. Hengstler, J. Jochum, K. Johnston, U. Kebschull, S. Kempf, T. Kieck, U. Köster, S. Lahiri, M. Maiti, F. Mantegazzini, B. Marsh, P. Neroutsos, Y. N. Novikov, P. C. Ranitzsch, S. Rothe, A. Rischka, A. Saenz, O. Sander, F. Schneider, S. Scholl, R. X. Schüssler, C. Schweiger, F. Simkovic, T. Stora, Z. Szücs, A. Türler, M. Veinhard, M. Weber, M. Wegner, K. Wendt, and K. Zuber, European Physical Journal: Special Topics 226, 1623 (2017).
- Faverzani et al. (2016) M. Faverzani, B. Alpert, D. Backer, D. Bennet, M. Biasotti, C. Brofferio, V. Ceriale, G. Ceruti, D. Corsini, P. K. Day, M. De Gerone, R. Dressler, E. Ferri, J. Fowler, E. Fumagalli, J. Gard, F. Gatti, A. Giachero, J. Hays-Wehle, S. Heinitz, G. Hilton, U. Köster, M. Lusignoli, M. Maino, J. Mates, S. Nisi, R. Nizzolo, A. Nucciotti, A. Orlando, L. Parodi, G. Pessina, G. Pizzigoni, A. Puiu, S. Ragazzi, C. Reintsema, M. Ribeiro-Gomez, D. Schmidt, D. Schuman, F. Siccardi, M. Sisti, D. Swetz, F. Terranova, J. Ullom, and L. Vale, Journal of Low Temperature Physics 184, 922 (2016).
- Croce et al. (2016) M. P. Croce, M. W. Rabin, V. Mocko, G. J. Kunde, E. R. Birnbaum, E. M. Bond, J. W. Engle, A. S. Hoover, F. M. Nortier, A. D. Pollington, W. A. Taylor, N. R. Weisse-Bernstein, L. E. Wolfsberg, J. P. Hays-Wehle, D. R. Schmidt, D. S. Swetz, J. N. Ullom, T. E. Barnhart, and R. J. Nickles, Journal of Low Temperature Physics 184, 958 (2016).
- Mustonen and Suhonen (2010) M. T. Mustonen and J. Suhonen, Journal of Physics G: Nuclear and Particle Physics 37, 64008 (2010).
- Mustonen and Suhonen (2011) M. Mustonen and J. Suhonen, Physics Letters B 703, 370 (2011).
- Suhonen (2014) J. Suhonen, Physica Scripta 89, 54032 (2014).
- De Roubin et al. (2020) A. De Roubin, J. Kostensalo, T. Eronen, L. Canete, R. P. De Groote, A. Jokinen, A. Kankainen, D. A. Nesterenko, I. D. Moore, S. Rinta-Antila, J. Suhonen, and M. Vilén, Physical Review Letters 124, 1 (2020), arXiv:2002.08282 .
- Ge et al. (2021a) Z. Ge, T. Eronen, K. S. Tyrin, J. Kotila, J. Kostensalo, D. A. Nesterenko, O. Beliuskina, R. de Groote, A. de Roubin, S. Geldhof, W. Gins, M. Hukkanen, A. Jokinen, A. Kankainen, A. Koszorús, M. I. Krivoruchenko, S. Kujanpää, I. D. Moore, A. Raggio, S. Rinta-Antila, J. Suhonen, V. Virtanen, A. P. Weaver, and A. Zadvornaya, Phys. Rev. Lett. 127, 272301 (2021a).
- Cattadori et al. (2005) C. M. Cattadori, M. De Deo, M. Laubenstein, L. Pandola, and V. I. Tretyak, Nuclear Physics A 748, 333 (2005).
- Mount et al. (2009) B. J. Mount, M. Redshaw, and E. G. Myers, Physical Review Letters 103, 122502 (2009).
- Wieslander et al. (2009) J. S. Wieslander, J. Suhonen, T. Eronen, M. Hult, V. V. Elomaa, A. Jokinen, G. Marissens, M. Misiaszek, M. T. Mustonen, S. Rahaman, C. Weber, and J. Äystö, Physical Review Letters 103, 122501 (2009).
- Zheltonozhsky et al. (2018) V. A. Zheltonozhsky, A. M. Savrasov, N. V. Strilchuk, and V. I. Tretyak, EPL (Europhysics Letters) 121, 12001 (2018).
- NND (2021) “National nuclear data center,” Available at https://www.nndc.bnl.gov/ (2020/4/7) (2021).
- Gamage et al. (2019) N. D. Gamage, R. Bhandari, M. Horana Gamage, R. Sandler, and M. Redshaw, Hyperfine Interactions 240 (2019), 10.1007/s10751-019-1588-5.
- Wang et al. (2021) M. Wang, W. Huang, F. Kondev, G. Audi, and S. Naimi, Chinese Physics C 45, 030003 (2021).
- Eronen and Hardy (2012) T. Eronen and J. C. Hardy, European Physical Journal A 48, 1 (2012).
- Moore et al. (2013) I. D. Moore, T. Eronen, D. Gorelov, J. Hakala, A. Jokinen, A. Kankainen, V. S. Kolhinen, J. Koponen, H. Penttilä, I. Pohjalainen, M. Reponen, J. Rissanen, A. Saastamoinen, S. Rinta-Antila, V. Sonnenschein, and J. Äystö, Nuclear Instruments and Methods in Physics Research, Section B: Beam Interactions with Materials and Atoms 317, 208 (2013).
- Kolhinen et al. (2013) V. S. Kolhinen, T. Eronen, D. Gorelov, J. Hakala, A. Jokinen, K. Jokiranta, A. Kankainen, M. Koikkalainen, J. Koponen, H. Kulmala, M. Lantz, A. Mattera, I. D. Moore, H. Penttilä, T. Pikkarainen, I. Pohjlainen, M. Reponen, S. Rinta-Antila, J. Rissanen, C. Rodríguez Triguero, K. Rytkönen, A. Saastamoinen, A. Solders, V. Sonnenschein, and J. Äystö, Nuclear Instruments and Methods in Physics Research, Section B: Beam Interactions with Materials and Atoms 317, 506 (2013).
- Huikari et al. (2004) J. Huikari, P. Dendooven, A. Jokinen, A. Nieminen, H. Penttilä, K. Peräjärvi, A. Popov, S. Rinta-Antila, and J. Äystö, Nuclear Instruments and Methods in Physics Research, Section B: Beam Interactions with Materials and Atoms 222, 632 (2004).
- Karvonen et al. (2008) P. Karvonen, I. D. Moore, T. Sonoda, T. Kessler, H. Penttilä, K. Peräjärvi, P. Ronkanen, and J. Äystö, Nuclear Instruments and Methods in Physics Research, Section B: Beam Interactions with Materials and Atoms 266, 4794 (2008).
- Nieminen et al. (2001) A. Nieminen, J. Huikari, A. Jokinen, J. Äystö, P. Campbell, and E. C. Cochrane, Nuclear Instruments and Methods in Physics Research, Section A: Accelerators, Spectrometers, Detectors and Associated Equipment 469, 244 (2001).
- König et al. (1995) M. König, G. Bollen, H. J. Kluge, T. Otto, and J. Szerypo, International Journal of Mass Spectrometry and Ion Processes 142, 95 (1995).
- Gräff et al. (1980) G. Gräff, H. Kalinowsky, and J. Traut, Zeitschrift für Physik A: Atoms and Nuclei 297, 35 (1980).
- Nesterenko et al. (2018) D. A. Nesterenko, T. Eronen, A. Kankainen, L. Canete, A. Jokinen, I. D. Moore, H. Penttilä, S. Rinta-Antila, A. de Roubin, and M. Vilen, European Physical Journal A 54, 0 (2018).
- Eliseev et al. (2014) S. Eliseev, K. Blaum, M. Block, A. Dörr, C. Droese, T. Eronen, M. Goncharov, M. Höcker, J. Ketter, E. M. Ramirez, D. A. Nesterenko, Y. N. Novikov, and L. Schweikhard, Applied Physics B: Lasers and Optics 114, 107 (2014).
- Eliseev et al. (2013) S. Eliseev, K. Blaum, M. Block, C. Droese, M. Goncharov, E. Minaya Ramirez, D. A. Nesterenko, Y. N. Novikov, and L. Schweikhard, Physical Review Letters 110, 82501 (2013).
- Savard et al. (1991) G. Savard, S. Becker, G. Bollen, H. J. Kluge, R. B. Moore, T. Otto, L. Schweikhard, H. Stolzenberg, and U. Wiess, Physics Letters A 158, 247 (1991).
- Eronen et al. (2008) T. Eronen, V. V. Elomaa, U. Hager, J. Hakala, A. Jokinen, A. Kankainen, S. Rahaman, J. Rissanen, C. Weber, and J. Äystö, Acta Physica Polonica B 39, 445 (2008).
- PS- (2021) “Micro-channel plate detector with delay line anode, roentdek handels gmbh,” Available at http://www.roentdek.de (2020/11/30) (2021).
- Kretzschmar (1999) M. Kretzschmar, AIP Conf. Proc. 457, 242 (1999).
- Kramida et al. (2020) A. Kramida, Yu. Ralchenko, J. Reader, and and NIST ASD Team, NIST Atomic Spectra Database (ver. 5.8), [Online]. Available: https://physics.nist.gov/asd [2021, January 19]. National Institute of Standards and Technology, Gaithersburg, MD. (2020).
- Kellerbauer et al. (2003) A. Kellerbauer, K. Blaum, G. Bollen, F. Herfurth, H. J. Kluge, M. Kuckein, E. Sauvan, C. Scheidenberger, and L. Schweikhard, European Physical Journal D 22, 53 (2003).
- Roux et al. (2013) C. Roux, K. Blaum, M. Block, C. Droese, S. Eliseev, M. Goncharov, F. Herfurth, E. M. Ramirez, D. A. Nesterenko, Y. N. Novikov, and L. Schweikhard, The European Physical Journal D 67, 1 (2013).
- Birge (1932) R. T. Birge, Physical Review 40, 207 (1932).
- Huang et al. (2021) W. Huang, M. Wang, F. Kondev, G. Audi, and S. Naimi, Chinese Physics C 45, 030002 (2021).
- Litvinov et al. (2005) Y. Litvinov, H. Geissel, T. Radon, F. Attallah, G. Audi, K. Beckert, F. Bosch, M. Falch, B. Franzke, M. Hausmann, M. Hellström, T. Kerscher, O. Klepper, H.-J. Kluge, C. Kozhuharov, K. Löbner, G. Münzenberg, F. Nolden, Y. Novikov, W. Quint, Z. Patyk, H. Reich, C. Scheidenberger, B. Schlitt, M. Steck, K. Sümmerer, L. Vermeeren, M. Winkler, T. Winkler, and H. Wollnik, Nuclear Physics A 756, 3 (2005).
- Fink et al. (2012) D. Fink, J. Barea, D. Beck, K. Blaum, C. Böhm, C. Borgmann, M. Breitenfeldt, F. Herfurth, A. Herlert, J. Kotila, M. Kowalska, S. Kreim, D. Lunney, S. Naimi, M. Rosenbusch, S. Schwarz, L. Schweikhard, F. Šimkovic, J. Stanja, and K. Zuber, Physical Review Letters 108, 1 (2012).
- Nesterenko et al. (2019) D. A. Nesterenko, L. Canete, T. Eronen, A. Jokinen, A. Kankainen, Y. N. Novikov, S. Rinta-Antila, A. de Roubin, and M. Vilen, International Journal of Mass Spectrometry 435, 204 (2019).
- Ge et al. (2021b) Z. Ge, T. Eronen, A. de Roubin, D. A. Nesterenko, M. Hukkanen, O. Beliuskina, R. de Groote, S. Geldhof, W. Gins, A. Kankainen, A. Koszorús, J. Kotila, J. Kostensalo, I. D. Moore, A. Raggio, S. Rinta-Antila, J. Suhonen, V. Virtanen, A. P. Weaver, A. Zadvornaya, and A. Jokinen, Physical Review C 103, 065502 (2021b).
- Longmire (1949) C. L. Longmire, Phys. Rev. 75, 15 (1949).
- Pfützner et al. (2015) M. Pfützner, K. Pachucki, and J. Żylicz, Physical Review C 92, 044305 (2015).