Tomayto, Tomahto. Beyond Token-level Answer Equivalence
for Question Answering Evaluation
Abstract
The predictions of question answering (QA) systems are typically evaluated against manually annotated finite sets of one or more answers. This
leads to a coverage limitation that results in underestimating the true performance of systems, and is typically addressed by extending over exact match (EM) with predefined rules or with the token-level F1 measure.
In this paper, we present the first systematic conceptual and data-driven analysis to examine the shortcomings of token-level equivalence measures.
To this end, we define the asymmetric notion of answer equivalence (AE), accepting answers that are equivalent to or improve over the reference, and publish over 23k human judgments for candidates produced by multiple QA systems on SQuAD.111Dataset and model information available at:
https://github.com/google-research-datasets/answer-equivalence-dataset.
The BEM model can be found at: https://tfhub.dev/google/answer_equivalence/bem/1.
Through a careful analysis of this data, we reveal and quantify several concrete limitations of the F1 measure, such as a false impression of graduality, or missing dependence on the question.
Since collecting AE annotations for each evaluated model is expensive, we learn a BERT matching (BEM) measure to approximate this task. Being a simpler task than QA, we find BEM to provide significantly better AE approximations than F1, and to more accurately reflect the performance of systems.
Finally, we demonstrate the practical utility of AE and BEM on the concrete application of minimal accurate prediction sets, reducing the number of required answers by up to .
1 Introduction
Automatically assessing the answers given by question answering (QA) systems for correctness can be nontrivial. This was already recognized in the early large-scale QA evaluation work of Voorhees and Tice (2000), leading them to suggest string-matching patterns for approximation, yet recognizing their limitations:
“it is quite difficult to determine automatically whether the difference between a new string and a judged string is significant with respect to the correctness of the answer.”
Despite the early recognition of the importance and difficulty of evaluation for question answering, surprisingly little progress has been made. As of today, QA research in the NLP community relies almost exclusively on two token-level metrics, Exact Match (EM) and Token F1 (F1). Unfortunately, both fall short of capturing the difference between significant and insignificant span differences. In Section 2, we first document these limitations, providing a detailed analysis and examples from the SQuAD dataset. Moreover, we extend this analysis with our new findings: the inherent asymmetry of the task and the reliance on the question, also providing examples from the SQuAD dataset. We also identify cases where the context is important.
One obvious limitation of token-level measures is their direct dependence on the diversity of the reference answers collected for the dataset (Chen et al., 2019). While this could be addressed by extending the annotations, this is both expensive and has diminishing returns as the true collection of all correct answers might be large. In contrast, we focus on improving the equivalence measure beyond token matching and thereby increase the answer inclusiveness over any reference set.
To facilitate research on this issue, we introduce a well-defined Answer Equivalence (AE) task along with the release of a new dataset (Section 3). We collect human annotations on SQuAD examples, comparing gold answers with model predictions.
We utilize this data in several ways. First, we use the human judgments to better understand how well F1 and EM capture equivalence in the machine reading setting. We demonstrate that (1) both metrics underestimate the quality of candidate answers, (2) are highly reliant on the number of available references, and (3) that F1 gives the false impression of a gradual rating, while really there is a similar ratio of equivalent to non-equivalent answers for non-zero F1.
We further propose to learn a measure that approximates the AE relations (Section 4). To study this, we introduce BERT matching (BEM), that uses a BERT model trained on our data to predict equivalence. Through multiple experiments with three QA systems, we show that BEM better correlates with human judgments, compared to .
Finally, we demonstrate the utility of AE and BEM on the concrete application of returning small and accurate answers sets (Section 5). Building on the expanded admission conformal prediction framework (Fisch et al., 2021), we show that AE and BEM significantly reduce the number of answers in the prediction sets while including a correct answer with arbitrarily high probability. Thanks to its simplicity, BEM can easily replace in many other applications that leverage QA predictions (e.g., Honovich et al., 2021, 2022; Eyal et al., 2019; Fabbri et al., 2021; Schuster et al., 2021a).
Our main contributions include:
-
•
Defining the answer equivalence (AE) task.
-
•
Releasing a large dataset with AE annotations.
-
•
A data-driven analysis of the shortcomings of EM and as evaluation measures for QA.
-
•
A learned AE measure (BEM) that better correlates with human judgments and enables practical improvements for QA-based applications.
2 Common token-level metrics: EM & F1
Notation.
We refer to the “gold” answers from humans as reference answers. Each question is paired with a set of one or more gold answers. We refer to the predicted answers produced by question answering models as candidate answers.
The most popular metrics are Token () and Exact Match (EM), defined as follows:
Definition 2.1 (Exact Match).
Given a set of references and a candidate answer , is an exact match for iff .
Definition 2.2 (Token F1).
Given a set of references , a candidate answer and a tokenization function , the Token F1 of with respect to and is the maximum over the token-wise F1 scores between and each , i.e.:
It is also common to remove stop words and punctuation before computing either EM or F1.
2.1 Limitations of EM and F1
We briefly recount and provide examples for known short-comings. EM and F1 imperfectly capture the answer equality and can over-, or underestimate the performance of models (Kocmi et al., 2021; Gehrmann et al., 2021; Chen et al., 2019, 2020).
Strictness.
EM is often too strict, especially when only a few gold answers are available. Consider Example 1 in Table 1: even though the difference is a minor surface variation, the candidate receives an EM-score of 0.0 – and also an F1 of (unless further tokenization is done).
Granularity.
Both EM and F1 do not distinguish between significant and insignificant span differences. This can be misleading and sometimes surfaces in surprising ways. Example 4 in Table 1 shows a reference/candidate pair receiving a relatively high F1 score of – with a completely wrong candidate answer.
Assessment of numbers and units.
Answers can be equivalent when they express identical values in different units (and the question does not specify a specific unit), e.g. Example 8 in Table 1. Similar and frequent problems arise from approximate quantities (e.g. the population of a country), metric vs. imperial units, percentages and absolute values, and spelled out numbers.
| # | Question | Context / Remark | Reference | Candidate | |
| 1 | Whose army liberated Warsaw in 1806? | …Liberated by Napoleon’s army in 1806, Warsaw was made the capital of the newly created Duchy of Warsaw. …” | Napoleon’s | Napoleon | 0.0 |
| Reference and candidate are equivalent but F1 underestimates quality due to tokenization. | |||||
| 2 | Did Tesla graduate from the university? | In 1875, Tesla enrolled at Austrian Polytechnic in Graz …Tesla claimed that he worked from 3 a.m. to 11 p.m., no Sundays or holidays excepted. …Tesla was unprepared and asked for an extension to study, but was denied. He never graduated from the university and did not receive grades for the last semester. | no222Note that this annotation violates the SQuAD guidelines. However, human raters are easily able to establish equivalence of these answers. | He never graduated from the university | 0.0 |
| Equivalence between candidate and reference is easy to establish for humans but fails for automatic evaluation. | |||||
| 3 | Why is Warsaw’s flora very rich in species? | …The species richness is mainly due to the location of Warsaw within the border region of several big floral regions comprising substantial proportions of close-to-wilderness areas (natural forests, wetlands along the Vistula) as well as arable land, meadows and forests. | location | the location of Warsaw within the border region of several big floral regions | 0.14 |
| The candidate adds relevant detail to the reference. | |||||
| 4 | Other than many sunny days, what characteristic is typical for the weather in Southern California? | Southern California contains a Mediterranean climate, with infrequent rain and many sunny days… | infrequent rain | rain | 0.67 |
| The candidate drops important information. | |||||
| 5 | What is commonly believed to be the relationship between NP and co-NP? | …It is believed that NP is not equal to co-NP; however, it has not yet been proven. It has been shown that if these two complexity classes are not equal then P is not equal to NP. | NP is not equal to co-NP | P is not equal to NP | 0.84 |
| Superficially high token overlap, yet different and wrong answer. | |||||
| 6 | What types of teachers are retiring the most? | …Excellent job opportunities are expected as retirements, especially among secondary school teachers, outweigh slowing enrollment growth; … | secondary school teachers | secondary school | 0.8 |
| Candidate answer is only equivalent given the question. | |||||
| 7 | Who did Tesla think would run the world of the future? | In 1926, Tesla commented on the ills of the social subservience of women and the struggle of women toward gender equality, and indicated that humanity’s future would be run by ‘Queen Bees.’ | women | Queen Bees | 0.0 |
| Candidate answer is only equivalent given the context. | |||||
| 8 | How much do researchers now think sea levels will rise from 1990 to 2100? | …When the researchers’ analysis was applied to the possible scenarios outlined by the Intergovernmental Panel on Climate Change (IPCC), the researchers found that in 2100 sea levels would be 0.5–1.4 m [50–140 cm] above 1990 levels. … | 50–140 cm | 0.5–1.4 m | 0.0 |
| Candidate is identical to the reference but the metric is not sensitive to units. | |||||
2.2 Further limitations
We find F1 has several more specific shortcomings that make it less suitable for QA evaluation.
Asymmetry.
A candidate answer can improve over the reference by adding relevant information, such as Example 3 in Table 1. In that case it should get credit in evaluation, even though it is not strictly equivalent. Conversely, omitting relevant information (which is present in the reference answer) in the candidate answer should be discouraged.
On the other hand, if the candidate answer removes irrelevant or misleading information, it also improves the reference answer, and, even though it is not strictly equivalent, should get full credit in evaluation. Both EM and F1 fail to recognize such cases, because they are symmetric.
The question matters.
Whether two answers are equivalent might depend on the question. In Example 6 in Table 1 ‘secondary school’ is equivalent to ‘secondary school teachers’ only because the question explicitly asked for teachers.
Note that this is a particular example of a fused-head construction, which occur frequently in machine reading datasets. Elazar and Goldberg (2019) discuss this phenomenon for numerical cases.
The context matters.
More rarely than with questions, the context can determine whether two answers are equivalent. Consider Example 7 in Table 1. ‘Queen Bees’ only qualifies as a possible match for the reference answer ‘women’, because it is used as a metaphor in the context.
3 The AE task definition and dataset
To address the issues mentioned in Section 2, we require the answer equivalence relation to be asymmetric and to be conditional on both question and context. We want an ideal metric to give credit for a candidate answer that is at least as good as the reference, i.e. it should capture all the important information in the reference and not add irrelevant, or worse, misleading information. A candidate answer that improves over the reference by either removing misleading or irrelevant information, or adding more relevant information, should receive full credit. More formally, we define:
Definition 3.1 (Answer Relation).
Let be a query and let be answers contained in a context . Then is a good answer in place of if both the following are satisfied:
-
(i)
does contain at least the same (or more) relevant information as , taking into account and ; in particular it does not omit any relevant information present in .
-
(ii)
contains neither misleading or excessive superfluous information not present in , taking into account and .
Note that this approach does not aim to replace the regular QA annotations, but expands on them to create larger, more inclusive sets of acceptable answers. Most studies rely on token-level measures to approximate this expansion. However, as detailed in Section 2, such measures are inadequate.
3.1 Rating task
We design the rating task for answer equivalence as follows: the raters are presented with (i) the question, (ii) context from Wikipedia that contains the answer text, (iii) the reference answer (referred to as ‘first answer’), and (iv) a candidate answer (referred to as ‘second answer’). They are then asked the following yes/no questions in sequence:
-
Q1
Is the second answer a completely different answer?
-
Q2
Would using the second answer in place of the first answer convey at least the same information to someone asking this question, without leaving out any important information nor adding any misleading or superfluous information?
(Note that either adding important information or removing superfluous or misleading information in the second answer from the first answer would still convey at least the same information.)333In initial rounds we asked a much shorter version of this question: ‘Can the second answer be used in place of the first answer?’ and had an exact definition of the differences we were looking for in the overall task description. As there was frequent confusion on the details we noticed that we had more success giving the precise wording here. Note that we deliberately don’t use the notion of equivalence in our task to avoid varying interpretations. -
Q3
Does the second answer remove important information?
-
Q4
Does the second answer add misleading or excessive superfluous information?
If a rater answers ‘yes’ to the first question, the rating is terminated and the following questions are not shown. Similarly, if a rater answers ‘yes’ to the second question, the rating ends and / are not shown. Otherwise, all four questions are answered.
3.2 Data collection
We use the above task to annotate examples generated from the SQuAD dataset Rajpurkar et al. (2016), labelling examples from both train and dev.
For the training examples, we partition the SQuAD train set 5-ways at random, and train five Albert models Lan et al. (2019), each excluding one of the partitions (i.e. training on 80% of the available data). We then use each model to generate predictions for the unseen examples in its excluded partition, thereby generating predictions for the entire SQuAD train set. We rate all examples where the prediction does not match the reference.
Three different models are used to make prediction on the SQuAD dev set: BiDAF Seo et al. (2016), XLNet Yang et al. (2019), and Luke Yamada et al. (2020). As before we remove predictions that match any of the (up to ) reference answers. Otherwise we pair the prediction with reference and annotate all combinations.
For XLNet predictions we collect up to 4 annotations444We used XLNet for quality control and to estimate rater agreement; see below.; for Luke and BiDAF we obtain only a single annotation. Overall, we collect annotations for (question, context, reference, candidate)-tuples for non-EM predictions. See the Appendix (Table 10) for detailed statistics.
3.3 Train / Dev / Test splits
We provide two partitionings of the dev data: either split by the system producing the candidate as introduced above, see Table 10, or in a 30/70 dev/test split, see Table 2. For the latter we select examples with no document overlap between dev and test sets. In either case, the training data is the same.
| Count | AE Train | AE Dev | AE Test | Total |
| AE-examples | 9,090 | 2,734 | 5,831 | 17,655 |
| Ratings | 9,090 | 4,446 | 9,724 | 23,260 |
3.4 Answer Equivalence definition
Each annotation consists of four binary answers to the questions given in Section 3.1. We define the candidate to be equivalent to the reference, if it is rated as (1) not completely different (i.e. is answered ‘no’) and (2) containing at least as much relevant information and not more irrelevant information as the gold answer (i.e. is answered ‘yes’). In all other cases we define the candidate to be not equivalent to the reference.
3.5 Quantitative analysis
Overall our raters consider of the pairs that are not exact matches to be equivalent. At 69.9% that rate is higher for the candidates from SQuAD train but also differs across systems. As expected and shown in Table 11, ratings for AE examples produced by BiDAF are less likely to be rated equivalent than those produced by XLNet or Luke.
We collect a total of ratings on SQuAD dev, for AE-examples, i.e. (context, question, reference, candidate)-tuples (Table 10 in the Appendix). examples have a single rating, have two, have three and have four. We aggregate the ratings per example using majority voting.555For the very few () ties, we take a random decision. Among all examples with multiple annotations, over have full agreement between raters. Similarly, selecting a random pair of ratings for the same example, has a chance of agreement. Finally, we compute Krippendorff’s at , confirming good inter-annotator agreement.666According to Krippendorff (2004), it is “customary to require ”.
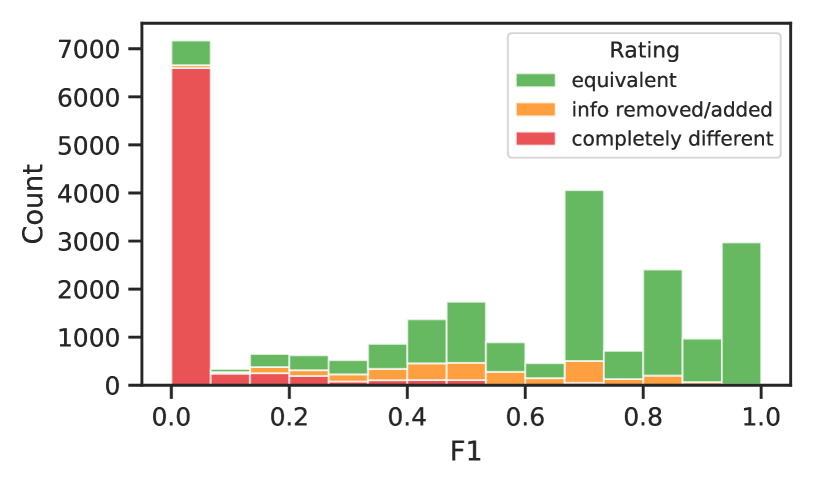
As expected, Figure 1 shows the vast majority of completely different answers are cases of no token overlap between reference and candidate answer. Interestingly, all buckets with contain a sizeable portion of equivalent answers.
3.6 Qualitative analysis
Comparing raters’ judgment on the Answer Equivalence task with F1 scores shows typical disadvantages, and limitations of F1. In the area of high F1 scores (i.e. ), raters find answers with significantly changed meaning, despite having substantial overlap with the reference answer. For example, ‘O notation’ can not necessarily be understood as ‘Big O notation’ (), or ‘June’ is not equivalent to ‘every June’ ().
On the other hand, in the area of low F1 scores (e.g. ), we can see answers that convey the same core content as the reference but with added information that an informed human would likely give. For example, for a question ‘In the most basic sense what did a Turing machine emulate?’, an answer ‘a very robust and flexible simplification of a computer’ is more informative than the bare minimum reference ‘a computer’.
Moreover, the candidate can add crucial information, thereby improving over the reference: e.g. for the question: ‘What acquired condition results in immunodeficiency in humans?’, raters rate positively an answer ‘HIV/AIDS, or the use of immunosuppressive medication’, despite the reference being only ‘HIV/AIDS’.
3.7 Quantifying limitations of F1
In our data we observe three further issues with F1. Firstly, having values on a scale from to gives the impression of a gradual rating, with e.g. being twice as correct as . Almost all of the answers with a rating greater than were rated as equivalent.
Secondly, we observe that F1 systematically underestimates model performance compared to human judgment. Table 6 shows that both EM and F1 severely underestimate the quality of predictions.
Lastly, F1 is highly dependant on the number of available references. Table 7 quantifies how F1 becomes a better estimator of human judgment when more references become available. This is an issue because additional references are not available or expensive and laborious to generate.
4 Predicting Answer Equivalence
In the previous section we defined the AE task and discussed the value of such annotations. In practice, however, obtaining human ratings is slow and expensive. This is especially true for open-domain or generative QA models, where the space of possible answers is infinite. Instead, we train a classifier to predict AE for any answer pair.
We find the classifier’s score to be more accurate (§4.1.2), and provide practical gains (§5). We conjecture that the high performance of the classifier is due to the easier nature of the AE task compared to QA. While, under some assumptions, the question-answering problem is NP-complete (Weston et al., 2015), the verification of a candidate answer against an already given true answer is significantly simpler.
The classification task.
Given the four-tuple (context, question, reference answer, candidate answer), predict the equivalence of the answers.
4.1 Bert Match (BEM)
To achieve the approximate AE predictions, we train a BERT-Base Devlin et al. (2019) model on the AE training set. (Training details can be found in Appendix B.)
4.1.1 Comparing input variations
We experiment with three different settings for incorporating the question and context:
-
(i)
Only answers: Just using the two answers as model input; more precisely: [CLS] candidate [SEP] reference [SEP]
-
(ii)
Question and answers: We present the question and the two answers; i.e. [CLS] candidate [SEP] reference [SEP] question [SEP]
-
(iii)
Context, question and answers: We present all available information: [CLS] candidate [SEP] reference [SEP] question [SEP] context [SEP]
| Mode | Accuracy |
| Only answers | 89.27 |
| Question and answers | 90.70 |
| Context, question and answers | 89.53 |
The classification accuracy results comparing the three different models are shown in Table 3. A model that just sees both answers (i) already performs well on the task, improving over other metrics (Table 5). Adding the question (ii) further improves the classification accuracy, possibly due to the need of disambiguating the relevance of the answer. For example, in line 6 of Table 1 both answers with or without the word “teachers” are equivalent since the context is clear from the question. If the question was about schools the two answers would not be equivalent.
Finally, adding the context (iii) degrades the performance compared to (ii). We hypothesize that this is for three reasons: First, the number of training examples where the context contains pertinent information is insufficient to be used productively in our dataset.777Only around 2-3% of examples require a closer assessment of the context to make an accurate AE assessment, measured by (the authors) inspecting random examples. Second, cases that require assessment of the context are harder examples, both for the model, and for humans, which may lead to less consistent annotations and add noise during the learning process. Third, the context is the longest part of the input and may contain many irrelevant parts. We leave further exploration to future research and use variant (ii) in the following.
4.1.2 Accuracy of BEM predictions
Table 4 shows that our BEM model achieves high accuracy and correlation on the task of predicting the human equivalence ratings, significantly improving over the baselines. The gain in accuracy is consistent across the choice of QA system as shown in Table 5. We include BERTScore (Zhang et al., 2020), Bleurt Sellam et al. (2020b), and LERC Chen et al. (2020) as additional baselines.888BERTScore uses the published uncased BERT-Base model.
| Metric (%) | AE Dev | AE Test | ||
| Acc | Acc | |||
| EM | 54.00 | – | 54.69 | – |
| F1 | 75.57 | 72.43 | 75.95 | 69.07 |
| F1 (tuned) | 84.39 | 72.43 | 82.93 | 69.07 |
| BertScore | 73.55 | 57.08 | 70.27 | 52.40 |
| BertScore (tuned) | 73.80 | 57.08 | 70.87 | 52.40 |
| Bleurt 2.0 | 72.02 | 66.59 | 73.02 | 63.65 |
| LERC (tuned) | 81.96 | 71.27 | 80.74 | 67.81 |
| BEM | 89.38 | 79.92 | 89.66 | 79.09 |
| BEM (tuned) | 89.99 | 79.92 | 89.84 | 79.09 |
| BEM (symmetrized) | 86.95 | 72.27 | 84.56 | 71.57 |
To compute accuracy we either threshold at or tune a threshold such that accuracy on the train set is optimal.
| Metric | Accuracy, predictions from | ||
| BiDAF | XLNet | Luke | |
| EM | 61.23 | 44.26 | 41.07 |
| F1 | 79.26 | 77.33 | 74.64 |
| BERTScore | 69.06 | 74.47 | 73.83 |
| BEM | 88.83 | 90.70 | 89.48 |
4.2 AE for QA performance evaluation
As previously discussed, accurately assessing the performance of QA models is a significant challenge. Even in the presence of multiple gold answers and predefined normalization rules, models might output correct answers outside of the annotated answer bank. Thus EM provides a pessimistic lower bound on the true accuracy, and AE metrics can provide a more realistic assessment.
| Metric | BiDAF | XLNet | Luke |
| EM | |||
| F1 | |||
| BEM | |||
| Human |
In order to evaluate the validity of the approximate metrics, we compute the accuracy of three representative models according to each equivalence metric against the SQuAD gold answer set. In addition, we use AE annotations to measure the true model performance. As Table 6 shows, indeed the EM is significantly lower than the true accuracy. F1 provides a slightly more optimistic evaluation, though still below the true score in about 2-3 points. The learned BEM-based accuracy computation is closest to the true performance of the model.
Next we show that the learned metric is much more robust with respect to the number of available references (Table 7). At the time of writing, Luke (rank 1) outperforms XLNet (rank 2) on the the SQuAD 1.1 leaderboard. However, if only one gold reference was available, a higher degree of accuracy would be needed to distinguish them with F1 compared to the learned metric. Even with just a single reference, BEM is much closer to the human judgment shown in Table 6.
| Metric | BEM | |||
| # References | 1 | all | 1 | all |
| BiDAF | 73.31 | 80.79 (+7.48) | 80.43 | 84.60 (+4.17) |
| XLNet | 86.63 | 94.15 (+7.52) | 92.13 | 96.00 (+3.87) |
| Luke | 87.30 | 94.99 ( +7.69) | 92.98 | 97.03 (+4.05) |
To assess how well BEM generalizes to more challenging tasks, we run a baseline system on NQ-Open (Lee et al., 2019) consisting of a BM25-based retriever and a BERT-based extractive reader. We sample 300 predictions from the dev set, ignoring exact matches. In 87% of these examples we find our manual independent assessment to agree with BEM. This is evidence, that BEM does not just generalize well from Albert answers to other models on SQuAD, but also to other more difficult datasets and QA settings such as open-domain.
5 Example application: Returning small and accurate prediction sets
Beyond the value of accurate performance assessment, identifying when the model answers are right can provide immediate practical gains. We demonstrate this on the common setting of constructing prediction sets (e.g., the top- model’s predictions). Here, the accuracy is measured by whether a correct answer is included in the predicted set. The size of the set () is typically calibrated on an evaluation set, to the desired accuracy. Reliably identifying high-ranking correct answers allows us to effectively reduce the size of the sets (smaller ) while keeping them accurate.
Here, we use the conformal prediction (CP) framework (Fisch et al., 2022; Shafer and Vovk, 2007) to construct provably accurate prediction sets. Unlike top-, CP set size is dynamically determined per input with instance-wise hypothesis testing to marginally satisfy the user-specified target accuracy. Specifically, given an exchangeable calibration set of pairs of questions and correct answers, we measure their nonconformity scores (here, the negative predicted probability). Then, for a new question, CP returns a set of candidate answers by including all answers with nonconformity scores smaller than the inflated Quantile of the calibration scores, where is the target accuracy.
While CP was originally defined for a single label per input, Fisch et al. (2021) recently presented expanded admission CP to support multiple answers. This extension allows leveraging an answer equivalence function to reduce the size of the CP sets while preserving the accuracy guarantee.
| Admission | Target accuracy | ||||
| function | 99% | 95% | 90% | 80% | 70% |
| Exact admission (human annotations): | |||||
| SQuAD labels | 20.00 | 18.16 | 11.31 | 5.31 | 3.28 |
| + AE labels | 17.29 | 8.41 | 4.31 | 2.02 | 1.37 |
| Approximate admission (by model’s AE predictions): | |||||
| F1 | 20.00 | 13.92 | 6.86 | 2.97 | 1.99 |
| BEM | 17.69 | 8.74 | 4.26 | 2.16 | 1.51 |
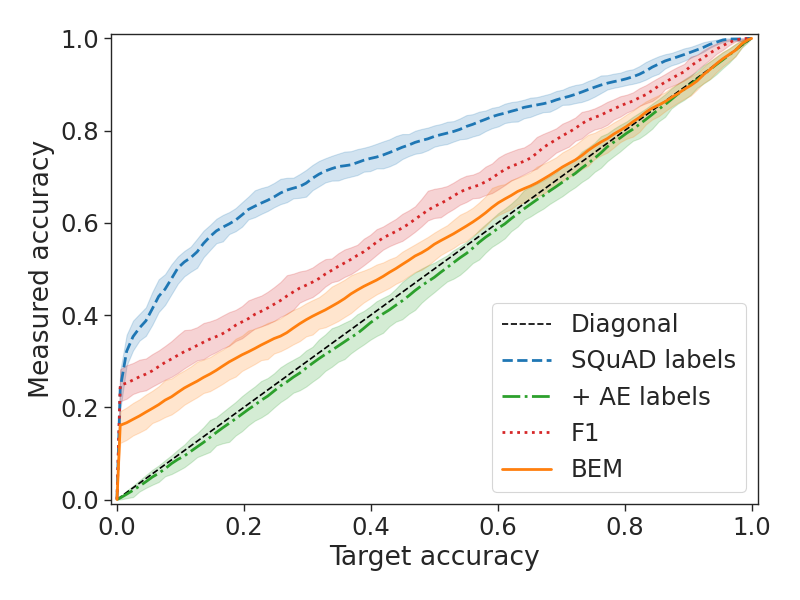
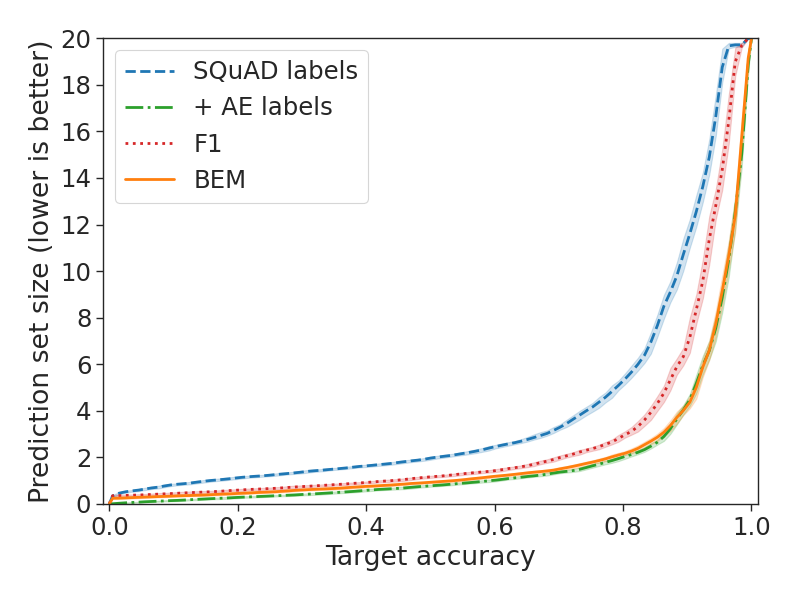
We follow the setting of Fisch et al. (2021) and use the collected AE labels to construct accurate CP sets for SQuAD 1.1 with Luke’s scores. As Table 8 shows, this leads to significantly smaller sets, sometimes less than half the size. For example, to achieve 90% accuracy, calibrating with SQuAD labels results in an average of 11.31 answers per question. Expanding the admission to include AE labels reduces this size to only 4.31 answers.
Fisch et al. (2021) also discuss the use of an approximate admission function (see their appendix B). This setting is useful for when high-quality annotations for calibration are missing. We evaluate this here and experiment with using either F1 or BEM AE predictions. As Table 8 indicates, we find BEM to be as effective as the AE evaluation labels for reducing the number of required answers per target accuracy level.
6 Related Work
Answer equivalence.
Most similar to our work, Risch et al. (2021) annotate 1k answer pairs from the SQuAD gold answers with a similarity score and train a model that classifies the concatenated strings. They focus on the symmetric string-similarity problem whereas we aim for asymmetric equivalence conditioned on the answer.
Another similar effort is the MOCHA dataset Chen et al. (2020). The authors also collect annotations on answer candidates and train a learned metric. However, they focus on generative question answering. Moreover, their methods for collecting candidate answers, the selection of datasets and the rating task differ considerably from our work.
Chen et al. (2021) use natural language inference to verify predictions from QA systems by converting question and answer into a statement. They use this to improve predictions in a setting where no gold answer is known, but one could potentially employ similar methods to compare a predicted answer to a gold answer.
Text similarity.
To our knowledge, Breck et al. (1999) first used Token F1 for automatic evaluation of their “Sys called Qanda”. Chen et al. (2019) find that is a reasonable metric for extractive QA tasks but fails to account for the higher variability of surface form in generative QA.
Besides Token F1 and Exact Match, other popular metrics for text comparison have been tried for question answering, but are not widely in use: BLEU Papineni et al. (2002), Rouge Lin (2004) and METEOR Banerjee and Lavie (2005).
Yang et al. (2018) identify the need for methods that go beyond lexical overlap, trying to adapt ROUGE and BLEU to better fit answer comparison, but focusing on just “yes-no” and “entity” questions. Using a different approach, Si et al. (2021) propose to expand entities in gold answers with aliases from Freebase Bollacker et al. (2008) to improve exact match reliability.
A good overview of different string distance metrics, in the context of name-matching tasks, can be found in Cohen et al. (2003). Metrics based on the Wasserstein distance have also been proposed Kusner et al. (2015); Clark et al. (2019).
In addition to automatic metrics, the NeurIPS 2020 EfficientQA Competition (Min et al., 2020a) uses manual annotations to reward correct answers not contained in the gold answers. In contrast, we focus on only rewarding answers that are equivalent to one of the gold answers.
Learned metrics.
Recently string based metrics have been replaced by learned metrics for various Natural Langauge Generation (NLG) tasks. Examples include BLEURT (Sellam et al., 2020a) and COMET (Rei et al., 2020) for machine translation evaluation, which Kocmi et al. (2021) find to correlate better with human judgments than e.g. the popular BLEU metric (Papineni et al., 2002).
7 Conclusion
We present a systematic data-driven analysis of the shortcomings of token-level measures, EM and F1, for evaluating QA systems against a set of reference answers.
We design an answer equivalence (AE) task that directly captures the desired relation between candidate and reference answer. Also, we collect a large number of annotations for both evaluating and training equivalence models, as well as quantitatively assessing the performance of QA systems.
Beyond relying on human AE annotations for evaluation, we trained a BERT matching (BEM) model and showed that it generalized well to new QA models and evaluation questions. Specifically, BEM allowed a significantly better performance assessment for the QA systems compared to the token-level or other similarity measures. We also demonstrated the value of AE on a practical application beyond QA performance assessment.
We hope releasing our data will contribute to further development of better metrics and improve the evaluation and usability of QA systems.
Acknowledgments
We thank Adam Fisch for helpful feedback on the conformal prediction experiments, and Costanza Conforti for helping us to add the dataset to TFDS.
Ethical Considerations
As our work involves human participants, we point out that all annotators provided informed consent and no personally identifiable information (pii) was collected or will be released. The collected data has been vetted for presence of pii as well as offensive language through heuristics and random sampling.
The annotators received fair compensation with respect to local markets, but said compensation was not tied to speed or accuracy to prevent distorting the motivation. Intrinsic motivation has been shown to produce higher quality results Gneezy and Rustichini (2000).
The released data and the experiments we conducted are in English, therefore we do not claim generalization of our findings across languages. However, we believe that the proposed methods could be applied in other languages using other available corpora as sources.
Limitations
Our current work has several limitations that we hope will inspire future research and extensions to our framework.
One limitation is our focus on short answers, which is in line with much of the current QA research. Some datasets (e.g., Natural Questions) have introduced long answers. Our setting would not be directly applicable there, as equivalence between long answers could be harder to determine. However, BEM could be a building block in a more complex aggregated comparison (e.g., “summarizing” the long answer with a machine reading model and comparing the “summaries”).
A further limitation, that is discussed in more detail in Section 4.1.1, is our final BEM is not using the context available for determining equivalence. This is an advantage as it allows BEM to be readily extended to settings where context is unavailable. On the other hand, we expect AE on certain QA domains to perform better with context, and encourage future research to explore when context is useful.
The research was done on English language datasets (SQuAD, Natural Questions), but the same methodology for data collection and model training should extend to other languages given the existance of high-quality QA datasets for the languages in question. A further limitation may be multi-lingual answers. Translation alone may not be enough to establish equivalence, given potential subtle differences in semantics between languages.
Also, our main experiments focus on machine reading models. In Section 4.2 we discuss extensions to NQ-Open and show promising initial results.
A more specific challenge regarding Open QA is the use of generative models for QA. Here the generative model may add more specific details (e.g., a middle name, or a more precise date) that is not supported by the available context and may potentially include false hallucinations. Since our model has been trained only with extracted answers, we saw in a small experiment that it will generally accept these more specific answers as equivalent answers. Note that this is also a more general challenge when annotating answers for QA datasets and not only for answer equivalence—possibly requiring specific background knowledge and/or extra time/resources when verifying an answer.
Our approach does not directly address the (potential) temporal or spatial dimension of questions/answers. While our definition allows us to handle answers that vary by time/location, in rare cases the equivalence of an answer may depend on the time/location it is given. For example, the two answers “February 2022” and “4 months ago” to the question “When were the last Olympics?” would only be equivalent in June 2022. This is a limitation of the QA setting, and could be solved by recording the exact date/time and location of the annotation and adding it to the context.
Lastly, some more specific question answering tasks are out of scope for us and left for future work. For example, conversational question answering (e.g., CoQA) may need different processing of questions and context.
References
- Angelopoulos and Bates (2021) Anastasios N. Angelopoulos and Stephen Bates. 2021. A gentle introduction to conformal prediction and distribution-free uncertainty quantification.
- Banerjee and Lavie (2005) Satanjeev Banerjee and Alon Lavie. 2005. METEOR: An automatic metric for MT evaluation with improved correlation with human judgments. In Proceedings of the ACL Workshop on Intrinsic and Extrinsic Evaluation Measures for Machine Translation and/or Summarization, pages 65–72, Ann Arbor, Michigan. Association for Computational Linguistics.
- Bates et al. (2021) Stephen Bates, Anastasios Angelopoulos, Lihua Lei, Jitendra Malik, and Michael Jordan. 2021. Distribution-free, risk-controlling prediction sets. Journal of the ACM (JACM), 68(6):1–34.
- Bollacker et al. (2008) Kurt Bollacker, Colin Evans, Praveen Paritosh, Tim Sturge, and Jamie Taylor. 2008. Freebase: A collaboratively created graph database for structuring human knowledge. In Proceedings of the 2008 ACM SIGMOD International Conference on Management of Data, SIGMOD ’08, page 1247–1250, New York, NY, USA. Association for Computing Machinery.
- Breck et al. (1999) Eric Breck, John Burger, Lisa Ferro, David House, Marc Light, and Inderjeet Mani. 1999. A sys called qanda. In Proceedings of The Eighth Text REtrieval Conference.
- Chen et al. (2019) Anthony Chen, Gabriel Stanovsky, Sameer Singh, and Matt Gardner. 2019. Evaluating question answering evaluation. In Proceedings of the 2nd Workshop on Machine Reading for Question Answering, pages 119–124, Hong Kong, China. Association for Computational Linguistics.
- Chen et al. (2020) Anthony Chen, Gabriel Stanovsky, Sameer Singh, and Matt Gardner. 2020. MOCHA: A dataset for training and evaluating generative reading comprehension metrics. In Proceedings of the 2020 Conference on Empirical Methods in Natural Language Processing, EMNLP 2020, Online, November 16-20, 2020, pages 6521–6532. Association for Computational Linguistics.
- Chen et al. (2021) Jifan Chen, Eunsol Choi, and Greg Durrett. 2021. Can NLI models verify QA systems’ predictions? In Findings of the Association for Computational Linguistics: EMNLP 2021, pages 3841–3854, Punta Cana, Dominican Republic. Association for Computational Linguistics.
- Clark et al. (2019) Elizabeth Clark, Asli Celikyilmaz, and Noah A. Smith. 2019. Sentence mover’s similarity: Automatic evaluation for multi-sentence texts. In Proceedings of the 57th Annual Meeting of the Association for Computational Linguistics, pages 2748–2760, Florence, Italy. Association for Computational Linguistics.
- Cohen et al. (2003) William W. Cohen, Pradeep Ravikumar, and Stephen E. Fienberg. 2003. A comparison of string distance metrics for name-matching tasks. In IIWeb.
- Devlin et al. (2019) Jacob Devlin, Ming-Wei Chang, Kenton Lee, and Kristina Toutanova. 2019. BERT: Pre-training of deep bidirectional transformers for language understanding. In Proceedings of the 2019 Conference of the North American Chapter of the Association for Computational Linguistics: Human Language Technologies, Volume 1 (Long and Short Papers), pages 4171–4186, Minneapolis, Minnesota. Association for Computational Linguistics.
- Elazar and Goldberg (2019) Yanai Elazar and Yoav Goldberg. 2019. Where’s My Head? Definition, Data Set, and Models for Numeric Fused-Head Identification and Resolution. Transactions of the Association for Computational Linguistics, 7:519–535.
- Eyal et al. (2019) Matan Eyal, Tal Baumel, and Michael Elhadad. 2019. Question answering as an automatic evaluation metric for news article summarization. In Proceedings of the 2019 Conference of the North American Chapter of the Association for Computational Linguistics: Human Language Technologies, Volume 1 (Long and Short Papers), pages 3938–3948, Minneapolis, Minnesota. Association for Computational Linguistics.
- Fabbri et al. (2021) Alexander R. Fabbri, Chien-Sheng Wu, Wenhao Liu, and Caiming Xiong. 2021. Qafacteval: Improved qa-based factual consistency evaluation for summarization. CoRR, abs/2112.08542.
- Fisch et al. (2022) Adam Fisch, Robin Jia, and Tal Schuster. 2022. Uncertainty estimation for natural language processing. In COLING.
- Fisch et al. (2021) Adam Fisch, Tal Schuster, Tommi S. Jaakkola, and Regina Barzilay. 2021. Efficient conformal prediction via cascaded inference with expanded admission. In International Conference on Learning Representations.
- Gehrmann et al. (2021) Sebastian Gehrmann, Tosin Adewumi, Karmanya Aggarwal, Pawan Sasanka Ammanamanchi, Aremu Anuoluwapo, Antoine Bosselut, Khyathi Raghavi Chandu, Miruna Clinciu, Dipanjan Das, Kaustubh D. Dhole, Wanyu Du, Esin Durmus, Ondřej Dušek, Chris Emezue, Varun Gangal, Cristina Garbacea, Tatsunori Hashimoto, Yufang Hou, Yacine Jernite, Harsh Jhamtani, Yangfeng Ji, Shailza Jolly, Mihir Kale, Dhruv Kumar, Faisal Ladhak, Aman Madaan, Mounica Maddela, Khyati Mahajan, Saad Mahamood, Bodhisattwa Prasad Majumder, Pedro Henrique Martins, Angelina McMillan-Major, Simon Mille, Emiel van Miltenburg, Moin Nadeem, Shashi Narayan, Vitaly Nikolaev, Rubungo Andre Niyongabo, Salomey Osei, Ankur Parikh, Laura Perez-Beltrachini, Niranjan Ramesh Rao, Vikas Raunak, Juan Diego Rodriguez, Sashank Santhanam, João Sedoc, Thibault Sellam, Samira Shaikh, Anastasia Shimorina, Marco Antonio Sobrevilla Cabezudo, Hendrik Strobelt, Nishant Subramani, Wei Xu, Diyi Yang, Akhila Yerukola, and Jiawei Zhou. 2021. The gem benchmark: Natural language generation, its evaluation and metrics.
- Gneezy and Rustichini (2000) Uri Gneezy and Aldo Rustichini. 2000. Pay enough or don’t pay at all. The Quarterly Journal of Economics, 115(3):791–810.
- Honovich et al. (2022) Or Honovich, Roee Aharoni, Jonathan Herzig, Hagai Taitelbaum, Doron Kukliansy, Vered Cohen, Thomas Scialom, Idan Szpektor, Avinatan Hassidim, and Yossi Matias. 2022. TRUE: Re-evaluating factual consistency evaluation. In Proceedings of the 2022 Conference of the North American Chapter of the Association for Computational Linguistics: Human Language Technologies, pages 3905–3920, Seattle, United States. Association for Computational Linguistics.
- Honovich et al. (2021) Or Honovich, Leshem Choshen, Roee Aharoni, Ella Neeman, Idan Szpektor, and Omri Abend. 2021. : Evaluating factual consistency in knowledge-grounded dialogues via question generation and question answering. In Proceedings of the 2021 Conference on Empirical Methods in Natural Language Processing, pages 7856–7870, Online and Punta Cana, Dominican Republic. Association for Computational Linguistics.
- Kocmi et al. (2021) Tom Kocmi, Christian Federmann, Roman Grundkiewicz, Marcin Junczys-Dowmunt, Hitokazu Matsushita, and Arul Menezes. 2021. To ship or not to ship: An extensive evaluation of automatic metrics for machine translation.
- Krippendorff (2004) Klaus Krippendorff. 2004. Content Analysis: An Introduction to Its Methodology (second edition). Sage Publications.
- Kusner et al. (2015) Matt J Kusner, Yu Sun, Nicholas I Kolkin, and Kilian Q Weinberger. 2015. From word embeddings to document distances. In Proceedings of the 32nd International Conference on International Conference on Machine Learning - Volume 37, ICML’15, pages 957–966. JMLR.org.
- Lan et al. (2019) Zhenzhong Lan, Mingda Chen, Sebastian Goodman, Kevin Gimpel, Piyush Sharma, and Radu Soricut. 2019. ALBERT: A lite BERT for self-supervised learning of language representations. CoRR, abs/1909.11942.
- Lee et al. (2019) Kenton Lee, Ming-Wei Chang, and Kristina Toutanova. 2019. Latent retrieval for weakly supervised open domain question answering. In Proceedings of the 57th Annual Meeting of the Association for Computational Linguistics, pages 6086–6096, Florence, Italy. Association for Computational Linguistics.
- Lin (2004) Chin-Yew Lin. 2004. ROUGE: A package for automatic evaluation of summaries. In Text Summarization Branches Out, pages 74–81, Barcelona, Spain. Association for Computational Linguistics.
- Min et al. (2020a) Sewon Min, Jordan L. Boyd-Graber, Chris Alberti, Danqi Chen, Eunsol Choi, Michael Collins, Kelvin Guu, Hannaneh Hajishirzi, Kenton Lee, Jennimaria Palomaki, Colin Raffel, Adam Roberts, Tom Kwiatkowski, Patrick S. H. Lewis, Yuxiang Wu, Heinrich Küttler, Linqing Liu, Pasquale Minervini, Pontus Stenetorp, Sebastian Riedel, Sohee Yang, Minjoon Seo, Gautier Izacard, Fabio Petroni, Lucas Hosseini, Nicola De Cao, Edouard Grave, Ikuya Yamada, Sonse Shimaoka, Masatoshi Suzuki, Shumpei Miyawaki, Shun Sato, Ryo Takahashi, Jun Suzuki, Martin Fajcik, Martin Docekal, Karel Ondrej, Pavel Smrz, Hao Cheng, Yelong Shen, Xiaodong Liu, Pengcheng He, Weizhu Chen, Jianfeng Gao, Barlas Oguz, Xilun Chen, Vladimir Karpukhin, Stan Peshterliev, Dmytro Okhonko, Michael Sejr Schlichtkrull, Sonal Gupta, Yashar Mehdad, and Wen-tau Yih. 2020a. Neurips 2020 efficientqa competition: Systems, analyses and lessons learned. In NeurIPS 2020 Competition and Demonstration Track, 6-12 December 2020, Virtual Event / Vancouver, BC, Canada, volume 133 of Proceedings of Machine Learning Research, pages 86–111. PMLR.
- Min et al. (2020b) Sewon Min, Julian Michael, Hannaneh Hajishirzi, and Luke Zettlemoyer. 2020b. Ambigqa: Answering ambiguous open-domain questions. CoRR, abs/2004.10645.
- Papineni et al. (2002) Kishore Papineni, Salim Roukos, Todd Ward, and Wei-Jing Zhu. 2002. Bleu: A method for automatic evaluation of machine translation. In Proceedings of the 40th Annual Meeting on Association for Computational Linguistics, ACL ’02, page 311–318, USA. Association for Computational Linguistics.
- Rajpurkar et al. (2016) Pranav Rajpurkar, Jian Zhang, Konstantin Lopyrev, and Percy Liang. 2016. SQuAD: 100,000+ questions for machine comprehension of text. In Proceedings of the 2016 Conference on Empirical Methods in Natural Language Processing, pages 2383–2392, Austin, Texas. Association for Computational Linguistics.
- Rei et al. (2020) Ricardo Rei, Craig Stewart, Ana C Farinha, and Alon Lavie. 2020. COMET: A neural framework for MT evaluation. In Proceedings of the 2020 Conference on Empirical Methods in Natural Language Processing (EMNLP), pages 2685–2702, Online. Association for Computational Linguistics.
- Risch et al. (2021) Julian Risch, Timo Möller, Julian Gutsch, and Malte Pietsch. 2021. Semantic answer similarity for evaluating question answering models.
- Schuster et al. (2021a) Tal Schuster, Adam Fisch, and Regina Barzilay. 2021a. Get your vitamin C! robust fact verification with contrastive evidence. In Proceedings of the 2021 Conference of the North American Chapter of the Association for Computational Linguistics: Human Language Technologies, pages 624–643, Online. Association for Computational Linguistics.
- Schuster et al. (2022) Tal Schuster, Adam Fisch, Jai Gupta, Mostafa Dehghani, Dara Bahri, Vinh Quang Tran, Yi Tay, and Donald Metzler. 2022. Confident adaptive language modeling. In Advances in Neural Information Processing Systems (NeurIPS).
- Schuster et al. (2021b) Tal Schuster, Adam Fisch, Tommi Jaakkola, and Regina Barzilay. 2021b. Consistent accelerated inference via confident adaptive transformers. In Proceedings of the 2021 Conference on Empirical Methods in Natural Language Processing, pages 4962–4979, Online and Punta Cana, Dominican Republic. Association for Computational Linguistics.
- Sellam et al. (2020a) Thibault Sellam, Dipanjan Das, and Ankur Parikh. 2020a. BLEURT: Learning robust metrics for text generation. In Proceedings of the 58th Annual Meeting of the Association for Computational Linguistics, pages 7881–7892, Online. Association for Computational Linguistics.
- Sellam et al. (2020b) Thibault Sellam, Amy Pu, Hyung Won Chung, Sebastian Gehrmann, Qijun Tan, Markus Freitag, Dipanjan Das, and Ankur Parikh. 2020b. Learning to evaluate translation beyond English: BLEURT submissions to the WMT metrics 2020 shared task. In Proceedings of the Fifth Conference on Machine Translation, pages 921–927, Online. Association for Computational Linguistics.
- Seo et al. (2016) Min Joon Seo, Aniruddha Kembhavi, Ali Farhadi, and Hannaneh Hajishirzi. 2016. Bidirectional attention flow for machine comprehension. CoRR, abs/1611.01603.
- Shafer and Vovk (2007) Glenn Shafer and Vladimir Vovk. 2007. A tutorial on conformal prediction. CoRR, abs/0706.3188.
- Si et al. (2021) Chenglei Si, Chen Zhao, and Jordan Boyd-Graber. 2021. What’s in a name? answer equivalence for open-domain question answering. In Empirical Methods in Natural Language Processing.
- Voorhees and Tice (2000) Ellen M. Voorhees and Dawn M. Tice. 2000. Building a question answering test collection. In SIGIR 2000: Proceedings of the 23rd Annual International ACM SIGIR Conference on Research and Development in Information Retrieval, July 24-28, 2000, Athens, Greece, pages 200–207. ACM.
- Vovk et al. (2005) Vladimir Vovk, Alex Gammerman, and Glenn Shafer. 2005. Algorithmic Learning in a Random World. Springer-Verlag, Berlin, Heidelberg.
- Weston et al. (2015) Jason Weston, Antoine Bordes, Sumit Chopra, Alexander M. Rush, Bart van Merriënboer, Armand Joulin, and Tomas Mikolov. 2015. Towards ai-complete question answering: A set of prerequisite toy tasks. CoRR.
- Yamada et al. (2020) Ikuya Yamada, Akari Asai, Hiroyuki Shindo, Hideaki Takeda, and Yuji Matsumoto. 2020. LUKE: deep contextualized entity representations with entity-aware self-attention. In Proceedings of the 2020 Conference on Empirical Methods in Natural Language Processing, EMNLP 2020, Online, November 16-20, 2020, pages 6442–6454. Association for Computational Linguistics.
- Yang et al. (2018) An Yang, Kai Liu, Jing Liu, Yajuan Lyu, and Sujian Li. 2018. Adaptations of ROUGE and BLEU to better evaluate machine reading comprehension task. In Proceedings of the Workshop on Machine Reading for Question Answering, pages 98–104, Melbourne, Australia. Association for Computational Linguistics.
- Yang et al. (2019) Zhilin Yang, Zihang Dai, Yiming Yang, Jaime Carbonell, Russ R Salakhutdinov, and Quoc V Le. 2019. Xlnet: Generalized autoregressive pretraining for language understanding. In Advances in Neural Information Processing Systems, volume 32. Curran Associates, Inc.
- Zhang et al. (2020) Tianyi Zhang, Varsha Kishore, Felix Wu, Kilian Q. Weinberger, and Yoav Artzi. 2020. Bertscore: Evaluating text generation with BERT. In 8th International Conference on Learning Representations, ICLR 2020, Addis Ababa, Ethiopia, April 26-30, 2020.
Appendix
| Metric | Threshold | AE Dev | AE Test |
| F1 | 0.2 | 85.06 | 82.47 |
| LERC | 2.52 | 81.97 | 80.74 |
| BEM | 0.56 | 89.99 | 89.80 |
Appendix A Additional dataset statistics
| Count | XLNet | BiDAF | Luke | Total |
| Non-exact matches | 1,205 | 3,000 | 1,082 | 4,369 |
| AE-examples | 2,448 | 5,655 | 2,240 | 8,565 |
| Ratings | 7,932 | 7,522 | 4,590 | 14,170 |
| % | BiDAF | XLNet | Luke |
| Equivalent candidates | |||
| Equivalent AE-examples | |||
| Equivalent ratings |
Appendix B BEM training details
For BEM training we finetune the published BERT-Base (uncased, 12-layer, 768-hidden, 12-heads, 110M parameters) checkpoint on the training examples for one epoch, using a JAX-based BERT implementation. We use a batch size of 64 and a learning rate of 1e-4 with the Adam optimizer. We did not perform a search for optimal hyperparameters. The training on a TPU v2 takes less than 5 minutes.
Appendix C Conformal prediction sets experimentation details
The experiments in section 5 use the Conformal Prediction (CP) framework (Angelopoulos and Bates, 2021; Fisch et al., 2022; Vovk et al., 2005). While recent work found CP to be useful in many practical applications such as medical image segmentation (Bates et al., 2021) and adaptive computation Transformers (Schuster et al., 2021b, 2022), one of CP challenges is in reducing the size of the prediction sets while maintaining the compelling accuracy guarantees. In this work, we follow the expanded admission CP extension of Fisch et al. (2021) that leverages the existence of equally correct answers to improve the statistical efficiency of the calibration. We refer the reader to Fisch et al. (2021) for the description and theoretical analysis of the method, and detail the exact setting below.
We use the top 20 predictions of the Luke model on SQuAD as candidate answers per question and use the conformal-cascades repository for running the calibration experiments.999https://github.com/ajfisch/conformal-cascades We only utilize the expanded admission functionality of the code, and don’t use a cascade here as we directly use the negative span score from Luke as the nonconformity measure. We run 50 calibration trials and report the average results, as well as visualize the 16 and 84th percentiles in Figure 2. In each trial, we randomly partition the data into 80% calibration and 20% test examples. Reference results for different target accuries are provided in Table 8.
CP prediction sets are computed as a function of the calibration examples and a user defined target accuracy. Following Fisch et al. (2021) we empirically verify the validity of the sets (i.e., marginally meeting the target accuracy), and measure the size of the sets. The goal is to minimize the size of the prediction sets while satisfying validity. Our experiments evaluate different equivalence terms for the admission expansion function.
For exact expanded admission, we experiment with either using the original SQuAD labels, or including our AE annotations. For approximate expanded admission, we try both F1 and our BEM equivalence metrics. We follow the method in Appendix B of Fisch et al. (2021) to statistically correct for the approximation errors of the metrics. We use only 10% of the calibration data to compute the empirical FPR of the metric (i.e., the ratio that the top answer that was accepted by the metric was incorrect). We assume that the rest of the calibration data is lacking AE labels, hence the need for the approximation. We use binomial confidence intervals to get an upper bound of the true error, resulting in a two-level probabilistic guarantee.101010We use scipy.special.betaincinv to compute the bound with . Then, we apply the correction by dividing the p-value of each candidate by the lower bound of the TPR.