A Census of X-ray Millisecond Pulsars in Globular Clusters
Abstract
We present a comprehensive census of X-ray millisecond pulsars (MSPs) in 29 Galactic globular clusters (GCs), including 68 MSPs with confirmed X-ray luminosities and 107 MSPs with X-ray upper limits. We compile previous X-ray studies of GC MSPs, and add new analyses of six MSPs (PSRs J13264728A, J13264728B, J15180204C, J17174308A, J17370314A, and J18072459A) discovered in five GCs. Their X-ray spectra are well described by a single blackbody model, a single power-law model, or a combination of them, with X-ray luminosities ranging from 1.91030 erg s-1 to 8.31031 erg s-1. We find that most detected X-ray MSPs have luminosities between erg s-1 to erg s-1. Redback pulsars are a relatively bright MSP population with X-ray luminosities of – erg s-1. Black widows show a bi-modal distribution in X-ray luminosities, with eclipsing black widows between and erg s-1, while the two confirmed non-eclipsing black widows are much fainter, with of erg s-1, suggesting an intrinsic difference in the populations. We estimate the total number of MSPs in 36 GCs by considering the correlation between the number of MSPs and stellar encounter rate in GCs, and suggest that between 600–1500 MSPs exist in these 36 GCs. Finally, we estimate the number of X-ray detectable MSPs in the Galactic bulge, finding that 1–86 MSPs with erg s-1, and 20–900 MSPs with erg s-1, should be detectable there.
keywords:
stars: neutron – pulsars: general – globular clusters: general – globular clusters: individual: NGC 5139 – X-rays: stars1 Introduction
Galactic globular clusters (GCs) are ideal birthplaces for low-mass X-ray binaries (LMXBs), since the high stellar densities in GC cores provide significant chances for stellar interactions, such as tidal capture and exchange interactions (see e.g., Fabian et al., 1975; Hills, 1976). LMXBs are the progenitors of millisecond pulsars (MSPs), where the neutron star (NS) is spun up by accreting mass and angular momentum from its companion to a period of a few milliseconds (Alpar et al., 1982; Bhattacharya & van den Heuvel, 1991; Papitto et al., 2013). Therefore, it is not surprising that GCs show an overabundance of MSPs compared to the Galactic field, and many MSPs exist in binary systems.
Rotation-powered MSPs are rapidly and stably spinning pulsars, with spin periods ms and spin-down rates , with lifetimes of Gyrs. Apart from isolated MSPs, MSPs in binaries can be further categorized according to the degeneracy of the companion star. Those MSPs coupled with non-degenerate companion stars are usually referred to as ‘spider’ MSPs, and based on the companion masses, they are further grouped as redbacks ( M☉, hereafter RBs) and black widows ( M☉, hereafter BWs), respectively. In addition, it is common that Eclipses of the radio emission commonly occur in observations of spider pulsars, which can be explained as the radio emission from the MSP being absorbed and/or scattered by the plasma produced at the collision between the relativistic pulsar wind and material from the companion (Fruchter & Goss, 1992; Thompson et al., 1994; Stappers et al., 2001; Polzin et al., 2018; Zhao et al., 2020a). On the other hand, the companion stars of MSPs may also be compact objects, and particularly white dwarfs (WDs) are the most common companions among these MSP binaries (e.g. Lorimer, 2008).
MSPs are generally faint X-ray sources, with typical luminosities of erg s-1. The X-rays from MSPs commonly are observed with blackbody-like spectra (e.g. Zavlin et al., 2002; Bogdanov et al., 2006), indicating a thermal emission origin likely produced from the hotspots at the NS magnetic poles, heated by the returning particles accelerated in the pulsar magnetosphere (Harding & Muslimov, 2002). Broad, sinusoidal X-ray pulsations can be observed from nearby MSPs showing thermal emission, providing evidence for the hotspots/polar cap hypothesis (see, e.g. Guillot et al., 2019). A few MSPs are relatively X-ray-bright with erg s-1, up to erg s-1, and their X-ray emission usually shows non-thermal properties (e.g. power-law spectra). For instance, the most luminous X-ray MSP in GCs found to date is PSR B182124 in M28, with erg s-1 (0.3–8 keV, Saito et al., 1997; Becker et al., 2003; Bogdanov et al., 2011). Moreover, the X-ray pulsations from this MSP were clearly observed in two narrow pulses (Saito et al., 1997; Rutledge et al., 2004), implying highly beamed non-thermal emission originating from the pulsar magnetosphere. The other type of non-thermal X-ray emission from MSPs, i.e. non-pulsed non-thermal emission, is typically detected from spider pulsars, and believed to be produced by relativistic intra-binary shocks as a result of collisions between the pulsar wind and a matter outflow from the companion (e.g. Arons & Tavani, 1993; Wadiasingh et al., 2018; Kandel et al., 2019). Alternatively, a pulsar wind nebula or bow shock could also produce non-thermal X-ray emission (e.g. Stappers et al., 2003; Romani et al., 2017), although pulsar wind nebulae are unlikely to be detectable (i.e. erg/s) for the spindown powers typical ( erg/s) of GC MSPs (Kargaltsev & Pavlov 2010 show the relation between pulsar wind nebula and ). Bow shocks are unlikely to produce significant X-ray emission for MSPs in GCs, due to the low gas content of GCs (Freire et al., 2001b) and the low space velocities of MSPs in GCs.
X-ray studies of GC MSPs have been presented for a few GCs, especially pulsar-rich clusters such as 47 Tuc (Bogdanov et al., 2006), NGC 6397 (Bogdanov et al., 2010), M28 (Bogdanov et al., 2011), NGC 6752 (Forestell et al., 2014), and recently on Terzan 5 (Bogdanov et al., 2021), M62 (Oh et al., 2020) and M13 (Zhao et al., 2021), as well as for several individual MSPs in globular clusters (e.g. Bassa et al., 2004; Amato et al., 2019). These studies provide opportunities to statistically investigate the X-ray properties of GC MSPs. However, different groups may apply different energy bands for spectral fitting and analysis, making it difficult to study those GC MSPs together directly. Possenti et al. (2002) used a sample of 39 pulsars, including both MSPs and normal pulsars in GCs and the Galactic field, to re-examine the correlation between X-ray and spin-down luminosities, where they converted all the fluxes to 2–10 keV. Recently, Lee et al. (2018) focused on X-ray MSPs in the Galactic field and conducted a survey of their X-ray properties. They simply applied a pure power-law model for all of the sampled MSPs and normalized the energy band to 2–10 keV as well. However, the derived X-ray luminosities of MSPs in these works may have large uncertainties, mainly due to the difficulties of measuring distances to the field MSPs (e.g. Igoshev et al., 2016). By contrast, the distance to a GC can be measured much more accurately than to a field MSP, and hence the uncertainty of distance to MSPs in a GC may be largely reduced (now 5%, e.g. Baumgardt & Vasiliev, 2021).
In this paper, we present an X-ray survey for all the radio-detected MSPs in Galactic GCs which have Chandra X-ray observatory data, and which lack the confusion of bright LMXBs. We also report the X-ray spectral analyses of two newly found MSPs in the cluster Omega Centauri, using archival Chandra observations, and statistically study the X-ray properties of GC MSPs, with particular attention to the implications for X-ray studies of the population of MSPs in the Galactic Center. This paper is organized as follows. In Section 2, we described the criteria of data collection, reduction and normalization. In Section 3, we present the results of X-ray spectral fitting for six new MSPs in five GCs, and catalog X-ray sources in three GCs. We then present our X-ray census of GC MSPs, and further analyses of their X-ray properties. We discuss our results and the implications in Section 4, and we draw conclusions in Section 5.
2 Data Collection and Reduction
| GC Name | Distancea | b | NMSPc | NMSP,Td | Encounter Ratee | Lim. f | Reference of |
|---|---|---|---|---|---|---|---|
| (kpc) | (cm-2) | (erg s-1) | Lim. | ||||
| 47 Tuc (NGC 104) | 4.5 | 27 | 23 | 1000 | 1 | ||
| NGC 1851 | 12.1 | 13 | 1 | 1530 | |||
| M53 (NGC 5024) | 17.9 | 3 | 0 | 35.4 | 2 | ||
| Cen (NGC 5139) | 5.2 | 5 | 2 | 90.4 | 3 | ||
| M3 (NGC 5272) | 10.2 | 6 | 2 | 194.0 | 4 | ||
| M5 (NGC 5904) | 7.5 | 7 | 3 | 164.0 | 5 | ||
| NGC 5986 | 10.4 | 1 | 0 | 61.9 | |||
| M4 (NGC 6121) | 2.2 | 1 | 1 | 26.90 | 5 | ||
| M13 (NGC 6205) | 7.4 | 6 | 6 | 68.9 | 5 | ||
| M12 (NGC 6218) | 4.8 | 1 | 0 | 13.00 | 5 | ||
| M10 (NGC 6254) | 4.4 | 2 | 0 | 31.40 | 5 | ||
| M62 (NGC 6266) | 6.8 | 7 | 6 | 1670 | 5 | ||
| M92 (NGC 6341) | 8.3 | 1 | 1 | 270.0 | 5 | ||
| NGC 6342 | 8.5 | 1 | 0 | 44.8 | 2 | ||
| Terzan 1 | 6.7 | 6 | 0 | 0.292 | 5 | ||
| M14 (NGC 6402) | 9.3 | 5 | 1 | 124.0 | 5 | ||
| NGC 6397 | 2.3 | 2 | 2 | 84.1 | 5 | ||
| Terzan 5 | 6.9 | 38 | 37 | 6800 | 5 | ||
| NGC 6440 | 8.5 | 7 | 5 | 1400 | 6 | ||
| NGC 6441 | 11.6 | 5 | 3 | 2300 | |||
| NGC 6517 | 10.6 | 8 | 6 | 338.0 | 2 | ||
| NGC 6522 | 7.7 | 4 | 1 | 363.0 | 5 | ||
| NGC 6539 | 7.8 | 1 | 1 | 42.1 | 5 | ||
| NGC 6544 | 3.0 | 2 | 2 | 111.0 | 5 | ||
| NGC 6624 | 7.9 | 9 | 3 | 1150 | |||
| M28 (NGC 6626) | 5.5 | 13 | 8 | 648.0 | 5 | ||
| NGC 6652 | 10.0 | 2 | 0 | 700 | 7 | ||
| M22 (NGC 6656) | 3.2 | 2 | 2 | 77.5 | 5 | ||
| NGC 6712 | 6.9 | 1 | 1 | 30.80 | |||
| NGC 6749 | 7.9 | 2 | 1 | 51.5 | |||
| NGC 6752 | 4.0 | 9 | 6 | 401 | 8 | ||
| NGC 6760 | 7.4 | 2 | 2 | 56.9 | 5 | ||
| M71 (NGC 6838) | 4.0 | 2 | 1 | 1.470 | 9 | ||
| M15 (NGC 7078) | 10.4 | 5 | 4 | 4510 | |||
| M2 (NGC 7089) | 11.5 | 5 | 0 | 518.0 | 5 | ||
| M30 (NGC 7099) | 8.1 | 2 | 1 | 324.0 | 5 | ||
| Notes: a Distance to GCs collected from Harris (1996, 2010 edition). | |||||||
| b Hydrogen column number density towards GCs calculated based on correlation between and optical extinction, (Bahramian et al., 2015). | |||||||
| c Number of discovered MSPs. | |||||||
| d Number of discovered MSPs with precise timing positions. | |||||||
| e Stellar encounter rate estimated by Bahramian et al. (2013), with 1- errors. | |||||||
| f The limiting unabsorbed X-ray luminosity estimated in the band 0.3–8 keV. Reference: (1) Cheng et al. (2019); (2) this work (see section 3.2); (3) Henleywillis et al. (2018); (4) Zhao et al. (2019); (5) Bahramian et al. (2020); (6) Pooley et al. (2002); (7) Stacey et al. (2012); (8) Forestell et al. (2014); (9) Elsner et al. (2008). | |||||||
| Severely contaminated by bright X-ray sources (see Verbunt & Lewin, 2006). | |||||||
| No CXO observations | |||||||
Based on the catalogue of pulsars in globular clusters (230 pulsars in 36 GCs to date)111http://www.naic.edu/~pfreire/GCpsr.html, we first produced a list of MSPs in GCs by defining their spinning periods of ms. The boundary of rotational periods between normal pulsars and MSPs is not solid and may vary depending on the research of interests. Here we chose ms as the upper limit. This initial filtering gave 210 MSPs in total, and each GC in the catalogue harbours at least one MSP. Table 1 lists all the 36 GCs studied in this work, as well as other parameters.
To obtain the X-ray luminosities of these MSPs, we looked into Chandra X-ray Observatory (CXO) observations. Except NGC 5986 and NGC 6749, which have no CXO observation yet, all GCs have been observed at least once with a total exposure time 10 ks. However, five GCs (NGC 1851, NGC 6441, NGC 6624, NGC 6712, and M15) are not feasible for the X-ray analysis of MSPs or other faint X-ray sources, given that one or more bright ( erg/s) XRBs are present, producing a high X-ray background throughout the cluster core (see Verbunt & Lewin, 2006, for a review of GC X-ray sources). Hence there remain 29 GCs where we can determine or constrain the X-ray luminosities of known MSPs. Several GCs and the MSPs therein have been observed and studied in X-rays thoroughly, such as 47 Tuc, M28, etc. (see Introduction), while other GCs have had deep surveys of X-ray sources before MSPs were detected therein (e.g. Henleywillis et al., 2018). Also, Bahramian et al. (2020) provided a comprehensive catalogue of faint X-ray sources in 38 GCs, which may contain information about MSPs. In addition, to test the robustness of X-ray luminosities derived by Bahramian et al. (2020), we collected a dozen MSPs with well determined X-ray luminosities in the literature, and compared the literature values with the corresponding X-ray luminosities in the Bahramian catalogue. We found the values agree within their errors, and hence the X-ray luminosities presented by Bahramian et al. (2020) appear reliable. Three GCs (M53, NGC 6342, and NGC 6517), however, do not have published X-ray surveys yet, though archival CXO data is available on them. Therefore, we collected and extracted X-ray information (e.g. fluxes and luminosities) of GC MSPs based on previous studies of them. To normalize the X-ray energy range, we use unabsorbed X-ray luminosities in the 0.3–8 keV band as the normalization, and all the X-ray MSPs and sources studied in other energy bands were converted into the 0.3–8 keV band via the Chandra proposal planning tool, pimms222https://asc.harvard.edu/toolkit/pimms.jsp. Generally, the errors introduced by assuming a spectrum to convert bands (e.g. 0.5-2 to 0.3-8) in pimms are 20%, if does not exceed cm-2. These errors, however, are generally small when compared with the statistical errors of low count sources333See https://cxc.harvard.edu/ciao/why/pimms.html for more details., typical of MSPs in this work. The choice of energy band 0.3–8 keV emphasizes the X-ray emission from MSPs, including both thermal and non-thermal X-rays.
2.1 GC MSPs with X-ray analysis
A few GCs contain a large number of MSPs, like 38 MSPs found in Terzan 5 and 27 MSPs found in 47 Tuc, and hence they are of great interest to study the X-ray properties of GC MSPs. Given the deep X-ray observations by CXO as well as radio timing observations of these MSPs, their X-ray spectra may be well extracted and modeled, and therefore we can simply obtain their X-ray luminosities and other properties from corresponding studies. For instance, there are 20 MSPs in 47 Tuc that have spectral analysis with well fitted models and unabsorbed luminosities (see Bogdanov et al., 2006; Bhattacharya et al., 2017). Similarly, most MSPs in M13 and NGC 6752, and many in Terzan 5 and M28, also have well determined X-ray luminosities (Bogdanov et al., 2011; Forestell et al., 2014; Linares et al., 2014; Bogdanov et al., 2021; Zhao et al., 2021).
While new MSPs are continuously being discovered in GCs (e.g. Pan et al., 2021b; Ridolfi et al., 2021), most do not yet have precise timing positions. Alternatively, we can constrain the X-ray luminosities for MSPs without precise timing positions by setting upper limits using the known cluster X-ray sources. Given the detailed multiwavelength analyses of several GCs (e.g. Pooley et al., 2002; Edmonds et al., 2003; Heinke et al., 2005), most X-ray sources with have been identified as CVs, LMXBs, etc, and only faint X-ray sources () often remain unidentified. Since MSPs are typically faint X-ray emitters, we can then define the X-ray luminosity upper limit of those MSPs without X-ray identifications in one GC as the luminosity of the brightest unidentified X-ray source in that GC. Hence we simply use one upper limit of X-ray luminosity for each cluster for all the MSPs without known positions in that cluster. While for those MSPs with published timing positions but not studied yet in X-rays, we briefly look into their X-ray luminosities and place upper limits for them (see below). It is a conservative definition but fair enough to give us a sense of the X-ray brightness of those MSPs.
2.2 GC X-ray analysis in this work
We briefly analyze CXO observations of three GCs (M53, NGC 6342, and NGC 6517) that have not been studied yet to constrain the X-ray luminosities of the sources therein. Also, we analyze X-ray spectra of six MSPs with clear X-ray counterparts at their precise timing positions in five GCs ( Cen, M5, M92, M14, and NGC 6544). In addition, we extract X-ray flux limits for those MSPs with timing positions but without an X-ray counterpart to calculate their upper limits of X-ray luminosities (25 MSPs in 10 GCs; see Table 14). We note that MSPs with new timing positions in the cluster M62 will require detailed X-ray studies, as the potential counterparts are located in a crowded core where careful astrometric considerations will be necessary (see e.g. Bogdanov et al. 2021 for a similar analysis of Terzan 5). Therefore, we only give upper limits of their X-ray luminosities in this paper, and will study them carefully in future work. The data reduction and analysis were performed using ciao444Chandra Interactive Analysis of Observations, available at https://cxc.cfa.harvard.edu/ciao/. (version 4.13, caldb 4.9.4, Fruscione et al., 2006). All the Chandra observation data were first reprocessed using the chandra_repro script to create new level 2 event files that apply the latest calibration updates and bad pixel files. Plus, we filtered the data to the energy band 0.3–8 keV to keep consistency. No background flares were detected in the CXO observations, except for M92 and NGC 6544 (see below).
Furthermore, we checked the astrometry between the X-ray images and the radio timing positions for the clusters where we perform X-ray analysis. We first ran the wavdetect script, a Mexican-Hat Wavelet source detection algorithm555https://cxc.cfa.harvard.edu/ciao/threads/wavdetect/, to get the X-ray positions of bright sources on the S3 chip (the aimpoint chip for most Chandra observations), or the I0-I3 chips for the Cen observations. Then we checked Gaia Data Release 3 (DR3; Gaia Collaboration et al., 2016, 2021) to see if there are one or more bright Gaia stars (with G-band magnitude 16 mag to reduce the number of chance coincidences) within 1″ of the Chandra sources, outside the cluster half-light radius. We applied the mean value of the offsets between Chandra and Gaia detections in each cluster to MSP positions to correct absolute astrometry, and used the corrected positions for the following analysis. We found the offsets are (+0.110″, 0.125″), (+0.194″, 0.017″), (0.011″, 0.163″), and (+0.012″, +0.052″) for the clusters Cen, M92, M14, and NGC 6544, respectively, in R.A. and Dec.
For the cluster M5, however, we could not find any eligible Chandra-Gaia matches to refine the astrometric alignment. However, based on the radio timing position of PSR J1518+0204C (or M5C) in M5, we found its X-ray counterpart on the Chandra image via wavdetect, with a radial offset of 0.4″ to the radio position. Since the overall 90% uncertainty circle of Chandra X-ray absolute position has a radius of 0.8″,666see https://cxc.harvard.edu/cal/ASPECT/celmon/ and the probability of a spurious association is low (about 1% chance of the pulsar lying within 1″of one of the 8 X-ray sources in the core), we argue that the Chandra absolute astrometric accuracy for M5 is satisfactory for the following analysis.
2.2.1 M53, NGC 6342, and NGC 6517
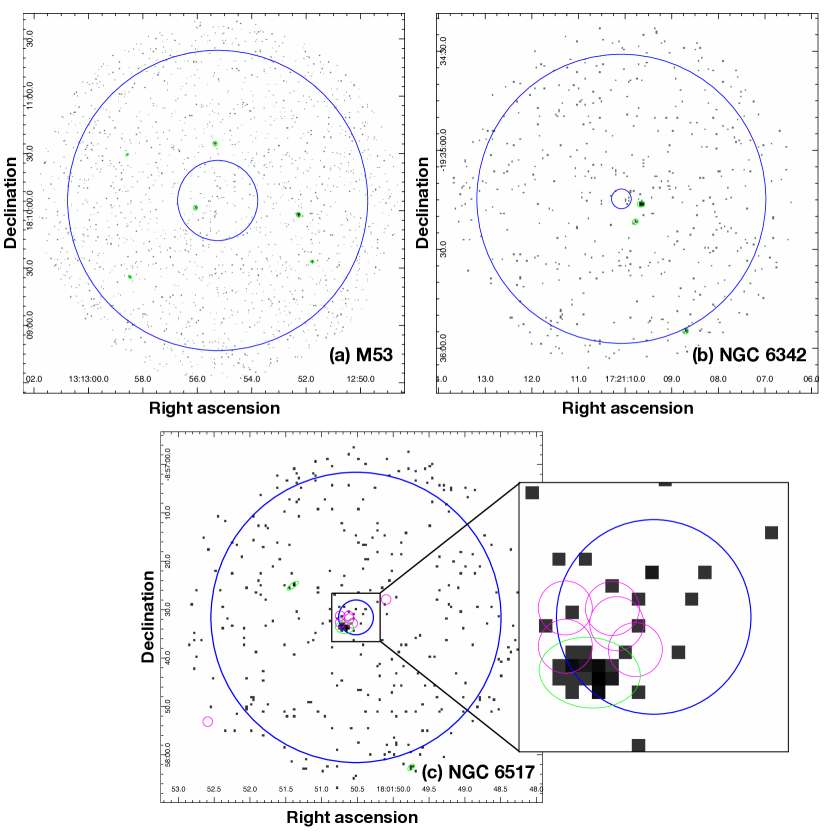
Each of M53, NGC 6342, and NGC 6517 has been observed once by CXO in the VFAINT mode, with exposure times ranging from 15 ks to 25 ks (see Table 2). We formally detected X-ray sources in each GC by using wavdetect. We set the wavelet scales of 1.0, 1.4, 2.0, and 4.0, and the significance threshold of (false positives per pixel). The detected X-ray sources are shown in Figure 1 (green contours). To generate the X-ray luminosities of those sources, we first extracted their spectra from the detection regions provided by wavdetect (shown in Fig. 1) running dmextract in ds9. (We also tried to extract spectra using 1″ radii circular regions and found that the results changed little, e.g. the spectral results remained within the errors. Hence we used the regions generated by wavdetect for convenience.) With additional known observation information (e.g. Chandra cycles, detectors), we converted count rates into unabsorbed X-ray fluxes and luminosities via pimms, assuming a power-law spectrum with a photon index of 1.7 for those sources, and distances from Harris (1996, 2010 revision). The choice of a power-law model with a photon index of 1.7 is a compromise that is typical of background AGN (Giacconi et al., 2001), and of globular cluster X-ray sources at erg s-1 (e.g. Zhao et al., 2020b, their Fig. 4), typical for these observations (see Table 5).
| Date of | Observation | Exposure | ||
|---|---|---|---|---|
| GC Name | Instrument | Observation | ID | Time (ks) |
| M53 | ACIS-S | 2006 Nov 13 | 6560 | 24.5 |
| NGC 6342 | ACIS-S | 2009 Jul 10 | 9957 | 15.8 |
| NGC 6517 | ACIS-S | 2009 Feb 04 | 9597 | 23.6 |
2.2.2 Cen
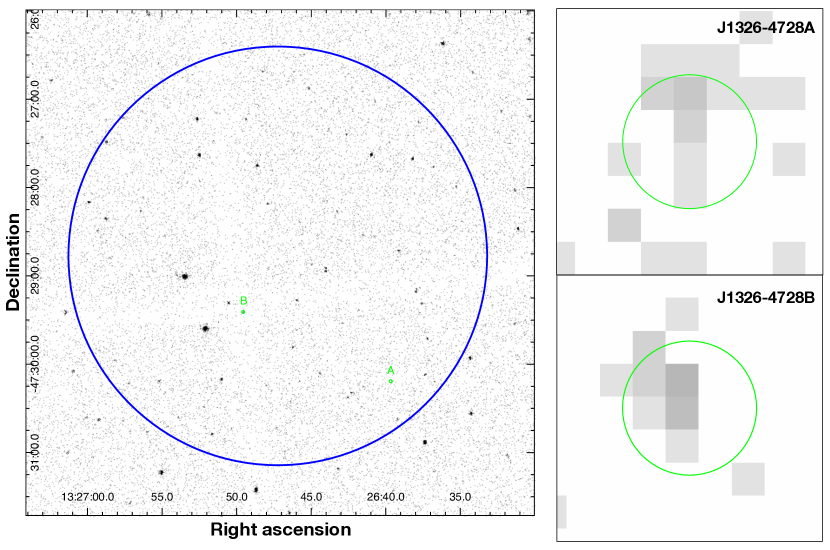
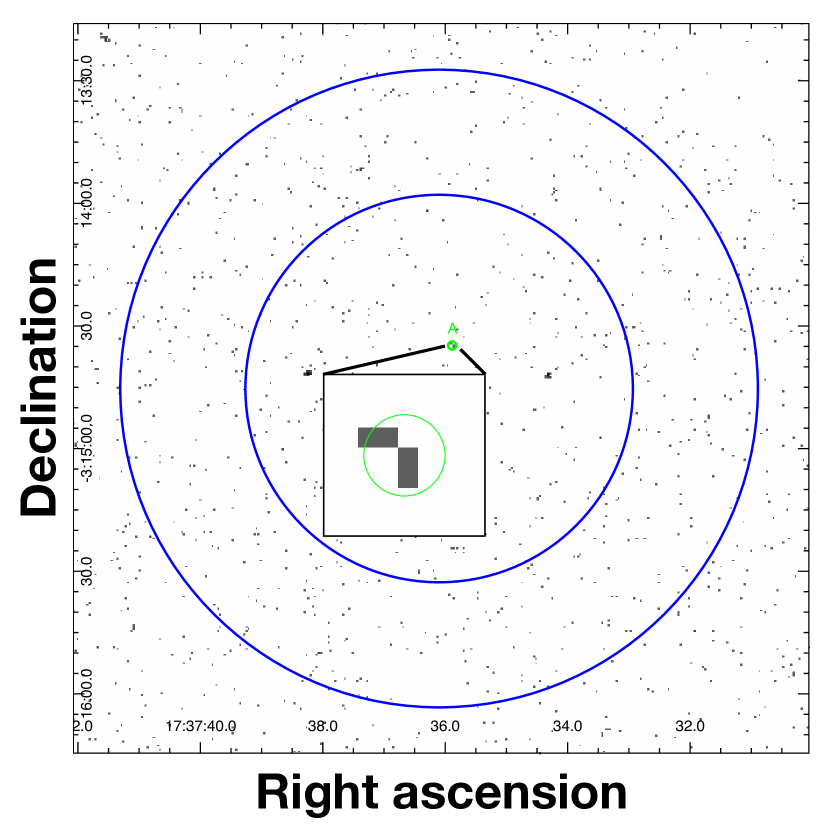
The X-ray data of Cen used in this work consist of four CXO observations, with a total exposure time of 290.1 ks (see Table 3). All of the four observations were imaged using the ACIS-I imaging array and configured in VFAINT mode. We created a co-added X-ray image of Cen in 0.3–8 keV band by merging four level 2 event files using merge_obs (Figure 2).
Since Cen has had a deep and comprehensive X-ray study recently by Henleywillis et al. (2018) (see also Cool et al. 2013), we only focus on the MSPs in Cen discovered since their work. There are five MSPs found to date in Cen (Dai et al., 2020), and only two of them (J13264728A and J13264728B) have precise timing positions. To analyse the X-ray spectra and obtain luminosities of these two MSPs, we first extracted X-ray emission from the circular regions with a 1-arcsec radius centred on the radio timing positions (green circles in Figure 2) by using specextract. We performed the extraction process for each observation separately, and then combined the spectra for each MSP correspondingly using combine_spectra. The background was taken from source-free annular areas around the MSPs.
| Date of | Observation | Exposure | ||
|---|---|---|---|---|
| GC Name | Instrument | Observation | ID | Time (ks) |
| Cen | ACIS-I | 2000 Jan 24 | 653 | 25.0 |
| ACIS-I | 2000 Jan 25 | 1519 | 43.6 | |
| ACIS-I | 2012 Apr 17 | 13726 | 173.7 | |
| ACIS-I | 2012 Apr 16 | 13727 | 48.5 | |
| M5 | ACIS-S | 2002 Sept 24 | 2676 | 44.7 |
| M92 | ACIS-S | 2003 Oct 05 | 3778 | 29.7 |
| ACIS-S | 2003 Oct 19 | 5241 | 22.9 | |
| M14 | ACIS-S | 2008 May 24 | 8947 | 12.1 |
| NGC 6544 | ACIS-S | 2005 Jul 20 | 5435 | 16.3 |
2.2.3 M5 (NGC 5904)
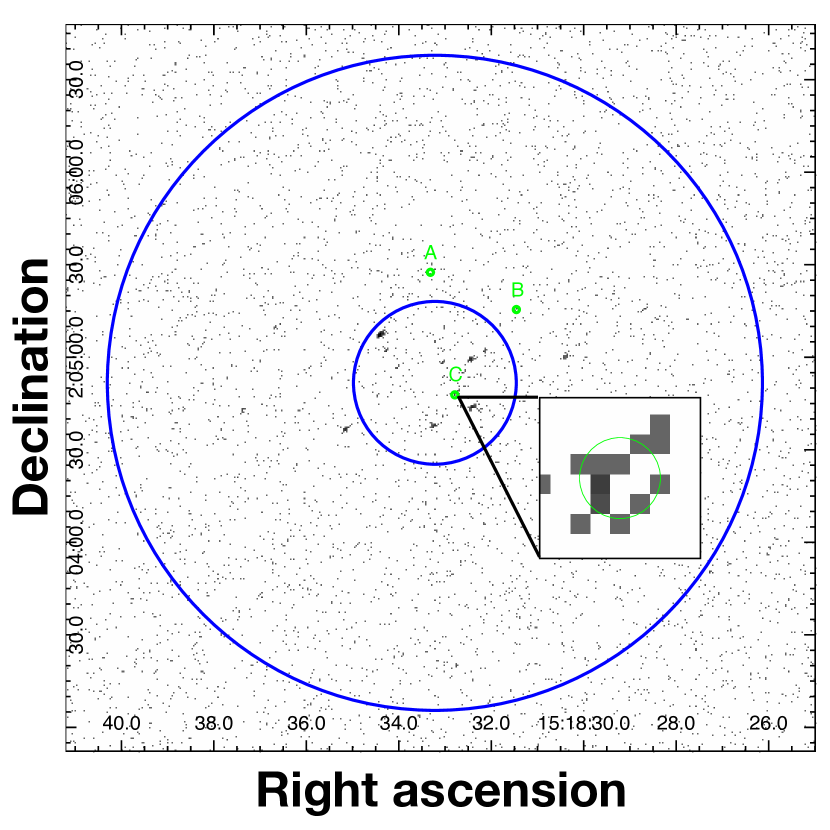
M5 has been observed once by CXO with an exposure time of 44.7 ks in the FAINT data mode. Figure 3 shows the X-ray image of M5 in the band 0.3–8 keV. Seven MSPs have been found in this cluster so far (Wolszczan et al., 1989; Anderson et al., 1997; Hessels et al., 2007; Pan et al., 2021a, and another, yet unpublished, by FAST, 777https://crafts.bao.ac.cn/pulsar/SP2/), while only three of them (J1518+0204A, J1518+0204B, and J1518+0204C) have precise timing positions (marked by green circles in Figure 3; Anderson et al. 1997; Pallanca et al. 2014). Among these three MSPs, J1518+0204A shows a clear X-ray detection on the Chandra image (see the inset box in Figure 3), and its counterpart is detected by wavdetect. Hence we are able to perform X-ray spectral analysis for J1518+0204A. We note that no individual X-ray study of M5 has yet been published, while Bahramian et al. (2020) presented the X-ray source detections and source properties of this cluster in a general way. However, the X-ray counterpart to J1518+0204A is not included in their source catalogue.
2.2.4 M92 (NGC 6341)
There are two CXO observations of M92 so far (see Table 3) with a total exposure time of 52.6 ks. Lu et al. (2011) identified a few background flares during the observations, and reduced the effective exposure time to 52.5 ks. However, we argue that the short flare background has little influence on the spectral analysis of the MSP in this cluster after extracting and deducting the background emission. Hence we skipped the process of eliminating background flare times for M92, and the merged X-ray image in the band 0.3–8 keV is shown in Figure 4.
One MSP (PSR J1717+4308A) has been discovered in M92, which is identified as an eclipsing redback (Pan et al., 2020, 2021b). Its X-ray counterpart is clearly seen on the Chandra X-ray image (see Figure 4). Lu et al. (2011) comprehensively studied the X-ray sources and corresponding optical counterparts in M92, including the X-ray counterpart to J1717+4308A (source ID CX3 in their catalogue), while the X-ray spectral analysis of J1717+4308A was not contained in their work. Here, we perform an X-ray spectral analysis for J1717+4308A.
2.2.5 M14 (NGC 6402)
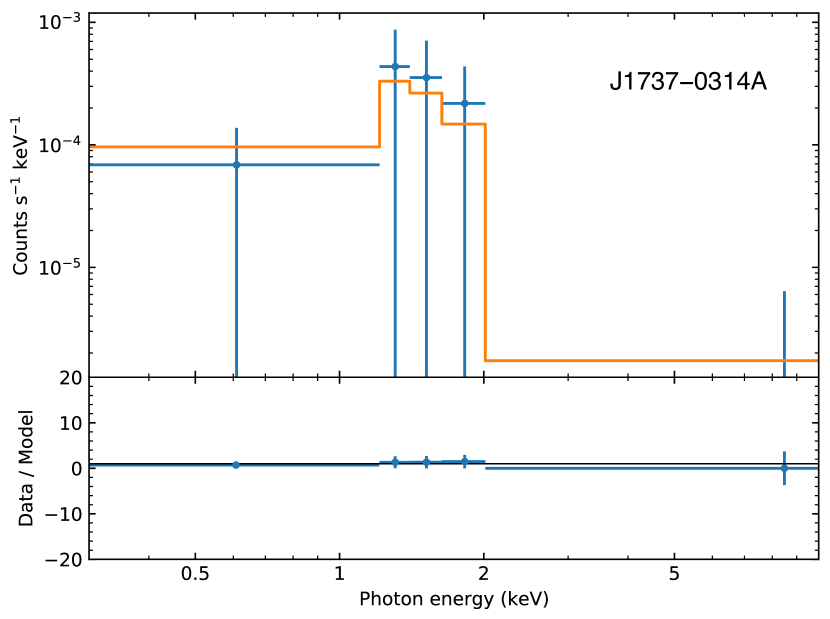
M14 only has a 12.1-ks CXO observation in VFAINT data mode to date. Due to the limited exposure time and high hydrogen column density (see Table 1) towards this cluster, a deep X-ray study of M14 has not yet been performed. Nonetheless, Bahramian et al. (2020) presented a total of seven X-ray sources detected in this cluster. Five MSPs have been found recently in M14 by Pan et al. (2021b), although only PSR J17370314A has a published precise timing solution. The timing solution for PSR J17370314A indicates a black widow system, but the discovery observation was not long enough to exclude the possibility of eclipses, given the orbital period of 5.5 hours with an observation length of 2 hours (Pan et al., 2021b). Hence it is not clear if this pulsar is eclipsing. None of the X-ray sources published by Bahramian et al. (2020) are the counterpart to J17370314A, though there appears to be X-ray emission at its timing position. In this work, we extract and analyze the X-ray spectrum of J17370314A based on its timing position. The Chandra X-ray image and X-ray emission from J17370314A can be found in Figure 5.
2.2.6 NGC 6544
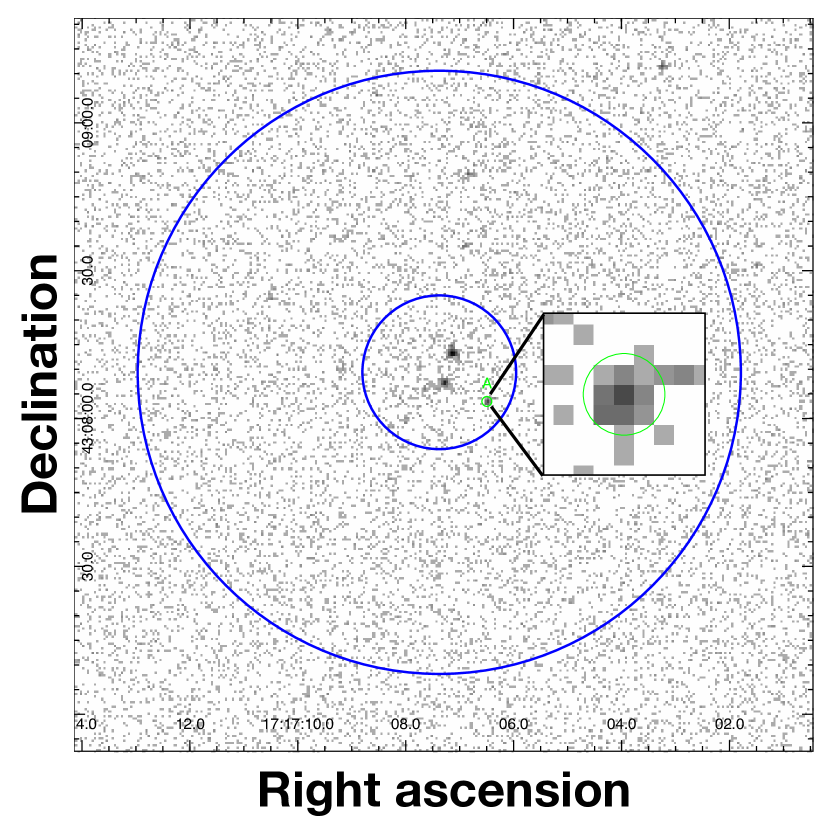
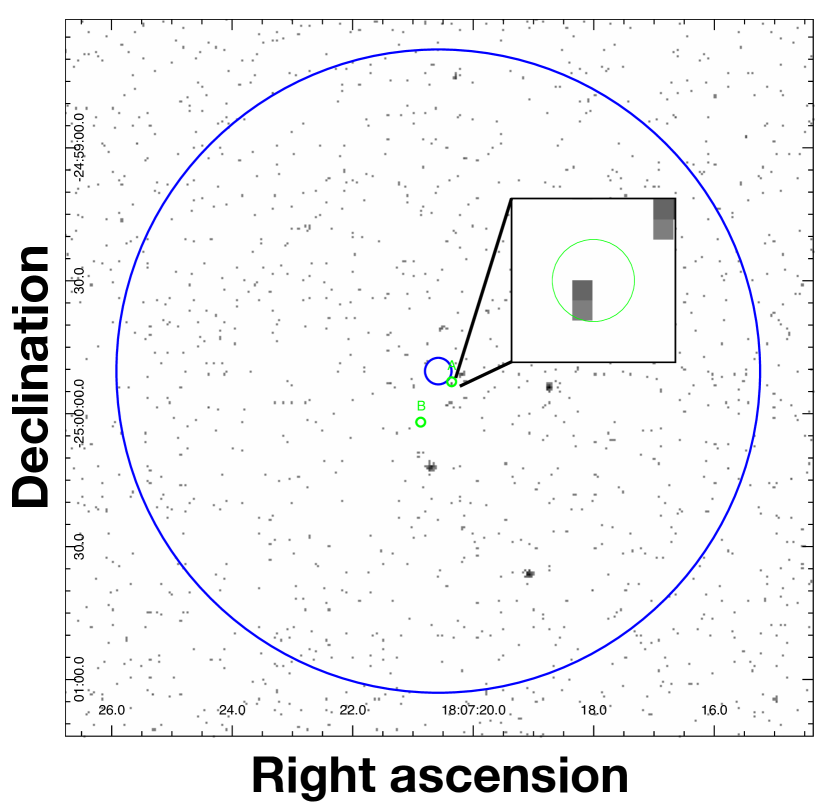
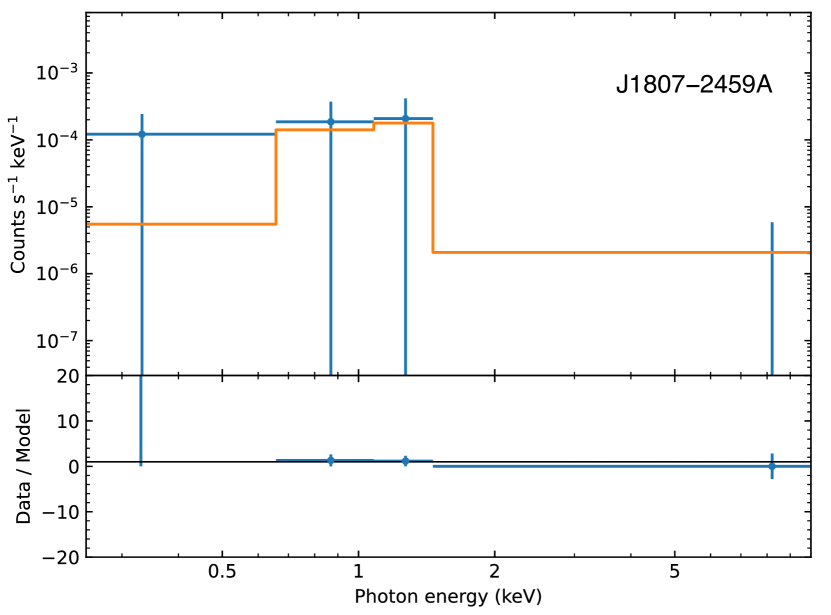
There is one CXO observation of NGC 6544, with 16.3 ks exposure time and FAINT data configuration. Since NGC 6544 is a cluster with substantial background flaring, we eliminated the high background times by limiting the count rate 15 counts s-1 from the entire chip S3, resulting in an effective exposure time of 12.7 ks. NGC 6544 is a so-called core-collapsed GC, with a core radius of only 0.05″ (Harris, 1996, 2010 edition). Two MSPs (J18072459A and J18072459B) with timing positions have been discovered in this GC (D’Amico et al., 2001; Ransom et al., 2001; Lynch et al., 2012), while only J18072459A shows a clear X-ray counterpart (see Figure 6). Bahramian et al. (2020) published eight X-ray sources in NGC 6544, although the X-ray counterpart to J18072459A is not included. We perform X-ray analysis for this MSP in this paper.
2.2.7 Other MSPs with timing positions
There is another group of MSPs that have radio timing positions but have no or few X-ray counts from corresponding regions, like the MSPs in NGC 6517 (see Figure 1.c). In this work, we briefly investigate their X-ray properties to further constrain the X-ray luminosity distribution of GC MSPs. For these MSPs, we apply CXO observations of their corresponding GCs and extract their X-ray fluxes within a circle with 1-arcsec radius and centred at their timing positions. We use srcflux in ds9 to calculate the unabsorbed X-ray fluxes in the band 0.3–8 keV, by assuming a single power-law model with a photon index of 1.7 and fixed values of to corresponding GCs (see Table 1). If a GC has multiple archival CXO observations, we apply the one with longest exposure time. We note that, since two transient LMXBs have been discovered in the cluster NGC 6440 by Chandra (see e.g., in’t Zand et al., 2001; Heinke et al., 2010), we need to choose the observation (Obs ID: 947) that was not influenced by the two transients to obtain reasonable X-ray upper limits for the MSPs therein. In addition, if no X-ray counts are detected in the circular region for a MSP, we place the limiting X-ray luminosity of the corresponding GC (see Table 1) as its upper limit.
3 Analysis and Results
3.1 New X-ray spectral fits in this work
We used sherpa, ciao’s modeling and fitting tool, to perform the spectral fits. We assumed fixed hydrogen column densities () towards corresponding GCs and applied the xstbabs model (Wilms et al., 2000) to calculate X-ray absorption by the interstellar medium, using wilm abundances (Wilms et al., 2000) and Verner et al. (1996) cross-sections. The was estimated based on the known interstellar reddening (Harris, 1996, 2010 edition), and the correlation between and the optical extinction (Bahramian et al., 2015), while we adopted (Cardelli et al., 1989). We applied the WSTAT statistic (Cash, 1979) in sherpa for estimating the uncertainties of fitting parameters and testing the goodness-of-fit.888See also https://heasarc.gsfc.nasa.gov/xanadu/xspec/manual/node312.html.
3.1.1 Cen A and B (J13264728A and B)
The hydrogen column density towards Cen was fixed at cm-2. Also we binned the spectrum of J13264728A to contain at least one count per bin, while the data of J13264728B were binned with two counts per bin. We considered three spectral models for the X-ray emission from MSPs: blackbody (BB); power-law (PL); and neutron star hydrogen atmosphere (NSATMOS; Heinke et al., 2006a) models. We first used the xsbbody model to fit BB spectra, and the normalization (with little affect on fitting) was fixed to reduce a free parameter and increase the degrees of freedom. For the NSATMOS spectra, we applied the xsnsatmos model, and the NS mass and radius were fixed to 1.4 M☉ and 10 km, respectively. Plus, the distance was frozen to 5.2 kpc, our assumed distance to Cen (Harris, 1996, 2010 revision). The normalization of the xsnsatmos model, physically indicating the fraction of the NS surface emitting, has little influence on other fitting parameters, and therefore we fixed it as well to reduce an unrelated free parameter. We applied xscflux model to fit the unabsorbed X-ray fluxes in the band of 0.3–8 keV for BB and NSATMOS spectra (xscflux is a convolution model in XSPEC that is usually used for a robust calculation of unabsorbed flux of other model components). As a result, the free parameters were temperature and flux for both BB and NSATMOS models. The PL spectra were fitted using xspegpwrlw model, with free parameters of photon index and normalization, given that the normalization is in fact the X-ray flux from the source. We applied Q-values to indicate the fitting goodness, which is a measure of probability that the simulated spectra would have a larger reduced statistic value than the observed one, if the assumed model is true and the best-fit parameters are the true parameters. We consider Q-values larger than 0.05 as acceptable. The spectral fits of all the three models for J13264728 A and B are listed in Table 4.
The spectrum of J13264728A is well fitted by either a BB model or an NSATMOS model, with effective temperatures of K and K, respectively. Also, the fitted unabsorbed fluxes of these two models are consistent with each other. A PL spectral model for J13264728A is a slightly worse fit, as the best-fit Q-value is 0.06. More importantly, the fitted photon index is , which is highly unlikely for non-thermal emission from MSPs (typically for MSPs, e.g. Bogdanov et al., 2006; Bogdanov et al., 2011). The fitted high photon index implies a soft spectrum typically seen from blackbody-like thermal emission of MSPs (e.g. Zhao et al., 2021). Furthermore, J13264728A is an isolated MSP (Dai et al., 2020) and faint in X-rays ( erg s-1 in 0.3–8 keV band), consistent with a thermal model.
J13264728B is an eclipsing black widow pulsar, with a companion star of mass 0.016 M☉ (Dai et al., 2020). Its X-ray spectrum can be well described by a pure PL model, with the fitted photon index and unabsorbed luminosity erg s-1. It is also likely that the X-ray spectrum is dominated by either a BB or a NSATMOS model, with fitted effective temperatures of K and K, respectively, with similar fit quality ’goodness’. Although we cannot rule out any spectral models based on Q-values, we empirically prefer a PL model for the spectrum of J13264728B, given that most observed eclipsing spider pulsars emit a bulk of non-thermal X-rays, like J00237203 J and W in 47 Tuc (Bogdanov et al., 2006), and given the relatively high of J13264728B, like these other eclipsing systems. However, we need to note that a few nearby MSPs are found with X-ray spectra that can be well described by multiple thermal components plus a PL component (see, e.g. Bogdanov & Grindlay, 2009; Bogdanov, 2013). X-ray spectra of such MSPs with low counts could therefore mimic a single PL model. Though the PL model is preferred for the X-ray spectrum of J13264728B, the nature of its X-ray emission is still ambiguous. We also tested combined spectral models, i.e. BB+PL and NSATMOS+PL, but these models did not provide better fits, and hence we only show the fitting results of one-component models here. Figure 7 shows the X-ray spectra and the preferred fits of J13264728A (left panel) and J13264728B (right panel).

| J13264728A | |||
| Spectral Model | BB | PL | NSATMOS |
| //a | |||
| Reduced Stat. | 1.57 | 2.05 | 1.67 |
| Q-value | 0.15 | 0.06 | 0.12 |
| (0.3–8 keV)b | |||
| J13264728B | |||
| Spectral Model | BB | PL | NSATMOS |
| //a | |||
| Reduced Stat. | 0.79 | 1.03 | 0.76 |
| Q-value | 0.60 | 0.41 | 0.62 |
| (0.3–8 keV)b | |||
| Notes: was fixed for all the fits at the value to Cen of cm-2. | |||
| a : blackbody temperature in units of keV; : photon index; : unredshifted effective temperature of the NS surface in units of log Kelvin. | |||
| b Unabsorbed flux in units of erg cm-2 s-1. | |||
3.1.2 M5C (J1518+0204C)
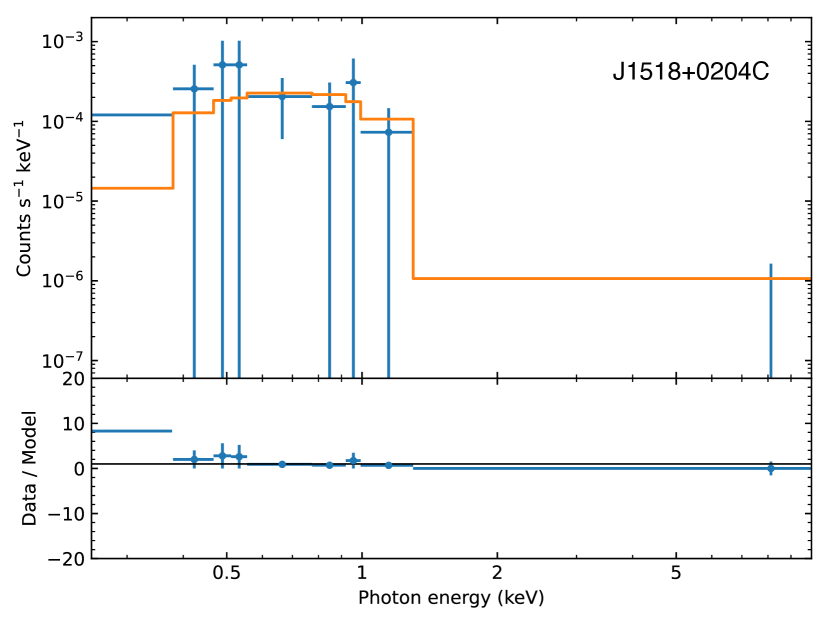
We fitted the X-ray spectrum of M5C using BB, PL, and NSATMOS models respectively, while the towards M5 was fixed at cm-2. Given the limited photon counts from this MSP ( 10 counts), we needed to manually constrain the normalizations of the BB and NSATMOS models, i.e. the source radius, to obtain constraints on other parameters. Thus we fixed the source radii at 0.3 km for BB model and 1 km for NSATMOS model, respectively, which are commonly observed from GC MSPs (see, e.g. Bogdanov et al., 2006). For the PL model, no additional constraint was required. The fitting results are listed in Table 5, and the spectrum and the best fit are shown in Figure 8.
We found that the X-ray spectrum of M5C is well-described by either a BB or an NSATMOS model, with effective temperatures of K or K, respectively. The best-fit unabsorbed fluxes for the BB and NSATMOS models are and erg cm-2 s-1, corresponding to X-ray luminosities in the band 0.3–8 keV of and erg s-1, respectively, at a distance of 7.5 kpc. The fitted photon index in the PL model has , also implying a thermally-emitting source with a soft spectrum.
| J15180204C | |||
| Spectral Model | BB | PL | NSATMOS |
| //a | |||
| Reduced Stat. | 1.07 | 0.40 | 1.23 |
| Q-value | 0.38 | 0.90 | 0.27 |
| (0.3–8 keV)b | |||
| Notes: was fixed for all the fits at the value to M5 of cm-2. | |||
| a : blackbody temperature in units of keV; : photon index; : unredshifted effective temperature of the NS surface in units of log Kelvin. | |||
| b Unabsorbed flux in units of erg cm-2 s-1. | |||
3.1.3 M92A (J1717+4308A)
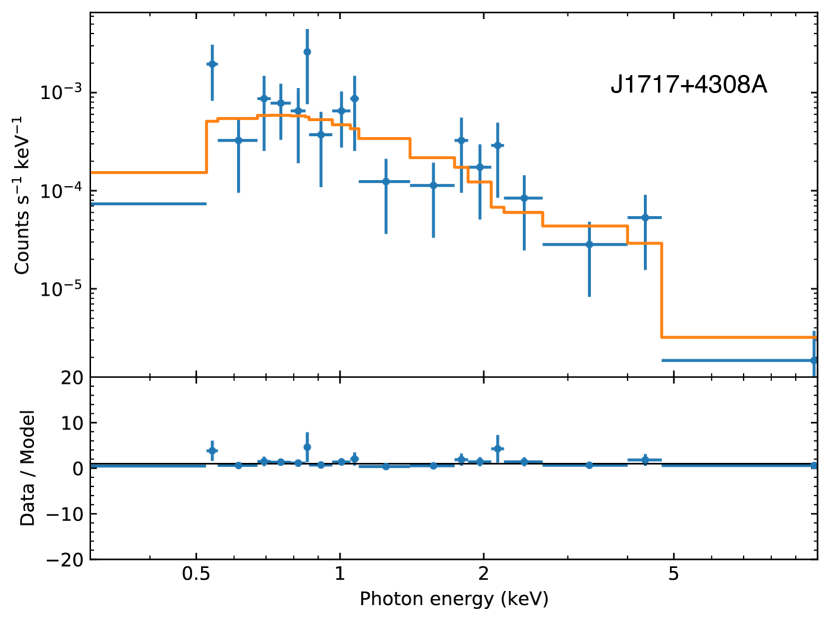
M92A is a relatively bright X-ray source with 35 counts in its spectrum, and hence we grouped the data with 2 counts per bin to reduce the uncertainties. We fixed the towards M92 at for the spectral fitting. We first applied three single models, i.e. BB, PL, or NSATMOS (the normalizations for BB and NSATMOS models were thawed), to fit the spectrum, and found that the Q-values for BB and NSATMOS are 10-3 and 410-4, respectively. We also checked the fits for BB and NSATMOS models with fixed normalizations and obtained even lower Q-values, and hence these two pure models were ruled out. Although a pure PL model can fairly describe the X-ray spectrum of M92A, we also considered two combined spectral models, PL+BB and PL+NSATMOS, with free normalizations for BB and NSATMOS to fit the data. The fitting results are shown in Table 6.
We found that the X-ray spectrum of M92A can be well described by a combined model, either PL+BB or PL+NSATMOS (see Figure 9), indicating both non-thermal and thermal emission originated from M92A, while the non-thermal component is more dominant. The best-fit photon index is of , which is typically observed from redbacks (see Bogdanov et al., 2021).
The companion star of M92A is most likely a main-sequence star with a median mass of 0.18 M☉ (Pan et al., 2020), and hence its optical counterpart could be found in the archival observations of Hubble Space Telescope. Lu et al. (2011) analyzed the optical counterparts of X-ray sources in M92 based on wavdetect detections, where the source CX3 in their catalogue corresponds to M92A. They found nine optical counterparts within the 95% error circle of CX3, although none of them can yet be confirmed as the counterpart to M92A. Robust identification of the optical counterpart to M92A using its timing position may reveal interesting properties of its companion star.
| J17174308A | |||
| Spectral Model | PL | PL+BB | PL+NSATMOS |
| a | |||
| /a | |||
| Reduced Stat. | 1.23 | 1.27 | 1.24 |
| Q-value | 0.23 | 0.21 | 0.23 |
| (0.3–8 keV)b | |||
| Notes: was fixed for all the fits at the value to M92 of cm-2. | |||
| a : blackbody temperature in units of keV; : photon index; : unredshifted effective temperature of the NS surface in units of log Kelvin. | |||
| b Unabsorbed flux in units of erg cm-2 s-1. The values in parentheses represent the flux of the PL component. | |||
3.1.4 M14A (J17370314A)
Given that the towards M14 is , the observed X-ray spectrum of M14A is likely affected by the interstellar extinction since soft X-rays ( keV) are largely absorbed (see Figure 10). We therefore fixed the normalizations in the BB and NSATMOS models with the same values applied for M5C (see above) to get reasonable fits. The fitting results for M14A are listed in Table 7.
The X-ray emission generated from M14A is most likely thermal-dominated, given the fitted photon index in the PL model is . The spectral fits via a pure BB or a pure NSATMOS model have similar quality. The unabsorbed luminosity (0.3–8 keV) indicated by the BB model is erg s-1 at the distance of 9.3 kpc, making it the most X-ray-luminous BW so far.
| J17370314A | |||
| Spectral Model | BB | PL | NSATMOS |
| //a | |||
| Reduced Stat. | 0.30 | 0.54 | 0.37 |
| Q-value | 0.82 | 0.70 | 0.77 |
| (0.3–8 keV)b | |||
| Notes: was fixed for all the fits at the value to M14 of cm-2. | |||
| a : blackbody temperature in units of keV; : photon index; : unredshifted effective temperature of the NS surface in units of log Kelvin. | |||
| b Unabsorbed flux in units of erg cm-2 s-1. | |||
3.1.5 NGC 6544A (J18072459A)
The observed X-ray spectrum of NGC 6544A is also significantly impacted by the interstellar extinction towards the cluster (see Figure 11). Hence, we applied a similar fitting process as used for fitting the spectrum of M14A. By fixing cm-2, we fitted the spectrum using pure BB, PL, and NSATMOS models, respectively, and showed the results in Table 8.
NGC 6544A seems also to be a thermally-emitting MSP, with an effective temperature of K and an unabsorbed luminosity of erg s-1 in the BB model.
| J18072459A | |||
| Spectral Model | BB | PL | NSATMOS |
| //a | |||
| Reduced Stat. | 1.27 | 0.59 | 1.55 |
| Q-value | 0.28 | 0.55 | 0.20 |
| (0.3–8 keV)b | |||
| Notes: was fixed for all the fits at the value to NGC 6544 of cm-2. | |||
| a : blackbody temperature in units of keV; : photon index; : unredshifted effective temperature of the NS surface in units of log Kelvin. | |||
| b Unabsorbed flux in units of erg cm-2 s-1. | |||
| c Model reached lower bound. | |||
3.2 X-ray sources in M53, NGC 6342, and NGC 6517
After the procedure of source detection discussed in Section 2.2.1, we found six X-ray sources in M53 and three X-ray sources in each of NGC 6342 and NGC 6517. Basic X-ray information of these detected sources are listed in Table 9 (see also Figure 1).
M53 (or NGC 5024) is the most distant GC studied in this work, at a distance of 17.9 kpc. The interstellar reddening towards M53, however, is relatively low, and hence several X-ray sources therein can be relatively readily detected. One source is located in the core region, while our other detected sources are within the half-light radius. The unabsorbed X-ray luminosities (0.3–8 keV) of the six sources are in the range of erg s-1 to erg s-1, providing an estimated limiting luminosity of erg s-1.
The source detections of NGC 6342 and NGC 6517 were largely affected by the high ISM absorption and limited exposure time. Particularly, the towards NGC 6517 is cm-2, among the highest in this work. The three detected X-ray sources in NGC 6342 have luminosities ranging from erg s-1 to erg s-1, while the X-ray luminosities of the three sources found in NGC 6517 vary from erg s-1 to erg s-1 (see Table 9). Hence, the estimated limiting X-ray luminosities of NGC 6342 and NGC 6517 are erg s-1 and erg s-1, respectively.
For the purpose of this study, we are only interested in the upper and lower limits of the luminosities of X-ray sources in these three GCs. Further studies, like optical/radio identifications of X-ray sources therein, may be available with deeper observations and analysis in the future.
| GC | Source | Position (J2000) | Countsa | (0.3–8 keV)b | |
|---|---|---|---|---|---|
| ID | (hh:mm:ss) | (::) | (0.3–8 keV) | ( erg cm-2 s-1) | |
| M53 | 1 | 13:12:58.4792 | +18:09:25.378 | 13.9 3.7 | 4.1 1.1 |
| M53 | 2 | 13:12:51.7781 | +18:09:33.452 | 34.9 5.9 | 10.2 1.7 |
| M53 | 3 | 13:12:52.2771 | +18:09:57.910 | 67.7 8.2 | 19.8 2.4 |
| M53 | 4 | 13:12:56.0651 | +18:10:01.569 | 19.7 4.5 | 5.8 1.3 |
| M53 | 5 | 13:12:58.5790 | +18:10:29.349 | 2.9 1.7 | 0.9 0.5 |
| M53 | 6 | 13:12:55.3503 | +18:10:35.137 | 13.7 3.7 | 4.0 1.1 |
| NGC 6342 | 1 | 17:21:08.7022 | 19:35:54.729 | 20.9 4.6 | 15.6 3.4 |
| NGC 6342 | 2 | 17:21:09.7821 | 19:35:21.656 | 7.9 2.8 | 5.9 2.1 |
| NGC 6342 | 3 | 17:21:09.6572 | 19:35:16.323 | 58.9 7.7 | 43.9 5.7 |
| NGC 6517 | 1 | 18:01:50.6799 | 8:57:33.665 | 25.1 5.1 | 17.8 3.6 |
| NGC 6517 | 2 | 18:01:51.4020 | 8:57:25.036 | 4.8 2.2 | 3.4 1.6 |
| NGC 6517 | 3 | 18:01:49.7506 | 8:58:02.592 | 2.8 1.7 | 2.0 1.2 |
| a Estimated net counts obtained by dmextract; errors are set to 1-. | |||||
| b Unabsorbed fluxes assuming a PL model with a photon index ; errors are set to 1-. | |||||
3.3 X-ray luminosity function of GC MSPs
After data collection and analysis, we finally obtain an X-ray catalogue of 175 GC MSPs (68 MSPs with determined X-ray luminosities shown in Table 10, and 107 MSPs with upper limits of X-ray luminosities listed in Table 14). MSPs in NGC 1851, NGC 6441, NGC 6624, NGC 6712, and M15 are not included in this catalogue, since we could not obtain reasonable X-ray luminosity constraints for them due to the severe contamination of very bright X-ray sources in these globular clusters. Also, X-ray luminosities for MSPs in NGC 5986 and NGC 6749 are unavailable because of the lack of sensitive (Chandra) X-ray observations.
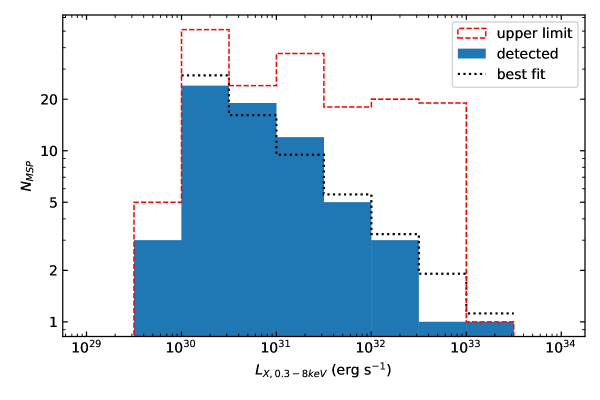
Using this catalogue, we are able to empirically investigate the X-ray luminosity function of GC MSPs. Figure 12 shows the differential X-ray luminosity distributions for two groups, MSPs with determined X-ray luminosities (blue histogram) and all MSPs in our catalogue including those with upper limits (red dashed histogram), respectively. We found that most detected GC MSPs have X-ray luminosities ranging from to erg s-1 in the band 0.3–8 keV. And the X-ray luminosity distribution of measured GC MSPs is plausibly a power-law-like pattern, well described by (see the black dotted histogram in Figure 12; 1-sigma confidence level; though this distribution is likely strongly affected by our not correcting for censorship of the data—that is, by the upper limits). On the other hand, the upper limits of X-ray luminosities are distributed more evenly between and erg s-1 (likely reflecting the varied X-ray exposures of GCs, principally). At the bright end, we see the well-known X-ray-bright MSP, B182124A ( erg s-1) in M28, alone.
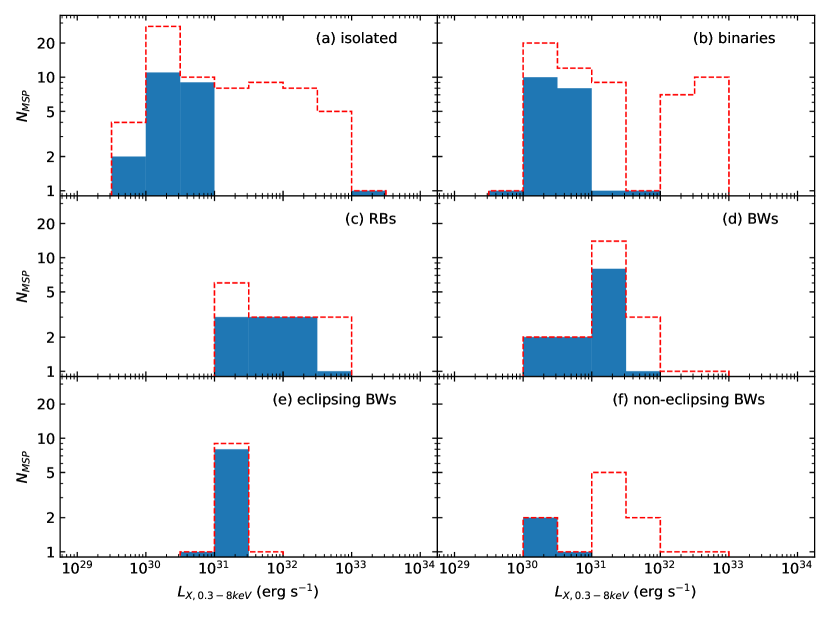
We also investigate the X-ray luminosity functions for different MSP groups separately (Figure 13). It is found that all the isolated MSPs in GCs, except M28A, are relatively faint, with X-ray luminosities lower than erg s-1 (see Figure 13a). Most of the MSPs in binary systems, excluding confirmed spider pulsars, are also faint in X-rays and of similar luminosity distribution with isolated MSPs (Figure 13b). It can interpreted as the same origin of X-ray emission from those MSP systems, that is thermal X-rays generated from hotspots near the NS magnetic poles. It is noticeable that all the detected RBs are among the brighter GC MSP population, with X-ray luminosities of – erg s-1 (Figure 13c), implying that non-thermal X-ray emission produced by intra-binary shocks dominates over thermal emission from the NS surface. More intriguingly, the X-ray luminosities of detected eclipsing BWs are between (0.3–8 keV) and erg s-1 , while the confirmed non-eclipsing BWs are almost an order of magnitude fainter ( and erg s-1) than the eclipsing BWs, except one at erg s-1 (Figure 13e and f). (Again, additional observations are needed to confirm if J17370314A is eclipsing, so we did not count it as either an eclipsing or a non-eclipsing BW; see also 2.2.5). This observed difference could suggest the population of non-eclipsing black widows are basically the same as the eclipsing black widows except for inclination (as suggested by Freire 2005, noting the lower mass functions of the non-eclipsing systems). In this case, the difference in is also due to inclination (following the models of the intra-binary shocks that indicate the synchrotron X-rays may be beamed in the plane of the binary to some extent). Alternatively, the population of non-eclipsing black widows are actually different from the eclipsing black widows. These systems may have similar inclinations, but lower-mass companions, that do not produce as strong winds (see e.g. Bailes et al. 2011; Kaplan et al. 2018).
However, we need to note some observational biases that may significantly impact the X-ray luminosity distributions of GC MSPs. Given that few GCs have limiting X-ray luminosities lower than erg s-1 (see Table 1), many very faint X-ray MSPs ( erg s-1) are not detectable. For instance, a few nearby MSPs in the Galactic field have been found to show very faint X-ray luminosities, down to erg s-1 (e.g. PSR J14001431, Swiggum et al., 2017). Also, most MSPs in Terzan 5 remain undetectable in X-rays due to the high absorption towards this GC, even though it has been observed extensively by CXO (see e.g. Bogdanov et al., 2021). Furthermore, the upper limits of X-ray luminosities for some MSPs may be quite conservative. Particularly, we simply placed one upper limit for all the MSPs without timing solutions in each GC, defined as the X-ray luminosity of the most luminous unidentified X-ray source in that GC. Therefore, we note that the upper limit of X-ray luminosity distribution does not necessarily reflect the estimated number of MSPs in each luminosity range, as they could be orders of magnitude dimmer than the placed upper limits.
| Pulsar Name | GC Name | Period | Typea | Spectral Model | (0.3–8 keV)b | Ref. of |
|---|---|---|---|---|---|---|
| (ms) | ( erg s-1) | |||||
| J00237204C | 47 Tuc | 5.76 | I | BB | 1 | |
| J00247204D | 47 Tuc | 5.36 | I | BB | 1 | |
| J00247205E | 47 Tuc | 3.54 | B | BB | 1 | |
| J00247204F | 47 Tuc | 2.62 | I | BB | 2 | |
| J00247204H | 47 Tuc | 3.21 | B | BB | 1 | |
| J00237203J | 47 Tuc | 2.10 | eBW | BB+PL | 1 | |
| J00247204L | 47 Tuc | 4.35 | I | BB | 1 | |
| J00237205M | 47 Tuc | 3.68 | I | BB | 1 | |
| J00247204N | 47 Tuc | 3.05 | I | BB | 1 | |
| J00247204O | 47 Tuc | 2.64 | eBW | BB+PL | 1 | |
| J00247204Q | 47 Tuc | 4.03 | B | BB | 1 | |
| J00247204R | 47 Tuc | 3.48 | eBW | BB | 1 | |
| J00247204S | 47 Tuc | 2.83 | B | BB | 2 | |
| J00247204T | 47 Tuc | 7.59 | B | BB | 1 | |
| J00247203U | 47 Tuc | 4.34 | B | BB | 1 | |
| J00247204W | 47 Tuc | 2.35 | eRB | BB+PL | 1 | |
| J00247201X | 47 Tuc | 4.77 | B | BB | 3 | |
| J00247204Y | 47 Tuc | 2.20 | B | BB | 1 | |
| J00247205Z | 47 Tuc | 4.55 | I | BB | 2 | |
| J00247205aa | 47 Tuc | 3.69 | I | BB | 2 | |
| J00247204ab | 47 Tuc | 3.70 | I | BB | 2 | |
| J13264728A | Cen | 4.11 | I | BB | 4 | |
| J13264728B | Cen | 4.79 | eBW | PL | 4 | |
| J15180204C | M5 | 2.48 | eBW | BB | 4 | |
| B162026 | M4 | 11.08 | O | BB | 5 | |
| J16413627B | M13 | 3.53 | B | PL | 6 | |
| J16413627C | M13 | 3.72 | I | BB | 6 | |
| J16413627D | M13 | 3.12 | B | BB | 6 | |
| J16413627E | M13 | 2.49 | eBW | PL | 6 | |
| J16413627F | M13 | 3.00 | B | BB | 6 | |
| J17013006B | M62 | 3.59 | eRB | PL | 7 | |
| J17013006C | M62 | 7.61 | B | PL | 7 | |
| J17174308A | M92 | 3.16 | eRB | BB+PL | 4 | |
| J17370314A | M14 | 1.98 | BW⋆ | BB | 4 | |
| J17405340A | NGC 6397 | 3.65 | eRB | PL | 7 | |
| J17405340B | NGC 6397 | 5.79 | eRB | PL | 8, 9 | |
| J17482446A | Terzan 5 | 11.56 | eRB | PL | 10 | |
| J17482446E | Terzan 5 | 2.20 | B | PL | 10 | |
| J17482446F | Terzan 5 | 5.54 | I | PL | 10 | |
| J17482446H | Terzan 5 | 4.93 | I | PL | 10 | |
| J17482446K | Terzan 5 | 2.97 | I | PL | 10 | |
| J17482446L | Terzan 5 | 2.24 | I | PL | 10 | |
| J17482446N | Terzan 5 | 8.67 | B | PL | 10 | |
| J17482446O | Terzan 5 | 1.68 | eBW | PL | 10 | |
| J17482446P | Terzan 5 | 1.73 | eRB | PL | 10 | |
| J17482446Q | Terzan 5 | 2.81 | B | PL | 10 | |
| J17482446V | Terzan 5 | 2.07 | B | PL | 10 | |
| J17482446X | Terzan 5 | 3.00 | B | PL | 10 | |
| J17482446Z | Terzan 5 | 2.46 | B | PL | 10 | |
| J17482446ad | Terzan 5 | 1.40 | eRB | PL | 10 | |
| J18072459A | NGC 6544 | 3.06 | BW | BB | 4 | |
| B182124A | M28 | 3.05 | I | PL | 11 | |
| J18242452C | M28 | 4.16 | B | PL | 11 | |
| J18242452E | M28 | 5.42 | I | PL | 11 | |
| J18242452F | M28 | 2.45 | I | PL | 11 | |
| J18242452H | M28 | 4.63 | eRB | PL | 11 | |
| J18242452I | M28 | 3.93 | eRB | PL | 12 | |
| J18242452J | M28 | 4.04 | BW | PL | 11 | |
| J18242452K | M28 | 4.46 | B | PL | 11 | |
| J18362354A | M22 | 3.35 | BW | PL | 13 |
| Pulsar Name | GC Name | Period | Typea | Spectral Model | (0.3–8 keV)b | Ref. of |
|---|---|---|---|---|---|---|
| (ms) | ( erg s-1) | |||||
| J19105959E | NGC 6752 | 4.57 | I | BB | 14 | |
| J19105959F | NGC 6752 | 8.49 | I | PL | 15 | |
| J19531846A | M71 | 4.89 | eBW | PL | 16 | |
| J21402310A | M30 | 11.02 | eBW | PL | 17 | |
| J19115958A | NGC 6752 | 3.27 | B | BB | 14 | |
| J19105959B | NGC 6752 | 8.36 | I | BB | 14 | |
| J19116000C | NGC 6752 | 5.28 | I | BB | 14 | |
| J19105959D | NGC 6752 | 9.04 | I | BB | 14 |
Notes: periods and types of MSPs were obained from Paulo Freire’s GC Pulsar Catalog.999http://www.naic.edu/~pfreire/GCpsr.html
a Types of MSP systems; I: isolated; B: binary; BW: black widow; RB: redback; O: others; e: eclipsing.
b Unabsorbed X-ray luminosities at the distances to corresponding GCs.
⋆ J17370314A in M14 might be an eclipsing BW. Confirmation is needed. See text for more information.
References: 1) Bogdanov et al. (2006);
2) Bhattacharya
et al. (2017);
3) Ridolfi
et al. (2016);
4) this work;
5) Pavlov et al. (2007);
6) Zhao
et al. (2021);
7) Oh
et al. (2020);
8) Bogdanov et al. (2010);
9) Pichardo Marcano
et al. (2021);
10) Bogdanov et al. (2021);
11) Bogdanov
et al. (2011);
12) Linares
et al. (2014);
13) Amato et al. (2019);
14) Forestell
et al. (2014);
15) Cohn et al. (2021, submitted);
16) Elsner
et al. (2008);
17) Zhao
et al. (2020b).
3.4 Number of MSPs versus stellar encounter rate
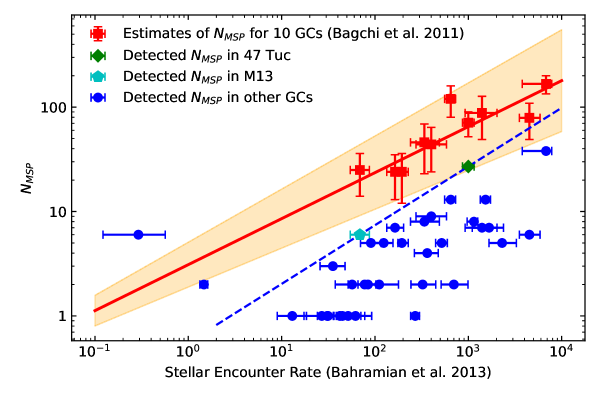
We re-examined the correlation between the number of MSPs and stellar encounter rate () for GCs in this work (see Table 1). It is well established that the number of X-ray binaries in a GC has a strong correlation with the GC stellar encounter rate (see e.g. Pooley et al., 2003; Heinke et al., 2003; Bahramian et al., 2013). One would naturally assume a correlation between the number of MSPs and in a GC, since MSPs are offspring of LMXBs. However, the difficulty to establish such a correlation is determining the total number of radio MSPs harboured in a GC. Bagchi et al. (2011) used sophisticated Monte Carlo simulations with various radio luminosity functions and models to calculate the population of radio MSPs in 10 GCs. They claimed that they did not find strong evidence that the number of MSPs correlates with under either model. However, Bahramian et al. (2013) produced a more sophisticated calculation of for these GCs and adopted the estimates of MSP populations from Bagchi et al. (2011, model 1), finding a significant correlation between the number of MSPs and in a GC via their statistical tests.
Here, we assume both the values from Bahramian et al. (2013) and the calculations of MSP population for 10 GCs (we also adopt the results of model 1 here; column 2 in Table 12) from Bagchi et al. (2011) are correct, and fit a power-law function through the data points, as standard for the correlation between the number of XRBs and . We note that due to the lack of data points, Markov Chain Monte Carlo (MCMC) method could not provide robust results, and hence we applied orthogonal distance regression method for fitting. The best-fit curve is , with 1-sigma errors on the slope and intercept of and , respectively (red solid line in Figure 14). Based on this correlation (assuming it is true) and the fitted function, we can then roughly estimate the total number of MSPs for each GC for a given (column 3 in Table 12). We calculate approximately 1460 MSPs in total in the 36 GCs in our study, which we consider as a conservative upper estimate. We consider this as a conservative upper estimate, because Bagchi et al. (2011) also produce two other estimates with smaller predicted numbers: roughly half those of Model 1. In addition, Heinke et al. (2005) place an upper limit on the MSP population of 47 Tuc of 60 at 95% confidence, compared to Model 1’s 7119. Alternative estimates from gamma-rays (Abdo et al., 2010) and diffuse radio flux (McConnell et al., 2004) also are well below Bagchi et al.’s Model 1 numbers — 33 and 30, respectively. Some MSPs may not point their radio beams towards us (though Lyne & Manchester 1988 illustrate that beam width varies inversely with spin period, so this fraction is likely to be small). However, the limits from X-ray and gamma-ray studies above do not depend on the radio beaming fraction, as the gamma-rays are produced high in the magnetosphere with a very large beaming fraction (Venter et al., 2009), and X-rays are emitted from hot spots on the neutron star surface, which are gravitationally lensed so as to be visible to virtually all observers (Pechenick et al., 1983).
We also plotted the number of currently known radio MSPs versus for the GCs in this work (blue dots in Figure 14; see also Table 1). Furthermore, we made an aggressive estimate of the lower bound on the total population of GC MSPs. Unlike the conservative upper estimate, we consider two GCs, 47 Tuc and M13, as “well-determined” GCs, for which the currently found MSPs in these two GCs are all (or nearly all) the MSPs therein. The choice of 47 Tuc is based on comprehensive and extensive studies of this cluster. Particularly, Heinke et al. (2005) suggested a total number of MSPs in 47 Tuc by comparing X-ray colors, luminosities, variability, etc., of detected MSPs to those of unidentified sources using deep CXO observations. (See also the compatible estimates using gamma-rays and diffuse radio flux, mentioned above.) To date, 27 MSPs have been found in 47 Tuc (four without timing positions), and this aggressive estimate assumes that this is indeed close to the total number of MSPs therein. M13 was recently observed by Wang et al. (2020) using the Five-hundred-metre Aperture Spherical radio Telescope (FAST). A new MSP (J1641+3627F) was discovered in their observations, making a total of 6 MSPs found in this cluster. Since the sensitivity of their radio observations reached down to a flux density of 0.4 Jy to a candidate with a signal to noise ratio of 7 (Wang et al., 2020), corresponding to a pseudo radio luminosity of 0.02 mJy kpc2 at 1.4 GHz, below which no MSPs in GCs have been detected (most GC MSPs have radio specific luminosities of mJy kpc2 at 1.4 GHz), we can confidently assume all or nearly all the MSPs in M13 have been found. We therefore fitted a power-law model across these two data points, finding a correlation of (blue dashed line in Figure 14). We normalized the MSP populations in other GCs to this model, assuming an MSP population proportional to their stellar encounter rates, and thus obtained a rough lower bound (henceforth our "aggressive" estimate) of the MSP population for them (see column 4 in Table 12).
It is noticeable that there is one cluster, Terzan 1 (leftmost blue dot in Figure 14), that falls significantly outside both our aggressive and conservative model predictions. Since Terzan 1 is a so-called ‘core-collapsed’ and heavily obscured cluster and its structural parameters are poorly measured, the calculation of depending on core values, such as core density and core radius, is generally not considered reliable (see Cackett et al., 2006; Bahramian et al., 2013). An alternative explanation of the discrepancy between the number of MSPs (and also of XRBs) and in Terzan 1 is that most stars in Terzan 1 have been stripped due to Galactic tides, leaving a core unusually rich in binaries (de Marchi et al., 1999). This is particularly plausible for Terzan 1, considering that it is located very close to the Galactic centre (Cackett et al., 2006).
| GC Name | N | N | N | N | Ref. |
|---|---|---|---|---|---|
| 47 Tuc (NGC 104) | 0 | 1 | |||
| NGC 1851 | |||||
| M53 (NGC 5024) | 5 | 2 | |||
| Cen (NGC 5139) | 7 | 3 | |||
| M3 (NGC 5272) | 2 | 4 | |||
| M5 (NGC 5904) | 1 | 5 | |||
| NGC 5986 | |||||
| M4 (NGC 6121) | 0 | 6 | |||
| M13 (NGC 6205) | 3 | 5,7 | |||
| M12 (NGC 6218) | 0 | 8 | |||
| M10 (NGC 6254) | 0 | 5 | |||
| M62 (NGC 6266) | 4 | 9 | |||
| M92 (NGC 6341) | 5 | 10 | |||
| NGC 6342 | 2 | 2 | |||
| Terzan 1 | 0 | 11 | |||
| M14 (NGC 6402) | 4 | 5 | |||
| NGC 6397 | 0 | 12 | |||
| Terzan 5 | 26 | 13 | |||
| NGC 6440 | 4 | 14 | |||
| NGC 6441 | |||||
| NGC 6517 | 1 | 2 | |||
| NGC 6522 | 1 | 5 | |||
| NGC 6539 | 4 | 5 | |||
| NGC 6544 | 1 | 5 | |||
| NGC 6624 | |||||
| M28 (NGC 6626) | 7 | 5 | |||
| NGC 6652 | 3 | 15 | |||
| M22 (NGC 6656) | 1 | 5 | |||
| NGC 6712 | |||||
| NGC 6749 | |||||
| NGC 6752 | 0 | 16 | |||
| NGC 6760 | 0 | 5 | |||
| M71 (NGC 6838) | 0 | 17,18 | |||
| M15 (NGC 7078) | |||||
| M2 (NGC 7089) | 6 | 5 | |||
| M30 (NGC 7099) | 0 | 19 | |||
| Total | |||||
| Notes: a Calculations of MSP population for 10 GCs by Bagchi et al. (2011) | |||||
| b Conservative estimates of GC MSP population | |||||
| c Aggressive estimates of GC MSP population | |||||
| d Unidentified X-ray sources with erg s-1 (0.3–8 keV) | |||||
| e Selected as normalization | |||||
| Reference of Nunid: (1) Heinke et al. (2005); (2) this work; (3) Henleywillis et al. (2018); (4) Zhao et al. (2019); (5) Bahramian et al. (2020); (6) Bassa et al. (2004); (7) Servillat et al. (2011); (8) Lu et al. (2009); (9) Oh et al. (2020); (10) Lu et al. (2011); (11) Cackett et al. (2006); (12) Bogdanov et al. (2010); (13) Heinke et al. (2006b); (14) Pooley et al. (2002); (15) Stacey et al. (2012); (16) Forestell et al. (2014); (17) Elsner et al. (2008); (18) Huang et al. (2010); (19) Zhao et al. (2020b) | |||||
4 Discussion
The radio MSPs in Cen were not discovered until a more advanced receiver, an ultra-wide-bandwidth low-frequency receiver (Hobbs et al., 2020), was installed and used on the Parkes radio telescope. Before that, however, some studies in other bands had hinted at the existence of MSPs in Cen. For example, Abdo et al. (2010) suggested a total of MSPs harboured in Cen based on gamma-ray detection of the cluster by the Fermi Large Area Telescope (LAT). A deep X-ray survey of Cen by Henleywillis et al. (2018) also implied the presence of MSPs, given that tens of unidentified sources have similar X-ray colours with the MSPs detected in 47 Tuc. Intriguingly, the X-ray counterpart to one of the MSPs in Cen (J13264728B; analyzed in this work) has been detected in previous X-ray studies (Haggard et al., 2009; Henleywillis et al., 2018, source ID 13d in their tables).
However, it is possible to nominate unidentified sources detected in other bands (e.g. X-rays and gamma-rays) as radio MSP candidates based on their observational properties. In fact, a large number of radio MSPs have recently been discovered by targeting LAT unassociated sources (see e.g. Ray et al., 2012). Moreover, dedicated analysis with X-ray, gamma-ray and optical observations also can lead to discoveries of new MSPs. For instance, Bogdanov et al. (2010) suggested an X-ray source in the cluster NGC 6397 (source ID U18 in their work) as a strong MSP candidate, given its similar X-ray and optical properties to those of the known MSP, PSR J17405340, in the cluster. Later, Zhao et al. (2020a) found the radio counterpart to U18 using the Australia Telescope Compact Array, while Pichardo Marcano et al. (2021) reported the optical modulation of the companion star to U18, and both of their studies provided strong evidence that U18 is a “hidden” redback MSP. The radio pulsations from this source have been detected recently by the Parkes radio telescope (Lei Zhang et al. 2021, in prep.), verifying it as a redback MSP (PSR J17405340B). The reason of previous non-detection of radio pulsations can be interpreted as scattering of the radio pulsations by wind from the companion (Zhao et al., 2020a).
Considering the fact that there might be a group of hidden MSPs observed in X-rays but without radio confirmation, like PSRs J13264728B and J17405340B, it is also interesting to investigate the faint unidentified X-ray sources, especially those with erg s-1, where the non-thermal X-ray emission dominates. We count all the unidentified X-ray sources with erg s-1 (0.3–8 keV) in our studied GCs in Table 12 (column 5). We found a total of 87 unidentified X-ray sources with erg s-1 in 29 GCs, while we did not find any unidentified sources with erg s-1 in those GCs. However, we note a special case, the X-ray source B in NGC 6652 (see Heinke et al., 2001; Stacey et al., 2012), which is suggested as a transitional MSP (tMSP) in a recent work by Paduano et al. (2021). It is considered to be in an accretion-powered state currently, with an average X-ray luminosity of erg s-1. However, since we cannot completely confirm the nature of this source until its rotation-powered MSP state is detected, we just treat it as an unidentified source with erg s-1 in this work. Terzan 5 contains a large number of unidentified X-ray sources, which we attribute to its high stellar encounter rate (the highest among known GCs, Bahramian et al. 2013), and the large interstellar extinction towards the cluster (Massari et al., 2012), which makes identification of optical counterparts extremely difficult (cf. Testa et al., 2012; Ferraro et al., 2015); a general search for optical/infrared counterparts of Terzan 5 X-ray sources has not yet been conducted. Another two interesting GCs are M14 and M2, where the MSPs therein were discovered recently by FAST (Pan et al., 2021b). All the detected MSPs in these two clusters are found in binary systems, while one BW and two eclipsing RB MSPs were found in M14. Since it is common that eclipsing RBs have X-ray luminosities of erg s-1 (see Table 10), the X-ray counterparts to the two newly found RBs might be included in those unidentified sources. However, due to the lack of deep X-ray observations and radio timing solutions of these MSPs, investigation of their X-ray properties is not yet possible.
Our results allow an estimate of the X-ray detectable MSP population in the Galactic centre. An excess of gamma-rays, peaking at 2 GeV, has been found towards the Galactic centre (also known as the Galactic Centre Excess, or GCE, see e.g., Hooper & Goodenough, 2011; Gordon & Macías, 2013; Ajello et al., 2016; Daylan et al., 2016), the origin of which remains unclear. Some studies suggested that the excess is generated from dark matter annihilation (e.g. Hooper & Goodenough, 2011; Daylan et al., 2016; Ackermann et al., 2017; Di Mauro, 2021), whereas other groups claimed that a population of unresolved MSPs in the Galactic bulge produces the observed gamma-ray excess (e.g., Abazajian & Kaplinghat, 2012; Brandt & Kocsis, 2015; Gonthier et al., 2018; Macias et al., 2018). If a large number of MSPs are present in the Galactic centre, one can also expect they are emitting X-rays. While Fermi LAT has a relatively poor angular resolution of (1 degree),101010https://fermi.gsfc.nasa.gov/science/instruments/table1-1.html Chandra’s high angular resolution of 0.5 arcsec111111https://asc.harvard.edu/proposer/POG/ allows the possible detection of X-ray counterparts to MSPs as point sources in the Galactic centre. However, the large interstellar extinction towards the Galactic centre absorbs nearly all X-ray emission below 2 keV, rendering faint MSPs producing only soft blackbody-like emission (the majority of MSPs) undetectable. Only a few X-ray-bright MSPs with substantial magnetospheric (such as PSR B182124A in M28) or shock-powered (redbacks) X-ray emission might be detected around the Galactic centre by Chandra, or even XMM-Newton (with its larger point-spread function of 10").
Using our X-ray census of GC MSPs and our estimates of the total population of MSPs in those GCs, we are able to estimate the population of easily detectable X-ray MSPs ( erg s-1 in the band 0.3–8 keV) in the Galactic bulge. We first adopt the prediction by Gonthier et al. (2018), who suggested a total of 11,000 MSPs in the Galactic bulge are needed to produce the GCE. The number of MSPs required to explain the GCE has been estimated at 10,000–20,000 (Yuan & Zhang, 2014), 2,000–14,000 (Cholis et al., 2015), 40,000 (Ploeg et al., 2017), or 10,000 (Gonthier et al., 2018), and consequently our estimation may also vary from other predictions of the number of MSPs. To calculate a lower limit of detectable X-ray MSPs in the Galactic center, we assume PSR B182124A is the only MSP with an X-ray luminosity more than erg s-1 among 1500 MSPs (the conservative estimate in Table 12), and the MSP population in the Galactic bulge keeps the same proportion. Allowing for small-number statistics (Gehrels, 1986) gives an estimate of 1 MSP above erg/s for 8,700 MSPs (a 1 lower limit), and thus predicts of order 1 MSP with erg/s in the Galactic bulge. On the other hand, if we assume the upper limit of the number of MSPs with erg s-1 (2; considering NGC 6652B) and take the “aggressive” lower estimate of 590 MSPs in these GCs, then we obtain an upper limit (1) of easily detectable MSPs of 1 MSP above erg/s for 126 MSPs, and thus predict of order 86 such easily detectable MSPs in the Galactic Centre. Performing the same calculation for erg/s (still very achievable with Chandra in the Galactic Centre) gives a predicted range of 20 to 910 X-ray detectable MSPs in the Galactic Centre. These predictions are consistent with those of Berteaud et al. (2020), which used an alternative method of inferring X-ray luminosity functions from gamma-ray luminosity functions. Careful study of X-ray sources in the Galactic Bulge may be able to identify plausible MSP candidates, or rule out such an MSP candidate population, which would favour a dark matter interpretation for the GCE. We will look into available Chandra and XMM-Newton observations towards the Galactic Centre to identify candidate MSPs therein, in future works.
| (erg s-1) | N | N | N |
|---|---|---|---|
| 5 | 41 | ||
| 2 | 20 | ||
| 1 | 2 | ||
| aUnabsorbed luminosities in 0.3–8 keV | |||
| bNumber of detected MSPs in GCs | |||
| cUpper limit of the number of MSPs in GCs | |||
| dEstimated number of MSPs in the bulge | |||
5 Conclusions
In this work, we compiled X-ray luminosities of MSPs in GCs, including new X-ray analysis. We analysed the X-ray spectra of two MSPs (PSR J13264728A and J13264728B) in the cluster Cen. The unabsorbed X-ray luminosities in the band 0.3–8 keV of these two MSPs are erg s-1 and erg s-1, respectively. The X-ray spectrum of PSR J13264728A is well described by either a BB or a NSATMOS model, indicating thermal X-ray emission from the neutron star surface. The spectrum of PSR J13264728B is well-fit by a PL model, with a photon index of . Its spectrum reflects the bulk of non-thermal X-ray emission from the MSP, which is commonly observed from eclipsing spider pulsars and likely produced by intra-binary shocks. We also presented new X-ray analyses for PSRs J15180204C, J17174308A, J17370314A, and J18072459A in GCs M5, M92, M14, and NGC 6544, respectively. The X-ray spectrum of J17174308A is well described by a composition of a PL model and a BB model, with a photon index of 1.20.6 and an effective temperature of (1.90.5)106 K. The unabsorbed luminosity in the band 0.3–8 keV of J17174308A is (8.32.1)1031 erg s-1, consisting of both thermal and non-thermal emission. The spectra of other three newly analyzed MSPs (J15180204C, J17370314A, and J18072459A) are well fitted by a single BB model, with X-ray luminosities (0.3–8 keV) ranging from 1.11031 erg s-1 to 6.61031 erg s-1. We also catalogued the X-ray sources in the clusters M53, NGC 6342, and NGC 6517. We found a total of 12 X-ray sources in these three GCs, with X-ray luminosities ranging from erg s-1 to erg s-1.
We presented a comprehensive census of X-ray MSPs in 29 Galactic GCs. We reported the X-ray luminosities or upper limits for 175 GC MSPs in our catalogue, and normalized the energy band to 0.3–8 keV. We determined X-ray luminosities for 68 GC MSPs and constrained the luminosities for others, except MSPs in 2 GCs that have no Chandra observations, and in 5 GCs that are severely contaminated by bright X-ray sources. We investigated the empirical MSP X-ray luminosity function using our catalogue, finding that most detected GC X-ray MSPs have luminosities between erg s-1 and erg s-1. The X-ray luminosities for eclipsing spider MSPs are generally higher than other types of MSPs, with erg s-1.
We re-examined the correlation between the number of MSPs and stellar encounter rate in a GC. Using the estimates of numbers of MSPs in several clusters from Bagchi et al. (2011) and the stellar interaction rates of Bahramian et al. (2013), we found a relation of ), which we take as an upper limit to the numbers of MSPs in clusters. We also estimated a lower limit using the numbers of known MSPs in the most well-observed clusters 47 Tuc and M13, and assuming that other clusters follow the same relation of stellar interaction rate and number of MSPs, (). We estimated the total number of MSPs in each of the GCs in this work using both fitting relations, and suggested a conservative upper estimate of 1500 MSPs and an aggressive lower estimate of 590 MSPs, respectively, in those 36 GCs.
We empirically estimated the population of detectable MSPs in the Galactic bulge, assuming the gamma-ray excess is produced by a large number of unresolved MSPs. Based on our census of GC X-ray MSPs, we suggested of order 1-90 MSPs with erg s-1 in the Galactic centre, and of order 20-900 MSPs with erg s-1 there. As these sources are likely detected in existing archival Chandra and XMM-Newton observations, dedicated searches may uncover the proposed Galactic Bulge MSP population.
Acknowledgements
We thank Sharon Morsink, Erik Rosolowsky and Gregory Sivakoff for helpful discussions. JZ thanks Zhichen Pan for the updated information of the timing position of M92A. COH is supported by NSERC Discovery Grant RGPIN-2016-04602. JZ is supported by the China Scholarship Council (CSC). This work has made use of data obtained from the Chandra Data Archive and the Chandra Source Catalogue, and software provided by the Chandra X-ray Centre (CXC) in the application packages ciao, sherpa, ds9, and pimms. This work has made use of data from the European Space Agency (ESA) mission Gaia (https://www.cosmos.esa.int/gaia), processed by the Gaia Data Processing and Analysis Consortium (DPAC, https://www.cosmos.esa.int/web/gaia/dpac/consortium). Funding for the DPAC has been provided by national institutions, in particular the institutions participating in the Gaia Multilateral Agreement. This research has made use of NASA’s Astrophysics Data System Bibliographic Services and arXiv. This research has made use of the VizieR catalogue access tool, CDS, Strasbourg, France (DOI : 10.26093/cds/vizier). The original description of the VizieR service was published in 2000, A&AS 143, 23
Data Availability
The Chandra data used in this article are available in the Chandra Data Archive (https://cxc.harvard.edu/cda/) by searching the Observation ID listed in Table 2 and Table 3 in the Search and Retrieval interface, ChaSeR (https://cda.harvard.edu/chaser/). The Gaia data used in this work are available in the VizieR Information System (https://vizier.cds.unistra.fr/index.gml).
References
- Abazajian & Kaplinghat (2012) Abazajian K. N., Kaplinghat M., 2012, Phys. Rev. D, 86, 083511
- Abdo et al. (2010) Abdo A. A., et al., 2010, A&A, 524, A75
- Ackermann et al. (2017) Ackermann M., et al., 2017, ApJ, 840, 43
- Ajello et al. (2016) Ajello M., et al., 2016, ApJ, 819, 44
- Alpar et al. (1982) Alpar M. A., Cheng A. F., Ruderman M. A., Shaham J., 1982, Nature, 300, 728
- Amato et al. (2019) Amato R., D’Aı A., Del Santo M., de Martino D., Marino A., Di Salvo T., Iaria R., Mineo T., 2019, MNRAS, 486, 3992
- Andersen & Ransom (2018) Andersen B. C., Ransom S. M., 2018, ApJ, 863, L13
- Anderson et al. (1997) Anderson S. B., Wolszczan A., Kulkarni S. R., Prince T. A., 1997, ApJ, 482, 870
- Arons & Tavani (1993) Arons J., Tavani M., 1993, ApJ, 403, 249
- Bagchi et al. (2011) Bagchi M., Lorimer D. R., Chennamangalam J., 2011, MNRAS, 418, 477
- Bahramian et al. (2013) Bahramian A., Heinke C. O., Sivakoff G. R., Gladstone J. C., 2013, ApJ, 766, 136
- Bahramian et al. (2015) Bahramian A., Heinke C. O., Degenaar N., Chomiuk L., Wijnands R., Strader J., Ho W. C. G., Pooley D., 2015, MNRAS, 452, 3475
- Bahramian et al. (2020) Bahramian A., et al., 2020, ApJ, 901, 57
- Bailes et al. (2011) Bailes M., et al., 2011, Science, 333, 1717
- Bassa et al. (2004) Bassa C., et al., 2004, ApJ, 609, 755
- Baumgardt & Vasiliev (2021) Baumgardt H., Vasiliev E., 2021, MNRAS, 505, 5957
- Becker et al. (2003) Becker W., et al., 2003, ApJ, 594, 798
- Begin (2006) Begin S., 2006, PhD thesis, University of British Columbia, doi:http://dx.doi.org/10.14288/1.0066153, https://open.library.ubc.ca/collections/ubctheses/24/items/1.0066153
- Berteaud et al. (2020) Berteaud J., Calore F., Clavel M., Serpico P. D., Dubus G., Petrucci P.-O., 2020, arXiv e-prints, p. arXiv:2012.03580
- Bhattacharya & van den Heuvel (1991) Bhattacharya D., van den Heuvel E. P. J., 1991, Phys. Rep., 203, 1
- Bhattacharya et al. (2017) Bhattacharya S., Heinke C. O., Chugunov A. I., Freire P. C. C., Ridolfi A., Bogdanov S., 2017, MNRAS, 472, 3706
- Bogdanov (2013) Bogdanov S., 2013, ApJ, 762, 96
- Bogdanov & Grindlay (2009) Bogdanov S., Grindlay J. E., 2009, ApJ, 703, 1557
- Bogdanov et al. (2006) Bogdanov S., Grindlay J. E., Heinke C. O., Camilo F., Freire P. C. C., Becker W., 2006, ApJ, 646, 1104
- Bogdanov et al. (2010) Bogdanov S., van den Berg M., Heinke C. O., Cohn H. N., Lugger P. M., Grindlay J. E., 2010, ApJ, 709, 241
- Bogdanov et al. (2011) Bogdanov S., et al., 2011, ApJ, 730, 81
- Bogdanov et al. (2021) Bogdanov S., Bahramian A., Heinke C. O., Freire P. C. C., Hessels J. W. T., Ransom S. M., Stairs I. H., 2021, ApJ, 912, 124
- Brandt & Kocsis (2015) Brandt T. D., Kocsis B., 2015, ApJ, 812, 15
- Cackett et al. (2006) Cackett E. M., et al., 2006, MNRAS, 369, 407
- Cadelano et al. (2018) Cadelano M., Ransom S. M., Freire P. C. C., Ferraro F. R., Hessels J. W. T., Lanzoni B., Pallanca C., Stairs I. H., 2018, ApJ, 855, 125
- Camilo et al. (2000) Camilo F., Lorimer D. R., Freire P., Lyne A. G., Manchester R. N., 2000, ApJ, 535, 975
- Cardelli et al. (1989) Cardelli J. A., Clayton G. C., Mathis J. S., 1989, ApJ, 345, 245
- Cash (1979) Cash W., 1979, ApJ, 228, 939
- Cheng et al. (2019) Cheng Z., Li Z., Li X., Xu X., Fang T., 2019, ApJ, 876, 59
- Cholis et al. (2015) Cholis I., Hooper D., Linden T., 2015, J. Cosmology Astropart. Phys., 2015, 043
- Cool et al. (2013) Cool A. M., Haggard D., Arias T., Brochmann M., Dorfman J., Gafford A., White V., Anderson J., 2013, ApJ, 763, 126
- D’Amico et al. (1993) D’Amico N., Bailes M., Lyne A. G., Manchester R. N., Johnston S., Fruchter A. S., Goss W. M., 1993, MNRAS, 260, L7
- D’Amico et al. (2001) D’Amico N., Lyne A. G., Manchester R. N., Possenti A., Camilo F., 2001, ApJ, 548, L171
- Dai et al. (2020) Dai S., Johnston S., Kerr M., Camilo F., Cameron A., Toomey L., Kumamoto H., 2020, ApJ, 888, L18
- Daylan et al. (2016) Daylan T., Finkbeiner D. P., Hooper D., Linden T., Portillo S. K. N., Rodd N. L., Slatyer T. R., 2016, Physics of the Dark Universe, 12, 1
- DeCesar et al. (2015) DeCesar M. E., Ransom S. M., Kaplan D. L., Ray P. S., Geller A. M., 2015, ApJ, 807, L23
- Deich et al. (1993) Deich W. T. S., Middleditch J., Anderson S. B., Kulkarni S. R., Prince T. A., Wolszczan A., 1993, ApJ, 410, L95
- Di Mauro (2021) Di Mauro M., 2021, Phys. Rev. D, 103, 063029
- Edmonds et al. (2003) Edmonds P. D., Gilliland R. L., Heinke C. O., Grindlay J. E., 2003, ApJ, 596, 1177
- Elsner et al. (2008) Elsner R. F., et al., 2008, ApJ, 687, 1019
- Fabian et al. (1975) Fabian A. C., Pringle J. E., Rees M. J., 1975, MNRAS, 172, 15
- Ferraro et al. (2015) Ferraro F. R., Pallanca C., Lanzoni B., Cadelano M., Massari D., Dalessandro E., Mucciarelli A., 2015, ApJ, 807, L1
- Forestell et al. (2014) Forestell L. M., Heinke C. O., Cohn H. N., Lugger P. M., Sivakoff G. R., Bogdanov S., Cool A. M., Anderson J., 2014, MNRAS, 441, 757
- Freire (2005) Freire P. C. C., 2005, in Rasio F. A., Stairs I. H., eds, Astronomical Society of the Pacific Conference Series Vol. 328, Binary Radio Pulsars. p. 405 (arXiv:astro-ph/0404105)
- Freire et al. (2001a) Freire P. C., Camilo F., Lorimer D. R., Lyne A. G., Manchester R. N., D’Amico N., 2001a, MNRAS, 326, 901
- Freire et al. (2001b) Freire P. C., Kramer M., Lyne A. G., Camilo F., Manchester R. N., D’Amico N., 2001b, ApJ, 557, L105
- Freire et al. (2005) Freire P. C. C., Hessels J. W. T., Nice D. J., Ransom S. M., Lorimer D. R., Stairs I. H., 2005, ApJ, 621, 959
- Freire et al. (2008) Freire P. C. C., Ransom S. M., Bégin S., Stairs I. H., Hessels J. W. T., Frey L. H., Camilo F., 2008, ApJ, 675, 670
- Freire et al. (2017) Freire P. C. C., et al., 2017, MNRAS, 471, 857
- Fruchter & Goss (1992) Fruchter A. S., Goss W. M., 1992, ApJ, 384, L47
- Fruscione et al. (2006) Fruscione A., et al., 2006, in Silva D. R., Doxsey R. E., eds, Society of Photo-Optical Instrumentation Engineers (SPIE) Conference Series Vol. 6270, Society of Photo-Optical Instrumentation Engineers (SPIE) Conference Series. p. 62701V, doi:10.1117/12.671760
- Gaia Collaboration et al. (2016) Gaia Collaboration et al., 2016, A&A, 595, A1
- Gaia Collaboration et al. (2021) Gaia Collaboration et al., 2021, A&A, 649, A1
- Gehrels (1986) Gehrels N., 1986, ApJ, 303, 336
- Giacconi et al. (2001) Giacconi R., et al., 2001, ApJ, 551, 624
- Gonthier et al. (2018) Gonthier P. L., Harding A. K., Ferrara E. C., Frederick S. E., Mohr V. E., Koh Y.-M., 2018, ApJ, 863, 199
- Gordon & Macías (2013) Gordon C., Macías O., 2013, Phys. Rev. D, 88, 083521
- Guillot et al. (2019) Guillot S., et al., 2019, ApJ, 887, L27
- Haggard et al. (2009) Haggard D., Cool A. M., Davies M. B., 2009, ApJ, 697, 224
- Harding & Muslimov (2002) Harding A. K., Muslimov A. G., 2002, ApJ, 568, 862
- Harris (1996) Harris W. E., 1996, AJ, 112, 1487
- Heinke et al. (2001) Heinke C. O., Edmonds P. D., Grindlay J. E., 2001, ApJ, 562, 363
- Heinke et al. (2003) Heinke C. O., Grindlay J. E., Lugger P. M., Cohn H. N., Edmonds P. D., Lloyd D. A., Cool A. M., 2003, ApJ, 598, 501
- Heinke et al. (2005) Heinke C. O., Grindlay J. E., Edmonds P. D., Cohn H. N., Lugger P. M., Camilo F., Bogdanov S., Freire P. C., 2005, ApJ, 625, 796
- Heinke et al. (2006a) Heinke C. O., Rybicki G. B., Narayan R., Grindlay J. E., 2006a, ApJ, 644, 1090
- Heinke et al. (2006b) Heinke C. O., Wijnands R., Cohn H. N., Lugger P. M., Grindlay J. E., Pooley D., Lewin W. H. G., 2006b, ApJ, 651, 1098
- Heinke et al. (2010) Heinke C. O., et al., 2010, ApJ, 714, 894
- Henleywillis et al. (2018) Henleywillis S., Cool A. M., Haggard D., Heinke C., Callanan P., Zhao Y., 2018, MNRAS, 479, 2834
- Hessels et al. (2007) Hessels J. W. T., Ransom S. M., Stairs I. H., Kaspi V. M., Freire P. C. C., 2007, ApJ, 670, 363
- Hills (1976) Hills J. G., 1976, MNRAS, 175, 1P
- Hobbs et al. (2020) Hobbs G., et al., 2020, Publ. Astron. Soc. Australia, 37, e012
- Hooper & Goodenough (2011) Hooper D., Goodenough L., 2011, Physics Letters B, 697, 412
- Huang et al. (2010) Huang R. H. H., Becker W., Edmonds P. D., Elsner R. F., Heinke C. O., Hsieh B. C., 2010, A&A, 513, A16
- Igoshev et al. (2016) Igoshev A., Verbunt F., Cator E., 2016, A&A, 591, A123
- Kandel et al. (2019) Kandel D., Romani R. W., An H., 2019, ApJ, 879, 73
- Kaplan et al. (2018) Kaplan D. L., Stovall K., van Kerkwijk M. H., Fremling C., Istrate A. G., 2018, ApJ, 864, 15
- Kargaltsev & Pavlov (2010) Kargaltsev O., Pavlov G. G., 2010, in Comastri A., Angelini L., Cappi M., eds, American Institute of Physics Conference Series Vol. 1248, X-ray Astronomy 2009; Present Status, Multi-Wavelength Approach and Future Perspectives. pp 25–28 (arXiv:1002.0885), doi:10.1063/1.3475228
- Kulkarni et al. (1991) Kulkarni S. R., Anderson S. B., Prince T. A., Wolszczan A., 1991, Nature, 349, 47
- Lee et al. (2018) Lee J., Hui C. Y., Takata J., Kong A. K. H., Tam P. H. T., Cheng K. S., 2018, ApJ, 864, 23
- Linares et al. (2014) Linares M., et al., 2014, MNRAS, 438, 251
- Lorimer (2008) Lorimer D. R., 2008, Living Reviews in Relativity, 11, 8
- Lu et al. (2009) Lu T.-N., Kong A. K. H., Bassa C., Verbunt F., Lewin W. H. G., Anderson S. F., Pooley D., 2009, ApJ, 705, 175
- Lu et al. (2011) Lu T.-N., Kong A. K. H., Verbunt F., Lewin W. H. G., Anderson S. F., Pooley D., 2011, ApJ, 736, 158
- Lynch et al. (2011) Lynch R. S., Ransom S. M., Freire P. C. C., Stairs I. H., 2011, ApJ, 734, 89
- Lynch et al. (2012) Lynch R. S., Freire P. C. C., Ransom S. M., Jacoby B. A., 2012, ApJ, 745, 109
- Lyne & Manchester (1988) Lyne A. G., Manchester R. N., 1988, MNRAS, 234, 477
- Lyne et al. (2000) Lyne A. G., Mankelow S. H., Bell J. F., Manchester R. N., 2000, MNRAS, 316, 491
- Macias et al. (2018) Macias O., Gordon C., Crocker R. M., Coleman B., Paterson D., Horiuchi S., Pohl M., 2018, Nature Astronomy, 2, 387
- Manchester et al. (1991) Manchester R. N., Lyne A. G., Robinson C., D’Amico N., Bailes M., Lim J., 1991, Nature, 352, 219
- Massari et al. (2012) Massari D., et al., 2012, ApJ, 755, L32
- McConnell et al. (2004) McConnell D., Deshpande A. A., Connors T., Ables J. G., 2004, MNRAS, 348, 1409
- Oh et al. (2020) Oh K., Hui C. Y., Li K. L., Kong A. K. H., 2020, MNRAS, 498, 292
- Paduano et al. (2021) Paduano A., et al., 2021, MNRAS, 506, 4107
- Pallanca et al. (2014) Pallanca C., Ransom S. M., Ferraro F. R., Dalessandro E., Lanzoni B., Hessels J. W. T., Stairs I., Freire P. C. C., 2014, ApJ, 795, 29
- Pan et al. (2020) Pan Z., et al., 2020, ApJ, 892, L6
- Pan et al. (2021a) Pan Z., et al., 2021a, arXiv e-prints, p. arXiv:2103.14927
- Pan et al. (2021b) Pan Z., et al., 2021b, ApJ, 915, L28
- Papitto et al. (2013) Papitto A., et al., 2013, Nature, 501, 517
- Pavlov et al. (2007) Pavlov G. G., Kargaltsev O., Garmire G. P., Wolszczan A., 2007, ApJ, 664, 1072
- Pechenick et al. (1983) Pechenick K. R., Ftaclas C., Cohen J. M., 1983, ApJ, 274, 846
- Pichardo Marcano et al. (2021) Pichardo Marcano M., Rivera Sandoval L. E., Maccarone T. J., Zhao Y., Heinke C. O., 2021, MNRAS, 503, L51
- Ploeg et al. (2017) Ploeg H., Gordon C., Crocker R., Macias O., 2017, J. Cosmology Astropart. Phys., 2017, 015
- Polzin et al. (2018) Polzin E. J., et al., 2018, MNRAS, 476, 1968
- Pooley et al. (2002) Pooley D., et al., 2002, ApJ, 573, 184
- Pooley et al. (2003) Pooley D., et al., 2003, ApJ, 591, L131
- Possenti et al. (2002) Possenti A., Cerutti R., Colpi M., Mereghetti S., 2002, A&A, 387, 993
- Possenti et al. (2003) Possenti A., D’Amico N., Manchester R. N., Camilo F., Lyne A. G., Sarkissian J., Corongiu A., 2003, ApJ, 599, 475
- Possenti et al. (2005) Possenti A., D’Amico N., Corongiu A., Manchester D., Sarkissian J., Camilo F., Lyne A., 2005, in Rasio F. A., Stairs I. H., eds, Astronomical Society of the Pacific Conference Series Vol. 328, Binary Radio Pulsars. p. 189
- Prager et al. (2017) Prager B. J., Ransom S. M., Freire P. C. C., Hessels J. W. T., Stairs I. H., Arras P., Cadelano M., 2017, ApJ, 845, 148
- Qian & Pan (2021) Qian L., Pan Z., 2021, arXiv e-prints, p. arXiv:2107.02749
- Ransom et al. (2001) Ransom S. M., Greenhill L. J., Herrnstein J. R., Manchester R. N., Camilo F., Eikenberry S. S., Lyne A. G., 2001, ApJ, 546, L25
- Ransom et al. (2004) Ransom S. M., Stairs I. H., Backer D. C., Greenhill L. J., Bassa C. G., Hessels J. W. T., Kaspi V. M., 2004, ApJ, 604, 328
- Ransom et al. (2005) Ransom S. M., Hessels J. W. T., Stairs I. H., Freire P. C. C., Camilo F., Kaspi V. M., Kaplan D. L., 2005, Science, 307, 892
- Ray et al. (2012) Ray P. S., et al., 2012, arXiv e-prints, p. arXiv:1205.3089
- Ridolfi et al. (2016) Ridolfi A., et al., 2016, MNRAS, 462, 2918
- Ridolfi et al. (2021) Ridolfi A., et al., 2021, MNRAS, 504, 1407
- Robinson et al. (1995) Robinson C., Lyne A. G., Manchester R. N., Bailes M., D’Amico N., Johnston S., 1995, MNRAS, 274, 547
- Romani et al. (2017) Romani R. W., Slane P., Green A. W., 2017, ApJ, 851, 61
- Rutledge et al. (2004) Rutledge R. E., Fox D. W., Kulkarni S. R., Jacoby B. A., Cognard I., Backer D. C., Murray S. S., 2004, ApJ, 613, 522
- Saito et al. (1997) Saito Y., Kawai N., Kamae T., Shibata S., Dotani T., Kulkarni S. R., 1997, ApJ, 477, L37
- Servillat et al. (2011) Servillat M., Webb N. A., Lewis F., Knigge C., van den Berg M., Dieball A., Grindlay J., 2011, ApJ, 733, 106
- Stacey et al. (2012) Stacey W. S., Heinke C. O., Cohn H. N., Lugger P. M., Bahramian A., 2012, ApJ, 751, 62
- Stappers et al. (2001) Stappers B. W., Bailes M., Lyne A. G., Camilo F., Manchester R. N., Sandhu J. S., Toscano M., Bell J. F., 2001, MNRAS, 321, 576
- Stappers et al. (2003) Stappers B. W., Gaensler B. M., Kaspi V. M., van der Klis M., Lewin W. H. G., 2003, Science, 299, 1372
- Swiggum et al. (2017) Swiggum J. K., et al., 2017, ApJ, 847, 25
- Testa et al. (2012) Testa V., et al., 2012, A&A, 547, A28
- Thompson et al. (1994) Thompson C., Blandford R. D., Evans C. R., Phinney E. S., 1994, ApJ, 422, 304
- Thorsett et al. (1993) Thorsett S. E., Arzoumanian Z., McKinnon M. M., Taylor J. H., 1993, ApJ, 405, L29
- Venter et al. (2009) Venter C., Harding A. K., Guillemot L., 2009, ApJ, 707, 800
- Verbunt & Lewin (2006) Verbunt F., Lewin W. H. G., 2006, Globular cluster X-ray sources. pp 341–379
- Verner et al. (1996) Verner D. A., Ferland G. J., Korista K. T., Yakovlev D. G., 1996, ApJ, 465, 487
- Wadiasingh et al. (2018) Wadiasingh Z., Venter C., Harding A. K., Böttcher M., Kilian P., 2018, ApJ, 869, 120
- Wang et al. (2020) Wang L., et al., 2020, ApJ, 892, 43
- Wilms et al. (2000) Wilms J., Allen A., McCray R., 2000, ApJ, 542, 914
- Wolszczan et al. (1989) Wolszczan A., Anderson S., Kulkarni S., Prince T., 1989, IAU Circ., 4880, 1
- Yuan & Zhang (2014) Yuan Q., Zhang B., 2014, Journal of High Energy Astrophysics, 3, 1
- Zavlin et al. (2002) Zavlin V. E., Pavlov G. G., Sanwal D., Manchester R. N., Trümper J., Halpern J. P., Becker W., 2002, ApJ, 569, 894
- Zhang et al. (2020) Zhang L., et al., 2020, ApJ, 905, L8
- Zhao et al. (2019) Zhao Y., Heinke C. O., Cohn H. N., Lugger P. M., Cool A. M., 2019, MNRAS, 483, 4560
- Zhao et al. (2020a) Zhao Y., et al., 2020a, MNRAS, 493, 6033
- Zhao et al. (2020b) Zhao Y., et al., 2020b, MNRAS, 499, 3338
- Zhao et al. (2021) Zhao J., Zhao Y., Heinke C. O., 2021, MNRAS, 502, 1596
- de Marchi et al. (1999) de Marchi G., Leibundgut B., Paresce F., Pulone L., 1999, A&A, 343, L9
- in’t Zand et al. (2001) in’t Zand J. J. M., van Kerkwijk M. H., Pooley D., Verbunt F., Wijnands R., Lewin W. H. G., 2001, ApJ, 563, L41
Appendix A Upper limits of X-ray luminosities
We present the upper limits of X-ray luminosities for 107 GC MSPs in Table 14. These MSPs are not eligible for performing specific X-ray spectral analysis, and hence we placed an upper limit of for each of them. The criteria of determining upper limits have been discussed in Section 2.
| Pulsar Name | GC Name | Period | Type | (0.3–8 keV) | References |
|---|---|---|---|---|---|
| (ms) | (1030 erg s-1) | ||||
| J00247204G* | 47 Tuc (NGC 104) | 4.04 | I | 20 | 1 |
| J00247204I* | 47 Tuc (NGC 104) | 3.48 | BW | 20 | 1 |
| J00247204P | 47 Tuc (NGC 104) | 3.64 | BW | 20 | 2 |
| J00247204V | 47 Tuc (NGC 104) | 4.81 | eRB | 20 | 2 |
| J00247204ac | 47 Tuc (NGC 104) | 2.74 | eBW | 20 | 3 |
| J00247204ad | 47 Tuc (NGC 104) | 3.74 | eRB | 20 | 3 |
| J1312+1810B | M53 (NGC 5024) | 6.24 | B | 760 | 4 |
| J1312+1810C | M53 (NGC 5024) | 12.53 | I | 760 | 4 |
| J1312+1810D | M53 (NGC 5024) | 6.07 | B | 760 | 4 |
| J13264728C | Cen (NGC 5139) | 6.87 | I | 300 | 5 |
| J13264728D | Cen (NGC 5139) | 4.58 | I | 300 | 5 |
| J13264728E | Cen (NGC 5139) | 4.21 | I | 300 | 5 |
| J1342+2822A | M3 (NGC 5272) | 2.55 | BW | 13 | 6 |
| J1342+2822B* | M3 (NGC 5272) | 2.39 | B | 9 | 6 |
| J1342+2822C | M3 (NGC 5272) | 2.17 | I | 13 | 6 |
| J1342+2822D* | M3 (NGC 5272) | 5.44 | B | 13 | 6 |
| J1342+2822E | M3 (NGC 5272) | 5.47 | B | 13 | 6 |
| J1342+2822F | M3 (NGC 5272) | 4.4 | B | 13 | 6 |
| B1516+02A* | M5 (NGC 5904) | 5.55 | I | 2 | 7 |
| B1516+02B* | M5 (NGC 5904) | 7.95 | B | 2 | 7 |
| J1518+0204D | M5 (NGC 5904) | 2.99 | B | 160 | 9 |
| J1518+0204E | M5 (NGC 5904) | 3.18 | B | 160 | 9 |
| J1518+0204F | M5 (NGC 5904) | 2.65 | B | 160 | 10 |
| J1518+0204G | M5 (NGC 5904) | 2.75 | B | 160 | 11 |
| J1641+3627A* | M13 (NGC 6205) | 10.38 | I | 1 | 12 |
| J16470156A | M12 (NGC 6218) | 2.36 | B | 190 | 13 |
| J16570406A | M10 (NGC 6254) | 4.73 | - | 59 | 14 |
| J16570406B | M10 (NGC 6254) | 7.35 | B | 59 | 14 |
| J17013006A* | M62 (NGC 6266) | 5.24 | B | 4 | 15 |
| J17013006D* | M62 (NGC 6266) | 3.42 | B | 7 | 16 |
| J17013006E* | M62 (NGC 6266) | 3.23 | eBW | 56 | 16 |
| J17013006F* | M62 (NGC 6266) | 2.29 | BW | 36 | 16 |
| J17013006G | M62 (NGC 6266) | 4.61 | B | 100 | 17 |
| J17211936B | NGC 6342 | 2.57 | I | 380 | 19 |
| J17353028B | Terzan 1 | 11.14 | I | 85 | 20 |
| J17353028C | Terzan 1 | 6.04 | I | 85 | 20 |
| J17353028D | Terzan 1 | 5.39 | I | 85 | 20 |
| J17353028E | Terzan 1 | 3.08 | I | 85 | 20 |
| J17353028F | Terzan 1 | 5.21 | I | 85 | 20 |
| J17353028G | Terzan 1 | 3.92 | I | 85 | 20 |
| J17370314B | M14 (NGC 6402) | 8.52 | B | 720 | 10 |
| J17370314C | M14 (NGC 6402) | 8.46 | B | 720 | 10 |
| J17370314D | M14 (NGC 6402) | 2.89 | eRB | 720 | 10 |
| J17370314E | M14 (NGC 6402) | 2.28 | eRB | 720 | 10 |
| J17482446C* | Terzan 5 | 8.44 | I | 1 | 21 |
| J17482446D* | Terzan 5 | 4.71 | I | 1 | 22 |
| J17482446G* | Terzan 5 | 21.67 | I | 3 | 22 |
| J17482446I* | Terzan 5 | 9.57 | B | 3 | 22 |
| J17482446M* | Terzan 5 | 3.57 | B | 3 | 22 |
| J17482446R* | Terzan 5 | 5.03 | I | 3 | 22 |
| J17482446S* | Terzan 5 | 6.12 | I | 3 | 22 |
| J17482446T* | Terzan 5 | 7.08 | I | 3 | 22 |
| J17482446U* | Terzan 5 | 3.29 | B | 3 | 22 |
| J17482446W* | Terzan 5 | 4.21 | B | 3 | 22 |
| J17482446Y* | Terzan 5 | 2.05 | B | 3 | 22 |
| J17482446aa* | Terzan 5 | 5.79 | I | 3 | 23 |
| J17482446ab* | Terzan 5 | 5.12 | I | 3 | 23 |
| J17482446ac* | Terzan 5 | 5.09 | I | 3 | 23 |
| J17482446ae* | Terzan 5 | 3.66 | B | 3 | 23 |
| J17482446af* | Terzan 5 | 3.3 | I | 3 | 23 |
| J17482446ag* | Terzan 5 | 4.45 | I | 3 | 23 |
| J17482446ah* | Terzan 5 | 4.97 | I | 3 | 23 |
| Pulsar Name | GC Name | Period | Type | (0.3–8 keV) | References |
|---|---|---|---|---|---|
| (ms) | (1030 erg s-1) | ||||
| J17482446ai* | Terzan 5 | 21.23 | B | 3 | 23 |
| J17482446aj* | Terzan 5 | 2.96 | I | 3 | 24 |
| J17482446ak* | Terzan 5 | 1.89 | I | 3 | 24 |
| J17482446al | Terzan 5 | 5.95 | I | 3 | 24 |
| J17482446am* | Terzan 5 | 2.93 | B | 3 | 25 |
| J17482446an* | Terzan 5 | 4.8 | B | 3 | 26 |
| J17482021B* | NGC 6440 | 16.76 | B | 160 | 27 |
| J17482021C* | NGC 6440 | 6.23 | I | 16 | 27 |
| J17482021D* | NGC 6440 | 13.5 | eRB | 19 | 27 |
| J17482021E* | NGC 6440 | 16.26 | I | 11 | 27 |
| J17482021F* | NGC 6440 | 3.79 | B | 17 | 27 |
| J17482021G | NGC 6440 | 5.21 | I | 260 | 28 |
| J17482021H | NGC 6440 | 2.85 | B | 260 | 28 |
| J18010857A* | NGC 6517 | 7.18 | I | 16 | 29 |
| J18010857C* | NGC 6517 | 3.74 | I | 100 | 29 |
| J18010857D* | NGC 6517 | 4.23 | I | 30 | 29 |
| J18010857E* | NGC 6517 | 7.6 | I | 240 | 30 |
| J18010857F* | NGC 6517 | 24.89 | I | 240 | 30 |
| J18010857H* | NGC 6517 | 5.64 | I | 30 | 30 |
| J18010857I | NGC 6517 | 3.25 | I | 240 | 30 |
| J18033002A* | NGC 6522 | 7.1 | I | 5 | 31 |
| J18033002B | NGC 6522 | 4.4 | I | 500 | 32 |
| J18033002C | NGC 6522 | 5.84 | I | 500 | 32 |
| J18033002D | NGC 6522 | 5.53 | I | 500 | 33 |
| B180207* | NGC 6539 | 23.1 | B | 16 | 34 |
| J18072459B* | NGC 6544 | 4.19 | B | 6 | 36 |
| J18242452B* | M28 (NGC 6626) | 6.55 | I | 3 | 37 |
| J18242452G* | M28 (NGC 6626) | 5.91 | BW | 13 | 37 |
| J18242452L | M28 (NGC 6626) | 4.1 | BW | 220 | 38 |
| J18242452M | M28 (NGC 6626) | 9.57 | B | 820 | 39 |
| J18242452N | M28 (NGC 6626) | 3.35 | BW | 820 | 39 |
| J18353259A | NGC 6652 | 3.89 | B | 110 | 40 |
| J18353259B | NGC 6652 | 1.83 | B | 110 | 41 |
| J18362354B* | M22 (NGC 6656) | 3.23 | I | 1 | 42 |
| J19105959G | NGC 6752 | 4.79 | I | 50 | 43 |
| J19105959H | NGC 6752 | 2.01 | I | 50 | 43 |
| J19105959I | NGC 6752 | 2.65 | I | 50 | 43 |
| J1911+0102A* | NGC 6760 | 3.62 | BW | 10 | 44 |
| J1911+0102B* | NGC 6760 | 5.38 | I | 10 | 45 |
| J21330049A | M2 (NGC 7089) | 10.15 | B | 860 | 10 |
| J21330049B | M2 (NGC 7089) | 6.97 | B | 860 | 10 |
| J21330049C | M2 (NGC 7089) | 3 | B | 860 | 10 |
| J21330049D | M2 (NGC 7089) | 4.22 | B | 860 | 10 |
| J21330049E | M2 (NGC 7089) | 3.7 | B | 860 | 10 |
| J21402310B | M30 (NGC 7099) | 13 | B | 11 | 46 |
Notes: *MSPs with precise timing positions.
References (for X-ray limits, and pulsar properties121212See http://www.naic.edu/~pfreire/GCpsr.html for up-to-date radio pulsar properties):
1) Manchester et al. (1991); Robinson et al. (1995); Freire et al. (2001a); Heinke
et al. (2005); Freire
et al. (2017);
2) Camilo et al. (2000); Ridolfi
et al. (2016); Heinke
et al. (2005);
3) Heinke
et al. (2005); Ridolfi
et al. (2021);
4) Pan et al. (2021b) and this work;
5) Henleywillis et al. (2018); Dai et al. (2020);
6) Hessels et al. (2007); Zhao et al. (2019); Pan et al. (2021b); Qian &
Pan (2021), this work;
7) Anderson et al. (1997), this work;
8) Hessels et al. (2007); Pallanca
et al. (2014), this work;
9) Hessels et al. (2007); Bahramian
et al. (2020);
10) Bahramian
et al. (2020); Pan et al. (2021b);
11) Bahramian
et al. (2020), Pan et al. in prep131313https://crafts.bao.ac.cn/pulsar/SP2/;
12) Kulkarni et al. (1991); Wang
et al. (2020); Zhao
et al. (2021);
13) Lu et al. (2009), Pan & FAST team in prep 141414https://fast.bao.ac.cn/cms/article/65/;
14) Pan et al. (2021b); Bahramian
et al. (2020);
15) D’Amico et al. (2001); Possenti et al. (2003); Lynch et al. (2012), this work;
16) Lynch et al. (2012), this work;
17) Ridolfi
et al. (2021); Oh
et al. (2020);
18) Lu et al. (2011); Pan et al. (2020, 2021b), this work;
19) TRAPUM in prep 151515http://trapum.org/discoveries.html, this work;
20) Cackett
et al. (2006), DeCesar et al. in prep;
21) Lyne et al. (2000); Prager et al. (2017); Bogdanov et al. (2021);
22) Ransom et al. (2005); Prager et al. (2017); Bogdanov et al. (2021);
23) Prager et al. (2017); Bogdanov et al. (2021);
24) Prager et al. (2017); Cadelano
et al. (2018); Bogdanov et al. (2021),
25) Andersen &
Ransom (2018); Bogdanov et al. (2021);
26) Bogdanov et al. (2021); Ridolfi
et al. (2021);
27) Freire et al. (2008), this work;
28) Pooley
et al. (2002), TRAPUM in prep, this work;
29) Lynch et al. (2011), this work;
30) Pan et al. (2021a), this work;
31) Possenti
et al. (2005); Bahramian
et al. (2020); Zhang
et al. (2020), this work;
32) Bahramian
et al. (2020), GBT team in prep;
33) Bahramian
et al. (2020); Ridolfi
et al. (2021);
34) D’Amico et al. (1993); Thorsett et al. (1993), this work;
35) D’Amico et al. (2001); Ransom
et al. (2001); Lynch et al. (2012), this work;
36) Lynch et al. (2012); Bahramian
et al. (2020), this work;
37) Begin (2006); Bogdanov
et al. (2011);
38) Bogdanov
et al. (2011), GBT team in prep;
39) Bahramian
et al. (2020), TRAPUM in prep;
40) Stacey et al. (2012); DeCesar et al. (2015);
41) Stacey et al. (2012), Gautam et al. in prep;
42) Lynch et al. (2011); Bahramian
et al. (2020), this work;
43) Forestell
et al. (2014), TRAPUM in prep;
44) Deich et al. (1993); Freire et al. (2005); Bahramian
et al. (2020), this work;
45) Freire et al. (2005); Bahramian
et al. (2020), this work;
46) Ransom et al. (2004); Zhao
et al. (2020b);