Slow electron-phonon relaxation controls the dynamics of the superconducting resistive transition
Abstract
We investigate the temporal and spatial scales of resistance fluctuations (-fluctuations) at the superconducting resistive transition accessed through voltage fluctuations measurements in thin epitaxial TiN films. This material is characterized by a record slow electron-phonon relaxation, which puts it far beyond the applicability range of the textbook scenario of superconducting fluctuations. The measured Lorentzian spectrum of the -fluctuations identifies their correlation time, which is nearly constant across the transition region and has no relation to the conventional Ginzburg-Landau time scale. Instead, the correlation time coincides with the energy relaxation time determined by a combination of the electron-phonon relaxation and the diffusion in reservoirs. Our data is quantitatively consistent with the model of spontaneous temperature fluctuations and highlight important caveats in the accepted physical picture of the resistive transition in materials with slow electron-phonon relaxation.
The phase transition of a normal conductor to the superconducting state can be imagined as a sudden drop of its resistance to zero at a critical temperature, , as in the very first measurement by Kamerlingh Onnes [1]. In reality, the transition never occurs discontinuously in temperature () and its continuity is associated with spatial and temporal fluctuations of the modulus and phase of the superconducting order parameter. The imprint of these fluctuations on the DC resistance, , or other time-averaged responses can be revealed by zooming into the transition region with a variety of fluctuation spectroscopy approaches [2]. Shifting the focus from static responses towards the dynamics helps to reveal microscopic origin and intrinsic time-scales of the superconducting fluctuations [3, 4, 5].
The textbook [6] scenario of the resistive transition (RT) is based on the time-dependent Ginzburg-Landau (GL) equation that defines a universal time-scale of the superconducting fluctuations – the GL-time – . Here and below we concentrate on the region above , where global superconducting state is not yet set in and the physics of the Berezinskii-Kosterlitz-Thouless (BKT) phase transition [7, 8] and thermal [9, 10, 11, 12] and quantum [13, 14, 15, 16, 17, 18] phase-slips is irrelevant. Accordingly, the defines the correlation time and correlation length of the superconducting order parameter fluctuations which underpin the Aslamazov-Larkin (AL) [19, 20] and the Maki-Thompson [21, 22] paraconductivity contributions. This appealingly simple picture is valid under the assumption of sufficiently fast electron-phonon (e-ph) relaxation, characterized by the relaxation time , namely for . In the AL theory, this allows one to neglect so-called nonlinear fluctuation effects, which increase the correlation time and make the AL contribution more singular at [23, 6]. More generally, it is this assumption, also known as the approximation of local equilibrium [24, 25], that underpins the microscopic derivation of the whole set of dynamic equations of superconductivity, including the time-dependent GL equation [24, 25, 26, 27, 28]. In local equilibrium spontaneous fluctuations associated with the fast energy exchange between the electrons and acoustic phonons effectively average out during a much slower fluctuation of the superconducting order parameter.
Over the last decades, numerous experimental and theoretical works have addressed the problem of fluctuations at the RT in thin superconducting films [29, 30, 31, 32, 33, 34, 35, 36, 37, 38, 39, 40, 41, 42, 43], without reaching a consensus about their microscopic origin and time-scales. To our best knowledge, no experimental evidence of the GL-time at the RT exists and this may not be surprising, since the applicability range of the time-dependent GL theory in terms of the ratio is usually too narrow [25]. Thus, the microscopic origin of the dynamics of the superconducting fluctuations at the RT, especially in the limit of large , remains an open question of fundamental importance.
In this manuscript, we investigate the dynamics of the RT in thin films of TiN of epitaxial quality. This material is characterized by a record slow e-ph relaxation, at K, and falls beyond the applicability range of the textbook scenarios. The voltage drop on the device is characterized as a stationary random process that takes its origin in spontaneous fluctuations of the resistance (-fluctuations). We measure the noise spectra within a 100 MHz bandwidth and obtain both the variance and the correlation time of the -fluctuations using the Wiener-Khinchin theorem [44]. Near the steepest part of curve, is nearly temperature independent and coincides with the thermal relaxation time, mediated by a competition between the e-ph relaxation and diffusion in the reservoirs. Our results unequivocally identify spontaneous fluctuations of temperature (-fluctuations) as the origin of the -fluctuations and demonstrate the textbook fluctuation scenario of the RT is incomplete.
Our samples are microbridges patterned from epitaxial TiN films of 5 nm to 20 nm thickness () grown on (111) sapphire substrates using DC reactive magnetron sputtering [45]. The fabrication and transport characterization are detailed in the Supplemental Material (SM) [46] and in the accompanying manuscript [47], respectively. In contrast to previously studied strongly disordered TiN films [48, 49, 50, 51, 52, 53], the present material exhibits a uniform monocrystalline structure supported by the X-ray analysis and atomic force microscopy [54, 55, 45]. Consistently, recent transport studies revealed exceptional electronic properties, including surface scattering-limited mean free path, close to the bulk value of , and minute surface magnetic disorder [45].

The noise measurements were performed on five devices patterned in the form of two-terminal rectangular bridges. The characteristics of all studied samples are given in SM [46]. Here we mainly focus on the data from two nm devices for which the length and width of the bridges are , (A1) and , (A2). In both devices a textbook-like dependence is found and displayed in Fig. 1(a) for device A1. At decreasing the residual resistance plateau is seen followed by a sharp transition to the superconducting state. The symbols mark discrete values of where the noise temperature, , was measured as a function of the DC bias current . Here, reflects the spectral density of the voltage fluctuations within a narrow frequency band centered at the resonance of the tank circuit (10 MHz). Details of the noise measurements are discussed in the SM [46]. Fig. 1(b) compares the data in the normal state and at the RT. In the former case (three upper curves), the observed gradual increase of at increasing is determined by the e-ph cooling. As shown in the inset, in a wider range of bias currents the data is well described by a dependence , where is the Joule heating power, is the volume of the device and is the e-ph cooling power, see the dashed lines fits (the same in the inset and in the body of Fig. 1(b)). From this data we determine the e-ph relaxation length via , where is the conductivity and is the Lorenz number [56], which corresponds to at . By contrast, the curve taken at the RT exhibits giant noise at small currents and meets the prediction for the e-ph cooling only at sufficiently high . In the following, we argue that this giant noise comes from the -fluctuations with the time-scale given by the relaxation to the thermal bath.
Fig. 2(a) demonstrates that at small currents the noise obeys a parabolic dependence on , which is a clear signature of spontaneous -fluctuations [44]. The spectral density of the voltage fluctuations equals , where the first term is the Johnson-Nyquist noise and the excess noise is given by , where is the spectral density of the -fluctuations. depends on the chosen and is maximum near the center of the RT, see the locations on the curve marked by corresponding symbols in the inset of Fig. 2(c). As shown in Fig. 2(b), within the same range of the differential resistance changes at most by 10%, meaning that essentially captures the equilibrium -fluctuations.
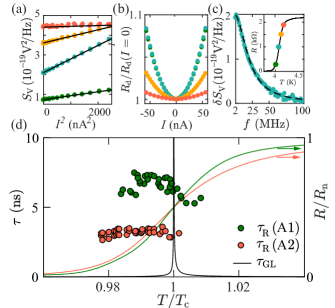
The measurement of the correlation time is achieved by removing the tank circuit at the input of the low- amplifier and measuring the spectrum of the voltage fluctuations within a 100 MHz bandwidth. The calibration of the frequency-dependent gain is a technically challenging procedure, detailed in the SM [46]. As shown in Fig. 2(c), we observe a Lorentzian spectrum , where , see the dashed line fit. According to the Wiener-Khinchin theorem, this evidences the correlation function:
| (1) |
where and are, respectively, the variance and the correlation time of the R-fluctuations.
In Fig. 2(d) we plot obtained at different points across the RT in both devices. Also shown are the normalized curves as a function of . We find that remains approximately constant around the steepest part of the transition, where the voltage fluctuations are maximum and changes by almost an order of magnitude within a temperature range of mK. This is in sharp contrast with the divergent behavior expected for the GL time, shown by the solid line. Note that lies in the range of a few nanoseconds by far exceeding everywhere except for the immediate vicinity of this divergence. Notably, depends on the dimensions of the device being roughly twice smaller in a shorter device A2. The origin of this size effect becomes clear from the -dependence of in a much wider temperature range, as explained below.
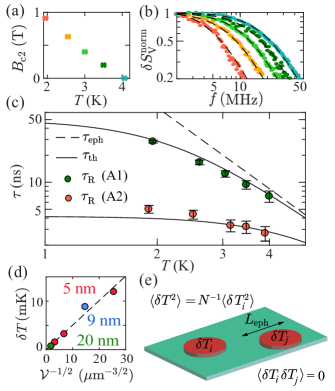
We extend the -range of the fluctuation measurements by shifting in a magnetic field, , applied perpendicular to the film. The -dependence of the second critical magnetic field, , that determines the - correspondence is displayed in Fig. 3(a). The normalized spectra obtained in each of these points are shown in Fig. 3(b) for device A1. At decreasing , the Lorentzian spectra span progressively narrower frequency range, signaling the increase of , see the dashed line fits. The measured -dependencies are plotted in Fig. 3(c) for both devices (symbols). In the longer device A1, the absolute value of at higher is close to the e-ph relaxation time obtained from the cooling rate in the normal state and diffusion coefficient , see the dashed line. However, the -dependence of the is considerably weaker than . In the shorter device A2 the -dependence of the is even weaker and indicates a saturation in the low- limit. We explain this data by identifying with the thermal relaxation time that takes into account a combined effect of the e-ph relaxation and diffusion in the source and drain reservoirs: [57, 58, 59] with and . is shown by solid lines in Fig. 3(c) obtained with cm2/s, the value consistent with an independent estimate cm2/s from the slope of . Note that is different from the usual dwell time used in the analysis of hot-electron bolometers [57, 37] and represents the slowest among the set of the relaxation times of the diffusion relaxation see the derivation in the SM [46]. The agreement between and explains that the data in Fig. 2(d) manifests the size effect in thermal relaxation which occurs at .
Fig. 3(c) points to stochastic interaction with the thermal bath as the origin of the -fluctuations. Absorption/emission of individual acoustic phonons and diffusion of individual carriers in/out of the reservoirs both generate random energy exchange with the bath. In thermodynamics, corresponding fluctuations of the free-energy of the electron system within a given volume are expressed via spontaneous -fluctuations: , where is the electronic heat capacity. Therefore, the textbook expression for the variance of the -fluctuations [60] has a transparent interpretation – is a measure of how close the system can approach the superconducting phase in the course of thermal fluctuations. The expression for is sometimes applied to estimate the -fluctuations from the slope of dependence as [61, 62, 38, 36]. Our experiment allows to directly verify this expression based on the measured noise spectra and the identity . This is achieved for a fixed near the mid-point of the RT, where both the and the are maximum (see the SM for the correspondence between these two quantities) [46]. Fig. 3(d) summarizes the data on RMS fluctuation obtained in all studied devices. We find indeed that and the data is quantitatively consistent with the above thermodynamic expression (dashed line). Thus, in contrast to giant low-frequency noises mediated by flux-flow [63] and fluctuations in percolating networks [64], our experiment reveals a more universal scenario of a broadband noise at the RT [36, 33, 42, 41, 40, 38, 37, 65, 66].
How local are the -fluctuations? The scaling implies spatial averaging of the -fluctuations and the underlying -fluctuations, which can be understood by considering their correlation length . Fluctuations separated by a larger distance belong to different correlation volumes, and they are statistically independent, see the sketch of Fig. 3(e). In the experimentally relevant 1D case () one can estimate the fluctuation of the resistance in each correlation volume as , where , and . In our different samples, the normalized RMS fluctuation , where is the normal state resistance, reaches from 0.1 to 0.25 near the maximum of . Note that the absolute possible maximum equals 1/2, and it is achieved when switches between 0 and in a random telegraph noise process, see the SM [46]. This demonstrates that in spite of vanishing in the limit of the -fluctuations remain important, and they can locally drive the system a sizeable fraction of the way between the normal and the superconducting state.
As seen from Fig. 2(d), our devices fall in the regime of slow e-ph relaxation , a situation opposite to the textbook case of fast relaxation. In this case, much faster superconducting fluctuations have enough time to adopt to a local -fluctuation . In principle, this may lead to extra broadening of the RT, provided , where is the Ginzburg-Levanyuk number that controls the transition width in the AL theory. The analysis of this hypothesis lies beyond the scope of the present work and is performed in the accompanying manuscript [47]. Here it is illuminating to discuss the fate of the -fluctuations in a conventional regime of . In this regime, the -fluctuations average both in space, over the GL volume , and in time, during the GL-time. The average fluctuation is therefore given by . The last factor takes into account that only sufficiently low-frequency components survive temporal averaging so that for the infinitely fast e-ph relaxation () the -fluctuations are irrelevant. More rigorously, one can neglect them given . As derived in the SM [46], this requires , that is in our case ns (a more optimistic estimate for the device A1). The fact that the actual e-ph relaxation is much slower explains the relevance of the -fluctuations in the present experiment and the breakdown of the textbook scenario of the dynamics of the RT.
In summary, we have shown that the fluctuation dynamics at the RT in high-quality thin TiN films is governed by the -fluctuations mediated by stochastic energy exchange with the thermal bath. These fluctuations have a well-defined correlation time and correlation length, which coincide with the corresponding scales of the energy relaxation. The fundamental reason for this behavior is the extremely slow e-ph relaxation as compared to the GL time, , that puts this system beoynd the applicability range of the textbook fluctuation scenario. Our findings reveal caveats in the accepted understanding of the RT and indicate the promising direction for future research.
We are grateful to I. Burmistrov, A. Denisov, M. Feigelman, I. Gornyi, F. Jaekel, E. König, D. McCammon, R. McDermott, A. Melnikov, D. Shovkun, A. Shuvaev and E. Tikhonov for fruitful discussions. This study was conducted as a part of strategic project “Digital Transformation: Technologies, Effectiveness, Efficiency” of Higher School of Economics development programme granted by Ministry of science and higher education of Russia “Priority-2030” grant as a part of “Science and Universities” national project and the Basic Research Program of the National Research University Higher School of Economics (noise measurements). The transport measurements are funded by the Russian Science Foundation project No. 21-72-10117. The work at the UW-Madison was supported by the U.S. Department of Energy (DOE), Office of Science, Basic Energy Sciences (BES) under Award No. DESC0020313 (A.L.). The Purdue team acknowledges support from AFOSR grant FA9550-20-1-0124 (growth of TiN films).
References
- Onnes [1911] H. K. Onnes, The resistance of pure mercury at helium temperatures, Commun. Phys. Lab. Univ. Leiden 12, 120 (1911).
- Varlamov et al. [2018] A. A. Varlamov, A. Galda, and A. Glatz, Fluctuation spectroscopy: From Rayleigh-Jeans waves to Abrikosov vortex clusters, Rev. Mod. Phys. 90, 015009 (2018).
- Jelić et al. [2016] Ž. L. Jelić, M. V. Milošević, and A. V. Silhanek, Velocimetry of superconducting vortices based on stroboscopic resonances, Sci. Rep. 6, 35687 (2016).
- Spahr et al. [2020] K. Spahr, J. Graveline, C. Lupien, M. Aprili, and B. Reulet, Dynamical voltage-current characteristics of SNS junctions, Phys. Rev. B 102, 100504 (2020).
- Mannila et al. [2021] E. T. Mannila, P. Samuelsson, S. Simbierowicz, J. T. Peltonen, V. Vesterinen, L. Grönberg, J. Hassel, V. F. Maisi, and J. P. Pekola, A superconductor free of quasiparticles for seconds, Nat. Phys. 10.1038/s41567-021-01433-7 (2021).
- Larkin and Varlamov [2005] A. Larkin and A. Varlamov, Theory of Fluctuations in Superconductors (Oxford University Press, New York, 2005).
- Halperin and Nelson [1979] B. I. Halperin and D. R. Nelson, Resistive transition in superconducting films, J. Low Temp. Phys. 36, 599 (1979).
- Benfatto et al. [2009] L. Benfatto, C. Castellani, and T. Giamarchi, Broadening of the Berezinskii-Kosterlitz-Thouless superconducting transition by inhomogeneity and finite-size effects, Phys. Rev. B 80, 214506 (2009).
- Langer and Ambegaokar [1967] J. S. Langer and V. Ambegaokar, Intrinsic resistive transition in narrow superconducting channels, Phys. Rev. 164, 498 (1967).
- McCumber and Halperin [1970] D. E. McCumber and B. I. Halperin, Time scale of intrinsic resistive fluctuations in thin superconducting wires, Phys. Rev. B 1, 1054 (1970).
- Golubev and Zaikin [2008] D. S. Golubev and A. D. Zaikin, Thermally activated phase slips in superconducting nanowires, Phys. Rev. B 78, 144502 (2008).
- Baumans et al. [2016] X. D. A. Baumans, D. Cerbu, O.-A. Adami, V. S. Zharinov, N. Verellen, G. Papari, J. E. Scheerder, G. Zhang, V. V. Moshchalkov, A. V. Silhanek, and J. Van de Vondel, Thermal and quantum depletion of superconductivity in narrow junctions created by controlled electromigration, Nat. Commun. 7, 10560 (2016).
- König et al. [2021] E. J. König, I. V. Protopopov, A. Levchenko, I. V. Gornyi, and A. D. Mirlin, Resistance of two-dimensional superconducting films, Phys. Rev. B 104, L100507 (2021).
- Bezryadin et al. [2000] A. Bezryadin, C. N. Lau, and M. Tinkham, Quantum suppression of superconductivity in ultrathin nanowires, Nature 404, 971 (2000).
- Golubev and Zaikin [2001] D. S. Golubev and A. D. Zaikin, Quantum tunneling of the order parameter in superconducting nanowires, Phys. Rev. B 64, 014504 (2001).
- Lau et al. [2001] C. N. Lau, N. Markovic, M. Bockrath, A. Bezryadin, and M. Tinkham, Quantum phase slips in superconducting nanowires, Phys. Rev. Lett. 87, 217003 (2001).
- Arutyunov et al. [2008] K. Arutyunov, D. Golubev, and A. Zaikin, Superconductivity in one dimension, Phys. Rep. 464, 1 (2008).
- Bae et al. [2009] M.-H. Bae, R. C. Dinsmore, T. Aref, M. Brenner, and A. Bezryadin, Current-phase relationship, thermal and quantum phase slips in superconducting nanowires made on a scaffold created using adhesive tape, Nano Lett. 9, 1889 (2009).
- Aslamasov and Larkin [1968] L. Aslamasov and A. Larkin, The influence of fluctuation pairing of electrons on the conductivity of normal metal, Phys. Lett. A 26, 238 (1968).
- Breznay et al. [2012] N. P. Breznay, K. Michaeli, K. S. Tikhonov, A. M. Finkel’stein, M. Tendulkar, and A. Kapitulnik, Hall conductivity dominated by fluctuations near the superconducting transition in disordered thin films, Phys. Rev. B 86, 014514 (2012).
- Maki [1968] K. Maki, The critical fluctuation of the order parameter in type-II superconductors, Prog. Theor. Phys. 39, 897 (1968).
- Thompson [1970] R. S. Thompson, Microwave, Flux Flow, and Fluctuation Resistance of Dirty Type-II Superconductors, Phys. Rev. B 1, 327 (1970).
- Larkin and Ovchinnikov [2001] A. I. Larkin and Y. N. Ovchinnikov, Nonlinear fluctuation phenomena in the transport properties of superconductors, JETP 92, 519 (2001).
- Kramer and Watts-Tobin [1978] L. Kramer and R. J. Watts-Tobin, Theory of dissipative current-carrying states in superconducting filaments, Phys. Rev. Lett. 40, 1041 (1978).
- Watts-Tobin et al. [1981] R. J. Watts-Tobin, Y. Kraehenbuehl, and L. Kramer, Nonequilibrium theory of dirty, current-carrying superconductors: phase-slip oscillators in narrow filaments near , Journal of Low Temperature Physics 42, 459 (1981).
- Golub [1976] A. A. Golub, Dynamic properties of short superconducting filaments, Journal of Experimental and Theoretical Physics 71, 341 (1976).
- Schön and Ambegaokar [1979] G. Schön and V. Ambegaokar, Collective modes and nonequilibrium effects in current-carrying superconductors, Phys. Rev. B 19, 3515 (1979).
- Ivlev and Kopnin [1984] B. I. Ivlev and N. B. Kopnin, Theory of current states in narrow superconducting channels, Soviet Physics Uspekhi 27, 206 (1984).
- Wessels et al. [2021] A. Wessels, K. Morgan, J. D. Gard, G. C. Hilton, J. A. B. Mates, C. D. Reintsema, D. R. Schmidt, D. S. Swetz, J. N. Ullom, L. R. Vale, and D. A. Bennett, A model for excess Johnson noise in superconducting transition-edge sensors, Appl. Phys. Lett. 118, 202601 (2021).
- Gottardi et al. [2021] L. Gottardi, M. de Wit, E. Taralli, K. Nagayashi, and A. Kozorezov, Voltage Fluctuations in ac Biased Superconducting Transition-Edge Sensors, Phys. Rev. Lett. 126, 217001 (2021).
- Petković and Vinokur [2013] A. Petković and V. M. Vinokur, Fluctuation-induced noise in out-of-equilibrium disordered superconducting films, Ann. Phys. 339, 412 (2013).
- Bagrets and Levchenko [2014] D. Bagrets and A. Levchenko, Nonequilibrium noise and current fluctuations at the superconducting phase transition, Phys. Rev. B 90, 180505 (2014).
- Zhang et al. [2008] H. Zhang, F. Zuo, and M. Galeazzi, Anomalous Voltage Noise at the Superconducting Transition of Tin Films, J. Low Temp. Phys. 151, 206 (2008).
- Reznikov et al. [2007] M. Reznikov, A. Frydman, M. Reese, and D. Prober, Nonequilibrium voltage fluctuations in aluminum wire (2007 APS March Meeting, Denver, Colorado, 2007) unpublished.
- Luukanen et al. [2003] A. Luukanen, K. M. Kinnunen, A. K. Nuottajärvi, H. F. C. Hoevers, W. M. Bergmann Tiest, and J. P. Pekola, Fluctuation-limited noise in a superconducting transition-edge sensor, Phys. Rev. Lett. 90, 238306 (2003).
- Hoevers et al. [2000] H. F. C. Hoevers, A. C. Bento, M. P. Bruijn, L. Gottardi, M. A. N. Korevaar, W. A. Mels, and P. A. J. de Korte, Thermal fluctuation noise in a voltage biased superconducting transition edge thermometer, Appl. Phys. Lett. 77, 4422 (2000).
- Burke et al. [1999] P. J. Burke, R. J. Schoelkopf, D. E. Prober, A. Skalare, B. S. Karasik, M. C. Gaidis, W. R. McGrath, B. Bumble, and H. G. LeDuc, Mixing and noise in diffusion and phonon cooled superconducting hot-electron bolometers, J. Appl. Phys. 85, 1644 (1999).
- Ekström and Karasik [1995] H. Ekström and B. Karasik, Electron temperature fluctuation noise in hot‐electron superconducting mixers, Appl. Phys. Lett. 66, 3212 (1995).
- Nagaev [1991] K. Nagaev, Theory of excess noise in superconductors above , Phys. C: Supercond. Appl. 184, 149 (1991).
- Knoedler [1983] C. M. Knoedler, Phase-slip shot noise contribution to excess noise in superconducting bolometers, J. Appl. Phys. 54, 2773 (1983).
- Knoedler and Voss [1982] C. M. Knoedler and R. F. Voss, Voltage noise measurement of the vortex mean free path in superconducting granular tin films, Phys. Rev. B 26, 449 (1982).
- Voss et al. [1980] R. F. Voss, C. M. Knoedler, and P. M. Horn, Phase-slip shot noise at the two-dimensional superconducting transition: Evidence for vortices?, Phys. Rev. Lett. 45, 1523 (1980).
- Weitzel et al. [2023] A. Weitzel, L. Pfaffinger, I. Maccari, K. Kronfeldner, T. Huber, L. Fuchs, J. Mallord, S. Linzen, E. Il’ichev, N. Paradiso, and C. Strunk, Sharpness of the berezinskii-kosterlitz-thouless transition in disordered nbn films, Phys. Rev. Lett. 131, 186002 (2023).
- Kogan [2008] S. Kogan, Electronic Noise and Fluctuations in Solids (Cambridge University Press, New York, 2008).
- Saveskul et al. [2019] N. Saveskul, N. Titova, E. Baeva, A. Semenov, A. Lubenchenko, S. Saha, H. Reddy, S. Bogdanov, E. Marinero, V. Shalaev, A. Boltasseva, V. Khrapai, A. Kardakova, and G. Goltsman, Superconductivity behavior in epitaxial films points to surface magnetic disorder, Phys. Rev. Applied 12, 054001 (2019).
- [46] See Supplemental Material for details on: (i) derivation from the first principles an upper estimate of the spectral density of the resistance fluctuations, its average over the sample volume and its dependence on the correlation time; (ii) analysis for a novel mechanism of intrinsic excess noise, that originates from the correlated fluctuations of conductivity in the regime when electronic energy relaxation is slow compared to the time scale of dynamic superconducting fluctuations; (iii) numerical estimates for the strength of this noise as compared to the empirical -fluctuations mechanism discussed in the main text; (iv) experimental details including description of sample parameters, setup for the noise thermometry, results of the noise thermometry far above and along the resistive transition, setup for the noise spectroscopy; (v) the Kapitza resistance and (vi) derivation of the energy relaxation time due to electron diffusion into contacts.
- Baeva et al. [2022] E. M. Baeva, A. I. Kolbatova, N. A. Titova, S. Saha, A. Boltasseva, S. Bogdanov, V. Shalaev, A. V. Semenov, G. N. Goltsman, and V. S. Khrapai, Resistance fluctuation spectroscopy of the superconducting transition in epitaxial TiN films (2022), arXiv:2202.06310 .
- Sacépé et al. [2008] B. Sacépé, C. Chapelier, T. I. Baturina, V. M. Vinokur, M. R. Baklanov, and M. Sanquer, Disorder-induced inhomogeneities of the superconducting state close to the superconductor-insulator transition, Phys. Rev. Lett. 101, 157006 (2008).
- Sacépé et al. [2010] B. Sacépé, C. Chapelier, T. I. Baturina, V. M. Vinokur, M. R. Baklanov, and M. Sanquer, Pseudogap in a thin film of a conventional superconductor, Nat. Commun. 1, 140 (2010).
- Gao et al. [2012] J. Gao, M. R. Vissers, M. O. Sandberg, F. C. S. da Silva, S. W. Nam, D. P. Pappas, D. S. Wisbey, E. C. Langman, S. R. Meeker, B. A. Mazin, H. G. Leduc, J. Zmuidzinas, and K. D. Irwin, A titanium-nitride near-infrared kinetic inductance photon-counting detector and its anomalous electrodynamics, Appl. Phys. Lett. 101, 142602 (2012).
- Driessen et al. [2012] E. F. C. Driessen, P. C. J. J. Coumou, R. R. Tromp, P. J. de Visser, and T. M. Klapwijk, Strongly Disordered TiN and NbTiN -Wave Superconductors Probed by Microwave Electrodynamics, Phys. Rev. Lett. 109, 107003 (2012).
- Kardakova et al. [2013] A. Kardakova, M. Finkel, D. Morozov, V. Kovalyuk, P. An, C. Dunscombe, M. Tarkhov, P. Mauskopf, T. M. Klapwijk, and G. Goltsman, The electron-phonon relaxation time in thin superconducting titanium nitride films, Appl. Phys. Lett. 103, 252602 (2013).
- Postolova et al. [2017] S. V. Postolova, A. Y. Mironov, M. R. Baklanov, V. M. Vinokur, and T. I. Baturina, Reentrant resistive behavior and dimensional crossover in disordered superconducting TiN films, Sci. Rep. 7, 1718 (2017).
- Naik et al. [2012] G. V. Naik, J. L. Schroeder, X. Ni, A. V. Kildishev, T. D. Sands, and A. Boltasseva, Titanium nitride as a plasmonic material for visible and near-infrared wavelengths, Opt. Mater. Express 2, 478 (2012).
- Kinsey et al. [2014] N. Kinsey, M. Ferrera, G. V. Naik, V. E. Babicheva, V. M. Shalaev, and A. Boltasseva, Experimental demonstration of titanium nitride plasmonic interconnects, Opt. Express 22, 12238 (2014).
- Denisov et al. [2020] A. O. Denisov, E. S. Tikhonov, S. U. Piatrusha, I. N. Khrapach, F. Rossella, M. Rocci, L. Sorba, S. Roddaro, and V. S. Khrapai, Strategy for accurate thermal biasing at the nanoscale, Nanotechnology 31, 324004 (2020).
- Karasik et al. [1996] B. S. Karasik, K. S. Il’in, E. V. Pechen, and S. I. Krasnosvobodtsev, Diffusion cooling mechanism in a hot‐electron NbC microbolometer mixer, Appl. Phys. Lett. 68, 2285 (1996).
- Burke et al. [1998] P. J. Burke, R. J. Schoelkopf, D. E. Prober, A. Skalare, B. S. Karasik, M. C. Gaidis, W. R. McGrath, B. Bumble, and H. G. LeDuc, Spectrum of thermal fluctuation noise in diffusion and phonon cooled hot-electron mixers, Appl. Phys. Lett. 72, 1516 (1998).
- Reulet and Prober [2005] B. Reulet and D. E. Prober, Noise thermal impedance of a diffusive wire, Phys. Rev. Lett. 95, 066602 (2005).
- Landau and Lifshitz [1980] L. Landau and E. Lifshitz, Statistical Physics, 3rd ed., Vol. 5 (Butterworth-Heinemann, Oxford, 1980).
- Voss and Clarke [1976] R. F. Voss and J. Clarke, Flicker () noise: Equilibrium temperature and resistance fluctuations, Phys. Rev. B 13, 556 (1976).
- Kogan [1985] S. Kogan, Low-frequency current noise with a spectrum in solids, Phys. Usp. 28, 170 (1985).
- Clem [1981] J. R. Clem, Flux-flow noise in superconductors, Phys. Rep. 75, 1 (1981).
- Kiss and Svedlindh [1993] L. B. Kiss and P. Svedlindh, New noise exponents in random conductor-superconductor and conductor-insulator mixtures, Phys. Rev. Lett. 71, 2817 (1993).
- Maul et al. [1969] M. K. Maul, M. W. P. Strandberg, and R. L. Kyhl, Excess noise in superconducting bolometers, Phys. Rev. 182, 522 (1969).
- Ooijen and Gurp [1965] D. V. Ooijen and G. V. Gurp, Measurement of noise in the resistive state of type II superconductors, Phys. Lett. 17, 230 (1965).