Jarvis: Large-scale Server Monitoring with
Adaptive Near-data Processing
Abstract
Rapid detection and mitigation of issues that impact performance and reliability is paramount for large-scale online services. For real-time detection of such issues, datacenter operators use a stream processor and analyze streams of monitoring data collected from servers (referred to as data source nodes) and their hosted services. The timely processing of incoming streams requires the network to transfer massive amounts of data, and significant compute resources to process it. These factors often create bottlenecks for stream analytics.
To help overcome these bottlenecks, current monitoring systems employ near-data processing by either computing an optimal query partition based on a cost model or using model-agnostic heuristics. Optimal partitioning is computationally expensive, while model-agnostic heuristics are iterative and search over a large solution space. We combine these approaches by using model-agnostic heuristics to improve the partitioning solution from a model-based heuristic. Moreover, current systems use operator-level partitioning: if a data source does not have sufficient resources to execute an operator on all records, the operator is executed only on the stream processor. Instead, we perform data-level partitioning—i.e., we allow an operator to be executed both on a stream processor and data sources.
We implement our algorithm in a system called Jarvis, which enables quick adaptation to dynamic resource conditions. Our evaluation on a diverse set of monitoring workloads suggests that Jarvis converges to a stable query partition within seconds of a change in node resource conditions. Compared to current partitioning strategies, Jarvis handles up to 75% more data sources while improving throughput in resource-constrained scenarios by 1.2-4.4.
Index Terms:
analytics, stream processing, server monitoring, near-data, edge analytics, query partitioning, query refinementI Introduction
Today’s datacenters use thousands of servers to host large-scale services, such as web search, database systems, and machine learning (ML) pipelines, for millions of users. Operating these services with high availability requires that in order to restore normal service operation, datacenter operators quickly detect performance and reliability issues[1, 2, 3] such as high network latency, disk failures, and service outages from software bugs [4, 5, 6, 7, 8, 9, 10].
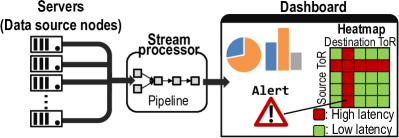
Datacenter operators deploy a dedicated monitoring system that analyzes real-time events as they are streamed from datacenter servers to a stream processor (Figure 1). As the collected data is analyzed, the stream processor visualizes the behavior of the monitored system via dashboards. This allows the operators to generate alerts when issues impacting service availability are observed. Note that the data streamed includes both service-level application logs and host-level metrics representing the health of various system resources. Large-scale monitoring pipelines can generate up to 10s of PBs per day from hundreds of thousands of servers [11, 3], making the network transfer cost to the remote stream processor a significant bottleneck. Furthermore, processing the data in a timely manner requires large amounts of compute resources, which is increasingly becoming a burden to the stream processors.
Challenges. Various monitoring pipelines leverage available compute resources on data sources (i.e., server nodes) to process data locally, effectively reducing the amount of data delivered to the stream processor. As available resources on the data source typically result from over-provisioning compute resources to handle peak resource demands [2, 12, 13, 14, 15], a monitoring query may be restricted to run a subset of operations (e.g., filtering) within a given compute budget to minimize interference with the hosted services. However, such compute budget varies widely across data sources and different time slots in practice (Section II-B). Consequently, prior partitioning approaches, which statically decide which operations to run on the data source [16, 17, 18] are either too conservative or, alternatively, run out of the assigned compute budget, affecting overall query performance.
To overcome the limitations of static partitioning, Sonata [1] proposes a dynamic approach based on a query cost optimization model. Query operators can be distributed across programmable switches and the stream processor for a wide range of network monitoring applications. However, the proposed query partitioning occurs at the operator level [16, 17, 18], and is modified at runtime by a central query planner running on the stream processor. Thus, the query planner deploys to the programmable switch an operator only if its available compute resources are sufficient to process all of the operator’s ingress data. Unfortunately, such coarse-grained operator-level query partitioning is not effective in scenarios where available compute resources are highly constrained, as is the case with data sources in monitoring systems. Furthermore, solving an expensive optimization using an accurate query cost profile and a centralized planner is unsuitable for making frequent decisions needed when data sources exhibit fast changing resource conditions.
Our proposal. We propose Jarvis, a new monitoring engine that targets large-scale systems generating high-volume data streams. For the query workload on each data source, Jarvis identifies a fine-grained data-level partitioning strategy by controlling the amount of data processed by each query operator, namely load factor. This partitioning strategy leverages a model-based technique using query operator costs to estimate the initial load factors and then iteratively adapts the estimates by monitoring the query’s execution. Jarvis can significantly reduce network data transfers while utilizing the limited and dynamic compute resources over data sources. As Jarvis is implemented in a fully decentralized manner, it can scale to a large number of data sources.
Jarvis introduces novel extensions to the conventional query execution pipeline: Control proxy and Jarvis runtime. The control proxy is a light-weight routing logic—associated with a query operator—that decides “how many” incoming records should be forwarded to the associated query operator. At each data source, the local Jarvis runtime interacts with all control proxies within a query in order to identify their state (i.e., idle, congested, or stable). After observing state changes for the control proxies of the query, the Jarvis runtime refines its plan for data-level partitioning in order to keep the query execution in each data source stable.
Results. We have implemented Jarvis and evaluated it with monitoring queries on host-level network latency metrics and application logs. The results show that Jarvis enables a stream processor node to handle up to 75% more data sources while improving query throughput by up to 4.4 over the state-of-the-art partitioning strategies. Moreover, Jarvis converges to a stable query configuration within seven seconds of a resource change occurring on data source.
II Background & Motivation
II-A Monitoring Systems Overview
Our work has been motivated by existing large-scale server monitoring systems [5, 2, 7, 4]. We describe two specific scenarios that guide the design of Jarvis:
-
•
Scenario 1: Network engineers deploy Pingmesh [5] agents on datacenter nodes to collect network latency between node pairs. A web search team uses Pingmesh to monitor network health of their latency-sensitive service and generate an alert if more than a predefined proportion of hosting nodes (e.g., 1%) have probe latencies exceeding a threshold such as 5 ms [5].
-
•
Scenario 2: A log processing system, Helios [2], enables live debugging of storage analytics services such as Cosmos [19]. A bug in a cluster resource manager may lead to service resources being under-provisioned. To temporarily mitigate performance degradation, several TBs of log streams [2] are processed quickly to identify impacted tenants. Their latency and CPU/memory utilization data are queried to predict resource needs and make scaling decisions.
These scenarios rely on a diverse set of computations. Scenario 1 requires processing of periodically generated metrics composed of structured numerical data; queries consist of computations specific to numerical data, such as filtering and aggregation. On the contrary, Scenario 2 requires processing aperiodically generated logs composed of unstructured strings; queries accompany computations for string processing such as parsing, splitting, and search.
This diverse set of computations rely on various streaming primitives, which are computationally different and whose costs are highly dynamic depending on the input data. For example, filter (F) drops uninteresting records by applying predicates on each record and typically requires little compute resources. Grouping (G) organizes records by key fields, requiring key lookups in a hash table. Join (J) joins an input stream with a static table, requiring key lookups on the table while joining two inputs into an output stream [20]. Unlike filter, both grouping and join operators are expensive due to the irregular access patterns of hash table lookups. Their cost depends on the hash table size, which corresponds to the group count and the static table size, respectively. Map (M) performs user-defined transformations on the input (e.g., parsing and splitting text logs) and its cost depends on the transformation logic. We present resource usage characteristics of these primitives in detail in [21].
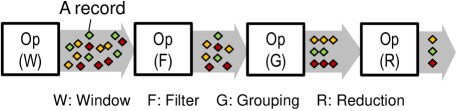
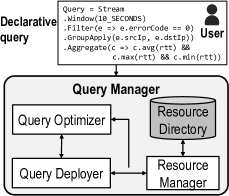
Programming model. We adopt a declarative programming model [22, 23] to define a monitoring query. In this programming model, a query can be generally expressed as a directed acyclic graph (DAG). In a DAG, the vertices denote stream operations which transform their input records and emit output records to downstream operations, and the edges denote dataflow dependencies—i.e., how data flows between the operations. Listing 1 shows a real query on the Pingmesh data described declaratively. Figure 2 illustrates the DAG for this Pingmesh query.
II-B Adaptive Query Partitioning in Query Engines
II-B1 Query Partitioning
Consider the volume of data transferred over the network observed in Microsoft’s Pingmesh trace. Each record in the trace corresponds to a single probe message for a server pair. A record is 86B in size, including timestamp (8B), source IP address (4B), source cluster ID (4B), destination IP address (4B), destination cluster ID (4B), round trip time in microseconds (us) (4B), and error code (4B). Now, assuming that a datacenter consists of 200K servers and each server probes 20K other servers with a probing interval of 5 seconds [5], the data generation rate is estimated to be 512.6 Gbps. Transferring such a high volume of data would strain network capacity and delay the query execution. Our observations are corroborated by many existing monitoring scenarios which exhibit high traffic volume [11, 24, 10] due to a large number of data sources and diverse data streams.
Data synopsis techniques (e.g., sampling, histograms, and sketches) [25] reduce the data sent to the stream processors at the cost of query output accuracy loss [26, 27]. Despite their effectiveness, any loss in the query output accuracy may be undesirable for monitoring tasks (e.g., anomaly detection) wherein anomalies are hard to detect before their samples are fully processed [28]. Data corresponding to anomalies are typically infrequent, and hence the lossy query output could lead to undetected anomalies that affect server reliability and additional costs for anomaly detection [29].
An alternative way to alleviate the network bottleneck is data processing near the data source. This approach is motivated by the observation that a monitoring query typically consist of a pipeline of operators that incrementally reduce the data volume. For instance, the query illustrated in Figure 2 first filters records and then aggregates them into a few statistical numbers. For brevity, we refer to the technique of offloading a part of query execution near the data source as query partitioning. Our analysis in Section VI-D demonstrates that query partitioning can achieve network transfer reduction rates similar to state-of-the-art data synopsis techniques without impacting the query accuracy.
II-B2 Adaptive Query Partitioning
In order to maximize network transfer reduction rates, query partitioning schemes should adapt to changes in resource availability and compute resource demands.
Resource availability. Resource demands of foreground services change dynamically over time. Therefore, unused compute resources on data source nodes available for monitoring queries exhibit temporal variability. This is a common characteristic of data source nodes as they usually host services whose workloads change over time. As a consequence, several large-scale web services (e.g., Alibaba and Wikipedia) and ML inference services experience bursty request loads in the order of minutes [30, 31, 32, 33]. These services require variable amount of compute resource to meet their SLAs despite changing request loads. Subsequently, query partitioning decisions need to be made promptly at runtime on each data source, to be compatible with dynamic resource conditions available to exploit on each data source.
Resource demands. Resource demands for each data source node can vary over time. The root cause is anomalous behavior, which may cause monitoring data distributions to change. Service failures in the datacenter can generate traffic bursts in error log volumes on each data source, until the failure is mitigated. Similarly, several real-world log analytics systems report high temporal variability in the record count of log streams, even across one-minute time windows [11, 34, 2]. In our Pingmesh example, network issues can cause spikes in server probe latencies, whose duration may range between 40 and 60 seconds.
Changes in the data distribution impacts query resource usage characteristics. The output data rate of an operator is a function of the operator’s input data distribution and subsequently determines resource usage of downstream operators. To illustrate, in Figure 2, the F operator performs filtering and leads to the first data volume reduction from the input stream. Since erroneous (or high-latency) records are usually not dominant, the operator happens to drop only a small fraction of records. A majority of records are then to be processed by G+R operator, increasing compute cost for the query. However, if we were to have network issues for inbound or outbound traffic for some servers, there would be a high degree of data reduction in F operator, thus lowering resource usage of the G+R operator.
Resource demands are also diverse across data source nodes due to variable data generation. For instance, in our Pingmesh example, a subset of servers are configured to probe a larger set of peers to cover a larger network range on behalf of other servers in the same ToR switch. This phenomenon causes highly variable data rates across data sources. Our analysis shows that 58% of the data source nodes generate 50% or lower of the highest rate—details can be found in [21].
Summary. The ability to quickly adjust query partitioning plans (i.e., query refinement) would reduce the time duration for which queries either over-subscribe or under-subscribe available compute resources. Over-subscription can lead to interference with foreground services on the data source, while under-subscription loses an opportunity to further reduce outbound network traffic. We seek to develop an approach which not only reduces the network traffic effectively, given compute budget on each data source, but also performs fast query refinement (in the order of seconds) upon a change in the resource availability or resource demands.
III Query Partitioning: Definition and Insights
In this section, we define the query partitioning problem and then shed light on efficient query partitioning strategies.
III-A Definition and Complexity
Among prior approaches on query partitioning, operator-level partitioning [16, 17, 18] is one of the most widely used approaches. Given a query DAG, an operator-level partitioning plan splits operators into those that can be executed on the data source and those that require remote execution on the stream processor. The DAG is modified to capture the split using a boundary operator such that the data source executes only the operators prior to the boundary operator (including itself) in the topological order of the DAG.
| Query Partitioning Problem | |
|---|---|
| Number of operators in the query. | |
| Number of data source nodes. | |
| Vector with an entry indicating the boundary operator of data source. | |
| Indicates if the boundary operator of data source is . | |
| Processing cost on stream processor for boundary operator . | |
| Local compute cost for operators 1 to on data source. | |
| Network transfer cost for output of boundary operator along with compute cost of executing operators till on stream processor. | |
Problem. Table I summarizes the variables used to define our problem. Let us consider the vector of boundary operators for a given query. Our goal is to find which minimizes the number of operators sent to stream processor for remote execution, without sacrificing query processing time as a result of the operators executing locally on data source, as follows:
| (1) |
subject to .
We incentivize executing operators on data sources, so the partitioning costs are ordered as . Unfortunately, solving this partitioning problem is challenging.
Theorem 1.
Query partitioning problem in Eq. 1 is NP-hard.
Proof.
The key idea of the proof is that the generalized assignment problem (GAP) [35] can be reduced to a special case of our query partitioning problem in polynomial time. Therefore, if we have an algorithm that can minimize the number of operators sent to the stream processor without sacrificing query processing time, then we can obtain an optimal solution to GAP. Since GAP is NP-hard, our problem is also NP-hard. Refer to [21] for the details of the proof. ∎
Query partitioning involves determining the boundary operator for the query instance running on each data source. Due to stream processor resources being shared across data sources, we need to jointly identify boundary operators across data source nodes which is exponential in the number of nodes. Given that resource conditions can change in the order of minutes (Section II-B), quickly computing a new partitioning plan is critical. Our setup consists of a stream processor monitoring up to 250 data sources, making it prohibitively expensive to compute a new plan for all the data sources.
III-B Insights
Combining model-based and model-agnostic techniques for query refinement. To refine query plans with high efficiency, we exploit a greedy and embarrassingly parallel heuristic, which reduces the outbound network traffic. We utilize a combination of model-based and model-agnostic techniques to allow each data source node to make fast and effective query refinement decisions independently.
This model-based technique quickly finds a new partitioning plan based on online and fine-grained profiling of each operator’s compute cost. However, such profiling might be inaccurate if the compute resources available for executing operators are insufficient for accurate profiling. Thus, we apply a model-agnostic process to iteratively fine-tune the output plan produced by the model-based approach. The proposed heuristic is simple, computationally tractable, and suggests a reasonable first attempt.

Data-level query partitioning. The operator-level query partitioning could be undesirable when attempting to run a computationally expensive operator like grouping within limited compute resources provided by data source. Instead, Jarvis adopts data-level partitioning to allow an operator to process a fraction of its input records on data source and drain the rest for remote processing. This data-level partitioning is fine-grained and can improve the overall utilization of limited compute resources on each data source node.
We highlight the effectiveness of data-level partitioning by performing an empirical study using the query in Figure 2 on a real-world Pingmesh trace. Our experiment runs the query on a data source node with compute budget set to 80% of a single 2.4 GHz CPU. Figure 3(a) shows that operator-level partitioning cannot execute the costly G+R operator entirely within compute budget, because the F operator drops only a small portion of input records. This leads to network traffic as high as 22.5 Mbps, which is close to the input rate, while not fully utilizing the compute budget. On the contrary, Figure 3(b) shows that the operator G+R can utilize the compute budget fully and process 83% of its input under the data-level partitioning, resulting in total network traffic of 9.4 Mbps—i.e., 2.4 lower over the operator-level partitioning.
IV Jarvis
We discuss the design of Jarvis and our proposed data-level partitioning heuristic which works in a decentralized manner.
IV-A Design Overview
Figure 4(a) shows the key system components involved in the query manager when a user submits a query to Jarvis. The query manager includes the resource manager, which maintains in the resource directory the list of data source and stream processor nodes along with their network topology. The query optimizer uses the query topology information to generate an optimized physical plan from the logical plan for the query, as is done in most streaming engines [22]. The query deployer compiles the query plan into an executable code and deploys it on Jarvis running on each node. Figure 4(b) shows the query manager maintaining the resource node topology and deploying the query. Our work focuses on changing the query optimizer to generate a Jarvis-friendly query plan and runtime optimizations after the query is deployed on the nodes.
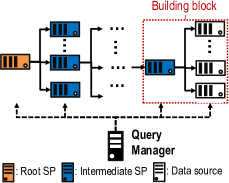
As shown in Figure 4(b), physical resources involved in query execution are viewed as a tree structure, where leaf nodes represent the data source and the rest of the nodes represent the stream processor. Each data source node executes the query within its available compute budget and sends the results, along with any pending data that needs to be processed, to its parent stream processor node. The parent node leverages its compute resources to further aggregate the query results for its data source nodes. The combination of data source nodes and the common parent node constitutes a core building block. As multiple core building blocks are present in a large-scale monitoring scenario, we should maintain a collection of intermediate stream processor nodes. The root node aggregates the results from these nodes to compute the final query output. As there is no communication between building blocks, the system can scale better to handle more data sources if each core building block is more scalable. Hence, for the remainder of this work, we focus on optimizing query execution on a single core building block.
Jarvis “replicates” query operators across data source and stream processor nodes. It realizes data-level partitioning and runtime query refinement, by adding two novel primitives to the query execution pipeline: (1) Control proxy, a unified abstraction for stream operator and (2) Jarvis runtime, a system runtime that coordinates executions of all control proxies. Control proxy is a light-weight operator bridging two adjacent stream operators, which decides “how many” records shall be forwarded to the downstream operator vs. to the “replicated” operator on the remote stream processor node. The query optimizer in Jarvis adds control proxies to the query plan at compile time.

Figure 5 illustrates the query plan deployed on data source and stream processor for the example query from Figure 2. Jarvis runtime deployed at each data source configures control proxies to execute a data-level partitioning plan for the query. Jarvis runtime continually probes the states of control proxies to observe the query state. If the query is in either idle or congestion state due to changes on resource conditions, Jarvis runtime computes a new data-level partitioning plan by reconfiguring the control proxies.
Jarvis runtime is fully decentralized—i.e., each instance of the query on a data source has a dedicated runtime instance which functions independent of other query instances and data sources. Its interactions with control proxies are also local to the node, requiring no coordination with an external planner or the stream processor. In essence, our design avoids having a central service performing a joint optimization across queries and data sources [1], which might be computationally expensive with a large number of data sources.
The data-level partitioning design in Jarvis is distinct from conventional backpressure mechanisms. Rate throttling and data dropping [36, 37] mitigate over-subscription of compute resources at data sources, but at the cost of losing accuracy in the query output similar to data synopses. Lossless backpressure mechanisms, such as resizing of operator queues [38, 37] and operator scaling [39] have limited effectiveness due to resource constraints on data source node.
IV-B Query Plan Generation
Jarvis’ query plan generation is built upon the conventional workflow of existing streaming engines [40]. First, the input query is parsed to confirm its syntax correctness. Then, a logical plan is constructed along with logical optimizations, such as constant folding, predicate pushdown. Jarvis inserts a control proxy between each of the adjacent stream operators in the logical plan. Finally, the optimized logical plan is translated to a physical plan for deployment and execution. Note that all the above steps are transparent to users.
Jarvis does not currently support all operators on data source. Such operators are identified using the following rules: (R-1) Aggregation operators that are not incrementally updatable, such as exact quantiles. However, their approximate versions, such as approximate quantiles [41, 42], can benefit from Jarvis; (R-2) Downstream operators succeeding stateful operations that require aggregation across multiple data sources; (R-3) Stateful joins across streams. Similar to prior work [1], we note that such operations are expensive, may not reduce outbound data, and require processing streams across data sources; and (R-4) Multiple physical operators per logical operator, useful for parallelizing operator execution (e.g. [43]). Data sources have constrained compute budget, so the benefits of exploiting intra-level operator parallelism would be limited.
The rules are described in a configuration file and can be extended. All rules except R-4 apply also to intermediate stream processors. This is because R-1 to R-3 consider operations which cannot be incrementally executed or may not result in data reduction from incremental processing. For R-4, however, intermediate stream processors are dedicated to run monitoring queries, enabling hardware-level parallelism to be exploited to accelerate operator execution. It may appear that R-1 limits queries that can leverage Jarvis. However, a significant number of real-world queries use operators that support incremental updates. For example, Drizzle [44] has reported that 95% of aggregation queries on a popular cloud-based data analytics platform consist of aggregation operators supporting incremental updates, such as sum and count.
Once the rules above are applied, queries deployed on data sources typically consist of a chain of operators. Hereafter, our scope is restricted to such operator pipelines. Nevertheless, our approach can be extended to handle graphs with split patterns that may execute on data sources—i.e., the output of an operator is an input to multiple downstream operators.
IV-C Dynamic Query Refinement
Once a query is deployed, Jarvis runtime steers each control proxy to select a portion (i.e., 0 1) of incoming data to be forwarded to the downstream operator via the downstream queue. Remaining data is drained over the network to be processed by the control proxy associated with the same downstream operator in the stream processor. Hereafter, we refer to the value of a control proxy as its load factor.
Jarvis can continuously refine load factors of control proxies in the data source node to adjust a query partitioning plan. This query refinement occurs at an epoch boundary defined by a time interval. During epoch processing, each control proxy monitors its downstream operator to identify the state of the operator to be one of the following: (Congested) Operator contains more than a predefined number of pending records, experiencing backpressure; (Idle) Operator stays empty for longer than a predefined time duration; and (Stable) Operator is neither congested nor idle. Jarvis runtime collects state information from all control proxies at the end of an epoch and classifies the current data-level partitioning plan as non-stable if all operators are idle or at least one operator is congested. Upon identified as non-stable, Jarvis runtime triggers adaptation to bring the query back to the stable state.
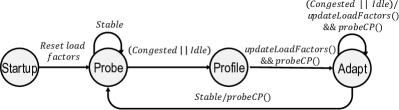
Figure 6 illustrates an overall workflow of operational phases in Jarvis to keep stable query executions:
-
•
Startup: initialization. All load factor values are initialized to zero, so all records are processed by stream processor.
-
•
Probe: normal operation. At the end of every epoch, Jarvis runtime executes ProbeCP() function to query all control proxies and determine their congestion states. It continues to do so until it identifies the computation pipeline as congested or idle. At this point, the runtime enters Profile phase.
-
•
Profile: query plan diagnosis. Jarvis obtains new estimates for the following during an epoch: (1) compute cost of each operator by executing an operator at a time, (2) reduction in the size of input stream by executing each operator, and (3) available compute budget for the query. These estimates are used to adapt load factors in the next Adapt phase.
-
•
Adapt: load factor adaptation. Jarvis runtime computes a new data-level partitioning plan. Initial load factors are first calculated using the profiling estimates and set for each control proxy. Jarvis runtime executes ProbeCP() to probe the query state and perform iterative fine-tuning if necessary, until the computation pipeline is back to stable state. At this point, it returns to Probe phase.
Small workload variation in congested state or idle state can trigger a series of Profile-Adapt phases that put the control system in an oscillating behavior with small implications on the optimal load factors. To avoid this undesired behavior, each control proxy is configured with a threshold fraction of pending records in an epoch (DrainedThres) that can be drained by control proxies and tolerated by ProbeCP() without signaling congested state. Similarly, each control proxy is configured with a threshold fraction of epoch duration (IdleThres) that allows control proxies to stay idle and can be tolerated by ProbeCP() without signaling idle state.
IV-D Computing Data-level Partitioning Plan
Computing a new data-level partitioning plan, required for stabilizing the query execution, is achieved by solving an optimization problem to compute initial load factors followed by an iterative process for fine-tuning load factors.
| Data-level Partitioning Problem | |
|---|---|
| Total number of records injected into the query in an epoch. | |
| operator in the query. | |
| Relay ratio of , i.e., ratio of its output to input data size. | |
| Compute cost of for a single record. | |
| Number of records drained in an epoch at the control proxy. | |
| Compute budget available to the query. | |
| control proxy’s load factor, i.e., fraction of incoming records to be processed by downstream operator. | |
| Effective load factor for control proxy, i.e., product of load factors of upstream query operators until . | |
Problem definition. Table II summarizes the variables used to define our problem. Let us consider a computation pipeline which contains operators . Here, we choose load factors that minimize the total number of drained records (i.e. ) from data source given the compute budget available to the query:
| (2) |
subject to
Note that , , and are fixed for a problem instance.
Unfortunately, solving the optimization problem is challenging. First, the formulation is non-convex and hence computationally hard (proof can be found in [21].) While it is feasible to enumerate all possible combinations of load factor values across operators, doing so is expensive for online optimization. Second, the formulation assumes certain conditions, which may not always be satisfied in practice. For instance, to estimate accurately, each operator needs to be evaluated on a sufficient number of input records. Finally, relay ratio can vary non-linearly for certain operations, such as grouping where is affected by input’s grouping key distribution.
StepWise-Adapt algorithm. StepWise-Adapt, a novel hybrid algorithm, lies in the heart of Jarvis’ data-level partitioning approach. The algorithm combines two techniques: (1) a model-based technique which searches for near-optimal load factors based on the modeling assumptions of the data-level partitioning problem defined in Equation 2, and (2) a model-agnostic technique that monitors query execution using load factors obtained from step (1) and fine-tunes them if the query behavior deviates considerably from stable state—i.e., the available resources are over/under-subscribed by the query. For fast fine-tuning, step (2) uses a heuristic inspired by the first fit decreasing (FFD) heuristic for bin packing problem [45], to prioritize load factor updates of operators that contribute to higher network traffic reduction.
The first step entails solving the optimization in Equation 2 quickly and efficiently. In doing so, we considered whether a transformation (i.e., change in optimization variables) exists to make the objective and constraint functions convex. Based on the performance analysis of optimization solvers on problem formulations resulting from different transformations (details in [21]), we settled on a transformation, which yields a linear program (LP). The transformation is done by introducing a new optimization variable for the control proxy where . Then, the optimization problem in Equation 2 can be rewritten as:
| (3) |
subject to
The rest of conditions on remain the same as in the original formulation.
A feasible solution provided by LP solver assumes that operator relay ratios/costs of operators (i.e., and ) are fixed and independent of load factors. However, in case these parameters are unsteady, the solver provides load factors which would either over-subscribe or under-subscribe the compute budget, making the query execution unstable. StepWise-Adapt takes the second step to address the issue.
In the second step, StepWise-Adapt observes the query state after it executes an epoch with current load factors of control proxies and fine-tunes them based on the priorities of their downstream operators. Operators are assigned higher priority based on if they exhibit lower data relay ratio. If the query is in the idle state, StepWise-Adapt then aims to increase the load factor of the operator with highest priority first (until its ). On the contrary, if the query is in congested state, StepWise-Adapt then aims to decrease the load factor for the operator with lowest priority first (until its ). This approach enables the algorithm to give more resources to operators that potentially result in higher data reduction. When fine-tuning a load factor, the algorithm executes a binary search over discretized load factor values to further improve convergence time. Note that it is possible to use other definitions for operator priority (e.g., priority which considers operator compute cost along with relay ratio), and we leave its investigation for future work.
IV-E Discussion
Adaptation. The effectiveness of Jarvis’ adaptation is maintained as long as, (1) the epoch duration is large enough to avoid invoking query partitioning decisions too frequently, and (2) query workload characteristics do not change dramatically during Profile and Adapt phases. When setting epoch duration to one second, Jarvis requires up to seven seconds (for the evaluated workloads) to stabilize a query. The convergence time is acceptable for scenarios where resource conditions change in the order of minutes (Section II-B).
Multiple queries. Multiple queries can run on a data source node, with each query having a dedicated Jarvis runtime instance. We adopt a fair resource allocation policy [46] to allocate the compute budget among competing queries. Running multiple queries is evaluated in Section VI-F. We leave opportunities for better resource allocation strategy and operator sharing across queries [47, 48] for future work.
Fault tolerance. The system may exhibit a data source or stream processor node failure. Checkpointing intermediate state (e.g., intermediate aggregation results of a stateful G+R operation) accumulated by the data source for the current window (via the drain path from proxies) can enable the stream processor to process remaining data for the current window. Checkpointing can impact network traffic; hence depending on query requirements, we could determine when it should occur based on observed events (e.g., anomalous data in the stream) or a configurable frequency parameter. Likewise, checkpointing the intermediate state of stream processor node can enable the data source to replay records produced after the last successful checkpoint. More details on our ongoing efforts to handle failures in Jarvis can be found in [21].
V Implementation
We implemented Jarvis using Apache MiNiFi [49], a lightweight query execution runtime, on the data source side and Apache NiFi [50] on the stream processor side. RxJava is used to implement query computation pipelines within NiFi/MiNiFi custom processors. Kryo serialization framework [51] is used for transferring data over the network between data source and stream processor nodes. Below, we highlight major implementation issues that Jarvis addresses, with a comprehensive discussion provided in [21].
Integration with existing streaming engines. Jarvis can be integrated with existing query engines on stream processor side. On the data source with limited compute resources, unlike stream processors which require dedicated server resources (e.g., Flink [22]), it is preferable to run a lightweight dataflow runtime such as MiNiFi. MiNiFi allows us to design and deploy custom dataflows, so it is easy to incorporate Jarvis runtime and control proxy during query compilation (Section IV-B). MiNiFi agents send data to NiFi on stream processor and we leverage NiFi’s integration already available with existing query engines; for example, Flink provides NiFiSource and NiFiSink connectors to exchange data with NiFi [52]. Query instances on stream processor only require adding control proxy to the dataflow (Figure 5), which can be implemented using output tags [53] for splitting the incoming stream to multiple downstream operators.
Accurate query processing. Streams from multiple data sources are processed on the stream processor side. Accurate stream processing introduces two requirements.
First, multiple streams need to be consumed via correct merging of watermarks from each stream to indicate time progress. We implement this requirement by leveraging the methodology used by Flink [54]. Each operator advances its time based on the minimum of all its incoming input streams’ event times. Since each control proxy on the data source generates an additional stream for drained records, incoming watermarks need to be replicated by control proxy for the drained path to reflect time progress.
Second, records emitted by data sources need to be routed to the right operator on stream processor for further processing. In doing so, control proxy attaches an identifier for the operator on stream processor that should receive records for further processing. While stateless operators on the data source can relay their output to the downstream query operator on stream processor, stateful operators relay output to the corresponding operator on stream processor, for merging the accumulated state on data source with the state on stream processor.
VI Evaluation
VI-A Methodology
Testbed setup. We deploy our data source on Amazon EC2 t2.micro nodes, each with one 2.4 GHz Intel Xeon E5-2676 core and 1 GB RAM. We use a larger Amazon EC2 t2.medium node with two 2.4 GHz Intel Xeon E5-2686 cores and 4 GB RAM as data source for the experiment of multiple queries. A stream processor instance is deployed on an Amazon EC2 m5a.16xlarge node with 64 2.5 GHz AMD EPYC 7000 cores and 256 GB RAM. All nodes run Ubuntu 16.04.
We conduct our experiments on two types of setups: (1) a single data source node connected to a single stream processor node to evaluate the performance of query partitioning and refinement strategies in Jarvis, and (2) multiple data source nodes (up to 250) connected to a single stream processor node to evaluate Jarvis as we increase the monitoring scale.
Performance metrics. We measure query processing throughput in Mbps (megabit per second) with a latency bound of 5 seconds, epoch processing latency in seconds, and convergence duration in number of epochs after resource conditions change. Performance results are obtained after running three minutes for the system warm-up.
Workloads. We use two datasets: Pingmesh dataset as described in Section II-B and LogAnalytics, a text-based log which includes tenant name, job running time in milliseconds along with CPU and memory utilization for handling tenant-wise performance issues for jobs running in an analytics cluster. We run the following queries:
-
•
S2SProbe (Listing 1) on Pingmesh dataset. The filter predicate delivers 14% filter-out rate.
-
•
T2TProbe (Listing 2) on Pingmesh dataset. It measures network latency aggregates for ToR-to-ToR pairs by joining the input stream with a table that maps server IP address to its ToR switch ID.
-
•
LogAnalytics (Listing 3) on LogAnalytics dataset. It parses unstructured logs and bucketizes per-tenant latency and resource utilization to create histograms.
For Pingmesh, guided by [5], we set each server to probe 20K other servers at a time interval of 5 seconds. As a probe record is 86B, each server generates data approximately at 2.62 Mbps. For LogAnalytics, guided by [11] which reports text log data generated at 10s PB per day across 200K data source nodes in a production system, we set each server to generate 0.62 MBps (or 4.96 Mbps) of log data. For experimentation purpose, we scale up the data generation rate by 10, i.e., 26.2 Mbps for Pingmesh and 49.6 Mbps for LogAnalytics per data source node.
Network configuration. We assume that a stream processor node would have a network link of 10 Gbps [16]. For ease of experiment, we assume this bandwidth is fairly utilized across 250 nodes (guided by conversations with a large-scale datacenter operator) and 20 queries (guided by [1]) per node, allowing 2.048 Mbps effective bandwidth per query per data source node. We again scale up the obtained bandwidth by 10x to match with data rate scaling.
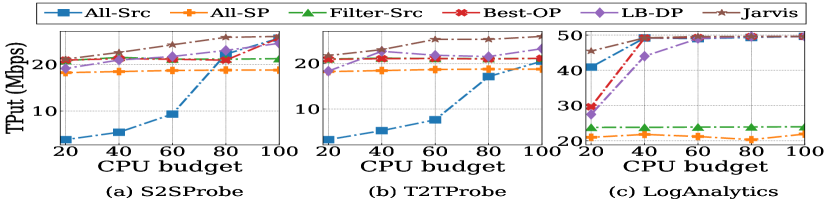
Baseline systems. We compare Jarvis with the following systems: (1) All-SP that runs a query entirely on stream processor (i.e., Gigascope [17]), (2) All-Src that runs a query entirely on data source, (3) Filter-Src that applies static operator-level partitioning and runs only filter operations on data source (i.e., Everflow [16]), (4) Best-OP that applies a solver to dynamically allow the best operator-level partitioning (i.e., Sonata [1]), and (5) LB-DP (or LoadBalance-DP) that applies coarse-grained data partitioning at query level to split the input stream between data source and stream processor proportional to available compute on the nodes (i.e., M3 [55]).
VI-B Query Throughput Analysis
We use a single data source setup and evaluate query throughput for different partitioning strategies while varying available compute resource on data source. Jarvis incurs little overhead, consuming less than 1% of a single core during Profile and Adapt phases.
S2SProbe query. Figure 7(a) shows the query throughput on S2SProbe. The query requires nearly 85% CPU to execute entirely on data source. Thus, the throughput in All-Src declines drastically when CPU budgets are lower than 80%. Network bandwidth becomes a bottleneck for Filter-Src as F operator is not effective in filtering out data. Best-OP executes F and G+R on data source only at 100%. For lower CPU budgets, it hits compute bottleneck and runs only F at the source as its compute cost is just 13%. All-SP is restricted by available network bandwidth, and thus its throughput does not change with available CPU. LB-DP generates higher amounts of network traffic compared to Jarvis since its goal is to balance the compute load between data source and stream processor nodes. On the contrary, Jarvis partially processes the input of the G+R operator within available compute resource to reduce network traffic. Jarvis outperforms other techniques in the 40-80% CPU budget range, with throughput gains of 2.6 and 1.16 over All-Src and LB-DP, respectively at 60% CPU, and 1.25 over Best-OP at 80% CPU.
T2TProbe query. Figure 7(b) shows the query throughput on T2TProbe. This query’s compute resource requirements exceed one core due to an expensive join (J) operator. Thus, All-Src cannot handle the input rate even at 100% CPU, resulting in significant throughput reduction for lower compute budgets. Both Filter-Src and Best-OP execute only F at the source while Best-OP cannot accommodate J operator even at 100% CPU. LB-DP relieves compute load on data source but the reduction is not sufficient for significant throughput gains. Jarvis performs data-level partitioning to process the input partially on the J operator, thereby reducing network traffic, outperforming other techniques in the 40-100% CPU range. Note that the J operator is followed by a projection on the fields, srcToR, destToR and rtt; hence, the output size of the projection is less than the input size of the J operator, leading to data reduction. Jarvis outperforms All-Src by 4.4 at 40% CPU and Best-OP by 1.2 between 60-100% CPU range.
LogAnalytics query. LogAnalytics is relatively cheaper and uses 31% CPU to process the input at 49.6 Mbps. All-Src achieves lower throughput than Jarvis at 20% CPU as it is resource constrained. Filter-Src executes filtering on data source, but is bound by network cost due to low filter-out rate. Best-OP can perform the filter and map operators at the source, thus outperforming Filter-Src. All-SP is always bound by the network, and hence Jarvis outperforms it by 2.3 in the 40-100% CPU range. For 20-40% CPU range, LB-DP transfers up to 45% of the input over the network, resulting in significant network bottlenecks. Jarvis’ data-level partitioning reduces compute cost even at 20% CPU budget, as shown in Figure 7(c), outperforming Best-OP and LB-DP by 1.5.
VI-C Convergence Analysis
Next, we evaluate how fast Jarvis adapts to changes in resource conditions on data source by measuring the convergence time in number of epochs. We compare Jarvis against LP only which runs StepWise-Adapt without fine-tuning (i.e., model-based approach in [56]) and w/o LP-init which runs StepWise-Adapt by initializing load factors to zero (i.e., model-agnostic approach in [56]). We do not compare against other methods that take minutes to compute a new query plan (e.g., Sonata [1]).

S2SProbe query. Figure 8(a) shows the results as we vary the available compute resource on the data source. Note that three epochs are required to detect that compute budget has changed, while avoiding triggering adaptation due to scheduling noise in the system. When the compute budget changes at the epoch (10%90% CPU), Jarvis reduces the convergence time from six epochs in w/o LP-init, down to one epoch when employing initialization using LP solver. LP only also stabilizes the query using the output of LP solver. When the compute budget drops at the (90%60% CPU), the query reaches a stable state within two and four epochs for Jarvis and w/o LP-init, respectively. The additional epoch for Jarvis is required because profiling within a one-second epoch is not sufficient for G+R to process all records, resulting in less accurate estimates for the cost of G+R. The inaccurate profiling also prevents LP only from stabilizing the query.
T2TProbe query. Performance of a join-bound query is affected by the size of the static table. As shown in Figure 8(b), we vary the available compute and the size of the static table by starting with 10% CPU and a static table of size 50, then switching to 100% CPU in the epoch, and finally increasing the static table size by 10x to cause congestion.
Convergence duration is reduced from 11 epochs (in w/o LP-init) to seven epochs in Jarvis, when the budget is increased to 100%. The number of epochs for Jarvis incurred after profiling is attributed to the fact that the expensive J operator cannot be executed on all records to get accurate profiling estimates. As a result, the downstream G+R operator is not profiled accurately. Thereafter, fine-tuning plays a critical role in stabilizing the query in Jarvis. When the table size increases, the compute cost of J operator increases leaving no resources for G+R to execute. It takes five and three epochs to converge in w/o LP-init and Jarvis, respectively. The inaccurate profiling prevents LP only from converging for both changes in resource conditions. Note that we manually reset load factors to stabilize query for the next run, at epoch.
Figure 8(c) shows the results of LogAnalytics. We see similar trends as observed in S2SProbe and T2TProbe queries.
Impact of number of operators. As we increase the number of query operators, we expect w/o LP-init to require longer time to converge. We analyze algorithm convergence via a simulator that performs an exhaustive search of different execution configurations with possible query resource needs and compute budgets, while measuring associated convergence cost for each configuration. The simulator does not consider the 3 additional epochs to detect a resource change before triggering adaptation. We find that convergence time can increase to as high as 21 epochs in the worst case, with four operators; detailed analysis can be found in [21]. LP solver can thus be a valuable part of design in improving convergence cost in such cases. We do not compare against LP only and Jarvis, as the simulator does not consider the profiling estimation errors which occur in real environments, and hence the query refinement would converge within an epoch.
VI-D Comparison against Data Synopsis
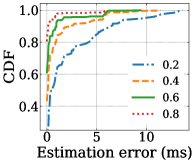
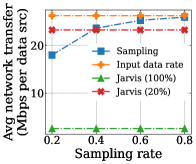
Data synopses have been proposed to reduce network transfer costs. We quantify the potential of the window-based sampling protocol (WSP) [26], which constructs continuous samples from distributed streams in multiple data sources. We apply WSP to Scenario 1 in Section II-A using the query in Listing 1. In this scenario, violating the search service latency SLA degrades user satisfaction and reduces revenues [57]. Developers need to quickly correlate SLA violations with the alerts in Scenario 1 to determine if the violation is due to a network issue [5]. This necessitates accurate alerts to be generated. To understand the impact of data synopsis in this scenario, Figure 9 plots the error in estimating the range of probe latencies for each server pair and the required network bandwidth to transmit the results to the stream processor while varying the WSP’s sampling rate.
We observe that with 0.6 and 0.8 sampling rates, we have 85-90% of the estimation errors within 1 ms, an acceptable error given the alert threshold of 5 ms used in Scenario 1. However, network transfer savings are not significant for these high sampling rates. Lower sampling rates (i.e., 0.2 and 0.4) result in significant network bandwidth reduction (10-32% of input rate), but at the cost of high estimation errors. Specifically, 20-40% of the estimation errors exceed 1 ms for sampling rates of 0.2 and 0.4, and 20% even exceeds 5 ms for 0.2 sampling rate. The reason for the high errors is because high probe latencies which correspond to network issues are sparse in the dataset. When such probes are missed during sampling, the query can significantly underestimate the probe latencies observed by a node. Critically, for such low sampling rates, WSP misses 10-38% of the alerts that should be generated given the alert threshold. Finally, we note that the network bandwidth reduction obtained by Jarvis (i.e., 11.4-90% of input rate) is same or better, without compromising accuracy.
VI-E Multiple Data Source Nodes
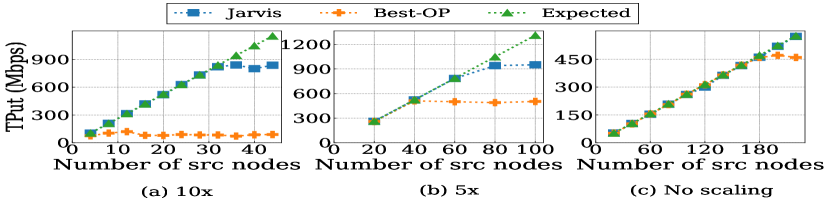
We discuss the efficacy of Jarvis when multiple data sources are sending data to a single stream processor node. We compare Jarvis against Best-OP (i.e., the state-of-the-art in dynamic operator-level partitioning) on Pingmesh’s S2SProbe query while varying the number of data source nodes for different input rates.
Query throughput. Figure 10(a) varies the number of data source nodes for an input rate of 26.2 Mbps, which is scaled by 10 over the dataset’s calculated rate. On each data source, we set CPU to 55% to ensure that Best-OP executes only the F operator while not fully utilizing the given CPU budget. In Best-OP, F operator does not reduce data significantly, so the policy suffers from network bottleneck as soon as we add more data sources. In contrast, Jarvis scales up to 32 nodes without impacting throughput. Beyond 32 nodes, throughput degradation is observed due to network bottleneck.
Figure 10(a) varies the number of data source nodes for an input rate of 13.2 Mbps (5 scaling). On each data source, we set the available CPU to 30%, to reflect the change in query compute demand from decreasing the input rate. Best-OP scales to 40 nodes after which it becomes network bottlenecked. Jarvis scales up to nearly 70 nodes, 75% improvement in number of data sources supported over Best-OP.
Finally, when the input rate is set to 2.62 Mbps (Figure 10(c)) and 5% of the CPU is allocated to the query, Best-OP starts to degrade in throughput at 180 nodes while Jarvis is seen to scale even for 250 data sources.
Query latency. Jarvis improves epoch processing latency over Best-OP due to reduced network traffic. For instance, when both policies are able to handle the input rate (e.g., 5 scaling and 40 data sources), Jarvis improves median latency by 3.4 (from 1800 ms down to 500 ms) over Best-OP in the configuration. Similarly, Jarvis reduces the max latency from five seconds down to two seconds. For configurations where Best-OP cannot keep up with input rate due to network bottleneck (e.g., 5 and 60 nodes), we observe that the max latency of Best-OP grows beyond 60 seconds while Jarvis maintains it within five seconds.
VI-F Multiple Queries on Data Source Node
Finally, we investigate the implications when multiple queries are executed on a Jarvis-enabled single-data source node. Our experiment runs multiple instances of S2SProbe query while each instance is configured to use a fixed amount of CPU resource (via fixed load factors). Figure 11 plots aggregate query throughput for various per-query input data rates and for single- and dual-core data sources.
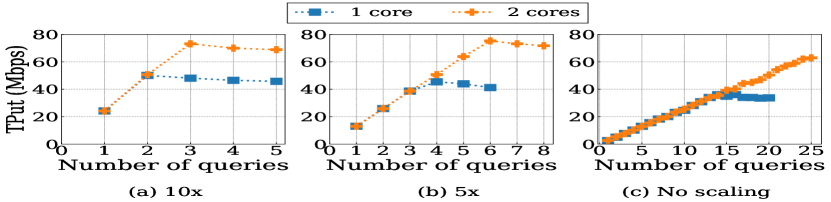
We observe that there is no significant interference among query instances until the system is bottlenecked by the compute budget. Under system stress at 10 input scaling, single-core throughput saturates at two queries given per-query CPU demand of 55%. Two-core throughput does not increase beyond three queries. At 5 scaling, per-query CPU demand drops to 30% and Jarvis supports up to four and six queries on a single- and two-core setup, respectively. At no input scaling and per-query CPU demand of 5%, Jarvis supports 15 queries and 25 queries with one and two cores, respectively.
VII Related Work
In-situ analytics. They reduce data movement by executing query operations locally on the data source nodes. iMR [58] uses data summaries to trade off accuracy for performance. Rule-based heuristics [59, 60, 61] statically determine which operators are pushed to data source; e.g., operators beyond the first stateful operator cannot be pushed. Such static partitioning quickly becomes sub-optimal in our system under dynamic resource conditions (Section II-B).
MapReduce implementations adapted for streaming applications [55, 62] perform compute load balancing across map operator instances by splitting input load across them (detailed comparison against Jarvis can be found in Section VI-B.) DIRAQ [63] and FlexAnalytics [64] execute indexing and compression operators at the data source. Task-level (akin to operator-level) dynamic resource allocation is enabled by different frameworks; for instance, Spark uses Mesos and YARN [39]. Operator-level placement is evaluated extensively in Section VI-B.
Stream operator placement. It determines how to place DAG operators across computing nodes for efficient query execution. These approaches are based on operator-level partitioning [65, 66, 67, 68, 69, 48], which is less effective than data-level partitioning when applied in our setup. Prior work finds an optimal placement on heterogeneous resources [70, 71] requiring solving an NP-hard optimization problem, which makes it impractical when fast adaptation is required across large number of data sources (see Section III). Flouris et al. suggest several heuristics to assign operators near data source to minimize network transmission costs under geo-distributed sites [72]. All the proposed algorithms consider coarse-grained operator-level partitioning, which is less effective compared to Jarvis. Furthermore, apart from greedy heuristics, they exhibit exponential time complexity in the number of data source nodes, when considering placement of each query instance’s operator across data source and stream processor nodes.
Nardelli et al. study model-based and model-free heuristics for operator placement [56], concluding that there is no one-size-fits-all solution. Model-based approaches have been implemented in centralized [65] and decentralized [67] systems for operator placement. They rely on accurate query cost estimates, which are computationally expensive to profile on the data source. Cost model-agnostic approach based on rule-based heuristics has been studied in [66]. In Section VI-C, we show that the combination of model-based and model-agnostic approaches (as in Jarvis) outperforms each approach when applied individually.
Parallel query processing. Prior work improves query performance by dynamically alleviating compute bottlenecks through operator scaling on input data. DS2 [43] makes a scaling decision over all query operators at a time given the correct query performance tracing result. Stela [73] prioritizes scaling of operators that have the greatest impact on overall query throughput. Similarly, other works in this domain all make scaling decisions at operator level [74, 75, 76, 77, 78, 79, 80, 81, 82, 83]. Applying these approaches to our setup requires that the query operators be replicated between each data source and its parent stream processor node. However, compute resource allocation on the data source in our system happens at the query level; and a query consists of multiple operators with different data reduction capabilities. Our optimization goal is thus different: incoming records need to be carefully apportioned across multiple co-located query operators, in order to minimize data transfer costs within a compute budget.
Conventional key-based load splitting strategies [84, 85, 86, 87, 88, 89, 90] are complementary to our work. These strategies assign input key ranges to different stateful operator instances such that each instance keeps the state of a distinct, non-overlapping key range. Integrating key-based load splitting into Jarvis may further reduce network transfer costs by minimizing the number of output keys sent from the data source. Recent studies investigate assigning subsequences of records or windows to operator instances based on the currently assigned compute load in the host node [91, 92, 93]. These approaches do not assume that compute resources in each stream processor node are shared by multiple data sources (see Figure 4). Therefore, compute load on the stream processor node depends on jointly considering splitting decisions over data source nodes. This is exponential in the number of data sources.
SkewTune [94] and Google Dataflow [95] employ work-stealing techniques for straggler mitigation while others [96, 97] use local estimates of compute load to detect a congested host node and re-route input records to a different node in a greedy manner. In our setup, each data source has a fixed compute budget allocated for a query consisting of multiple operators with different data reduction capabilities. We could consider re-routing input records to a stream processor node, when an operator does not result in a significant data reduction. This boils down to “w/o LP-init” which is evaluated for convergence speed in Section VI-C. To facilitate throughput comparison of Jarvis with compute load balancing techniques at the query level, we evaluate “LB-DP” in Section VI-B.
Stream computations on the edge. EdgeWise [98] is a streaming engine run on the edge, improving throughput and latency by prioritizing query operators experiencing backpressure. Droplet [99] and Costless [100] address the operator placement problem between edge and cloud resources for video analytics applications. They neither leverage the benefits of the data-level partitioning nor respond to dynamic resource conditions on the edge. Jarvis does both.
VIII Conclusion
We presented Jarvis, a fully decentralized data-level query partitioning engine for server monitoring systems. Our analysis using real-world monitoring query workloads suggests that Jarvis substantially improves system throughput while quickly adapting to changes in resource conditions.
IX Acknowledgements
We thank the anonymous reviewers, Ruoyu Sun and Niao He from UIUC for their feedback and comments. This work was supported in part by the National Science Foundation under Grant No. SHF 1617401, and in part by the Laboratory Directed Research and Development program at Sandia National Laboratories, a multi-mission laboratory managed and operated by National Technology and Engineering Solutions of Sandia, LLC, a wholly owned subsidiary of Honeywell International, Inc., for the U.S. Department of Energy’s National Nuclear Security Administration under contract DE-NA0003525, the 2018 Research Fund (1.180079.01) of UNIST(Ulsan National Institute of Science & Technology), and Samsung Data & Information Technology Center.
References
- [1] A. Gupta, R. Harrison, M. Canini, N. Feamster, J. Rexford, and W. Willinger, “Sonata: Query-Driven Streaming Network Telemetry,” in Proceedings of the 2018 Conference of the ACM Special Interest Group on Data Communication, ser. SIGCOMM ’18. New York, NY, USA: Association for Computing Machinery, 2018, p. 357–371. [Online]. Available: https://doi.org/10.1145/3230543.3230555
- [2] R. Potharaju, T. Kim, W. Wu, V. Acharya, S. Suh, A. Fogarty, A. Dave, S. Ramanujam, T. Talius, L. Novik, and R. Ramakrishnan, “Helios: Hyperscale indexing for the cloud & edge,” Proc. VLDB Endow., vol. 13, no. 12, p. 3231–3244, Aug. 2020. [Online]. Available: https://doi.org/10.14778/3415478.3415547
- [3] Z. Chothia, J. Liagouris, D. Dimitrova, and T. Roscoe, “Online Reconstruction of Structural Information from Datacenter Logs,” in Proceedings of the Twelfth European Conference on Computer Systems, ser. EuroSys ’17. New York, NY, USA: Association for Computing Machinery, 2017, p. 344–358. [Online]. Available: https://doi.org/10.1145/3064176.3064195
- [4] P. Bodik, M. Goldszmidt, A. Fox, D. B. Woodard, and H. Andersen, “Fingerprinting the Datacenter: Automated Classification of Performance Crises,” in Proceedings of the 5th European Conference on Computer Systems, ser. EuroSys ’10. New York, NY, USA: Association for Computing Machinery, 2010, p. 111–124. [Online]. Available: https://doi.org/10.1145/1755913.1755926
- [5] C. Guo, L. Yuan, D. Xiang, Y. Dang, R. Huang, D. Maltz, Z. Liu, V. Wang, B. Pang, H. Chen, Z.-W. Lin, and V. Kurien, “Pingmesh: A Large-Scale System for Data Center Network Latency Measurement and Analysis,” in Proceedings of the 2015 ACM Conference on Special Interest Group on Data Communication, ser. SIGCOMM ’15. New York, NY, USA: Association for Computing Machinery, 2015, p. 139–152. [Online]. Available: https://doi.org/10.1145/2785956.2787496
- [6] C. Tan, Z. Jin, C. Guo, T. Zhang, H. Wu, K. Deng, D. Bi, and D. Xiang, “NetBouncer: Active Device and Link Failure Localization in Data Center Networks,” in 16th USENIX Symposium on Networked Systems Design and Implementation. Boston, MA: USENIX Association, Feb. 2019, pp. 599–614. [Online]. Available: https://www.usenix.org/conference/nsdi19/presentation/tan
- [7] Q. Zhang, G. Yu, C. Guo, Y. Dang, N. Swanson, X. Yang, R. Yao, M. Chintalapati, A. Krishnamurthy, and T. Anderson, “Deepview: Virtual Disk Failure Diagnosis and Pattern Detection for Azure,” in Proceedings of the 15th USENIX Conference on Networked Systems Design and Implementation, ser. NSDI’18. USA: USENIX Association, 2018, p. 519–532.
- [8] S. Karumuri, F. Solleza, S. Zdonik, and N. Tatbul, “Towards observability data management at scale,” SIGMOD Rec., vol. 49, no. 4, p. 18–23, Mar. 2021. [Online]. Available: https://doi.org/10.1145/3456859.3456863
- [9] S. Das, F. Li, V. R. Narasayya, and A. C. König, “Automated Demand-Driven Resource Scaling in Relational Database-as-a-Service,” in Proceedings of the 2016 International Conference on Management of Data, ser. SIGMOD ’16. New York, NY, USA: Association for Computing Machinery, 2016, p. 1923–1934. [Online]. Available: https://doi.org/10.1145/2882903.2903733
- [10] Uber, “The Billion Data Point Challenge: Building a Query Engine for High Cardinality Time Series Data,” 2018, https://eng.uber.com/billion-data-point-challenge/.
- [11] L. Mai, K. Zeng, R. Potharaju, L. Xu, S. Suh, S. Venkataraman, P. Costa, T. Kim, S. Muthukrishnan, V. Kuppa, S. Dhulipalla, and S. Rao, “Chi: A Scalable and Programmable Control Plane for Distributed Stream Processing Systems,” Proc. VLDB Endow., vol. 11, no. 10, p. 1303–1316, Jun. 2018. [Online]. Available: https://doi.org/10.14778/3231751.3231765
- [12] S. Srivatsan, “Observability at Scale: Building Uber’s Alerting Ecosystem,” 2018, https://eng.uber.com/observability-at-scale/.
- [13] Nutanix, “Nutanix Agent - collector agent,” 2021, https://docs.epoch.nutanix.com/setup-guide/collectors/configuration/.
- [14] W. Song, Z. Xiao, Q. Chen, and H. Luo, “Adaptive Resource Provisioning for the Cloud Using Online Bin Packing,” IEEE Trans. Comput., vol. 63, no. 11, p. 2647–2660, Nov. 2014. [Online]. Available: https://doi.org/10.1109/TC.2013.148
- [15] X. Sun, N. Ansari, and R. Wang, “Optimizing Resource Utilization of a Data Center,” Commun. Surveys Tuts., vol. 18, no. 4, p. 2822–2846, Oct. 2016. [Online]. Available: https://doi.org/10.1109/COMST.2016.2558203
- [16] Y. Zhu, N. Kang, J. Cao, A. Greenberg, G. Lu, R. Mahajan, D. Maltz, L. Yuan, M. Zhang, B. Y. Zhao, and H. Zheng, “Packet-Level Telemetry in Large Datacenter Networks,” SIGCOMM Comput. Commun. Rev., vol. 45, no. 4, p. 479–491, Aug. 2015. [Online]. Available: https://doi.org/10.1145/2829988.2787483
- [17] C. Cranor, T. Johnson, O. Spataschek, and V. Shkapenyuk, “Gigascope: A Stream Database for Network Applications,” in Proceedings of the 2003 ACM SIGMOD International Conference on Management of Data, ser. SIGMOD ’03. New York, NY, USA: Association for Computing Machinery, 2003, p. 647–651. [Online]. Available: https://doi.org/10.1145/872757.872838
- [18] A. Rabkin, M. Arye, S. Sen, V. S. Pai, and M. J. Freedman, “Aggregation and degradation in jetstream: Streaming analytics in the wide area,” in 11th USENIX Symposium on Networked Systems Design and Implementation. Seattle, WA: USENIX Association, Apr. 2014, pp. 275–288. [Online]. Available: https://www.usenix.org/conference/nsdi14/technical-sessions/presentation/rabkin
- [19] R. Chaiken, B. Jenkins, P.-r. Larson, B. Ramsey, D. Shakib, S. Weaver, and J. Zhou, “Scope: Easy and efficient parallel processing of massive data sets,” Proc. VLDB Endow., vol. 1, no. 2, p. 1265–1276, Aug. 2008. [Online]. Available: https://doi.org/10.14778/1454159.1454166
- [20] G. Pekhimenko, C. Guo, M. Jeon, P. Huang, and L. Zhou, “TerseCades: Efficient Data Compression in Stream Processing,” in 2018 USENIX Annual Technical Conference. Boston, MA: USENIX Association, Jul. 2018, pp. 307–320. [Online]. Available: https://www.usenix.org/conference/atc18/presentation/pekhimenko
- [21] A. Sandur, C. Park, S. Volos, G. Agha, and M. Jeon, “Extended version of jarvis: Large-scale server monitoring with adaptive near-data processing,” 2021. [Online]. Available: https://doi.org/10.5281/zenodo.5120252
- [22] P. Carbone, A. Katsifodimos, S. Ewen, V. Markl, S. Haridi, and K. Tzoumas, “Apache flink™: Stream and batch processing in a single engine,” IEEE Data Eng. Bull., vol. 38, no. 4, pp. 28–38, 2015. [Online]. Available: http://sites.computer.org/debull/A15dec/p28.pdf
- [23] M. Zaharia, T. Das, H. Li, T. Hunter, S. Shenker, and I. Stoica, “Discretized Streams: Fault-Tolerant Streaming Computation at Scale,” in Proceedings of the Twenty-Fourth ACM Symposium on Operating Systems Principles, ser. SOSP ’13. New York, NY, USA: Association for Computing Machinery, 2013, p. 423–438. [Online]. Available: https://doi.org/10.1145/2517349.2522737
- [24] Z. Li, Q. Cheng, K. Hsieh, Y. Dang, P. Huang, P. Singh, X. Yang, Q. Lin, Y. Wu, S. Levy, and M. Chintalapati, “Gandalf: An Intelligent, End-To-End Analytics Service for Safe Deployment in Large-Scale Cloud Infrastructure,” in 17th USENIX Symposium on Networked Systems Design and Implementation. Santa Clara, CA: USENIX Association, Feb. 2020, pp. 389–402. [Online]. Available: https://www.usenix.org/conference/nsdi20/presentation/li
- [25] G. Cormode, M. Garofalakis, P. J. Haas, and C. Jermaine, “Synopses for massive data: Samples, histograms, wavelets, sketches,” Found. Trends Databases, vol. 4, no. 1–3, p. 1–294, Jan. 2012. [Online]. Available: https://doi.org/10.1561/1900000004
- [26] G. Cormode, S. Muthukrishnan, K. Yi, and Q. Zhang, “Continuous sampling from distributed streams,” J. ACM, vol. 59, no. 2, May 2012. [Online]. Available: https://doi.org/10.1145/2160158.2160163
- [27] P. K. Agarwal, G. Cormode, Z. Huang, J. M. Phillips, Z. Wei, and K. Yi, “Mergeable summaries,” ACM Trans. Database Syst., vol. 38, no. 4, Dec. 2013. [Online]. Available: https://doi.org/10.1145/2500128
- [28] Q. Huang, H. Sun, P. P. C. Lee, W. Bai, F. Zhu, and Y. Bao, “Omnimon: Re-architecting network telemetry with resource efficiency and full accuracy,” in Proceedings of the Annual Conference of the ACM Special Interest Group on Data Communication on the Applications, Technologies, Architectures, and Protocols for Computer Communication, ser. SIGCOMM ’20. New York, NY, USA: Association for Computing Machinery, 2020, p. 404–421. [Online]. Available: https://doi.org/10.1145/3387514.3405877
- [29] CSOOnline, “False positives still cause threat alert fatigue,” 2017, https://www.csoonline.com/article/3191379/false-positives-still-cause-alert-fatigue.html.
- [30] S.-U.-R. Baig, W. Iqbal, J. L. Berral, A. Erradi, and D. Carrera, “Adaptive prediction models for data center resources utilization estimation,” IEEE Transactions on Network and Service Management, vol. 16, no. 4, pp. 1681–1693, 2019.
- [31] H. Fernandez, G. Pierre, and T. Kielmann, “Autoscaling web applications in heterogeneous cloud infrastructures,” in 2014 IEEE International Conference on Cloud Engineering, 2014, pp. 195–204.
- [32] A. Bhattacharjee, A. D. Chhokra, Z. Kang, H. Sun, A. Gokhale, and G. Karsai, “Barista: Efficient and scalable serverless serving system for deep learning prediction services,” in 2019 IEEE International Conference on Cloud Engineering, 2019, pp. 23–33.
- [33] C. Zhang, M. Yu, W. Wang, and F. Yan, “Mark: Exploiting cloud services for cost-effective, slo-aware machine learning inference serving,” in 2019 USENIX Annual Technical Conference. Renton, WA: USENIX Association, Jul. 2019, pp. 1049–1062. [Online]. Available: https://www.usenix.org/conference/atc19/presentation/zhang-chengliang
- [34] M. Lin, A. Wierman, L. L. H. Andrew, and E. Thereska, “Dynamic right-sizing for power-proportional data centers,” in INFOCOM 2011. 30th IEEE International Conference on Computer Communications, Joint Conference of the IEEE Computer and Communications Societies. IEEE, 2011, pp. 1098–1106. [Online]. Available: https://doi.org/10.1109/INFCOM.2011.5934885
- [35] M. Savelsbergh, “A branch-and-price algorithm for the generalized assignment problem,” Operations Research, vol. 45, pp. 831–841, 12 1997.
- [36] L. Jiang, “Enable Back Pressure To Make Your Spark Streaming Application Production Ready,” 2017, https://www.linkedin.com/pulse/enable-back-pressure-make-your-spark-streaming-production-lan-jiang/.
- [37] RxJava, “RxJava backpressure operators,” 2017, http://reactivex.io/documentation/operators/backpressure.html.
- [38] U. Celebi, “How Apache Flink™ handles backpressure,” 2015, https://www.ververica.com/blog/how-flink-handles-backpressure.
- [39] Spark, “Configuration: dynamic allocation in Spark,” 2021, https://spark.apache.org/docs/latest/job-scheduling.html#dynamic-resource-allocation.
- [40] E. Begoli, J. Camacho-Rodríguez, J. Hyde, M. J. Mior, and D. Lemire, “Apache calcite: A foundational framework for optimized query processing over heterogeneous data sources,” in Proceedings of the 2018 International Conference on Management of Data, ser. SIGMOD ’18. New York, NY, USA: Association for Computing Machinery, 2018, p. 221–230. [Online]. Available: https://doi.org/10.1145/3183713.3190662
- [41] G. Lim, M. S. Hassan, Z. Jin, S. Volos, and M. Jeon, “Approximate quantiles for datacenter telemetry monitoring,” in 2020 IEEE 36th International Conference on Data Engineering. USA: IEEE, 2020, pp. 1914–1917.
- [42] Prometheus, “Prometheus-estimate percentiles from histograms.” 2021, https://prometheus.io/docs/practices/histograms/.
- [43] V. Kalavri, J. Liagouris, M. Hoffmann, D. Dimitrova, M. Forshaw, and T. Roscoe, “Three Steps is All You Need: Fast, Accurate, Automatic Scaling Decisions for Distributed Streaming Dataflows,” in Proceedings of the 12th USENIX Conference on Operating Systems Design and Implementation, ser. OSDI ’18. USA: USENIX Association, 2018, p. 783–798.
- [44] S. Venkataraman, A. Panda, K. Ousterhout, M. Armbrust, A. Ghodsi, M. J. Franklin, B. Recht, and I. Stoica, “Drizzle: Fast and adaptable stream processing at scale,” in Proceedings of the 26th Symposium on Operating Systems Principles, ser. SOSP ’17. New York, NY, USA: Association for Computing Machinery, 2017, p. 374–389. [Online]. Available: https://doi.org/10.1145/3132747.3132750
- [45] G. Dósa, R. Li, X. Han, and Z. Tuza, “Tight absolute bound for first fit decreasing bin-packing: Ffd(l)¡=11/9 opt(l)+6/9,” Theoretical Computer Science, vol. 510, pp. 13–61, 2013. [Online]. Available: https://www.sciencedirect.com/science/article/pii/S0304397513006774
- [46] B. Radunović and J.-Y. L. Boudec, “A Unified Framework for Max-Min and Min-Max Fairness with Applications,” IEEE/ACM Trans. Netw., vol. 15, no. 5, p. 1073–1083, Oct. 2007. [Online]. Available: https://doi.org/10.1109/TNET.2007.896231
- [47] A. Jonathan, A. Chandra, and J. Weissman, “Multi-Query Optimization in Wide-Area Streaming Analytics,” in Proceedings of the ACM Symposium on Cloud Computing, ser. SoCC ’18. New York, NY, USA: Association for Computing Machinery, 2018, p. 412–425. [Online]. Available: https://doi.org/10.1145/3267809.3267842
- [48] P. Pietzuch, J. Ledlie, J. Shneidman, M. Roussopoulos, M. Welsh, and M. Seltzer, “Network-aware operator placement for stream-processing systems,” in 22nd International Conference on Data Engineering, 2006, pp. 49–49.
- [49] A. S. Foundation, “A subproject of Apache NiFi to collect data where it originates,” 2018, https://nifi.apache.org/minifi/.
- [50] Apache Software Foundation, “An easy to use, powerful, and reliable system to process and distribute data,” 2018, https://nifi.apache.org/.
- [51] Esoteric, “Java binary serialization and cloning: fast, efficient, automatic,” 2020, https://github.com/EsotericSoftware/kryo/.
- [52] Apache Flink, “Apache NiFi Connector,” 2021, https://ci.apache.org/projects/flink/flink-docs-master/docs/connectors/datastream/nifi/.
- [53] Flink Side Output, “Side Outputs,” 2021, https://ci.apache.org/projects/flink/flink-docs-master/docs/dev/datastream/side_output/.
- [54] Flink, “Apache Flink - Timely Stream Processing,” 2020, https://ci.apache.org/projects/flink/flink-docs-release-1.13/docs/concepts/time/.
- [55] A. M. Aly, A. Sallam, B. M. Gnanasekaran, L.-V. Nguyen-Dinh, W. G. Aref, M. Ouzzani, and A. Ghafoor, “M3: Stream processing on main-memory mapreduce,” in 2012 IEEE 28th International Conference on Data Engineering, 2012, pp. 1253–1256.
- [56] M. Nardelli, V. Cardellini, V. Grassi, and F. L. Presti, “Efficient operator placement for distributed data stream processing applications,” IEEE Transactions on Parallel and Distributed Systems, vol. 30, no. 8, pp. 1753–1767, 2019.
- [57] M. Jeon, S. Kim, S.-w. Hwang, Y. He, S. Elnikety, A. L. Cox, and S. Rixner, “Predictive parallelization: Taming tail latencies in web search,” in Proceedings of the 37th International ACM SIGIR Conference on Research and Development in Information Retrieval, ser. SIGIR ’14. New York, NY, USA: Association for Computing Machinery, 2014, p. 253–262. [Online]. Available: https://doi.org/10.1145/2600428.2609572
- [58] D. Logothetis, C. Trezzo, K. C. Webb, and K. Yocum, “In-situ mapreduce for log processing,” in Proceedings of the 2011 USENIX Conference on USENIX Annual Technical Conference, ser. USENIXATC’11. USA: USENIX Association, 2011, p. 9.
- [59] R. Gracia-Tinedo, M. Sanchez-Artigas, P. Garcia-Lopez, Y. Moatti, and F. Gluszak, “Lamda-flow: Automatic pushdown of dataflow operators close to the data,” in 2019 19th IEEE/ACM International Symposium on Cluster, Cloud and Grid Computing, 2019, pp. 112–121.
- [60] X. Zhao, Y. Zhang, D. Lion, M. F. Ullah, Y. Luo, D. Yuan, and M. Stumm, “lprof: A non-intrusive request flow profiler for distributed systems,” in 11th USENIX Symposium on Operating Systems Design and Implementation. Broomfield, CO: USENIX Association, Oct. 2014, pp. 629–644. [Online]. Available: https://www.usenix.org/conference/osdi14/technical-sessions/presentation/zhao
- [61] Y. Moatti, E. Rom, R. Gracia-Tinedo, D. Naor, D. Chen, J. Sampe, M. Sanchez-Artigas, P. Garcıa-Lopez, F. Gluszak, E. Deschdt, F. Pace, D. Venzano, and P. Michiardi, “Too big to eat: Boosting analytics data ingestion from object stores with scoop,” in 2017 IEEE 33rd International Conference on Data Engineering, 2017, pp. 309–320.
- [62] C. Lei, Z. Zhuang, E. A. Rundensteiner, and M. Y. Eltabakh, “Redoop infrastructure for recurring big data queries,” Proc. VLDB Endow., vol. 7, no. 13, p. 1589–1592, Aug. 2014. [Online]. Available: https://doi.org/10.14778/2733004.2733037
- [63] S. Lakshminarasimhan, X. Zou, D. A. Boyuka, S. V. Pendse, J. Jenkins, V. Vishwanath, M. E. Papka, S. Klasky, and N. F. Samatova, “Diraq: Scalable in situ data- and resource-aware indexing for optimized query performance,” Cluster Computing, vol. 17, no. 4, p. 1101–1119, Dec. 2014. [Online]. Available: https://doi.org/10.1007/s10586-014-0358-z
- [64] H. Zou, Y. Yu, W. Tang, and H.-W. M. Chen, “Flexanalytics: A flexible data analytics framework for big data applications with i/o performance improvement,” Big Data Research, vol. 1, pp. 4–13, 2014, special Issue on Scalable Computing for Big Data. [Online]. Available: https://www.sciencedirect.com/science/article/pii/S2214579614000021
- [65] Y. Ahmad and U. Çetintemel, “Network-aware query processing for stream-based applications,” in Proceedings of the Thirtieth International Conference on Very Large Data Bases - Volume 30, ser. VLDB ’04. VLDB Endowment, 2004, p. 456–467.
- [66] F. Starks and T. P. Plagemann, “Operator placement for efficient distributed complex event processing in manets,” in 2015 IEEE 11th International Conference on Wireless and Mobile Computing, Networking and Communications, 2015, pp. 83–90.
- [67] B. J. Bonfils and P. Bonnet, “Adaptive and decentralized operator placement for in-network query processing,” in Information Processing in Sensor Networks, F. Zhao and L. Guibas, Eds. Berlin, Heidelberg: Springer Berlin Heidelberg, 2003, pp. 47–62.
- [68] S. Bokhari, “A shortest tree algorithm for optimal assignments across space and time in a distributed processor system,” IEEE Transactions on Software Engineering, vol. SE-7, no. 6, pp. 583–589, 1981.
- [69] V. Kumar, B. Cooper, and K. Schwan, “Distributed stream management using utility-driven self-adaptive middleware,” in Second International Conference on Autonomic Computing, 2005, pp. 3–14.
- [70] V. Cardellini, V. Grassi, F. Lo Presti, and M. Nardelli, “Optimal operator replication and placement for distributed stream processing systems,” SIGMETRICS Perform. Eval. Rev., vol. 44, no. 4, p. 11–22, May 2017. [Online]. Available: https://doi.org/10.1145/3092819.3092823
- [71] T. Hiessl, V. Karagiannis, C. Hochreiner, S. Schulte, and M. Nardelli, “Optimal placement of stream processing operators in the fog,” in 2019 IEEE 3rd International Conference on Fog and Edge Computing, 2019, pp. 1–10.
- [72] I. Flouris, N. Giatrakos, A. Deligiannakis, and M. Garofalakis, “Network-wide complex event processing over geographically distributed data sources,” Information Systems, vol. 88, p. 101442, 2020. [Online]. Available: https://www.sciencedirect.com/science/article/pii/S0306437919304946
- [73] L. Xu, B. Peng, and I. Gupta, “Stela: Enabling stream processing systems to scale-in and scale-out on-demand,” in 2016 IEEE International Conference on Cloud Engineering, 2016, pp. 22–31.
- [74] G. Mencagli, “A game-theoretic approach for elastic distributed data stream processing,” ACM Trans. Auton. Adapt. Syst., vol. 11, no. 2, Jun. 2016. [Online]. Available: https://doi.org/10.1145/2903146
- [75] V. Cardellini, F. Lo Presti, M. Nardelli, and G. Russo Russo, “Decentralized self-adaptation for elastic data stream processing,” Future Generation Computer Systems, vol. 87, pp. 171–185, 2018. [Online]. Available: https://www.sciencedirect.com/science/article/pii/S0167739X17326821
- [76] B. Lohrmann, D. Warneke, and O. Kao, “Nephele streaming: Stream processing under qos constraints at scale,” Cluster Computing, vol. 17, no. 1, p. 61–78, Mar. 2014. [Online]. Available: https://doi.org/10.1007/s10586-013-0281-8
- [77] G. Mencagli, M. Vanneschi, and E. Vespa, “A cooperative predictive control approach to improve the reconfiguration stability of adaptive distributed parallel applications,” ACM Trans. Auton. Adapt. Syst., vol. 9, no. 1, Mar. 2014. [Online]. Available: https://doi.org/10.1145/2567929
- [78] R. K. Kombi, N. Lumineau, and P. Lamarre, “A preventive auto-parallelization approach for elastic stream processing,” in 2017 IEEE 37th International Conference on Distributed Computing Systems, 2017, pp. 1532–1542.
- [79] S. Schneider, H. Andrade, B. Gedik, A. Biem, and K. Wu, “Elastic scaling of data parallel operators in stream processing,” in 23rd IEEE International Symposium on Parallel and Distributed Processing. IEEE, 2009, pp. 1–12. [Online]. Available: https://doi.org/10.1109/IPDPS.2009.5161036
- [80] B. Gedik, S. Schneider, M. Hirzel, and K.-L. Wu, “Elastic scaling for data stream processing,” IEEE Transactions on Parallel and Distributed Systems, vol. 25, no. 6, pp. 1447–1463, 2014.
- [81] C. Hochreiner, M. Vögler, S. Schulte, and S. Dustdar, “Elastic stream processing for the internet of things,” in 2016 IEEE 9th International Conference on Cloud Computing, 2016, pp. 100–107.
- [82] R. Mayer, B. Koldehofe, and K. Rothermel, “Predictable low-latency event detection with parallel complex event processing,” IEEE Internet of Things Journal, vol. 2, no. 4, pp. 274–286, 2015.
- [83] A. Floratou, A. Agrawal, B. Graham, S. Rao, and K. Ramasamy, “Dhalion: Self-regulating stream processing in heron,” Proc. VLDB Endow., vol. 10, no. 12, p. 1825–1836, Aug. 2017. [Online]. Available: https://doi.org/10.14778/3137765.3137786
- [84] O. Saleh and K.-U. Sattler, “The pipeflow approach: Write once, run in different stream-processing engines,” in Proceedings of the 9th ACM International Conference on Distributed Event-Based Systems, ser. DEBS ’15. New York, NY, USA: Association for Computing Machinery, 2015, p. 368–371. [Online]. Available: https://doi.org/10.1145/2675743.2776774
- [85] R. Mayer, C. Mayer, M. A. Tariq, and K. Rothermel, “Graphcep: Real-time data analytics using parallel complex event and graph processing,” in Proceedings of the 10th ACM International Conference on Distributed and Event-Based Systems, ser. DEBS ’16. New York, NY, USA: Association for Computing Machinery, 2016, p. 309–316. [Online]. Available: https://doi.org/10.1145/2933267.2933509
- [86] N. Rivetti, L. Querzoni, E. Anceaume, Y. Busnel, and B. Sericola, “Efficient key grouping for near-optimal load balancing in stream processing systems,” in Proceedings of the 9th ACM International Conference on Distributed Event-Based Systems, ser. DEBS ’15. New York, NY, USA: Association for Computing Machinery, 2015, p. 80–91. [Online]. Available: https://doi.org/10.1145/2675743.2771827
- [87] E. Zeitler and T. Risch, “Massive scale-out of expensive continuous queries,” Proc. VLDB Endow., vol. 4, no. 11, p. 1181–1188, Aug. 2011. [Online]. Available: https://doi.org/10.14778/3402707.3402752
- [88] T. Akidau, A. Balikov, K. Bekiroğlu, S. Chernyak, J. Haberman, R. Lax, S. McVeety, D. Mills, P. Nordstrom, and S. Whittle, “Millwheel: Fault-tolerant stream processing at internet scale,” Proc. VLDB Endow., vol. 6, no. 11, p. 1033–1044, Aug. 2013. [Online]. Available: https://doi.org/10.14778/2536222.2536229
- [89] L. Neumeyer, B. Robbins, A. Nair, and A. Kesari, “S4: distributed stream computing platform,” in ICDMW 2010, The 10th IEEE International Conference on Data Mining Workshops, W. Fan, W. Hsu, G. I. Webb, B. Liu, C. Zhang, D. Gunopulos, and X. Wu, Eds. IEEE Computer Society, 2010, pp. 170–177. [Online]. Available: https://doi.org/10.1109/ICDMW.2010.172
- [90] N. R. Katsipoulakis, A. Labrinidis, and P. K. Chrysanthis, “A holistic view of stream partitioning costs,” Proc. VLDB Endow., vol. 10, no. 11, p. 1286–1297, Aug. 2017. [Online]. Available: https://doi.org/10.14778/3137628.3137639
- [91] G. Mencagli, M. Torquati, F. Lucattini, S. Cuomo, and M. Aldinucci, “Harnessing sliding-window execution semantics for parallel stream processing,” Journal of Parallel and Distributed Computing, 11 2017.
- [92] N. Rivetti, E. Anceaume, Y. Busnel, L. Querzoni, and B. Sericola, “Online scheduling for shuffle grouping in distributed stream processing systems,” in Proceedings of the 17th International Middleware Conference, ser. Middleware ’16. New York, NY, USA: Association for Computing Machinery, 2016. [Online]. Available: https://doi.org/10.1145/2988336.2988347
- [93] G. Mencagli, M. Torquati, and M. Danelutto, “Elastic-ppq: A two-level autonomic system for spatial preference query processing over dynamic data streams,” Future Generation Computer Systems, vol. 79, pp. 862–877, 2018. [Online]. Available: https://www.sciencedirect.com/science/article/pii/S0167739X1730938X
- [94] Y. Kwon, M. Balazinska, B. Howe, and J. Rolia, “Skewtune: Mitigating skew in mapreduce applications,” in Proceedings of the 2012 ACM SIGMOD International Conference on Management of Data, ser. SIGMOD ’12. New York, NY, USA: Association for Computing Machinery, 2012, p. 25–36. [Online]. Available: https://doi.org/10.1145/2213836.2213840
- [95] E. Kirpichov and M. Denielou, “No shard left behind: dynamic work rebalancing in Google Cloud Dataflowy,” 2016, https://cloud.google.com/blog/bigdata/2016/05/no-shard-left-behinddynamic-work-rebalancing-in-googlecloud-dataflow.
- [96] R. Mayer, M. A. Tariq, and K. Rothermel, “Minimizing communication overhead in window-based parallel complex event processing,” in Proceedings of the 11th ACM International Conference on Distributed and Event-Based Systems, ser. DEBS ’17. New York, NY, USA: Association for Computing Machinery, 2017, p. 54–65. [Online]. Available: https://doi.org/10.1145/3093742.3093914
- [97] M. A. U. Nasir, G. D. F. Morales, D. García-Soriano, N. Kourtellis, and M. Serafini, “The power of both choices: Practical load balancing for distributed stream processing engines,” in 31st IEEE International Conference on Data Engineering, J. Gehrke, W. Lehner, K. Shim, S. K. Cha, and G. M. Lohman, Eds. IEEE Computer Society, 2015, pp. 137–148. [Online]. Available: https://doi.org/10.1109/ICDE.2015.7113279
- [98] X. Fu, T. Ghaffar, J. C. Davis, and D. Lee, “Edgewise: A Better Stream Processing Engine for the Edge,” in Proceedings of the 2019 USENIX Conference on Usenix Annual Technical Conference, ser. USENIX ATC ’19. USA: USENIX Association, 2019, p. 929–945.
- [99] T. Elgamal, A. Sandur, P. Nguyen, K. Nahrstedt, and G. Agha, “Droplet: Distributed operator placement for iot applications spanning edge and cloud resources,” in 2018 IEEE 11th International Conference on Cloud Computing, 2018, pp. 1–8.
- [100] T. Elgamal, “Costless: Optimizing cost of serverless computing through function fusion and placement,” in 2018 IEEE/ACM Symposium on Edge Computing, 2018, pp. 300–312.