Discovery of a damped Ly absorber originating in a spectacular interacting dwarf galaxy pair at 111Based on data gathered with the 6.5m Magellan Telescopes located at Las Campanas Observatory and the NASA/ESA Hubble Space Telescope operated by the Space Telescope Science Institute and the Association of Universities for Research in Astronomy, Inc., under NASA contract NAS 5-26555.
Abstract
We present the discovery of neutral gas detected in both damped Ly absorption (DLA) and H i 21-cm emission outside of the stellar body of a galaxy, the first such detection in the literature. A joint analysis between the Cosmic Ultraviolet Baryon Survey and the MeerKAT Absorption Line Survey reveals an H i bridge connecting two interacting dwarf galaxies (log) that host a DLA with log[(H i)/cm-2] toward the QSO J23395523 (). At impact parameters of and kpc, the dwarf galaxies have no companions more luminous than within at least km s-1 and kpc. H i 21-cm emission is spatially coincident with the DLA at the 2–3 level per spectral channel over several adjacent beams. However, H i 21-cm absorption is not detected against the radio-bright QSO; if the background UV and radio sources are spatially aligned, the gas is either warm or clumpy (with spin temperature to covering factor ratio K). VLT-MUSE observations demonstrate that the -element abundance of the ionized ISM is consistent with the DLA (% solar), suggesting that the neutral gas envelope is perturbed ISM gas. This study showcases the impact of dwarf-dwarf interactions on the physical and chemical state of neutral gas outside of star-forming regions. In the SKA era, joint UV and H i 21-cm analyses will be critical for connecting the cosmic neutral gas content to galaxy environments.
1 Introduction
Damped Lyman- absorbers (DLAs; log[(H i)/cm-2] ) have sufficiently large H i column densities to be self-shielded against ionizing radiation and trace a dominant fraction of neutral gas in the Universe, making them critical probes of the galactic and circumgalactic environments related to star formation (for reviews, see Wolfe et al., 2005; Chen, 2017; Krogager et al., 2017). Low-redshift DLAs () detected through ultraviolet (UV) absorption-line spectroscopy using the unique capabilities of the Hubble Space Telescope (HST) are particularly important to our understanding of DLA host galaxies, which can be most easily detected and characterized in the local Universe (e.g., Battisti et al. 2012; Neeleman et al. 2016; though note discussion of possible redshift evolution in the DLA host galaxy population, e.g., Neeleman et al. 2019; Kaur et al. 2021). Previous studies suggest that low-redshift DLA host galaxies resemble the general field population and are thus diverse in their colors, luminosities, and environments, including both isolated galaxies and group members (e.g., Chen & Lanzetta, 2003; Chen et al., 2005; Rao et al., 2011; Péroux et al., 2016).
Ambiguities in the origin of DLA gas — whether it is from a gaseous disk, halo, intragroup gas, or infalling/outflowing material — can be understood by observing H i in emission through the 21-cm transition, which is sensitive to H i cm-2. If the background quasar is also bright at radio wavelengths, the H i 21-cm absorption can be used to constrain the cold neutral medium (CNM) fraction of the DLA and the clumpiness of any cold gas (e.g., Srianand et al., 2012; Kanekar et al., 2014). However, DLAs in front of radio-loud quasars and at sufficiently low redshift () to be detectable in H i 21-cm emission with current radio telescopes remain extremely rare.
Kanekar et al. (2018) report H i 21-cm emission-line observations of four DLAs at , but the spatial resolution of these single-dish data is inadequate to unambiguously associate the 21-cm emission to individual galaxies or to dissect its origin. To the best of our knowledge, only two cases of bonafide DLAs with spatially resolved H i 21-cm observations have been reported in the literature. In the first case, the quasar sightline passes through the optical extent of a low surface brightness galaxy at (Bowen et al., 2001; Chengalur & Kanekar, 2002). In the second case, Borthakur et al. (2019) mapped the neutral gas properties of a galaxy group that hosts a DLA at ; no H i 21-cm emission was detected to be spatially coincident with the DLA. The quasar in both cases is not bright at radio wavelengths. H i 21-cm emission-line detections of several galaxies associated with 21-cm absorbers have also been reported in the literature (e.g., Carilli & van Gorkom, 1992; Dutta et al., 2016; Gupta et al., 2018). These confirm the complexity of the galaxy/absorber relationship, but UV-selected DLAs with spatially resolved H i 21-cm emission-line mapping of their galactic environments remain scarce.
Here, we report the rare case of a bonafide DLA () that coincides with H i 21-cm emission outside of the optical extent of a galaxy. The background QSO J23395523 () is also bright at radio wavelengths (185 mJy at 1.4 GHz), and thus we can constrain the thermal state and clumpiness of the gas through H i 21-cm absorption. A deep galaxy redshift survey demonstrates that the DLA is associated with an interacting dwarf galaxy pair that is otherwise isolated from massive companions. This system is a valuable case study of the impact of dwarf-dwarf interactions on their neutral gas reservoirs independent of the influence of a nearby massive galaxy and its hot halo.
Throughout the paper, we adopt the solar abundance pattern of Asplund et al. (2009). We assume a cosmology with , , and km s-1 Mpc-1.
2 Data and Analysis
This study is based on data from the Cosmic Ultraviolet Baryon Survey (CUBS; Chen et al. 2020) and the MeerKAT Absorption Line Survey (MALS; Gupta et al. 2016). Below we describe the data reduction and analysis of UV absorption-line spectroscopy of J2339-5523 in §2.1, H i 21-cm observations from MeerKAT in §2.2, and optical integral field unit (IFU) observations from the Multi Unit Spectroscopic Explorer (MUSE) on the Very Large Telescope in §2.3.
2.1 UV Absorption-Line Analysis
We refer the reader to Chen et al. (2020) for a description of the absorption-line observations of J2339-5523 from the Cosmic Origins Spectrograph (COS) on HST ( Å, spectral resolution FWHM km s-1) and the Magellan Inamori Kyocera Echelle (MIKE) spectrograph on Magellan-Clay ( = 3200–9200 Å, FWHM km s-1). We use Voigt profile fitting to determine the velocity (), Doppler parameter (), and column density () of the atomic and ionic transitions associated with the DLA using a grid search as described in §3 of Boettcher et al. (2021). The COS wavelength calibration is sufficiently uncertain that we allow small variations within km s-1 for low and intermediate ions in COS with respect to Ca II3934, 3969 in MIKE. We construct a marginalized probability density function for each parameter by calculating a likelihood of the form at every point in parameter space, normalizing the total likelihood to unity, and integrating over the marginalized parameters. We adopt as the best-fit model the parameters corresponding to a value of 50% from the cumulative distribution function. The reported uncertainties correspond to the 68% confidence interval, and the upper limits are reported as the 95% one-sided confidence interval. We additionally perform a curve of growth (COG) analysis for the low and intermediate ions to corroborate the characteristic Doppler parameter determined by the Voigt profile fitting.
2.2 MeerKAT H i 21-cm Analysis
We observed the field centered at J2339-5523 using the MeerKAT-64 array on 2020 June 14 and 22. Of the 64 antennas, 59 and 60 antennas participated in the first and second observing run, respectively. We used the 32K mode of the SKA Reconfigurable Application Board (SKARAB) correlator to split the total bandwidth of 856 MHz centered at 1283.9869 MHz into 32,768 frequency channels. The resultant frequency resolution is 26.123 kHz, or 5.7 km s-1, at the redshifted H i 21-cm line frequency of the DLA. PKS 1939-638 and PKS 0408-658 were observed for flux density, delay, and bandpass calibrations, and the compact radio source J2329-4730 was observed for complex gain calibration. The total on-source time on J2339-5523 was 112 mins.
The MeerKAT data were processed using the Automated Radio Telescope Imaging Pipeline (ARTIP); we refer the reader to Gupta et al. (2021) for details. Here, we focus on the Stokes- radio continuum and spectral line properties near the H i 21-cm line frequency corresponding to (1384.4 MHz). The spatial resolution represented by the synthesized beam of the continuum image and image cube obtained using robust = 0 weighting is (position angle = 13∘.8), with a spatial pixel size of . The cube has been deconvolved, or cleaned, using the CASA task tclean down to five times the single channel rms of 0.45 mJy beam-1. The radio emission associated with J2339-5523 is compact with a deconvolved source size of .
We used the H i Source Finding Application (SOFIA v2.0; Serra et al., 2015; Westmeier et al., 2021) for the H i 21-cm analysis of the spectral line cube. We set SOFIA to subtract residual continuum subtraction errors from the image cube by fitting a polynomial of order 1. We used the smooth+clip (S+C) algorithm with a combination of spatial kernels of 0, 3, 6, and 9 pixels, and spectral kernels of 0, 3, 7, and 15 channels, to detect voxels containing H i 21-cm emission in the image cube. We set the threshold of the S+C finder to 3.5 and used the reliability filter to reject unreliable detections. The output three dimensional mask was then used to further clean the image cube down to the single channel rms. This deep cleaned cube was then passed through SOFIA with the above-mentioned setup to generate the final H i moment maps and the integrated spectrum. For the moment 1 and 2 maps, we used only those pixels where the signal was detected at 1.5 times the local rms. In the moment 0 map, the mean value of pixels with in the range – corresponds to an H i column density of (H i) = cm-2. This represents the average column density sensitivity across the map (see de Blok et al. 2018 for details of this sensitivity estimate).
2.3 VLT-MUSE Analysis
We observed the field of J2339-5523 on 2020 Nov 22, Dec 05, and Dec 09 using VLT-MUSE. The total exposure time on source was 9390 s. We reduced the data using the standard ESO MUSE pipeline (Weilbacher et al., 2014) and the custom software CubExtractor from S. Cantalupo (Cantalupo et al., 2019). We subtracted the quasar light using a high-resolution spectral differential imaging method (e.g., Haffert et al., 2019). The wavelength coverage is Å, and the spectral resolution at the blue (red) end is (). This corresponds to a FWHM of km s-1 ( km s-1), with approximately two wavelength bins sampling the spectral resolution element. Multiple pointings mapped a region of around the QSO. We spatially smoothed the MUSE data cube with a boxcar kernel of pixels, where the kernel size was chosen to approximate the seeing disk at the time of the observations (, or kpc at the redshift of the DLA).
We construct continuum-subtracted narrow-band images at the wavelength of all emission lines at the redshift of the DLA. We subtract the continuum by fitting a linear function locally around the masked lines. In parts of both dwarf galaxies, Balmer absorption from the stellar continuum modestly impacts the observed H and H emission. To correct for this, we use the stellar population synthesis code bagpipes222https://bagpipes.readthedocs.io/en/latest/ (Carnall et al., 2018) to fit a tau model to the stellar continuum of a bright, star-forming region in each galaxy assuming a spatially uniform star-formation history; the equivalent widths of the Balmer lines in the best-fit models are in the range – Å. We then scale the models to the continuum level of any spaxel for which the continuum light is detected at at the wavelength of H or H. To allow for a possible velocity offset between the stars and the gas, we adopt a broad window of km s-1 ( km s-1) when constructing the narrow-band images of the Balmer lines for spaxels with (without) this correction applied. We derive an extinction correction using the extinction law of Cardelli et al. (1989) from the reddening, , calculated from the Balmer decrement following Calzetti et al. (1994) for every spaxel for which H and H are detected at the level.
Finally, we fit the six strongest emission lines (H, H, [OIII]4960, 5008, and [SII]6718, 6732) with a single Gaussian profile using the IDL software KUBEVIZ333http://www.mpe.mpg.de/ dwilman/kubeviz/. This yields a velocity centroid and velocity dispersion, corrected for the instrumental resolution, for the ionized gas in each spaxel with statistically significant emission.
3 Results
We present the properties of the DLA in §3.1. We then discuss the associated dwarf galaxy pair in §3.2, before characterizing the neutral and warm ionized gas properties of the dwarfs and their environs in the following two Sections.
3.1 A dusty, low-metallicity DLA
| Column densities for limits and ions fit with as free parameteraaWe impose the prior that km s-1 km s-1 in the Voigt profile fitting of neutral, singly, and doubly ionized species based on the COG analysis. | |||
|---|---|---|---|
| Ion | (km s-1) | log[/cm-2] | Comments |
| H I | unconstrained due to Ly damping wings; independent of | ||
| C I | fixed to km s-1 based on Ca II | ||
| C II* | fixed to km s-1 based on Ca II | ||
| C IV | |||
| N I | |||
| N V | fixed to km s-1 based on C IV; comparable found for km s-1 | ||
| Si IV | fixed to km s-1 based on C IV; both 1393 and 1402 Å transitions contaminated | ||
| P II | Probability density function is flat in for km s-1 km s-1 | ||
| S II | |||
| S III | S III1190 blended with Si II1190; S III value not well constrained | ||
| Ca II | |||
| Fe II | |||
| Column densities for km s-1, km s-1bbWe report the best-fit column density corresponding to km s-1 and km s-1 for ions with only saturated and/or low transitions available; the values are chosen based on the COG analysis. | |||
| log[/cm-2] | log[/cm-2] | ||
| ( km s-1) | ( km s-1) | ||
| C II | 17.6 | 15.1 | C II1334 is saturated |
| N II | 14.7 | 14.2 | Only low N II1083 transition available |
| O I | 17.7 | 15.5 | O I1302 is saturated |
| Al II | 14.9 | 13.3 | Al II1670 is saturated |
| Si II | 15.9 | 14.5 | Five saturated lines available |
| Si III | 15.6 | 13.8 | Si III1206 is saturated |
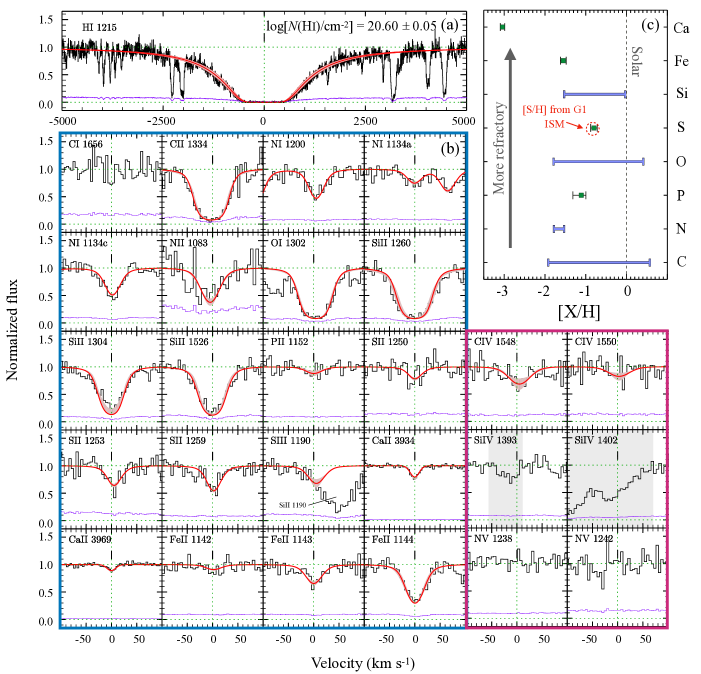
In Table 1, we list the best-fit column densities and Doppler parameters for all atomic and ionic species associated with the DLA, and we show a representative sample of the absorption lines and their best-fit models in Fig. 1. The H i column density determined from the Ly line is log[(H i)/cm-2] = . The uncertainty is dominated by the continuum fitting, as determined by repeated measurements of (H i) from independent, manual fits to the local continuum prior to the Ly fitting.
The Ca II3934, 3969 lines are the only associated absorption features detected in the MIKE data and indicate a single velocity component at , which we adopt as the velocity zeropoint in the following analysis. The Ca II lines have a Doppler parameter of km s-1, which we corroborate using a COG analysis for low and intermediate ions in COS that span a wide range of oscillator strengths. The best constraints come from six Fe II and six N I transitions; these measurements suggest that km s-1, and we impose this prior in the Voigt profile fitting of neutral, singly, and doubly ionized species. Only saturated or low lines are available for O I, C II, N II, Al II, Si II, and Si III, and we report a range of column densities corresponding to km s-1 for these species. There is some indication of moderate ionization state gas associated with the DLA from the detection of C IV (the Si IV transitions are contaminated by interlopers). The C IV Doppler parameter exceeds that of the low ions by a factor of two, hinting that it may arise in a boundary layer between the neutral absorber and a hot ambient medium (e.g., Fox et al., 2005).
In panel (c) of Fig. 1, we show the chemical abundances, [X/H], for a range of elements ordered from most volatile to most refractory. Our best leverage on the metallicity of the DLA comes from S, which is only mildly depleted in a dusty medium (e.g., De Cia et al., 2016) and suggests Z Z⊙. In contrast, we find [Fe/H] and [Ca/H] , suggesting dust depletion of the most refractory elements. The decrement in [Fe/H] compared to [S/H] is consistent with the Galactic halo depletion pattern of Savage & Sembach (1996). Due to the low second ionization energy of Ca (11.9 eV), it is possible that we underestimate [Ca/H] by assuming (Ca) = (Ca II). However, the presence of dust depletion is clear from the under-abundance of Fe alone. Applying the method of De Cia et al. (2021), we use the well-constrained S and Fe abundances to determine a total, dust-corrected metallicity of [X/H] using the depletion patterns of De Cia et al. (2016). This is consistent with being drawn from the metallicity distribution of known DLAs at low redshift (Lehner et al., 2019).
3.2 An isolated dwarf galaxy pair as DLA host
| G1 | G2 | |
|---|---|---|
| Name | CUBS2339z002_G6 | CUBS2339z002_G32 |
| RA | 23h39m14.11s | 23h39m18.82s |
| Decl. | d23m41.9s | d24m30.5s |
| (′′)aaRA offsets (), decl. offsets (), angular separations (), and impact parameters () are measured with respect to the QSO position at RA, decl. 23h39m13.22s, d23m50.8s. | ||
| (′′)aaRA offsets (), decl. offsets (), angular separations (), and impact parameters () are measured with respect to the QSO position at RA, decl. 23h39m13.22s, d23m50.8s. | ||
| (′′)aaRA offsets (), decl. offsets (), angular separations (), and impact parameters () are measured with respect to the QSO position at RA, decl. 23h39m13.22s, d23m50.8s. | ||
| (kpc)aaRA offsets (), decl. offsets (), angular separations (), and impact parameters () are measured with respect to the QSO position at RA, decl. 23h39m13.22s, d23m50.8s. | ||
| bbLight-weighted mean redshift. | ||
| (km s-1)ccVelocity offset with respect to . | ||
| (mag)dd-band apparent magnitudes are from DES (Abbott et al., 2018) and are corrected for internal extinction adopting a characteristic for G1 and G2, respectively (see §3.4.3). | ||
| (mag) | ||
| logeeDetermined using the relation of Liang & Chen (2014) and stellar population modeling from bagpipes (Carnall et al., 2018). | ||
| SFR(H) yr | ||
| (H i) | ||
| (H ii) |
We observe two dwarf galaxies at the redshift of the DLA and employ a deep galaxy redshift survey to characterize their environment. Chen et al. (2020) describe the redshift survey conducted in all CUBS fields with LDSS-3C and IMACS on Magellan and VLT-MUSE. The spectroscopic component of this survey targets galaxies fainter than 18th magnitude within , so we primarily use photometric redshifts from the Dark Energy Survey (DES; Abbott et al. 2018). At the redshift of the DLA, a blue galaxy with has an apparent -band magnitude of assuming (Cool et al., 2012), where is the characteristic rest-frame absolute -band magnitude at the break of the luminosity function. We estimate the uncertainty on these photometric redshifts using 16 galaxies with with robust spectroscopic redshifts within . For galaxies at , we find . We do not find any galaxies with . There are two galaxies with . The first is at and kpc; this system has . The second is at and kpc and has . Thus, aside from the two dwarf galaxies, there are no galaxies more luminous than within kpc.
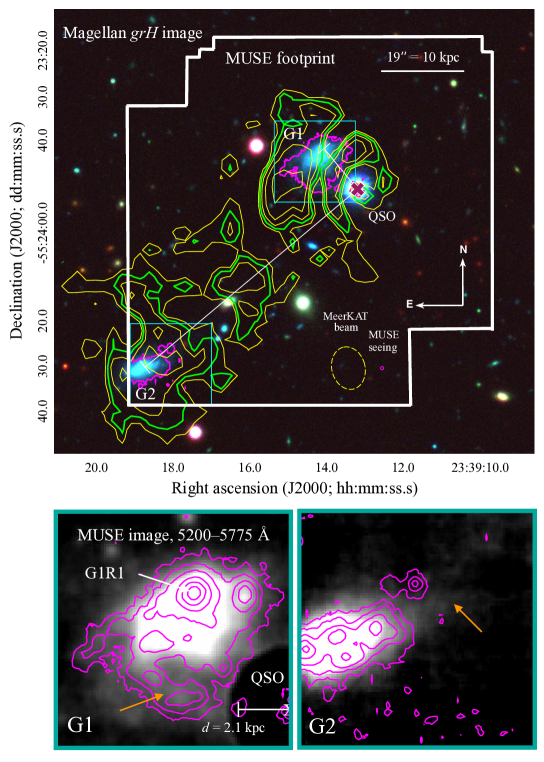
As shown in Fig. 2 and Table 2, the two dwarf galaxies are separated by 33 kpc and are within a projected velocity of km s-1 of the DLA. We refer to these galaxies as G1 and G2, where G1 is the galaxy at smaller impact parameter, , with respect to the QSO. At kpc, G1 is projected in close enough proximity to the QSO that the optical continuum light overlaps with the wing of the QSO point spread function (PSF) on the southwest side of the galaxy. G2 is found at the edge of the MUSE footprint at kpc and % of the area within the -band contour is found outside of the IFU coverage.
We estimate the stellar mass of both galaxies to be log from extinction-corrected, -band photometry from DES using the relation derived from NASA–Sloan Atlas galaxies by Liang & Chen (2014). We find comparable mass estimates from stellar population synthesis models using bagpipes. We estimate the halo mass of the galaxies to be log from the stellar mass-halo mass relation for field dwarfs determined by Read et al. (2017); this is consistent with the models of Behroozi et al. (2019). Following Maller & Bullock (2004), this yields a virial radius of kpc. Here, is defined based on the overdensity condition of Bryan & Norman (1998) at the redshift of the dwarfs. The projected separation of the dwarfs is thus approximately one third of their virial radii. As shown in Fig. 2, the optical continuum morphology of the faint outskirts of both dwarfs show disturbances; these irregularities are most prominent on the sides of the galaxies closest to their companion, including a faint stellar stream protruding from G1 that points toward the QSO. The extinction-corrected H luminosity of G1, erg s-1, suggests a star-formation rate (SFR) of M⊙ yr-1 following the relation of Calzetti (2008). About two thirds of the star formation is found in the bright, star-forming knot labeled G1R1 in Fig. 2. G2 is dimmer than G1 in H and thus has SFR(H) M⊙ yr-1 (a small fraction of the H flux may be unaccounted for due to the proximity of the galaxy to the edge of the detector).
3.3 Neutral gas properties of DLA host
We detect spatially extended H i 21-cm emission that reveals a neutral gas envelope surrounding G1 and G2 on a scale of kpc, including an apparent tidal bridge between them. We display the H i column density contours in Fig. 2. The bridge has a width of , or kpc, at the level of cm-2 and is thus resolved by MeerKAT’s synthesized beam (FWHM = kpc kpc). The total integrated line flux of the system is Jy km s-1, which corresponds to a total H i gas mass of H i M⊙. If we bisect the gas distribution at the midpoint between the galaxies, the two dwarfs are associated with nearly the same H i mass.
As shown in Fig. 2, the QSO sightline intersects the outer gaseous envelope of G1. In the vicinity of the QSO, H i emission from several voxels in the image cube contributes to the H i 21-cm column density. The emission is detected in individual spectral channels at the level. Within the MeerKAT synthesized beam, the characteristic column density at the location of the peak flux density of the QSO is log[(H i)/cm-2] . Despite the possible impact of beam dilution in a clumpy medium, this is remarkably consistent with the column density determined from the HST-COS absorption-line spectroscopy.
J2339-5523 is unresolved (size 300 pc) in the MeerKAT image. We visually examined the spectral line image cube and confirmed that no negative features representing H i 21-cm absorption at 2 level ( = 0.028 km s-1) are present towards the QSO. The strength of H i 21-cm absorption depends on the H i column density as well as the spin temperature, , and the covering factor of the absorbing gas, . If the radio-emitting region of the QSO is more spatially extended than the absorbing gas, then . The H i column density towards the UV-emitting region of the QSO is well constrained through the HST-COS observations of the DLA. If the UV- and radio-emitting regions of the QSO are spatially aligned, we can use the measured (H i) from COS to constrain the ratio of the spin temperature to the covering factor. Using a 5 upper limit on H i 21-cm absorption in the unsmoothed MeerKAT spectrum with a spectral rms of 0.44 mJy beam-1 per channel, we estimate a lower limit of K assuming a FWHM of 17 km s-1 ( = 10 km s-1) for the H i absorption line based on the metal lines detected in the COS and MIKE spectra.
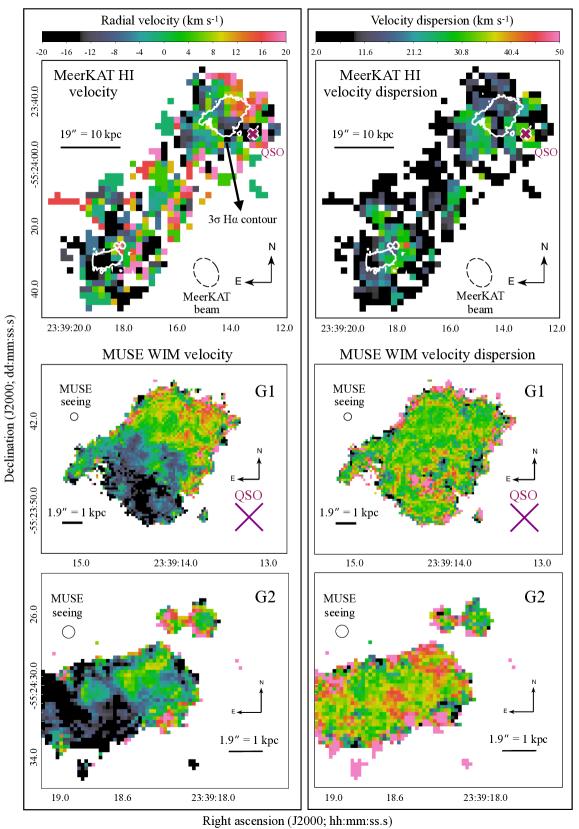
In the top panels of Fig. 3, we show the line-of-sight velocity and velocity dispersion of the neutral gas traced by H i 21-cm emission. The velocity shear across the neutral gas distribution is km s-1. The characteristic velocity dispersion within the bodies of G1 and G2 is – km s-1, and this value is a factor of two higher in parts of the extended medium, suggesting possible dynamical disturbance. Due to the relatively small number of MeerKAT beams sampling the gas distribution, we cannot draw strong conclusions about whether the bridge gas arises from G1 or G2. It is also not clear if the gas distribution in either galaxy is disk-like; there is no definitive evidence for organized rotation, and it is common for the gas content in galaxies of this mass to have significant dispersion support (e.g., El-Badry et al., 2018).
3.4 Warm ionized gas properties of DLA host
We analyze the warm ionized medium (WIM) in both dwarf galaxies with the goal of comparing observable properties of the ISM with those of the damped absorber to better characterize the origin of the neutral gas envelope. Among the emission lines covered by MUSE are H, H, [OIII]4960, 5008, [NII]6549, 6585, [SII]6718, 6732, and [SIII]6313, 9071, all of which are detected in at least one star-forming region in one or both galaxies.
3.4.1 WIM mass and morphology
As shown in Fig. 2, there is no evidence of spatially extended, optical line emission on scales larger than the stellar components of G1 and G2. The H surface brightness detection threshold in the vicinity of G1 (G2) is erg s-1 cm-2 arcsec-2 ( erg s-1 cm-2 arcsec-2). Notably, the WIM does not overlap with the quasar sightline at the detection threshold of the data. The line-emitting feature in closest projected proximity to the quasar sightline ( kpc) is an isolated cloud separated from the main body of G1 in the H surface-brightness contour (see Fig. 2). We used an optimal extraction method implemented in CubExtractor to search for H and [NII] emission on top of the QSO, but the noise properties of the region affected by the bright QSO PSF prohibit a sensitive constraint on the H surface brightness at this location.
We estimate the warm ionized gas mass in the ISM of G1 and G2 as follows. For a clumping factor , the H surface brightness depends on the mean electron density, , and the pathlength through the gas, , according to:
| (1) |
Here the electron density is in units of cm-3, and we assume an electron temperature K. If the ionized gas is found in a relatively thin disk ( kpc) in G1, then (H ii) M⊙ for between 10 and 1. If instead is closer to the projected size of the line-emitting region ( kpc), then the ionized gas mass may be as high as M⊙ for the same range of clumping factor. At approximately half of the H luminosity, the ionized gas mass estimates for G2 are roughly half of those for G1. Across these models, the electron density varies between cm-3, which is consistent with the constraint from ([SII]6718)/([SII]6732) that cm-3 (e.g., Osterbrock & Ferland, 2006). Thus, the warm ionized phase of the ISM likely contributes between a few percent to 50% as much mass as the neutral phase.
3.4.2 WIM kinematics
We show the generally quiescent kinematics of the warm ionized gas in the dwarf galaxies in Fig. 3. In G1, the line-of-sight velocities generally fall in the range km s km s-1; an ordered pattern is evident, with the southern side of the galaxy approaching and the northern side receding. The discrete cloud closest in projection to the QSO has a median km s-1, and comparable velocity offsets with respect to the absorber are seen in the portion of the main body of the galaxy in closest projected proximity. We find similar results for G2, with milder evidence for an ordered velocity gradient of a few tens of km s-1 from the southeast (approaching) to northwest (receding) side. The characteristic velocity dispersion of the WIM in both galaxies is km s-1 (corrected for spectral resolution), which is not resolved at the spectral resolution of the MUSE instrument. There is marked consistency between the velocity centroids of the DLA, and the H i and H ii gas.
3.4.3 WIM metallicity and dust content
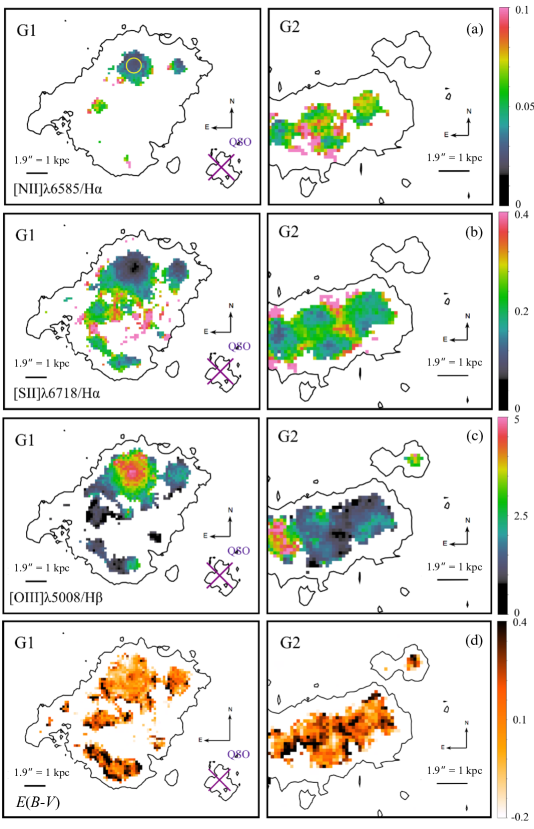
For G1R1, we detect both the auroral [SIII]6313 and the nebular [SIII]9071 transitions, permitting a measurement of and thus our most direct constraint on the gas-phase metallicity. In the upper left panel of Fig. 4, we show the aperture within which both lines are detected at the 3 level, and we find ([SIII](9533 + 9071))/(SIII]6313) within this region (note that the nebular lines have a fixed ratio of ([SIII]9533)/([SIII]9071) ). Following Osterbrock & Ferland (2006), this yields K at the density constrained by the [SII] doublet ( cm-3). Adopting this value of , we use the ([S II]6718)/(H) and ([S III]9533)/(H) line ratios to estimate S/H = S+/H + S++/H % of the solar value, consistent with the abundance determined for the DLA in §3.1.
We additionally detect several strong-line metallicity indicators in multiple star-forming regions in both galaxies, including N ([N II]6585)/(H) (e.g., Pettini & Pagel, 2004, hereafter PP04) (see Fig. 4). Following PP04, we find 12 + log(O/H) (20% solar) from N2 in G1R1 (note the 0.2 dex systematic uncertainty in the PP04 relation). We observe values up to 12 + log(O/H) = 8.3–8.4 (40–50% solar) in lower surface brightness regions of this galaxy, but we regard this as an upper limit due to the likely presence of diffuse ionized gas that elevates the observed line ratios and thus biases the metallicity measurement (e.g., Zhang et al., 2017; Vale Asari et al., 2019). In the star-forming regions of G2, 12 + log(O/H) is generally dex higher than in G1, suggesting slightly elevated metallicity in this galaxy. We corroborate a metallicity of a few tens of percent solar for G1 and G2 using Cloudy photoionization models to reproduce the observable emission-line ratios (Ferland et al., 2017). The dust extinction maps shown in the bottom panel of Fig. 4 indicate a characteristic for G1 and G2, respectively. This is comparable to the characteristic found for galaxies of this mass by Salim et al. (2018), suggesting that G1 and G2 are typical in their dust content.
4 Discussion and Concluding Remarks
This case study clearly confirms an association between the DLA and a neutral gas envelope surrounding two interacting dwarf galaxies in a rare instance of spatially resolved H i 21-cm emission that is coincident with a UV-selected DLA outside of the optical extent of a galaxy444See Chengalur & Kanekar (2002) for the one known instance inside of the optical extent.. Both the ISM of G1 and the DLA have relatively low metallicities (), contain dust, and show comparable kinematics, suggesting that the gas in the envelope originated in the ISM of the dwarf galaxies. Opportunities to compare the chemical enrichment of DLAs with that of the ionized ISM of the host galaxies remain rare. Aloisi et al. (2003) use a down-the-barrel approach to demonstrate that the neutral ISM has -element abundances below that of the H ii regions in I Zw 18, implying that the star-forming regions are enriched by recent star formation. In contrast, the DLA galaxy SBS 1543+593 has consistent -element abundances in its H ii regions and in the damped absorber that coincides with its inner ISM (Schulte-Ladbeck et al., 2004, 2005; Bowen et al., 2005). The J2339-5523 DLA provides a second case of consistency between the -element abundances of the damped absorber and the H ii regions in the host galaxy. Establishing a statistical sample of such systems in the local Universe will shed light on the nature of the host galaxies of low-metallicity DLAs at higher redshift.
Correlations between galaxy mass and/or morphology, optical size, and H i size are well characterized and establish expectations for the extent of the neutral gas distributions around the dwarf galaxies. Cayatte et al. (1994) report mean H i to optical diameter ratios in the range – for disk galaxies with a variety of morphological types in the field, while Broeils & Rhee (1997) find a consistent mean value of independent of morphological type. The equivalent ratio for G1 and G2 is between 2 and 3 and thus falls – towards the upper end of the distribution. Additionally, the LITTLE THINGS H i 21-cm survey of nearby dwarf irregular galaxies (Hunter et al., 2012), as well as dwarf galaxy samples from Kovač et al. (2009) and Lelli et al. (2014), suggest a relatively flat distribution of H i to optical diameter ratio, with some systems in the range of – (Bosma, 2017).
Wang et al. (2016) used a large sample of more than 500 galaxies from various samples to demonstrate a tight relation between H i diameter, (H i), and (H i). The relation suggests an overall similarity in the evolution of gas-rich galaxies, from small dwarfs to large spirals. The observed neutral gas mass is (H i) M⊙ for both dwarfs if we bisect the total H i distribution at their midpoint. This corresponds to a size of (H i) kpc based on the Wang et al. (2016) relation. For G1, the extent of the H i is 14 kpc at a gas surface density of (H i) = 1 pc-2, well within the scatter of the relation. In summary, excluding the bridge, the spatial extent of the observed H i distribution around G1 and G2 is consistent with the known H i size-mass relation. This is in line with the demonstrated robustness of this relation in the presence of environmental processes that cause a truncation of the H i distribution but leave the H i size-mass relation unaffected (Stevens et al., 2019).
Following King (1962), we characterize the impact of tidal interaction on the dwarf galaxies. For a body, , on a circular orbit in the gravitational field of , the radius beyond which tidal stripping will occur, , can be expressed as:
| (2) |
Here, is the distance between the objects at closest approach and is the mass of enclosed within . We assume that the current projected separation of the dwarf galaxies is their distance of closest approach ( kpc) and calculate including contributions from stars, gas, and a dark matter halo described by a Navarro-Frenk-White profile (Navarro et al., 1997) with a concentration parameter of (e.g., Zhao et al., 2009). Taking to be the stellar, gas, and dark matter mass contained within the stellar body, we find that the truncation radius is in the range kpc. This exceeds the observed value of kpc, which suggests either that the galaxies are intrinsically small enough to avoid tidal truncation, or that a closer approach between the dwarf galaxies in the past is responsible for truncating them to their current size. The latter scenario is supported by the presence of the H i bridge and the faint irregularities observed in the outskirts of the stellar and ionized gas distributions of both galaxies. The observed offset in the centers of the stellar and neutral gas distributions in G1 may also indicate tidal disruption of the gaseous component of the dwarf. All evidence considered, it is likely that the DLA arises from gas that originated in the ISM of G1 and has since been perturbed by tidal interaction.
The definitive lack of a massive companion allows us to isolate the effects of dwarf-dwarf interactions on their gaseous reservoirs in the absence of processes such as ram-pressure stripping in a massive, hot halo. In this system, the cross-section for producing damped absorbers is much larger than the inner ISM alone. Gas with (H i) cm-2 is seen in the ISM, the outskirts of the H i distributions, and the adjoining bridge, informing the diversity of environments that can host DLAs. It is likely that the cross-section for ionized absorbers is larger still, but below the MUSE detection threshold; the Lyman limit system (LLS) detected in CUBS towards J02484048 arises from an analogous system of a relatively isolated dwarf galaxy pair at an impact parameter of several tens of kpc. The metallicity and chemical abundance pattern of the LLS suggests that it arises in tidal feature(s) composed of former ISM material (Zahedy et al., 2021). The Magellanic Stream appears to be a local example of a multiphase feature whose formation was dominated by tidal forces from the Large Magellanic Cloud acting on its smaller companion on initial infall into the halo of the Milky Way (e.g., Besla et al., 2012). Thus, models of the evolution of dwarf galaxy pairs — both within and outside of the halos of massive galaxies — must account for the role of dwarf-dwarf interactions in producing tidal features that enhance the cross-section for neutral absorbers.
Our comprehensive characterization of the galactic origin of the DLA was only made possible by the joint analysis of HST UV absorption-line and MeerKAT H i 21-cm emission-line data alongside detailed galaxy spectroscopy. As we enter further into the era of the Square Kilometer Array (SKA) and the next generation Very Large Array (ngVLA) with much higher sensitivity and spatial resolution, leveraging the time-limited availability of space-based UV resources in conjunction with spatially-resolved 21-cm mapping will be critical to enhance our understanding of the diverse galactic environments that host the majority of the neutral gas in the Universe.
References
- Abbott et al. (2018) Abbott, T. M. C., Abdalla, F. B., Allam, S., et al. 2018, ApJS, 239, 18, doi: 10.3847/1538-4365/aae9f0
- Aloisi et al. (2003) Aloisi, A., Savaglio, S., Heckman, T. M., et al. 2003, ApJ, 595, 760, doi: 10.1086/377496
- Asplund et al. (2009) Asplund, M., Grevesse, N., Sauval, A. J., & Scott, P. 2009, ARA&A, 47, 481, doi: 10.1146/annurev.astro.46.060407.145222
- Battisti et al. (2012) Battisti, A. J., Meiring, J. D., Tripp, T. M., et al. 2012, ApJ, 744, 93, doi: 10.1088/0004-637X/744/2/93
- Behroozi et al. (2019) Behroozi, P., Wechsler, R. H., Hearin, A. P., & Conroy, C. 2019, MNRAS, 488, 3143, doi: 10.1093/mnras/stz1182
- Besla et al. (2012) Besla, G., Kallivayalil, N., Hernquist, L., et al. 2012, MNRAS, 421, 2109, doi: 10.1111/j.1365-2966.2012.20466.x
- Boettcher et al. (2021) Boettcher, E., Chen, H.-W., Zahedy, F. S., et al. 2021, ApJ, 913, 18, doi: 10.3847/1538-4357/abf0a0
- Borthakur et al. (2019) Borthakur, S., Momjian, E., Heckman, T. M., et al. 2019, ApJ, 871, 239, doi: 10.3847/1538-4357/aaf566
- Bosma (2017) Bosma, A. 2017, HI in the Outskirts of Nearby Galaxies, ed. J. H. Knapen, J. C. Lee, & A. Gil de Paz, Vol. 434, 209, doi: 10.1007/978-3-319-56570-5_7
- Bowen et al. (2001) Bowen, D. V., Huchtmeier, W., Brinks, E., Tripp, T. M., & Jenkins, E. B. 2001, A&A, 372, 820, doi: 10.1051/0004-6361:20010592
- Bowen et al. (2005) Bowen, D. V., Jenkins, E. B., Pettini, M., & Tripp, T. M. 2005, ApJ, 635, 880, doi: 10.1086/497617
- Broeils & Rhee (1997) Broeils, A. H., & Rhee, M. H. 1997, A&A, 324, 877
- Bryan & Norman (1998) Bryan, G. L., & Norman, M. L. 1998, ApJ, 495, 80, doi: 10.1086/305262
- Calzetti (2008) Calzetti, D. 2008, in Astronomical Society of the Pacific Conference Series, Vol. 390, Pathways Through an Eclectic Universe, ed. J. H. Knapen, T. J. Mahoney, & A. Vazdekis, 121. https://arxiv.org/abs/0707.0467
- Calzetti et al. (1994) Calzetti, D., Kinney, A. L., & Storchi-Bergmann, T. 1994, ApJ, 429, 582, doi: 10.1086/174346
- Cantalupo et al. (2019) Cantalupo, S., Pezzulli, G., Lilly, S. J., et al. 2019, MNRAS, 483, 5188, doi: 10.1093/mnras/sty3481
- Cardelli et al. (1989) Cardelli, J. A., Clayton, G. C., & Mathis, J. S. 1989, ApJ, 345, 245, doi: 10.1086/167900
- Carilli & van Gorkom (1992) Carilli, C. L., & van Gorkom, J. H. 1992, ApJ, 399, 373, doi: 10.1086/171934
- Carnall et al. (2018) Carnall, A. C., McLure, R. J., Dunlop, J. S., & Davé, R. 2018, MNRAS, 480, 4379, doi: 10.1093/mnras/sty2169
- Cayatte et al. (1994) Cayatte, V., Kotanyi, C., Balkowski, C., & van Gorkom, J. H. 1994, AJ, 107, 1003, doi: 10.1086/116913
- Chen (2017) Chen, H.-W. 2017, Outskirts of Distant Galaxies in Absorption, ed. J. H. Knapen, J. C. Lee, & A. Gil de Paz, Vol. 434, 291, doi: 10.1007/978-3-319-56570-5_9
- Chen et al. (2005) Chen, H.-W., Kennicutt, Robert C., J., & Rauch, M. 2005, ApJ, 620, 703, doi: 10.1086/427088
- Chen & Lanzetta (2003) Chen, H.-W., & Lanzetta, K. M. 2003, ApJ, 597, 706, doi: 10.1086/378635
- Chen et al. (2020) Chen, H.-W., Zahedy, F. S., Boettcher, E., et al. 2020, MNRAS, 497, 498, doi: 10.1093/mnras/staa1773
- Chengalur & Kanekar (2002) Chengalur, J. N., & Kanekar, N. 2002, A&A, 388, 383, doi: 10.1051/0004-6361:20020513
- Cool et al. (2012) Cool, R. J., Eisenstein, D. J., Kochanek, C. S., et al. 2012, ApJ, 748, 10, doi: 10.1088/0004-637X/748/1/10
- de Blok et al. (2018) de Blok, W. J. G., Walter, F., Ferguson, A. M. N., et al. 2018, ApJ, 865, 26, doi: 10.3847/1538-4357/aad557
- De Cia et al. (2021) De Cia, A., Jenkins, E. B., Fox, A. J., et al. 2021, Nature, 597, 206, doi: 10.1038/s41586-021-03780-0
- De Cia et al. (2016) De Cia, A., Ledoux, C., Mattsson, L., et al. 2016, A&A, 596, A97, doi: 10.1051/0004-6361/201527895
- Dutta et al. (2016) Dutta, R., Gupta, N., Srianand, R., & O’Meara, J. M. 2016, MNRAS, 456, 4209, doi: 10.1093/mnras/stv2980
- El-Badry et al. (2018) El-Badry, K., Bradford, J., Quataert, E., et al. 2018, MNRAS, 477, 1536, doi: 10.1093/mnras/sty730
- Ferland et al. (2013) Ferland, G. J., Porter, R. L., van Hoof, P. A. M., et al. 2013, Rev. Mexicana Astron. Astrofis., 49, 137. https://arxiv.org/abs/1302.4485
- Ferland et al. (2017) Ferland, G. J., Chatzikos, M., Guzmán, F., et al. 2017, Rev. Mexicana Astron. Astrofis., 53, 385. https://arxiv.org/abs/1705.10877
- Fox et al. (2005) Fox, A. J., Wakker, B. P., Savage, B. D., et al. 2005, ApJ, 630, 332, doi: 10.1086/431915
- Gupta et al. (2016) Gupta, N., Srianand, R., Baan, W., et al. 2016, in MeerKAT Science: On the Pathway to the SKA, 14. https://arxiv.org/abs/1708.07371
- Gupta et al. (2018) Gupta, N., Srianand, R., Farnes, J. S., et al. 2018, MNRAS, 476, 2432, doi: 10.1093/mnras/sty384
- Gupta et al. (2021) Gupta, N., Jagannathan, P., Srianand, R., et al. 2021, ApJ, 907, 11, doi: 10.3847/1538-4357/abcb85
- Haffert et al. (2019) Haffert, S. Y., Bohn, A. J., de Boer, J., et al. 2019, Nature Astronomy, 3, 749, doi: 10.1038/s41550-019-0780-5
- Hunter et al. (2012) Hunter, D. A., Ficut-Vicas, D., Ashley, T., et al. 2012, AJ, 144, 134, doi: 10.1088/0004-6256/144/5/134
- Kanekar et al. (2018) Kanekar, N., Neeleman, M., Prochaska, J. X., & Ghosh, T. 2018, MNRAS, 473, L54, doi: 10.1093/mnrasl/slx162
- Kanekar et al. (2014) Kanekar, N., Prochaska, J. X., Smette, A., et al. 2014, MNRAS, 438, 2131, doi: 10.1093/mnras/stt2338
- Kaur et al. (2021) Kaur, B., Kanekar, N., Rafelski, M., et al. 2021, ApJ, 921, 68, doi: 10.3847/1538-4357/ac12d2
- Kelson (2003) Kelson, D. D. 2003, PASP, 115, 688, doi: 10.1086/375502
- King (1962) King, I. 1962, AJ, 67, 471, doi: 10.1086/108756
- Kovač et al. (2009) Kovač, K., Oosterloo, T. A., & van der Hulst, J. M. 2009, MNRAS, 400, 743, doi: 10.1111/j.1365-2966.2009.14662.x
- Krogager et al. (2017) Krogager, J. K., Møller, P., Fynbo, J. P. U., & Noterdaeme, P. 2017, MNRAS, 469, 2959, doi: 10.1093/mnras/stx1011
- Lehner et al. (2019) Lehner, N., Wotta, C. B., Howk, J. C., et al. 2019, ApJ, 887, 5, doi: 10.3847/1538-4357/ab41fd
- Lelli et al. (2014) Lelli, F., Verheijen, M., & Fraternali, F. 2014, A&A, 566, A71, doi: 10.1051/0004-6361/201322657
- Liang & Chen (2014) Liang, C. J., & Chen, H.-W. 2014, MNRAS, 445, 2061, doi: 10.1093/mnras/stu1901
- Maller & Bullock (2004) Maller, A. H., & Bullock, J. S. 2004, MNRAS, 355, 694, doi: 10.1111/j.1365-2966.2004.08349.x
- Navarro et al. (1997) Navarro, J. F., Frenk, C. S., & White, S. D. M. 1997, ApJ, 490, 493, doi: 10.1086/304888
- Neeleman et al. (2019) Neeleman, M., Kanekar, N., Prochaska, J. X., Rafelski, M. A., & Carilli, C. L. 2019, ApJ, 870, L19, doi: 10.3847/2041-8213/aaf871
- Neeleman et al. (2016) Neeleman, M., Prochaska, J. X., Ribaudo, J., et al. 2016, ApJ, 818, 113, doi: 10.3847/0004-637X/818/2/113
- Osterbrock & Ferland (2006) Osterbrock, D. E., & Ferland, G. J. 2006, Astrophysics of gaseous nebulae and active galactic nuclei
- Péroux et al. (2016) Péroux, C., Quiret, S., Rahmani, H., et al. 2016, MNRAS, 457, 903, doi: 10.1093/mnras/stw016
- Pettini & Pagel (2004) Pettini, M., & Pagel, B. E. J. 2004, MNRAS, 348, L59, doi: 10.1111/j.1365-2966.2004.07591.x
- Rao et al. (2011) Rao, S. M., Belfort-Mihalyi, M., Turnshek, D. A., et al. 2011, MNRAS, 416, 1215, doi: 10.1111/j.1365-2966.2011.19119.x
- Read et al. (2017) Read, J. I., Iorio, G., Agertz, O., & Fraternali, F. 2017, MNRAS, 467, 2019, doi: 10.1093/mnras/stx147
- Salim et al. (2018) Salim, S., Boquien, M., & Lee, J. C. 2018, ApJ, 859, 11, doi: 10.3847/1538-4357/aabf3c
- Savage & Sembach (1996) Savage, B. D., & Sembach, K. R. 1996, ARA&A, 34, 279, doi: 10.1146/annurev.astro.34.1.279
- Schulte-Ladbeck et al. (2005) Schulte-Ladbeck, R. E., König, B., Miller, C. J., et al. 2005, ApJ, 625, L79, doi: 10.1086/431324
- Schulte-Ladbeck et al. (2004) Schulte-Ladbeck, R. E., Rao, S. M., Drozdovsky, I. O., et al. 2004, ApJ, 600, 613, doi: 10.1086/380094
- Serra et al. (2015) Serra, P., Westmeier, T., Giese, N., et al. 2015, MNRAS, 448, 1922, doi: 10.1093/mnras/stv079
- Srianand et al. (2012) Srianand, R., Gupta, N., Petitjean, P., et al. 2012, MNRAS, 421, 651, doi: 10.1111/j.1365-2966.2011.20342.x
- Stevens et al. (2019) Stevens, A. R. H., Diemer, B., Lagos, C. d. P., et al. 2019, MNRAS, 490, 96, doi: 10.1093/mnras/stz2513
- Vale Asari et al. (2019) Vale Asari, N., Couto, G. S., Cid Fernandes, R., et al. 2019, MNRAS, 489, 4721, doi: 10.1093/mnras/stz2470
- Wang et al. (2016) Wang, J., Koribalski, B. S., Serra, P., et al. 2016, MNRAS, 460, 2143, doi: 10.1093/mnras/stw1099
- Weilbacher et al. (2014) Weilbacher, P. M., Streicher, O., Urrutia, T., et al. 2014, in Astronomical Society of the Pacific Conference Series, Vol. 485, Astronomical Data Analysis Software and Systems XXIII, ed. N. Manset & P. Forshay, 451. https://arxiv.org/abs/1507.00034
- Westmeier et al. (2021) Westmeier, T., Kitaeff, S., Pallot, D., et al. 2021, MNRAS, 506, 3962, doi: 10.1093/mnras/stab1881
- Wolfe et al. (2005) Wolfe, A. M., Gawiser, E., & Prochaska, J. X. 2005, ARA&A, 43, 861, doi: 10.1146/annurev.astro.42.053102.133950
- Zahedy et al. (2021) Zahedy, F. S., Chen, H.-W., Cooper, T. M., et al. 2021, MNRAS, 506, 877, doi: 10.1093/mnras/stab1661
- Zhang et al. (2017) Zhang, K., Yan, R., Bundy, K., et al. 2017, MNRAS, 466, 3217, doi: 10.1093/mnras/stw3308
- Zhao et al. (2009) Zhao, D. H., Jing, Y. P., Mo, H. J., & Börner, G. 2009, ApJ, 707, 354, doi: 10.1088/0004-637X/707/1/354