A new perspective on classification: optimally allocating limited resources to uncertain tasks
Abstract
A central problem in business concerns the optimal allocation of limited resources to a set of available tasks, where the payoff of these tasks is inherently uncertain. In credit card fraud detection, for instance, a bank can only assign a small subset of transactions to their fraud investigations team. Typically, such problems are solved using a classification framework, where the focus is on predicting task outcomes given a set of characteristics. Resources are then allocated to the tasks that are predicted to be the most likely to succeed. However, we argue that using classification to address task uncertainty is inherently suboptimal as it does not take into account the available capacity. Therefore, we first frame the problem as a type of assignment problem. Then, we present a novel solution using learning to rank by directly optimizing the assignment’s expected profit given limited, stochastic capacity. This is achieved by optimizing a specific instance of the net discounted cumulative gain, a commonly used class of metrics in learning to rank. Empirically, we demonstrate that our new method achieves higher expected profit and expected precision compared to a classification approach for a wide variety of application areas and data sets. This illustrates the benefit of an integrated approach and of explicitly considering the available resources when learning a predictive model.
Keywords Optimal resource allocation Classification Learning to rank
1 Introduction
Optimally allocating limited resources is a central problem in economics (Samuelson and Nordhaus, 2010) and operations research (Ward Jr, 1957; Everett III, 1963). It is often complicated further by uncertainty inherent to the considered problem. On the one hand, future resource capacity may be limited and not known exactly in advance. On the other hand, the tasks that require resources might have uncertain payoff. This situation is commonly encountered in various real-world applications. For example, in credit card fraud detection, fraud analysts can only investigate a limited number of transactions each day. Similarly, in direct marketing, a company may only be able to target a subset of customers in a marketing campaign. The challenge is how to optimally allocate resources to maximize business pay-off, e.g., how to optimally allocate fraud investigators to suspicious transactions to minimize losses due to fraud. By learning from historical data, machine learning models can assist decision-makers by predicting the most relevant tasks based on their characteristics.
Prior work addresses the problem of uncertain task outcomes via classification. The most promising tasks can be identified by estimating the probability of success for each task. The problem of stochastic, limited capacity can then be addressed separately in a second stage, when assignment decisions are made by prioritizing tasks based on the estimated probabilities to result in a successful outcome. In this article, however, we argue and demonstrate that this approach based on classification models is suboptimal when resources are limited because a classification model does not take capacity limitations into account. Hence, although only the most promising tasks can be executed, the model focuses equally on accurately predicting probabilities for tasks that are highly unlikely to be successful and, consequently, to be executed.
Therefore, we propose a novel approach based on learning to rank that simultaneously accounts for both resource and task uncertainty. When resources are limited, we demonstrate that this approach is superior to allocation based on classification. First, we show how learning to rank can directly optimize the assignment’s expected profit given limited, stochastic capacity. By considering the available capacity during optimization, the model focuses on correctly ranking the most promising tasks, proportional to their likelihood of being processed under limited capacity. Second, while instances are processed individually in classification, learning to rank explicitly considers a task’s relevance in comparison to the other available tasks. The benefit of this approach is that we only care about relative positions in the ranking, corresponding to the need to prioritize tasks relative to each other.
Our contributions are threefold. First, we formalize the problem of allocating limited, stochastic resources to uncertain tasks by framing it as an assignment problem. Second, we propose a novel, integrated predict-and-optimize approach to solve this problem based on learning to rank. We contrast our approach with a two-stage predict-then-optimize framework that first uses a classification model to predict task outcomes and then solves the assignment problem using the predicted task probabilities. Third, we compare both methods empirically using various real life data sets from different application areas.
2 Problem formulation
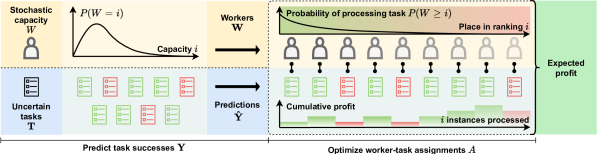
We address the problem of optimally assigning limited and stochastic resources to tasks with uncertain outcomes to maximize the expected profit. We formalize it as a linear assignment problem where both workers and tasks are sources of uncertainty. The exact number of workers is uncertain at the time when resources need to be allocated, but we assume it is governed by a known probability distribution. In practice, this distribution can be estimated from historical data on the available resources or based on domain knowledge. Alternatively, a deterministic capacity can be considered. Second, task outcomes are also uncertain and need to be predicted using historical data on similar tasks. A graphical overview of the problem is shown in Figure 1. In the following, we introduce and formally define each element of the assignment problem.
Stochastic capacity.
The available resources or number of workers is a discrete random variable described by a known probability distribution. In this work, we consider a common situation where the expected capacity is smaller than the number of available tasks . The stochastic capacity can be converted to a sequence of workers with monotonically decreasing success rates. This rate equals the worker’s probability of being available given and is described by the complementary cumulative probability distribution function: . This yields a monotonically decreasing sequence of worker success rates with .
Uncertain tasks.
There is also uncertainty regarding task outcomes. To address this uncertainty, we predict it using historical data on similar tasks. Let be the domain of all possible tasks , where is a set of characteristics and is a binary label equal to 1 if the task is successful and 0 otherwise. Moreover, denotes the payoff if the task is executed, with if task was successful () and otherwise. A task’s reward is defined as . We have available tasks to be allocated , although is unknown when resources need to be allocated. Given historical data, a predictive model can estimate task outcomes resulting in predictions.
Matching workers and tasks.
Workers and tasks can then be combined in an expected profit matrix , where is the profit of assigning worker to task for . Given , the goal is to find the optimal assignment matrix , where if worker is assigned to task and 0 otherwise, for . This results in the following balanced linear assignment problem:
| maximize | (1) | ||||
| subject to | (2) | ||||
| (3) | |||||
| (4) | |||||
where conditions 2 and 3 specify that each task is assigned to exactly one worker and vice versa; condition 4 imposes absolute assignments by restricting to 0 or 1.
3 Related work
The proposed solution in this paper relates to prior work on uncertainty in assignment problems, predict-and-optimize, classification and learning to rank. In this section, we briefly introduce each line of work and its relationship to our contribution.
3.1 Uncertainty in assignment problems
Optimal allocation of resources and decision-making under uncertainty are key problems in operations research (Ward Jr, 1957; Everett III, 1963). In this work, we consider an assignment problem. This is a general problem formulation in which the goal is to find an optimal matching of workers and tasks subject to certain constraints. This type of problem has been analyzed extensively (Burkard et al., 2012) and applied to a diverse range of tasks (e.g., Alonso-Mora et al., 2017; Bertsimas et al., 2019). Moreover, various extensions consider different sources of uncertainty: uncertain worker capacity, uncertain task presence (i.e., outcomes), or uncertain task-worker profits (Toktas et al., 2006; Krokhmal and Pardalos, 2009). This work focuses on a specific type of a linear assignment problem, in which we simultaneously address two sources of uncertainty: uncertain capacity and uncertain task success. However, instead of assuming that task success follows a probability distribution, we use a predictive model to estimate it.
3.2 Predict-and-optimize
The intersection of operations research and machine learning has increasingly drawn the attention of researchers from both fields (Lodi and Zarpellon, 2017; Bengio et al., 2021). In particular, recent work on predict-and-optimize is relevant (Donti et al., 2017; Wilder et al., 2019; Elmachtoub and Grigas, 2021). The central aim in predict-and-optimize is to align a predictive model more closely with the downstream decision-making context (Mandi et al., 2020). This is achieved by fusing the prediction and optimization phases and training the model in an end-to-end manner, with the aim of obtaining higher quality decisions (Kotary et al., 2021). Ranking specifically has been studied in this context: Demirović et al. use ranking methods for the knapsack problem (Demirović et al., 2019a) and study ranking objectives of combinatorial problems in general (Demirović et al., 2019b), though both are limited to linear models. In contrast, our proposed approach is compatible with any type of learner that can be trained using gradient-based optimization, but it is applicable only to our specific, though commonly encountered, formulation of the assignment problem.
3.3 Classification
Classification is a task in machine learning where the goal is to predict the class of an instance given its characteristics. For instance, classifying a task as either successful or not is a binary classification problem. Existing work typically considers the applications in this paper as classification problems, e.g., fraud detection (Van Vlasselaer et al., 2017; Cerioli et al., 2019), credit scoring (Baesens et al., 2003; Lessmann et al., 2015), direct marketing (Baesens et al., 2002) and customer churn prediction (Verbeke et al., 2011, 2012). Moreover, to align the models more closely with the decision-making context, cost-sensitive classification has been used (Bahnsen et al., 2014; Petrides et al., 2020a; Höppner et al., 2020, 2022). Cost-sensitive methodologies incorporate the costs of different decisions into the optimization or use of predictive models (Elkan, 2001; Petrides and Verbeke, 2021). Cost-sensitive variants have been proposed for different classification models, such as logistic regression and gradient boosting (Bahnsen et al., 2014; Höppner et al., 2022). The output of a classification model is often used to rank instances, reflected by widely used evaluation metrics that analyze this ranking, such as the receiver operating characteristics curve and precision–recall curve (Davis and Goadrich, 2006). However, in contrast to our work, these approaches do not consider the available capacity during optimization of the models. Although limited capacity has been acknowledged in the literature (e.g., in fraud detection (Dal Pozzolo et al., 2017), direct marketing (Bose and Chen, 2009) or churn prediction (Hadden et al., 2007)), no existing solution explicitly addresses this issue.
3.4 Learning to rank
In learning to rank, the goal is to predict the order of instances relative to each other, based on their characteristics. Although learning to rank originated in the field of information retrieval, it is a general framework that has been applied to a variety of problems that have traditionally been solved with classification models, such as software defect prediction (Yang et al., 2014), credit scoring (Coenen et al., 2020) and uplift modeling (Devriendt et al., 2020). Moreover, similar to cost-sensitive classification, the learning to rank framework has been extended to incorporate costs of instances to align the optimization of the model more closely with the resulting decisions (McBride et al., 2019). However, our approach is the first to explicitly consider the available capacity during the optimization of the ranking model.
4 Methodology
We present two approaches for the problem presented in Section 2. On the one hand, a two-stage predict-then-optimize framework can be used. In the first stage, we predict the task successes . Here, we show how different types of classification objectives can be used to predict task success. In the second stage, we optimize the assignment of tasks to workers to obtain an assignment matrix . For this, we provide an analytical solution and prove its optimality. On the other hand, we present an integrated predict-and-optimize framework for prediction and optimization by leveraging learning to rank techniques.
4.1 Two-stage predict-then-optimize
This section presents a conventional two-stage approach for solving the problem. In the first stage, a classification model predicts each task’s probability of success. Existing approaches in classification (Murphy, 2012; Höppner et al., 2022) can be used to optimize this model for either accuracy or profit. In the second stage, tasks are assigned to workers based on these predicted probabilities. We present a straightforward procedure for this assignment and prove its optimality.
4.1.1 Predicting task outcomes using classification.
To handle the uncertainty regarding task outcomes, we train a classification model to predict whether a task will be successful. Given historical data , the goal is to predict using a classifier defined by parameters that predicts the probability of a task being successful. Classifier training can be accomplished with different objective functions. We present two alternatives: one that focuses optimization on accuracy and one that optimizes the classification cost.
The conventional approach is to train the classifier with the aim of maximizing accuracy. This can be achieved using the maximum likelihood approach or, equivalently, by minimizing the cross-entropy loss function (Murphy, 2012):
| (5) |
A drawback of this approach is that the solution ignores some of the problem specifications. Some tasks are more important to classify correctly than others, depending on their cost (or profit) when executed. Therefore, in cost-sensitive learning, these costs are incorporated into the training of a model. In classification, the cost of a decision depends on whether it was classified correctly and on the task itself. These costs are formalized with the concept of a cost matrix (Elkan, 2001):
| (6) |
This way, we can directly minimize the average expected cost of predictions, as an alternative to the cross-entropy loss (Bahnsen et al., 2014; Höppner et al., 2022):
| (7) | ||||
is a semidirect predict-and-optimize method: it incorporates some information of the downstream decision-making task, but learning is still separated from optimization (Demirović et al., 2019b, a).
4.1.2 Optimizing worker–task assignments.
Given task predictions , we can optimize the task–worker assignments. Although various general algorithms have been proposed to solve assignment problems, our formulation can be solved analytically. Here, we present this solution and prove its optimality.
Theorem 4.1.
is a sequence of monotonically decreasing worker success rates such that with for . are the predicted task rewards arranged in decreasing order such that . For the resulting expected profit matrix with , the optimal assignment is .
Proof.
is a feasible solution: it is straightforward to verify that the identity matrix satisfies constraints 2, 3 and 4 of the assignment problem. Moreover, the solution is the result of a greedy strategy: at each step , we assign worker with probability to the highest remaining task with payoff . To prove the optimality of this strategy, we show that it does not deviate from the optimal solution at each step up until the final solution is obtained.
First, the best single worker–task assignment is selected: the highest profit is ; no other higher profit exists as no higher or exist. Next, we continue this strategy of selecting the best remaining worker–task assignment until there are no tasks left. We can show that, at each step, no other assignment matrix leads to a larger profit than this one. At step , the profit obtained given assignment matrix equals .
Deviating from at a certain step means that at least one worker must be assigned to another task. We prove that no alternative assignment leads to a higher profit. Consider switching the assignments of tasks and with . In the case that task has already been assigned to a worker, we have:
In the case that task has not yet been assigned, we have:
In both cases, the final statements follow from and being monotonically decreasing and , or from . ∎
4.2 Integrated predict-and-optimize using learning to rank
In this section, we present a novel integrated approach for solving the assignment problem in Section 2. Previously, we showed how the optimal assignment is if and are arranged in decreasing order. Given that is defined as a decreasing sequence, the challenge of optimizing the assignment can also be seen as correctly predicting the order of expected task rewards . This formulation is equivalent to an alternative interpretation of the assignment problem as finding the optimal assignments by permuting the rows and columns of the profit matrix such that the resulting sum of the elements on the diagonal is maximized, or formally (Krokhmal and Pardalos, 2009):
| (8) |
for with the set of all permutations of the indices , i.e., . In our case, we need to find the optimal permutation of available tasks .
In this formulation, the assignment problem can be seen as predicting the optimal permutation based on characteristics of the available tasks. Formally, let be a ranking model. The goal is to find parameters such that the ordering of the mapping of tasks corresponds to the ordering of their rewards . A ranking based on can be seen as a permutation of the indices .
The expected profit of a permutation given a capacity can be optimized directly using learning to rank. The key insight is that for a given permutation of tasks , the expected profit of a ranking is equivalent to its discounted cumulative gain (DCG), which is a commonly used class of metrics in learning to rank (Wang et al., 2013). Typically, the DCG is defined with discount and gain for . However, to match the expected profit, our formulation uses discount corresponding to the capacity distribution, gain equal to for all , and relevance . By dividing the DCG by its ideal value (IDCG), the normalized DCG (NDCG) is obtained: NDCG = with NDCG (Murphy, 2012).
Optimizing the NDCG (or equivalently, the expected profit) directly is challenging as it depends on the predicted relative positions of instances instead of the model’s outputs . Nevertheless, various algorithms have been proposed for this task in the literature on learning to rank (e.g., (Valizadegan et al., 2009)). In this work, we use LambdaMART (Wu et al., 2008; Burges, 2010), which uses a combination of the LambdaRank loss (Burges et al., 2006) and gradient boosting of decision trees (Friedman, 2001) to construct the ranking model. LambdaMART is a widely used approach that achieved the best performance in the Yahoo! Learning To Rank Challenge (Burges, 2010; Chapelle and Chang, 2011; Li, 2014). In this way, we can train a ranking model to optimize the NDCG or expected profit of the assignments directly.
Finally, we need to specify each task’s relevance, which serves as a label according to which the ranking would ideally be constructed. Because the ranking corresponds to the priority that should be given to tasks, it should respect the ordering in terms of both outcome and task payoffs . In other words, successful tasks should be more relevant than unsuccessful tasks, and a more profitable task should be more relevant. Therefore, we use a task’s reward as a cost-sensitive relevance, as it uses an instance’s class label and its cost matrix (see Equation 6). By means of this approach, a positive task’s relevance is the profit (or equivalently, the negative cost) obtained by classifying it positively minus the profit obtained by classifying it negatively; vice versa for negative tasks. Thus, we obtain the relevance or reward as follows:
Alternatively, if the goal is to optimize for accuracy rather than cost, we can use class label as the relevance of instance .
5 Empirical results
In this section, we empirically evaluate and compare the two-stage and the integrated approach for a variety of tasks. We use publicly available data from a variety of application areas. For each application, the goal is to optimally allocate resources to optimize the expected cost given stochastic capacity. All code for the experimental analysis will be made available online upon publication of this paper.
To compare the different approaches, we use gradient boosting to train the predictive models. Four different objectives are compared, depending on the task (classification or learning to rank) and on whether they aim to maximize precision or profit. xgboost denotes a conventional classification model using the cross-entropy loss (see Equation 5), while csboost uses a cost-sensitive objective function (see Equation 7). LambdaMART uses the binary class label , whereas csLambdaMART uses task payoffs as relevance. All models are implemented in Python using the xgboost package (Chen et al., 2015). Gradient boosting is a popular methodology for both classification and ranking that has great predictive performance, as illustrated by recent benchmarking studies (Lessmann et al., 2015; Gunnarsson et al., 2021).
5.1 Data
The data sets are enlisted in Table 1 and stem from different application areas: customer churn prediction, credit scoring and direct marketing. They all concern binary classification where tasks are either successful or unsuccessful. Resources are limited and stochastic: we assume a lognormal capacity distribution .
The cost matrices are taken from earlier work on cost-sensitive classification (see Table 2). In churn prediction, we have and as, respectively, 2 and 12 times the monthly amount for KTCC following (Petrides and Verbeke, 2021); whereas we follow the cost matrix given with the data set for TSC (Bahnsen et al., 2015a). For credit scoring, we calculate the instance-dependent costs and as a function of the loan amount following (Bahnsen et al., 2014). In direct marketing, a positive classification incurs a fixed cost , while missing a potential success incurs an instance-dependent cost equal to the expected interest given , following (Bahnsen et al., 2015b). Similarly, in fraud detection, a positive prediction leads to an investigation that entails a fixed cost , and missing a fraudulent transaction leads to a cost equal to its amount . We use , following (Höppner et al., 2022).
| Application | Abbr. | % Pos | Reference | |||
| Churn prediction | KTCC | 7,032 | 26.58 | (IBM Sample Data Sets, 2017) | ||
| TSC | 9,379 | 4.79 | (Bahnsen et al., 2015a) | |||
| Credit scoring | HMEQ | 1,986 | 19.95 | (Baesens et al., 2016) | ||
| BN1 | 3,123 | 33.33 | (Lessmann et al., 2015) | |||
| BN2 | 7,190 | 30.00 | (Lessmann et al., 2015) | |||
| VCS | 18,917 | 16.95 | (Petrides et al., 2020b) | |||
| UK | 30,000 | 4.00 | (Lessmann et al., 2015) | |||
| DCCC | 30,000 | 22.12 | (Yeh and Lien, 2009) | |||
| GMSC | 112,915 | 6.74 | / | |||
| Direct marketing | UBM | 45,211 | 11.70 | (Moro et al., 2014) | ||
| KDD | 191,779 | 5.07 | / | |||
| Fraud detection | KCCF | 282,982 | 0.16 | (Dal Pozzolo et al., 2015) | ||
| KIFD | 590,540 | 3.50 | / | |||
| ACCF | 3,639,323 | 0.65 | (Van Vlasselaer et al., 2015) | |||
5.2 Results
We present the results using various performance metrics to compare the different models. The main metric of interest is either the expected precision or the expected profit given the stochastic capacity distribution , depending on whether accuracy or profit is the objective. Furthermore, we present several additional classification and ranking metrics to gain more insight into the differences between the methodologies. For each metric, we present the average over all data sets and test whether the best performance is significantly different from the others using a Friedman test on the rankings with Bonferroni–Dunn post hoc correction (Demšar, 2006; Garcia and Herrera, 2008; García et al., 2010) (see Table 3).
| 0 | 1 | ||
|---|---|---|---|
| 0 | 0 | 12 | |
| 1 | 2 | 0 | |
| 0 | 1 | ||
|---|---|---|---|
| 0 | 0 | ||
| 1 | 0 | ||
| 0 | 1 | ||
|---|---|---|---|
| 0 | 0 | / | |
| 1 | |||
| 0 | 1 | ||
|---|---|---|---|
| 0 | 0 | ||
| 1 | |||
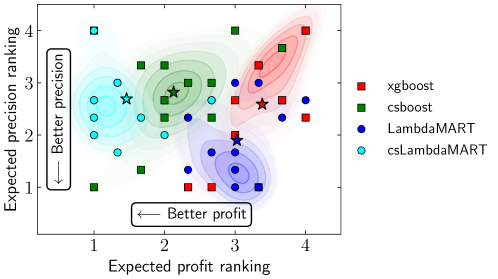
5.2.1 Expected precision and expected profit.
In terms of expected precision, LambdaMART is the best performing model. Two models optimize for accuracy: LambdaMART and xgboost. The ranking model, LambdaMART, outperforms the classification model, xgboost. In terms of expected profit, the cost-sensitive ranking model, csLambdaMart, performs best. Of the two models optimizing for accuracy, xgboost and LambdaMART, the ranking model again achieves better results, although this difference is not statistically significant. We compare the trade-off between profit and precision in Figure 2 by plotting the rankings for each data set. To get an idea of the densities for the different models, we estimate it using a Gaussian kernel and show it for probabilities greater than . Although the densities overlap, the ranking models outperform their classifying counterparts in their respective category.
| Expected precision | Expected profit | Average precision | Spearman correlation | AUCPC | |
| xgboost | 0.4956 0.28 | 0.2115 0.18 | 0.9423 0.05 | 0.0382 0.11 | 0.5548 0.25 |
| csboost | 0.5865 0.24 | 0.2940 0.19 | 0.9075 0.07 | 0.2258 0.27 | 0.5657 0.24 |
| LambdaMART | 0.6555 0.26 | 0.2471 0.16 | 0.9366 0.05 | 0.0302 0.15 | 0.5363 0.22 |
| csLambdaMART | 0.6089 0.25 | 0.3587 0.17 | 0.9336 0.05 | 0.3829 0.28 | 0.5999 0.23 |
5.2.2 Average precision, Spearman’s and AUCPC.
These metrics weight all instances in the ranking equally as opposed to the previous metrics that weighted instances depending on their probability of being processed given the capacity distribution. On the one hand, we consider a classification metric: given the high degree of class imbalance for some data sets, we use the average precision (Davis and Goadrich, 2006). On the other hand, we consider two ranking metrics: the area under the cumulative profit curve and Spearman’s rank correlation coefficient .
First, we assess the quality of the model’s predictions with a standard classification metric: average precision (AP). This metric summarizes the precision-recall curve and looks at the trade-off between precision and recall at different thresholds. The cost-insensitive classification model, xgboost, performs best. This result is expected as it is a classification model that optimizes for accuracy. However, this conventional classification metric has only weak correlation with the expected precision, suggesting that it is not a good indicator of performance.
We also adopt two ranking metrics. First, we use Spearman’s rank correlation coefficient to quantify the correlation between the ranking of the predictions and the ranking of the task payoffs. csLambdaMart is the best performing model, outperforming csboost. Moreover, both cost-insensitive models have a correlation of approximately 0. This is as expected, as these models do not take payoff into account in their optimization. Second, the cumulative profit curve plots the profit that is realized as a function of the number of first ranked instances, with . We compare the area under this curve with the area of a random ranking and one of the optimal ranking to obtain a value between 0 and 1. csLambdaMART performs best, though neither the difference with xgboost nor csboost is statistically significant.
These results indicate that metrics for evaluating the ranking, such as Spearman’s or the AUCPC, are more suitable than classification metrics, such as the average precision, for evaluating a model’s performance under limited capacity. These findings suggest that ranking as a solution more closely aligns with the problem of allocating limited resources to uncertain tasks than classification, which is also confirmed by the superior performance of ranking models compared to classification models in terms of expected precision and expected profit.
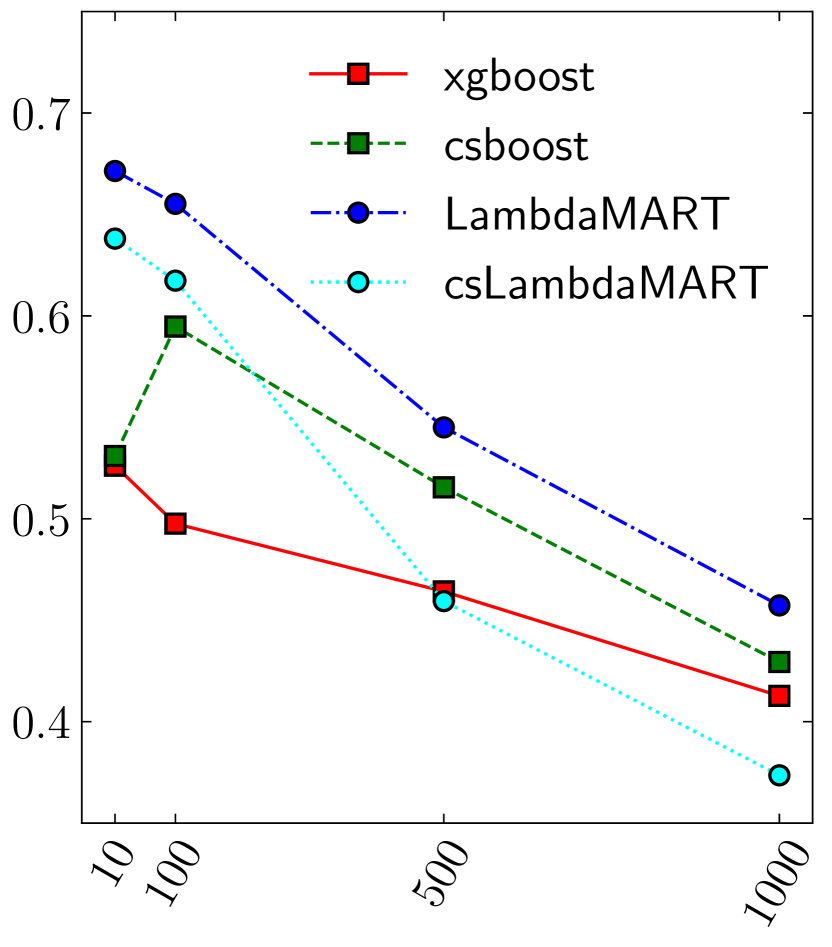
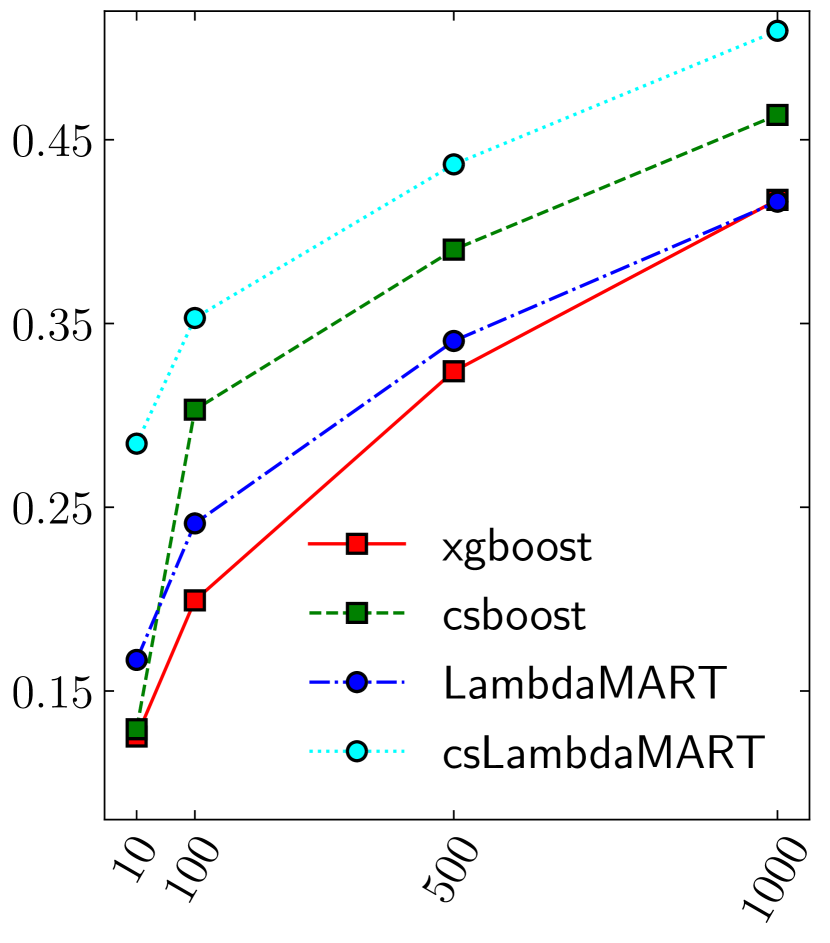
5.2.3 Top metrics.
Finally, we also consider metrics focusing solely on the top of the ranking. Given limited capacity, these are the instances that will be prioritized. We can evaluate this critical part of the ranking by looking at the precision and profit of the ranking for the first instances for different values of (see Figure 3). The ranking model optimizing for accuracy, LambdaMART, performs best in terms of precicision@, while the ranking model optimizing for profit, csLambdaMART, has the best performance in terms of profit@.
6 Conclusion
In this work, we formally introduced and defined a commonly encountered problem: how to optimally allocate limited, stochastic resource capacity to tasks with uncertain payoff to maximize the expected profit. Moreover, we contribute by proposing a novel integrated solution using learning to rank and empirically comparing it with a more conventional predict-then-optimize approach using a classification model.
Our findings illustrate the benefit of approaching this problem as a ranking problem, which allows us to consider the availability of limited and stochastic resources. Theoretically, we show how the expected profit for a given capacity distribution can be optimized directly using learning to rank with a specific formulation of the net discounted cumulative gain as the objective. Empirical results for a variety of applications show that ranking models achieve better performance in terms of expected profit or expected precision, depending on the objective. Moreover, good results in terms of ranking metrics are more indicative of good performance in terms of expected profit compared to conventional classification metrics. This illustrates how ranking is more closely aligned with the problem at hand compared to classifying. In summary, in the common scenario where decision-makers are constrained by limited resources, deciding upon resource allocation using classification models is inferior to using learning to rank. These findings have important implications for practitioners in a variety of application areas.
Our work opens several promising directions for future research. For example, it would be interesting to consider a temporal variant of the assignment problem with tasks arriving sequentially in time. Although this problem has been studied extensively for stochastic or random arrival rates (Derman et al., 1972; Albright and Derman, 1972; Albright, 1974), future work could consider the addition of a predictive ranking model to address uncertainty regarding task outcomes. Another possible extension would be to consider tasks that require varying degrees of resources. For example, in credit scoring, loans with a large principal require more resources. Finally, a technical limitation of LambdaMART is the complexity due to the pairwise calculation of the gradient. To address this issue, future work could look at approaches that calculate the gradient in a listwise fashion by considering the entire ranking simultaneously (Cao et al., 2007; Xia et al., 2008; Ravikumar et al., 2011) with several recently proposed, efficient candidates (e.g., Sculley, 2009; Lucchese et al., 2017; Cakir et al., 2019).
References
- Samuelson and Nordhaus [2010] Paul A Samuelson and William D Nordhaus. Economics. McGraw-Hill/Irwin, 19 edition, 2010.
- Ward Jr [1957] LE Ward Jr. On the optimal allocation of limited resources. Operations Research, 5(6):815–819, 1957.
- Everett III [1963] Hugh Everett III. Generalized lagrange multiplier method for solving problems of optimum allocation of resources. Operations research, 11(3):399–417, 1963.
- Burkard et al. [2012] Rainer Burkard, Mauro Dell’Amico, and Silvano Martello. Assignment problems: revised reprint. SIAM, 2012.
- Alonso-Mora et al. [2017] Javier Alonso-Mora, Samitha Samaranayake, Alex Wallar, Emilio Frazzoli, and Daniela Rus. On-demand high-capacity ride-sharing via dynamic trip-vehicle assignment. Proceedings of the National Academy of Sciences, 114(3):462–467, 2017.
- Bertsimas et al. [2019] Dimitris Bertsimas, Arthur Delarue, and Sebastien Martin. Optimizing schools’ start time and bus routes. Proceedings of the National Academy of Sciences, 116(13):5943–5948, 2019.
- Toktas et al. [2006] Berkin Toktas, Joyce W Yen, and Zelda B Zabinsky. Addressing capacity uncertainty in resource-constrained assignment problems. Computers & operations research, 33(3):724–745, 2006.
- Krokhmal and Pardalos [2009] Pavlo A Krokhmal and Panos M Pardalos. Random assignment problems. European Journal of Operational Research, 194(1):1–17, 2009.
- Lodi and Zarpellon [2017] Andrea Lodi and Giulia Zarpellon. On learning and branching: a survey. Top, 25(2):207–236, 2017.
- Bengio et al. [2021] Yoshua Bengio, Andrea Lodi, and Antoine Prouvost. Machine learning for combinatorial optimization: a methodological tour d’horizon. European Journal of Operational Research, 290(2):405–421, 2021.
- Donti et al. [2017] Priya Donti, Brandon Amos, and J. Zico Kolter. Task-based end-to-end model learning in stochastic optimization. In I. Guyon, U. V. Luxburg, S. Bengio, H. Wallach, R. Fergus, S. Vishwanathan, and R. Garnett, editors, Advances in Neural Information Processing Systems, volume 30. Curran Associates, Inc., 2017. URL https://proceedings.neurips.cc/paper/2017/file/3fc2c60b5782f641f76bcefc39fb2392-Paper.pdf.
- Wilder et al. [2019] Bryan Wilder, Bistra Dilkina, and Milind Tambe. Melding the data-decisions pipeline: Decision-focused learning for combinatorial optimization. In Proceedings of the AAAI Conference on Artificial Intelligence, volume 33, pages 1658–1665, 2019.
- Elmachtoub and Grigas [2021] Adam N Elmachtoub and Paul Grigas. Smart “predict, then optimize”. Management Science, 2021.
- Mandi et al. [2020] Jayanta Mandi, Peter J Stuckey, Tias Guns, et al. Smart predict-and-optimize for hard combinatorial optimization problems. In Proceedings of the AAAI Conference on Artificial Intelligence, volume 34, pages 1603–1610, 2020.
- Kotary et al. [2021] James Kotary, Ferdinando Fioretto, Pascal Van Hentenryck, and Bryan Wilder. End-to-end constrained optimization learning: A survey. arXiv preprint arXiv:2103.16378, 2021.
- Demirović et al. [2019a] Emir Demirović, Peter J Stuckey, James Bailey, Jeffrey Chan, Chris Leckie, Kotagiri Ramamohanarao, and Tias Guns. An investigation into prediction+ optimisation for the knapsack problem. In International Conference on Integration of Constraint Programming, Artificial Intelligence, and Operations Research, pages 241–257. Springer, 2019a.
- Demirović et al. [2019b] Emir Demirović, Peter J Stuckey, James Bailey, Jeffrey Chan, Christopher Leckie, Kotagiri Ramamohanarao, and Tias Guns. Predict+ optimise with ranking objectives: Exhaustively learning linear functions. In Proceedings of the Twenty-Eighth International Joint Conference on Artificial Intelligence, IJCAI 2019, Macao, China, August 10-16, 2019, pages 1078–1085. International Joint Conferences on Artificial Intelligence, 2019b.
- Van Vlasselaer et al. [2017] Véronique Van Vlasselaer, Tina Eliassi-Rad, Leman Akoglu, Monique Snoeck, and Bart Baesens. Gotcha! network-based fraud detection for social security fraud. Management Science, 63(9):3090–3110, 2017.
- Cerioli et al. [2019] Andrea Cerioli, Lucio Barabesi, Andrea Cerasa, Mario Menegatti, and Domenico Perrotta. Newcomb–benford law and the detection of frauds in international trade. Proceedings of the National Academy of Sciences, 116(1):106–115, 2019.
- Baesens et al. [2003] Bart Baesens, Tony Van Gestel, Stijn Viaene, Maria Stepanova, Johan Suykens, and Jan Vanthienen. Benchmarking state-of-the-art classification algorithms for credit scoring. Journal of the operational research society, 54(6):627–635, 2003.
- Lessmann et al. [2015] Stefan Lessmann, Bart Baesens, Hsin-Vonn Seow, and Lyn C Thomas. Benchmarking state-of-the-art classification algorithms for credit scoring: An update of research. European Journal of Operational Research, 247(1):124–136, 2015.
- Baesens et al. [2002] Bart Baesens, Stijn Viaene, Dirk Van den Poel, Jan Vanthienen, and Guido Dedene. Bayesian neural network learning for repeat purchase modelling in direct marketing. European Journal of Operational Research, 138(1):191–211, 2002.
- Verbeke et al. [2011] Wouter Verbeke, David Martens, Christophe Mues, and Bart Baesens. Building comprehensible customer churn prediction models with advanced rule induction techniques. Expert systems with applications, 38(3):2354–2364, 2011.
- Verbeke et al. [2012] Wouter Verbeke, Karel Dejaeger, David Martens, Joon Hur, and Bart Baesens. New insights into churn prediction in the telecommunication sector: A profit driven data mining approach. European journal of operational research, 218(1):211–229, 2012.
- Bahnsen et al. [2014] Alejandro Correa Bahnsen, Djamia Aouada, and Björn Ottersten. Example-dependent cost-sensitive logistic regression for credit scoring. In 2014 13th International Conference on Machine Learning and Applications, pages 263–269. IEEE, 2014.
- Petrides et al. [2020a] George Petrides, Darie Moldovan, Lize Coenen, Tias Guns, and Wouter Verbeke. Cost-sensitive learning for profit-driven credit scoring. Journal of the Operational Research Society, pages 1–13, 2020a.
- Höppner et al. [2020] Sebastiaan Höppner, Eugen Stripling, Bart Baesens, Seppe vanden Broucke, and Tim Verdonck. Profit driven decision trees for churn prediction. European journal of operational research, 284(3):920–933, 2020.
- Höppner et al. [2022] Sebastiaan Höppner, Bart Baesens, Wouter Verbeke, and Tim Verdonck. Instance-dependent cost-sensitive learning for detecting transfer fraud. European Journal of Operational Research, 297(1):291–300, 2022.
- Elkan [2001] Charles Elkan. The foundations of cost-sensitive learning. In International joint conference on artificial intelligence, volume 17, pages 973–978. Lawrence Erlbaum Associates Ltd, 2001.
- Petrides and Verbeke [2021] George Petrides and Wouter Verbeke. Cost-sensitive ensemble learning: a unifying framework. Data Mining and Knowledge Discovery, pages 1–28, 2021.
- Davis and Goadrich [2006] Jesse Davis and Mark Goadrich. The relationship between precision-recall and roc curves. In Proceedings of the 23rd international conference on Machine learning, pages 233–240, 2006.
- Dal Pozzolo et al. [2017] Andrea Dal Pozzolo, Giacomo Boracchi, Olivier Caelen, Cesare Alippi, and Gianluca Bontempi. Credit card fraud detection: a realistic modeling and a novel learning strategy. IEEE transactions on neural networks and learning systems, 29(8):3784–3797, 2017.
- Bose and Chen [2009] Indranil Bose and Xi Chen. Quantitative models for direct marketing: A review from systems perspective. European Journal of Operational Research, 195(1):1–16, 2009.
- Hadden et al. [2007] John Hadden, Ashutosh Tiwari, Rajkumar Roy, and Dymitr Ruta. Computer assisted customer churn management: State-of-the-art and future trends. Computers & Operations Research, 34(10):2902–2917, 2007.
- Yang et al. [2014] Xiaoxing Yang, Ke Tang, and Xin Yao. A learning-to-rank approach to software defect prediction. IEEE Transactions on Reliability, 64(1):234–246, 2014.
- Coenen et al. [2020] Lize Coenen, Wouter Verbeke, and Tias Guns. Machine learning methods for short-term probability of default: A comparison of classification, regression and ranking methods. Journal of the Operational Research Society, pages 1–16, 2020.
- Devriendt et al. [2020] Floris Devriendt, Jente Van Belle, Tias Guns, and Wouter Verbeke. Learning to rank for uplift modeling. IEEE Transactions on Knowledge and Data Engineering, 2020.
- McBride et al. [2019] Ryan McBride, Ke Wang, Zhouyang Ren, and Wenyuan Li. Cost-sensitive learning to rank. In Proceedings of the AAAI Conference on Artificial Intelligence, volume 33, pages 4570–4577, 2019.
- Murphy [2012] Kevin P Murphy. Machine learning: a probabilistic perspective. MIT press, 2012.
- Wang et al. [2013] Yining Wang, Liwei Wang, Yuanzhi Li, Di He, Wei Chen, and Tie-Yan Liu. A theoretical analysis of ndcg ranking measures. In Proceedings of the 26th annual conference on learning theory (COLT 2013), volume 8, page 6. Citeseer, 2013.
- Valizadegan et al. [2009] Hamed Valizadegan, Rong Jin, Ruofei Zhang, and Jianchang Mao. Learning to rank by optimizing ndcg measure. In NIPS, volume 22, pages 1883–1891, 2009.
- Wu et al. [2008] Qiang Wu, Chris JC Burges, Krysta M Svore, and Jianfeng Gao. Ranking, boosting, and model adaptation. Technical report, Technical report, Microsoft Research, 2008.
- Burges [2010] Christopher JC Burges. From ranknet to lambdarank to lambdamart: An overview. Learning, 11(23-581):81, 2010.
- Burges et al. [2006] Christopher Burges, Robert Ragno, and Quoc Le. Learning to rank with nonsmooth cost functions. Advances in neural information processing systems, 19:193–200, 2006.
- Friedman [2001] Jerome H Friedman. Greedy function approximation: a gradient boosting machine. Annals of statistics, pages 1189–1232, 2001.
- Chapelle and Chang [2011] Olivier Chapelle and Yi Chang. Yahoo! learning to rank challenge overview. In Proceedings of the learning to rank challenge, pages 1–24. PMLR, 2011.
- Li [2014] Hang Li. Learning to rank for information retrieval and natural language processing. Synthesis lectures on human language technologies, 7(3):1–121, 2014.
- Chen et al. [2015] Tianqi Chen, Tong He, Michael Benesty, Vadim Khotilovich, Yuan Tang, Hyunsu Cho, et al. Xgboost: extreme gradient boosting. R package version 0.4-2, 1(4):1–4, 2015.
- Gunnarsson et al. [2021] Björn Rafn Gunnarsson, Seppe Vanden Broucke, Bart Baesens, María Óskarsdóttir, and Wilfried Lemahieu. Deep learning for credit scoring: Do or don’t? European Journal of Operational Research, 295(1):292–305, 2021.
- Bahnsen et al. [2015a] Alejandro Correa Bahnsen, Djamila Aouada, and Björn Ottersten. A novel cost-sensitive framework for customer churn predictive modeling. Decision Analytics, 2(1):1–15, 2015a.
- Bahnsen et al. [2015b] Alejandro Correa Bahnsen, Djamila Aouada, and Björn Ottersten. Example-dependent cost-sensitive decision trees. Expert Systems with Applications, 42(19):6609–6619, 2015b.
- IBM Sample Data Sets [2017] IBM Sample Data Sets. Telco customer churn, version 1, 2017. Retrieved October 10, 2021 from https://www.kaggle.com/blastchar/telco-customer-churn/version/1.
- Baesens et al. [2016] Bart Baesens, Daniel Roesch, and Harald Scheule. Credit risk analytics: Measurement techniques, applications, and examples in SAS. John Wiley & Sons, 2016.
- Petrides et al. [2020b] George Petrides, Darie Moldovan, Lize Coenen, Tias Guns, and Wouter Verbeke. Cost-sensitive learning for profit-driven credit scoring. Journal of the Operational Research Society, pages 1–13, 2020b.
- Yeh and Lien [2009] I-Cheng Yeh and Che-hui Lien. The comparisons of data mining techniques for the predictive accuracy of probability of default of credit card clients. Expert Systems with Applications, 36(2):2473–2480, 2009.
- Moro et al. [2014] Sérgio Moro, Paulo Cortez, and Paulo Rita. A data-driven approach to predict the success of bank telemarketing. Decision Support Systems, 62:22–31, 2014.
- Dal Pozzolo et al. [2015] Andrea Dal Pozzolo, Olivier Caelen, Reid A Johnson, and Gianluca Bontempi. Calibrating probability with undersampling for unbalanced classification. In 2015 IEEE Symposium Series on Computational Intelligence, pages 159–166. IEEE, 2015.
- Van Vlasselaer et al. [2015] Véronique Van Vlasselaer, Cristián Bravo, Olivier Caelen, Tina Eliassi-Rad, Leman Akoglu, Monique Snoeck, and Bart Baesens. Apate: A novel approach for automated credit card transaction fraud detection using network-based extensions. Decision Support Systems, 75:38–48, 2015.
- Demšar [2006] Janez Demšar. Statistical comparisons of classifiers over multiple data sets. The Journal of Machine Learning Research, 7:1–30, 2006.
- Garcia and Herrera [2008] Salvador Garcia and Francisco Herrera. An extension on" statistical comparisons of classifiers over multiple data sets" for all pairwise comparisons. Journal of machine learning research, 9(12), 2008.
- García et al. [2010] Salvador García, Alberto Fernández, Julián Luengo, and Francisco Herrera. Advanced nonparametric tests for multiple comparisons in the design of experiments in computational intelligence and data mining: Experimental analysis of power. Information sciences, 180(10):2044–2064, 2010.
- Derman et al. [1972] Cyrus Derman, Gerald J Lieberman, and Sheldon M Ross. A sequential stochastic assignment problem. Management Science, 18(7):349–355, 1972.
- Albright and Derman [1972] Chris Albright and Cyrus Derman. Asymptotic optimal policies for the stochastic sequential assignment problem. Management Science, 19(1):46–51, 1972.
- Albright [1974] S Christian Albright. Optimal sequential assignments with random arrival times. Management Science, 21(1):60–67, 1974.
- Cao et al. [2007] Zhe Cao, Tao Qin, Tie-Yan Liu, Ming-Feng Tsai, and Hang Li. Learning to rank: from pairwise approach to listwise approach. In Proceedings of the 24th international conference on Machine learning, pages 129–136, 2007.
- Xia et al. [2008] Fen Xia, Tie-Yan Liu, Jue Wang, Wensheng Zhang, and Hang Li. Listwise approach to learning to rank: theory and algorithm. In Proceedings of the 25th international conference on Machine learning, pages 1192–1199, 2008.
- Ravikumar et al. [2011] Pradeep Ravikumar, Ambuj Tewari, and Eunho Yang. On ndcg consistency of listwise ranking methods. In Proceedings of the Fourteenth International Conference on Artificial Intelligence and Statistics, pages 618–626. JMLR Workshop and Conference Proceedings, 2011.
- Sculley [2009] D Sculley. Large scale learning to rank. 2009.
- Lucchese et al. [2017] Claudio Lucchese, Franco Maria Nardini, Salvatore Orlando, Raffaele Perego, and Salvatore Trani. X-dart: blending dropout and pruning for efficient learning to rank. In Proceedings of the 40th International ACM SIGIR Conference on Research and Development in Information Retrieval, pages 1077–1080, 2017.
- Cakir et al. [2019] Fatih Cakir, Kun He, Xide Xia, Brian Kulis, and Stan Sclaroff. Deep metric learning to rank. In Proceedings of the IEEE/CVF Conference on Computer Vision and Pattern Recognition, pages 1861–1870, 2019.