The Galactic high mass X-ray binary population with Fermi-LAT
Abstract
We search for -ray emission from 114 Galactic high mass X-ray binaries, including 4 well studied catalogued sources, in 12.5 years of Fermi-LAT data in conjunction with the 10-year point source catalogue. Where a -ray excess appears to be spatially coincident with an X-ray binary, further investigation is performed to ascertain whether this excess is the product of physical processes within the binary system itself. We identify -ray excesses coincident with 20 high mass X-ray binaries where there is little or no prior evidence for -ray emission. However, we find that many of these are false positives caused by source confusion or the -ray background. Nonetheless, tentative but promising indicators of -ray emission are identified for several new systems, notably including 1A 0535+262, RX J2030.5+4751 and SAX J1324.4-6200.
keywords:
X-rays: binaries – gamma-rays: stars – surveys1 Introduction
X-ray binaries (e.g. Verbunt 1993 & Casares et al. 2016) are systems where a compact object (the accretor), either a stellar mass black hole or neutron star, and a companion star (the donor) are in orbit around a common gravitational barycentre. They can be divided into two broad sub-populations based on the mass of the donor star. The high mass X-ray binaries (HMXBs) (e.g. Reig 2011, Walter et al. 2015 & Kretschmar et al. 2019) have massive companion stars which continually lose mass through stellar winds; these winds are then accreted onto the compact object and are heated, causing X-ray emission. The low mass X-ray binaries (LMXBs) (Van Paradijs & Van der Klis, 2001) have lower mass companion stars which fill, and exceed, their Roche lobe as part of the latter stages of stellar evolution. As a result, matter from these companion stars overflows to the compact object through the first Lagrangian point, and thence is accreted (Paczyński 1971 & Tout & Hall 1991).
Gamma-rays have been detected from a variety of binary star systems, including X-ray binaries. In the most recent catalogue from the Fermi Large Area Telescope (Fermi-LAT) (Atwood et al., 2009), the 4FGL-DR2 (Abdollahi et al. 2020, Ballet et al. 2020), a total of 22111We consider the sources with either the ‘HMB’, ‘LMB’, ‘NOV’ or ‘BIN’ source class in the 4FGL-DR2 to be Fermi-LAT detected binary systems. Two further 4FGL sources are known: 4FGL J1405.1-6119 (Corbet et al., 2019) and HESS J1832-093/4FGL J1832.9-0913 (Martí-Devesa et al., 2020). We do not discuss these in depth as they do not have the HMB source class. binary systems are listed as -ray sources, 8 of which are HMXBs. These 8 objects can be divided broadly into two classes: -ray emitting microquasars and -ray binaries (Mirabel 2012, Dubus 2015 & Paredes & Bordas 2019). These classes are not mutually exclusive with one another, with microquasars being distinguished by their physical properties and -ray binaries being an exclusively phenomenological label. Additionally, -rays are seen from 13 nearby -ray novae222Only one -ray nova is included in the 4FGL-DR2, V5668 Sgr. (e.g. Morris et al. 2017 & Franckowiak et al. 2018) and the colliding wind binaries, -Carinae (Abdo et al., 2010) and -Velorum (WR11)333Of these two binaries, only -Carinae is included in the 4FGL-DR2. (Pshirkov 2016 & Martí-Devesa et al. 2020). We do not consider these here, nor do we deal with the LMXB population (Liu et al., 2007), which will be discussed in a later paper.
1.1 Microquasars
In both low and high mass X-ray binaries, matter falling towards the accretor releases large amounts of gravitational potential energy, primarily in the form of X-ray emission, the distinguishing feature of these systems. This emission is not constant; variability is a common feature of X-ray binary systems as X-ray emission is fundamentally linked to accretion rate, which is itself inherently variable. The behaviour of X-ray binary systems is described by the Hardness-Intensity model (Fender et al., 2004), where accretion discs build over time and then drain onto the central object, producing a relativistic jet similar to those seen in active galactic nuclei (AGN). This jet gives rise to a class of X-ray binaries known as the microquasars (e.g Mirabel & Rodriguez 1994 & Corbel 2010). Typical radio-loud AGN are distinguished by their radio jets (for example in the well-studied radio galaxy M 87 (Turland & Scheuer 1975, Biretta et al. 1999 & Walker et al. 2016)). The microquasar binary systems also have strong radio emission from their jets in addition to luminous X-ray emission from the central binary system, making these systems stellar mass analogues to the AGN population. However, the microquasar population is small and diverse; while there are hundreds of known X-ray binary systems identified in the Milky Way and in the Large and Small Magellanic Clouds (Liu et al. 2006 and Liu et al. 2006), only 10s of these have been identified as microquasars.
The first microquasar discovered, and one of the best studied, is SS433, a HMXB system with resolvable jets (Fabian & Rees, 1979). SS433 is thought to be a unique object, with persistent jets due to a persistently super-Eddington accretion disc (Fabrika, 2004). Several studies have identified evidence for -ray emission from the jets of SS433 (e.g. Bordas et al. 2015, Rasul et al. 2019, Li et al. 2020). However, neither the binary nor any components of the jets are catalogued -ray sources in the 4FGL-DR2 due to the fact that this emission does not reach the typical level required for a conventional claim of detection at the catalogue position of SS 433 over the energy range used in the production of the 4FGL.
Two444Although they may also be microquasars, we discuss LS 5039 and LS I+61 303 as -ray binaries in Section 1.2; here we discuss the microquasars Cyg X-1 and Cyg-X-3 which show emission characteristics different from the -ray binaries (Chernyakova & Malyshev, 2020). microquasars are listed in the 4FGL-DR2: Cyg X-3 (Abdo et al., 2009b) and Cyg X-1 (Bodaghee et al., 2013). In these microquasars, particle acceleration occurs down the jet, resulting in a non-thermal electromagnetic (EM) emission component which is seen from radio through to -ray wavelengths (Orellana et al. 2007, Araudo et al. 2009). Unlike SS433, neither Cyg X-1 or Cyg X-3 has persistent jets, and -ray emission is seen only when a jet is present or ejections take place from the system. Bodaghee et al. (2013) report that for Cyg X-3 (the more significant -ray emitter of the two) these -ray emitting episodes last for 1̃0s of days, with intervals of 1̃00s of days between them, and that there is strong evidence for multi-wavelength correlation between the soft X-ray and radio emission (Corbel et al., 2012), with -ray emission occurring at least when there is recurring radio emission (Abdo et al., 2009b). In the case of Cyg X-1, transient emission is also detected with Fermi-LAT on daily timescales, but at a lower statistical significance than Cyg X-3, and occurs during the low-hard X-ray state in the Cyg X-1 system (Zanin et al., 2016).
1.2 -ray binaries
The remaining 6 HMXBs in the 4FGL-DR2 fall into a broad category known as the -ray binaries. These have the peak of their emission in the -ray waveband, compared to the microquasars which generally have the peak of their emission in X-rays (Dubus, 2013), although there is some degeneracy between the two categories. Of these 6 systems, PSR B1259-63 (Aharonian et al. 2005, Abdo et al. 2010), 1FGL J1018.6-5856 (Corbet et al., 2011), LS 5039 (Paredes et al., 2000), HESS J0632+057 (Aharonian et al. 2007, Hinton et al. 2009), and LS I +61 303 (Lamb & Macomb, 1997) are in the Milky Way and LMC P3 is in the Large Magellanic Cloud (Corbet et al., 2016). All of these systems are also detected by the current generation of ground-based TeV observatories.
Whilst -ray production in microquasars is most likely due to accretion onto the compact object and subsequent particle acceleration in a jet, -ray binaries are distinct in that their -ray emission comes from shocks between the wind of the accretor and the stellar wind of the companion star (Dubus, 2015), or possibly through an accretion-ejection regime if the source is also a microquasar.
Young pulsars, such as PSR B1259-63, continually lose kinetic energy in the form of a pulsar wind. For an isolated pulsar, this results in the formation of a pulsar wind nebula (PWN), a cloud of relativistic particles accelerated by the central pulsar. PWN are luminous across the EM spectrum, and produce non-thermal emission through shocks with the interstellar medium (Amato 2014, Amato 2020). 17 PWN are seen with Fermi-LAT and recorded in the 4FGL-DR2, with 14 of these being extended sources. When a rotation-powered pulsar forms a wind in a binary system around a high mass star, this interacts with the dense wind of the companion star, producing shocks between the two winds within the binary system rather than at the extended scales observed in PWN. This leads to orbitally-modulated -ray emission in some systems; for example, the light-curve of PSR B1259-63 shows increased -ray emission at periastron (Aharonian et al. 2005, Chang et al. 2018).
Whilst this scenario requires the accreting compact object to be a neutron star rather than a black hole, the existence of a neutron star is confirmed in only PSR B1259-63 and possibly LSI +61 303 (Torres et al., 2011), although there is an ongoing debate regarding the phenomenology of this source and whether an accreting compact object is present (e.g. Massi et al. 2020). This is thought to be because the pulsars in the remaining systems are so deeply embedded within their systems’ circumstellar winds that coherent radio pulsations cannot be detected (Dubus, 2006). Nevertheless, this model is favoured for the -ray HMXB systems other than the microquasars. Better knowledge of these systems and an expanded catalogue of -ray binaries are needed to build an improved picture (Dubus, 2015).
1.3 Surveying the HMXB population
In this paper we present an independent survey of Galactic high mass X-ray binary systems using the Fermi Large Area Telescope and the data from Liu et al. (2006), with the intention of increasing the catalogue of potential -ray emitting X-ray binaries. The catalogue of Liu et al. (2006) contains 114 HMXBs, including 4 sources already identified as -ray emitters in the 4FGL (Cyg X-1, Cyg X-3, LS 5039 and LSI +61 303). This leaves 110 HMXBs to be surveyed which are not previously detected with Fermi-LAT. We build individual models of the region of interest around each binary system, and use maximum likelihood estimation to fit this model to the data. We use our model to test the hypothesis that there is a -ray point source coincident with the position of a HMXB. If we find it likely that this is the case, then we investigate the source’s spectral properties and temporal variability. We also consider the possibility that some weak -ray emitting objects may only be seen sporadically and would not reach the statistical threshold for detection () when integrated over the full mission duration of Fermi-LAT (12.5 years).
2 Fermi-LAT observations and data analysis
2.1 Data Reduction and Modelling
The vast majority of X-ray binary systems are located close to the Galactic plane, which itself is an extremely luminous background source of -rays when observed with Fermi-LAT. Modelling the Galactic plane accurately is non-trivial; many extended sources (such as supernova remnants and pulsar wind nebulae) are present on the Galactic plane, in addition to a densely-packed field of point sources. In addition to these, the Galactic plane diffuse background is still poorly understood and is distinctly non-uniform, although the most recent Galactic diffuse model provides a better representation of the background when compared to previous versions (Acero et al., 2016).
We follow the maximum likelihood modelling method of Mattox et al. (1996) in order to model the Fermi-LAT data in a region of interest (ROI) centered around the position of each HMXB. Although there is considerable overlap between ROIs, for simplicity and clarity we treat each system independently rather than considering multiple HMXBs in the same ROI simultaneously. We use the Fermitools v1.2.23 in conjunction with the Python module Fermipy v0.19.0 (Wood et al., 2017). We then follow a standard data reduction chain consisting of photon selection followed by computing instrument exposure and livetime. The selected photons are binned into spatial bins of width and into 8 energy bins per decade. We then set up our model using the parameters described in Table 1, including the most recent point source catalogue, the 10 year 4FGL-DR2. The gta.optimize routine is used to push the parameters of the model closer to their global maxima iteratively, and the gta.find_sources routine is then used to populate the model with any additional, uncatalogued sources detected that are more than away from the nearest neighbour. We free the normalisation of all sources within of the centre of the ROI, including the isotropic and Galactic background components, and execute a full likelihood fit, using the MINUIT optimiser, until an optimal fit quality of 3 is obtained.
In order to test the accuracy of our model, we generate residual maps of each ROI, which reflect the difference between the model and the data. Certain regions of the Galactic plane are prone to over- or under-fitting, particularly at higher photon energies where statistics are poor. However, in the vast majority of cases the model reflects the data accurately enough for our purposes. We also generate test statistic maps, which indicate the positions and significance of any excess -rays which are not accounted for in our model.
On completion of this procedure, we have a fully-fitted model centered around the position of each HMXB, with statistical maps to test how accurately the model reflects the LAT data.
| Observation Period (Dates) | 04/08/2008 - 05/02/2021 |
|---|---|
| Observation Period (MET) | 239557417 - 600307205 |
| Observation Period (MJD) | 54682 - 58423 |
| Energy Range (GeV) | 0.1 - 500 |
| Data ROI width | |
| Model ROI Width | |
| Zenith Angle | |
| GTI Filter | DATA_QUAL>0 && LAT_CONFIG==1 |
| Instrument Response | P8R3_SOURCE_V2 |
| Isotropic Diffuse Model | iso_P8R3_SOURCE_V2_v1 |
| Galactic Diffuse Model | gll_iem_v07 |
| Point Source Catalogue | 4FGL-DR2 |
| Extended Source Templates | 8 Year Templates |
2.2 Testing for persistent -ray emission
To assess whether -ray emission is detected from the position of a HMXB, we perform a statistical test of significance. For a likelihood model such as ours we can use a hypothesis test, which provides us with a test statistic (TS) measuring the goodness-of-fit of an alternate hypothesis () against a null hypothesis (). In this case, our alternate hypothesis is that there is a -ray point source present at a particular position in our model, and the null hypothesis is that there is not. The TS is given by Equation 1:
| (1) |
Here and are the likelihoods of the two hypotheses. The TS itself is distributed as a statistic for statistical degrees of freedom between the two hypotheses (see Wilks’ Theorem; Wilks 1938). As a result, the TS directly translates to a -statistic, a more universally understood measure of statistical significance.
The gta.find_sources algorithm from Fermipy generates a TS map of our ROI and then iteratively fits point sources to the most significant peaks of -ray emission which cannot be accounted for by existing model components. The algorithm will fit point sources to the 4 highest TS peaks, and then repeat either 5 times, or until there are no more peaks above a user-defined minimum TS value, which we set to , being equivalent to . As a measure to avoid source confusion (where -ray emission between two close sources becomes indistinguishable), we define a minimum separation for our algorithm, whereby a source cannot be fitted within of a higher TS peak.
Each -ray source added to our model by the gta.find_sources algorithm has a positional uncertainty, which reflects the systematic uncertainty of the instrument. We define a -ray source as being spatially coincident with the position of a HMXB if the angular offset from the position of the HMXB is less than the angular positional uncertainty555The PSF of Fermi-LAT is large and energy-dependent and therefore the ‘position’ of a source is simply the point where the origin of the -rays is most likely to be, given the PSF. The angular positional uncertainty is the statistical uncertainty on this likely position. of the point source, i.e. the HMXB lies within the positional uncertainty of the -ray source.
In most cases, we do not expect to see a -ray source coincident with the position of a binary through the use of the gta.find_sources algorithm alone. Whilst many of the HMXBs simply will not produce any detectable -ray emission, the use of the gta.find_sources algorithm has some limitations. In each ROI we are limited to fitting sources to only the 20 highest TS peaks. This excludes any sources that are not necessarily one of these 20, but still have a and would otherwise be considered -ray point sources within our survey. Additionally, with a minimum separation of , it is entirely possible for a HMXB to be emitting detectable and distinguishable -ray emission, but to be within this minimum angular separation. This is a particular issue on the Galactic plane, where catalogued point sources are packed closely together, and would exclude many of our HMXBs from the discovery of -ray emission.
To mitigate this, following our full likelihood fit (and after gta.find_sources has been run), we add a point source at the position of the central HMXB manually in each ROI if there is no coincident source identified by the gta.find_sources algorithm. This added source has an initial soft power law spectrum with spectral index . We then free all parameters of this added source and the normalisation of the sources within of it, and both components of the -ray background. We then execute another maximum likelihood fit which gives a TS for this added source.
As is conventional in -ray astronomy, we use a TS threshold of 25 () to claim full detection of a -ray source coincident with the position of a HMXB. We also report -ray fluxes for -ray excesses in the () range as, while these do not meet the conventional significance for detection and often lack the photon statistics for further analysis, they may be worthy of further study. For those sources (either detected using the gta.find_sources algorithm, or added later) which exceed the threshold, we carry out further investigation detailed in Section 4, in order to explore whether this -ray emission is likely to originate from the binary.
2.3 Testing for transient/variable -ray emission
Three of the eight HMXB systems catalogued in the 4FGL-DR2 have a variability index , indicating a less than chance of their being steady -ray sources (Abdollahi et al., 2020), on monthly timescales. These 3 variable sources are: PSR B1259-63 (4FGL J1302.9-6349), Cygnus X-3 (4FGL J2032.6+4053) and LSI +61 303 (4FGL J0240.5+6113) (Ballet et al., 2020). In all cases, their -ray emission correlates with multi-wavelength emission, firmly identifying these 4FGL sources as the -ray counterparts of the HMXBs. Additionally, possible orbital modulation in SS 433 (Li et al. 2020 and Rasul et al. 2019), the intermittent nature of the -ray emission from Cyg X-1 correlating with the low-hard X-ray state (Bodaghee et al., 2013), and periodic variability from LS 5039 (Abdo et al. 2009a, Hadasch et al. 2012 and Yoneda et al. 2020) suggest that the HMXB population is generally variable at -ray wavelengths irrespective of emission mechanisms, although short-term variability may not be detectable with Fermi-LAT due to sensitivity limitations.
In order to check for transient or variable -ray emission from the positions of the HMXBs, we construct a light-curve at their positions using either the coincident source found by the gta.find_sources algorithm or the source we add afterwards. We use approximately 6 month time bins (25 bins over our observation period) in all cases. To produce the light-curves we use the gta.lightcurve algorithm which carries out a full likelihood fit of the ROI in each time bin to calculate an integrated flux and TS value for the source on a bin-by-bin basis. For each bin we report an energy flux value if , or a confidence limit otherwise.
In order to see whether a light-curve shows evidence for emission in any bin(s), we employ a mathematical ‘light-curve condition’ which, when satisfied, indicates that there are bins in a light-curve with significant -ray flux. If the condition is satisfied, we can then examine these bins to see whether -ray emission is constant (non-variable), the flux values vary (variable), or a -ray flux appears only during a for a certain time interval (transient). The likelihood fitting used in gta.lightcurve results in a TS value for each bin giving us a measure of how significant the -ray flux is in this bin. Using Wilks’ Theorem, we are then able to calculate a p-value for each bin, which gives the probability that each bin arises by chance. We then take all of the p-values for each bin with , and use Equation 2 below to calculate a p-value for all the significant () bins:
| (2) |
where is the number of bins with , and is the p-value of each bin. We exclude bins with , because these have insufficient statistics to provide a reliable flux value and are therefore generally less useful for trying to understand the properties of a source. This is particularly true on the Galactic plane (where most of the HMXB population lies) where the luminous diffuse -ray emission and crowded field mean that bins with are likely to be noise-dominated.
We consider a source to have satisfied the light-curve condition and to have evidence for significant emission in its light curve if , the p-value for . This is consistent with our threshold for testing for persistent -ray emission, as described in Section 2.2. It is important to note that the light-curve condition does not provide information on the nature of any transient emission or variability, but only that significant -ray emission is present in the light-curve itself.
| Binary name | TS | -Score | Energy Flux () | LC Condition | Section | Radio |
|---|---|---|---|---|---|---|
| SAX J1324.4-6200 | 12.8 | Yes | 4.1 | No | ||
| 1H 0749-600 | 14.4 | No | 4.2 | No | ||
| 1H 1238-599 | 10.6 | Yes | 4.3 | No | ||
| GRO J1008-57 | 24.3 | Yes | 4.4 | Yes | ||
| IGR J16320-4751 | 31.1 | Yes | B.1 | No | ||
| IGR J16358-4726 | 9.5 | Yes | B.2 | No | ||
| IGR J16465-4507 | 50.8 | Yes | B.3 | No | ||
| 1WGA J0648.0-4419 | 18.5 | No | B.4 | No | ||
| AX J1740.1-2847 | 7.2 | N.A. | Yes | B.5 | No | |
| IGR J17544-2619 | 19.7 | No | 4.5 | No | ||
| H 1833-076 | 29.2 | Yes | B.6 | No | ||
| GS 1839-04 | 17.8 | Yes | B.7 | No | ||
| IGR J19140+0951 | N.A. | N.A | N.A. | Yes | 4.6 | No |
| 1A 0535+262 | 12.4 | Yes | 4.7 | Yes | ||
| GRO J2058+42 | 16.4 | No | 4.8 | No | ||
| W63 X-1 | 13.1 | Yes | 4.9 | No | ||
| SAX J2103.5+4545 | N.A. | N.A. | N.A. | Yes | B.8 | No |
| RX J2030.5+4751 | 30.8 | Yes | 4.10 | No | ||
| 4U 2206+543 | 30.5 | Yes | 4.11 | No | ||
| IGR J00370+6122 | 7.3 | N.A. | Yes | 4.12 | No |
| Binary name | TS | -Score | 4FGL -Score | Energy Flux () |
|---|---|---|---|---|
| LS 5039 | 18000 | |||
| Cyg X-1 | 88 | |||
| Cyg X-3 | 860 | |||
| LS I +61 303 | 170000 |
3 Survey Results
We consider any ROI from our modelling which has a source coincident with the position of the binary and to show significant evidence for -ray emission from the binary’s position. These sources are significant enough (and have enough photon statistics) for spectral analysis and -ray localisation using the gta.localize algorithm. We describe the results on a source-by-source basis in Section 4, and discuss whether the -ray emission detected in each ROI is likely to be from the spatially-coincident HMXB. In total, we detect 5 significant new -ray sources coincident with the positions of HMXBs with in the 13-year dataset. These are listed with their TS values and integrated energy fluxes in Table 2.
For ROIs where a -ray excess coincident with the position of the binary lies in the range it is often impossible to carry out meaningful spectral analysis or localisation. Additionally, these sources lie below the threshold for a conventional detection, and therefore ascertaining the presence of -ray emission from such systems is challenging. Nonetheless, temporal qualities such as flares or phased emission can still be used to associate a sub-threshold -ray excess with an X-ray binary. We find a total of 11 -ray sources in the range. These are also listed with their TS and integrated energy flux in Table 2.
For ROIs from which no significant -ray flux () is detected, we report a confidence upper limit on flux in Table 4.
Several X-ray binaries with known -ray emission are also included in the Liu et al. (2006) HMXB catalogue. These are the microquasars Cyg X-1, Cyg X-3 and SS433, and the -ray binaries LS 5039 and LS I +61 303. With the exception of SS433, we detect all of these sources with a -score within a factor of 3 of their 4FGL-DR2 values. These values are shown in Table 3. That we do not detect SS433 in our analysis in contrast to previous studies is unsurprising as Li et al. (2020), the most recent study of the system, used a phased analysis in order to resolve the extended emission of SS 433 from the highly luminous, nearby pulsar PSR J1907+0602, which we do not use here. Previous studies, including Rasul et al. (2019) use different background models, and a different catalogue without the inclusion of maximum likelihood weighting, which makes a direct comparison difficult. Finally, the position of the -ray emission from SS 433 appears to correspond to the jet termination lobe, itself offset from the central position of the binary which we analyse (Rasul et al., 2019).
We find 16 HMXB systems where the light-curve condition is met. The majority of these (12 systems) also have persistent -ray emission with , including all of the HMXBs with persistent emission. We also find significant () bins in the light-curves of two additional sources with , and two where no fit is found for a point source at the position of the HMXB. Despite the lack of a persistent -ray excess coincident with these binaries, multi-wavelength data can be used to identify features (such as flares) across different wavebands coincident with the apparent -ray emission. To this end, we use light-curve data (where available) for these 16 systems in the X-ray waveband from the Swift Burst Alert Telescope (BAT) which operates in the 15 - 50 keV range and the Monitor of All Sky X-ray Image (MAXI), which operates in the 2 - 20 keV energy range. We also use any available V-band optical photometry data from the American Association of Variable Star Observers (AAVSO). These sources, along with those which show persistent -ray emission, are considered in Section 4 and Appendix B.
4 Discussion
4.1 SAX J1324.4-6200
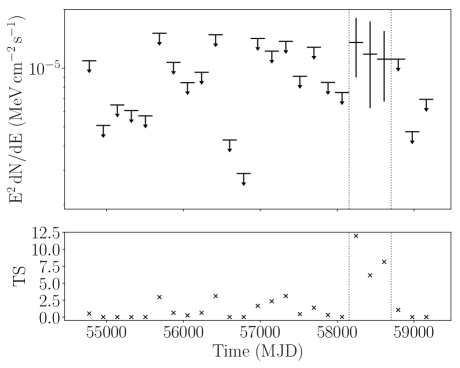
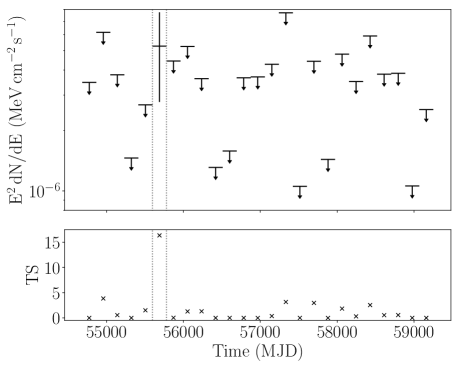
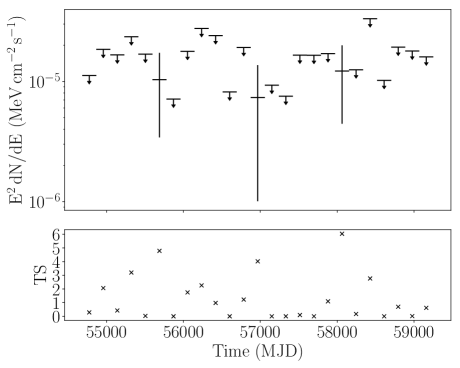
SAX J1324-6200 (henceforth SAX13) is an X-ray pulsar, thought to be an accreting high-mass neutron star in orbit with a Be star (Angelini et al. 1998, Mereghetti et al. 2008, Kaur et al. 2009). No orbital period is known for this system. We report a persistent TS of 12.8 over the full 12.5 year dataset; however, there is some evidence for sustained -ray emission from the position of SAX13 over an 18 month period throughout 2018 and 2019 (MJD 57972 - 58520), at the to level, suggesting this emission is likely transient. The -ray light-curve for this source is shown in Figure 1. There is no Swift-BAT or MAXI light-curve for SAX13, nor are there any optical photometry measurements in the AAVSO database for the time period in question.
There are several catalogued sources near SAX13. The closest of these are 4FGL J1328.4-6231 ( at an angular offset from SAX13 of ), 4FGL J1321.1-6239 (, offset: ), 4FGL J1320.5-6256c (, offset: ) and 4FGL J1329.9-6108 (, offset: ). Additionally, we add a new source to our model with the gta.find_sources algorithm, PS J1317.8-6157 (, offset: ). None of these have a 4FGL variability index high enough to indicate variability on monthly timescales. We generate light-curves for each of these sources (with the exception of the faint 4FGL J1320.5-6256c and PS J1317.8-6157 because these sources are sufficiently faint and have a large enough angular distance from SAX13 that we can be confident that they are not causing source confusion at the position of SAX13) using identical binning to the SAX13 light-curve, and do not see any significant enhancement in these light-curves at the time of the 18 month apparent SAX13 -ray excess, meaning that it is likely that this excess is independent of these sources.
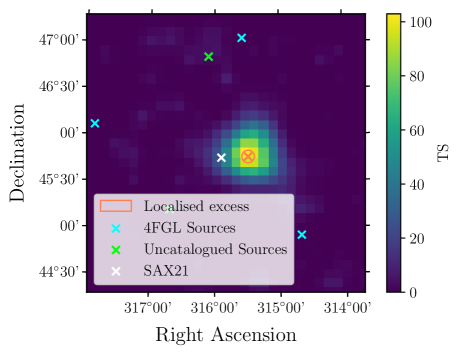
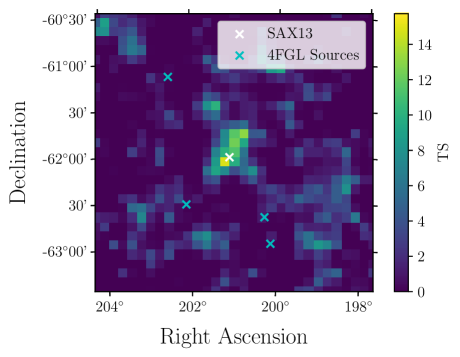
Considering only the photons detected within the 18 month excess we carry out an independent analysis of the same ROI over this 18 month period (using the same parameters, other than observation time, as in Table 1). We generate a TS map (Figure 2) of the centre of the ROI, and find that the peak of this excess is approximately spatially coincident with the position of SAX13. Fitting a power-law point source to the position of SAX13, we free this source and those within of the central position of SAX13 and execute a likelihood fit. We then run the gta.localize algorithm on the added SAX13 source, and find that the optimal position of the added source is , , offset from SAX13 by . Considering that this offset is less than the and containment radii of the added source ( and respectively) this excess can be regarded as spatially coincident with the location of SAX13. With the point source at its optimal position, we calculate a TS of 28.7 over this 18 month period. Over the same period, there is no significant detection of 4FGL J1256.1-5919 or 4FGL J1320.5-6256c. 4FGL J1321.1-6239 is detected with a TS of 24.9 and 4FGL J1329.9-6108 with a TS of 49.4, making the SAX13 source comparable to these objects in terms of statistical significance during this time.
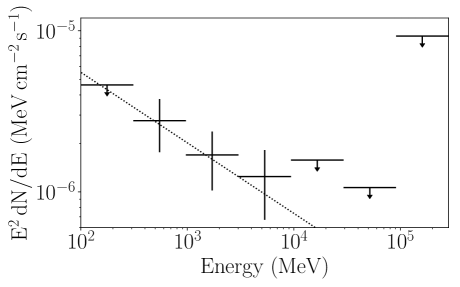
Given that the TS of the SAX13 source exceeds 25, we have sufficient photon statistics to carry out a spectral fit, shown in Figure 3. We find the best fit spectrum is a power-law with normalisation , spectral index and scale energy .
It is entirely possible that this -ray emission is associated with the system. The power law spectral fit and calculated spectral index are consistent with those known HMXB systems in the 4FGL with lower detection significances (the more significantly-detected systems are best fit by a log parabola spectral model). These are the Cyg X-1 with and , HESS J0632+057 with and and PSR B1259-63 with and , compared to SAX13 which we observe to have and . Considering that the accretor in this system is known to be a pulsar, and SAX13 is not a known microquasar, if this -ray emission does indeed come from SAX13 then it is likely to be from a pulsar wind interaction as seen in the -ray binary population. However, without any corroborating multi-wavelength data, it is difficult to be certain that this is indeed from SAX13 and not another undetected source nearby. Additionally, if this -ray emission is indeed from a pulsar wind interaction, the fact that we see only one emission episode during the lifetime of Fermi-LAT suggests that the period of the system may be so long that it would be difficult to obtain the frequency of these interactions.
4.2 1H 0749-600
1H 0749-600 (henceforth 1H07) is a HMXB with an unknown accretor and a Be companion star (Apparao, 1994). Over the 12.5 year observation period we find a spatially-coincident excess with a TS of 14.4, which we assign the name PS J0750.5-6116, and with a slight angular offset from the position of 1H07 of . The nearest 4FGL sources are 4FGL J0807.0-6102, which is the blazar PMN J0806-6101 ( at an angular offset from 1H07 of ) and 4FGL J0756.3-6431, which is the BL Lac blazar SUMSS J075625-643031 (, offset ). As neither of these blazars is particularly luminous, it is unlikely that source confusion is the cause of the persistent -ray excess PS J0750.5-6116.
We calculate the light-curve of PS J0750.5-6116, shown in Figure 4, and find a -ray excess in one bin with () (MJD 55597 - 55779), and upper limits in the other 24 bins. As blazars are a generally variable class of -ray emitters, we produce light-curves of the two nearest 4FGL sources, but see no enhancement in the same bin as the PS J0750.5-6116 excess. This suggests this time bin is independent of the -ray emission of the blazars. It is likely that this single 6-month period is responsible for the majority of the -ray emission observed from the position of PS J0750.5-6116. A re-analysis of this 6-month period results in a slightly increased TS of 17.2, having used the gta.localize algorithm to obtain a best fit position of LII , BII . This gives an angular offset of from the (IR) position of 1H07. Given that the positional uncertainty of PS J0750.5-6116 is , this is still spatially coincident with 1H07.
This low-significance excess cannot be firmly associated with 1H07. Furthermore, as the nature of the accretor in this system is unknown, and no microquasar-like behaviour or pulsations have been observed, the physical mechanisms behind any -ray emission from this system are unclear. No orbital period is known for this system, so examining the -ray emission by orbital phase is not possible. We conclude that whilst it is entirely possible that PS J0750.5-6116 represents faint -ray emission from 1H07, a lack of information makes a firm detection claim impossible.
4.3 1H 1238-599
1H 1238-599 (henceforth 1H12) is an X-ray pulsar HMXB system (Huckle et al., 1977). Over the full 12.5 year dataset, the TS is 10.6, with the light-curve (Figure 5) showing borderline significance (approximately ) -ray excesses across 6 of the 25 bins (MJD 54865 - 55231, MJD 55962 - 56145, MJD 57241 - 57425, and MJD 57607 - 57973). The nearest catalogued sources are 4FGL J1256.1-5919 ( and an angular offset from 1H12 of ), which is the blazar PMN J1256-5919, 4FGL J1244.3-6233 (, offset: ) and 4FGL J1253.3-5816 (, offset: ), which is the pulsar PSR J1253-5820. None of these sources has a catalogue variability index which would indicate variability on monthly timescales. As these sources are at some distance from the position of 1H12, it is unlikely that any -ray signal from the position of 1H12 is due to source confusion with a 4FGL source. Similarly, no uncatalogued sources of -rays are detected close to 1H12 by gta.find_sources, the closest such source being approximately away.
Given that the bins in which we measure an apparent flux are all at the level, it is difficult to perform any detailed tests of emission (for example, localisation) at the position of 1H12. As multi-wavelength data for this HMXB are not available, we cannot cross correlate the -ray light-curve with other wavelengths. Finally, an orbital period for this binary has not been measured, therefore we cannot correlate the light-curve with the system period. As a result, while it is possible that the light-curve of 1H12 is showing a very faint signal that could be from the binary, we could equally be measuring fluctuations in the Galactic diffuse background.
4.4 GRO J1008-57
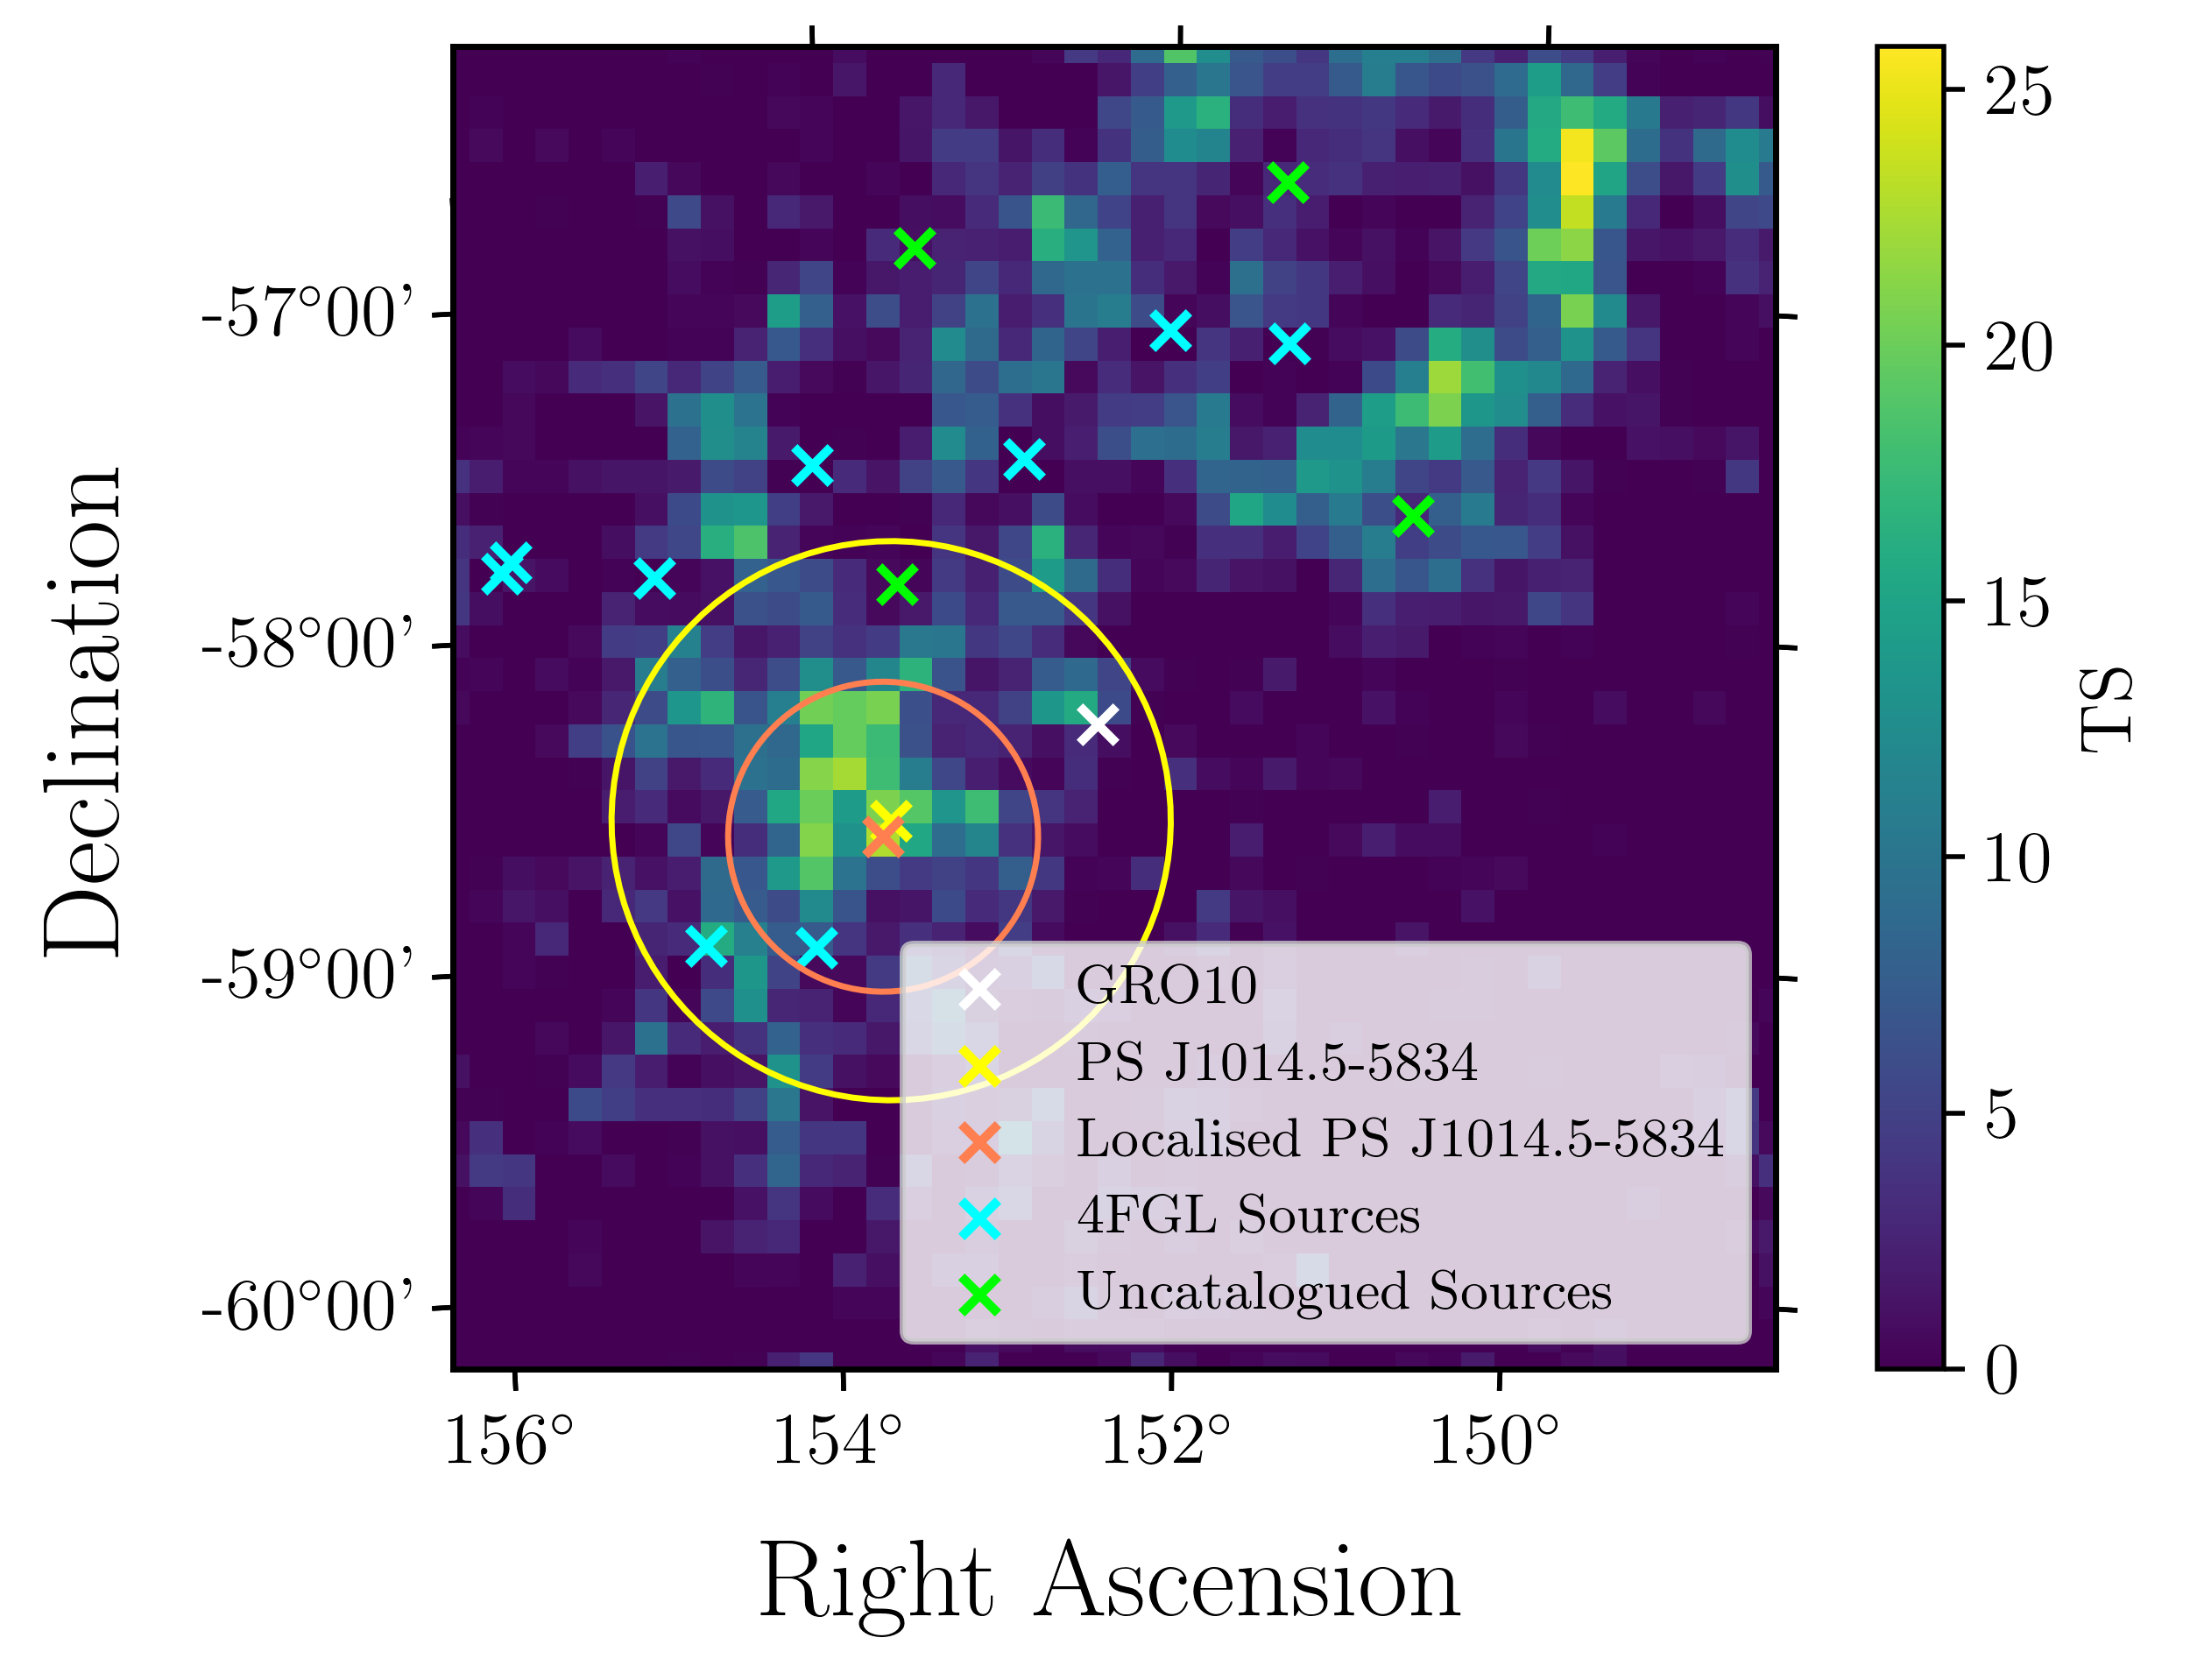
GRO J1008-57 (henceforth GRO10) is an X-ray pulsar/Be star HMXB system (Petre & Gehrels, 1993), with an orbital period of 135.0 days. Over the 12.5 year observation time, we find a source, PS J1014.5-5834, that is spatially coincident with GRO10 with gta.find_sources. The angular offset between GRO10 and PS J1014.5-5834 is less than the positional uncertainty of the source. However, PS J1014.5-5834 has an unusually large positional uncertainty of approximately . Running the gta.localize algorithm, we find that, while the position of the source does not change significantly, the positional uncertainty decreases to the extent that this source is no longer coincident with the position of GRO10. Figure 6 shows the position of GRO10 together with the positional uncertainty of PS J1014.5-5834 both before and after localisation, and shows a somewhat extended -ray structure around PS J1014.5-5834.This is likely the cause of the large positional uncertainty, as gta.find_sources does not account for spatially-extended -ray structures.
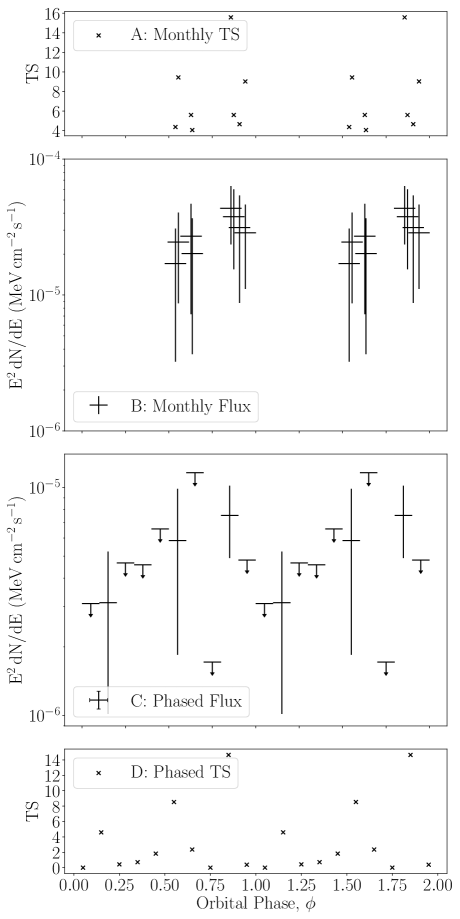
GRO10 is a well-studied system, particularly in the X-ray waveband, with semi-predictable X-ray flares occurring at periastron (Kühnel et al., 2013), the most recent of which was observed in 2020 (Nakajima et al. 2020a and Nakajima et al. 2020b). Xing & Wang (2019) (henceforth Xing 19) studied the possibility of -ray emission using approximately 9 years of Fermi-LAT observations but employing the 4 year LAT catalogue and correspondingly older background models. We use the 10 year 4FGL-DR2 with the corresponding Galactic and isotropic diffuse models, enabling more accurate modelling of the region around GRO10 than was possible with the older models and catalogue. Xing 19 observed a -ray excess at the position of GRO10 to a TS of 7 () by adding a point source to the model, and carrying out a likelihood fit. They then carried out a stacked temporal analysis binned by orbital phase, dividing each orbit into 10 equal time bins and summing the bins from each orbit. Through this method, Xing 19 identified 3 excesses, two around the middle of GRO10’s orbit with (), and one in the penultimate orbital phase bin preceding periastron with () Additionally, Xing 19 identified 3 excesses by deriving a light-curve for their entire observation time and found excesses in the bins centered on MJD 55135 and MJD 55559 and a excess in the bin centered on MJD 56383. Given the significance of these excesses, and the lack of other emission, it is likely these dominate their stacked orbital analysis and are primarily responsible for the TS values seen in the phased light-curve.
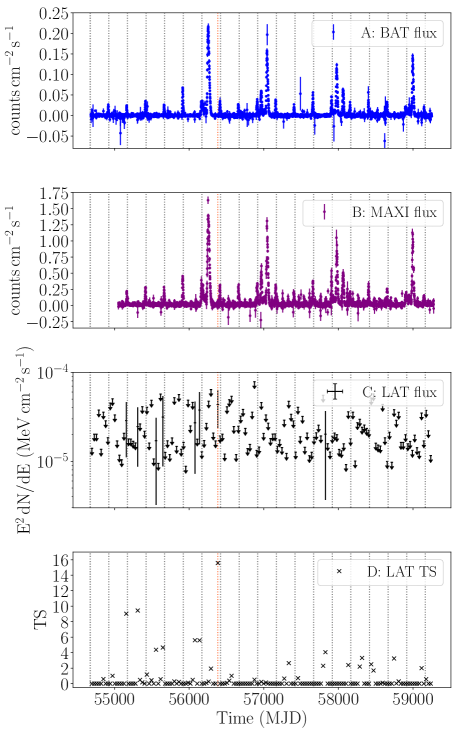
As we reject the hypothesis that PS J1014.5-5834 represents -ray emission from GRO10, we manually add a point source to our model and fit to it (after we have localised PS J1014.5-5834). We find a total TS of 7.9 over the 12.5 year observation time of this source, consistent with the TS of 7 found by Xing 19 given the increased observation time used in this work. We take a slightly different approach to Xing 19 by using monthly time bins (rather than dividing each orbit into 10 phases), so that there are approximately 8 time bins per orbit, and 149 bins in total, one per month. Figure 7 shows our Fermi-LAT light-curve together with the Swift-BAT and MAXI light-curves of this source, where four significant outbursts are seen mid-orbit, along with periodic brightening events which correspond to the periastron of GRO10’s orbit. With respect to the 3 excesses observed by Xing 19, we identify the MJD 55135 () excess to , the MJD 55559 () excess to , and the MJD 56383 () excess to , although our bins are approximately longer than those of Xing 19, and are not perfectly contemporaneous. In total, we observe one bin with approximately -ray emission, two with approximately emission and five with approximately emission, although it must be stressed that the bins are very marginal, with an approximately chance that these individually arise by coincidence, and given the 25 bins present in the light-curve, one would expect 1.25 bins to appear by chance.
Using the Fermitools algorithm GTOPHASE, we are able to assign a phase to each photon in our analysis. Whilst GTOPHASE is typically used for assigning phases to pulsars, Rasul et al. (2019) demonstrate its suitability for dealing with the orbital phases of binary systems, and presumably this is the method that Xing 19 employed, although this is not clear in the paper. In assigning the photon phases, we take the orbital ephemeris and period from Bissinger et al. (2013) and assume that the first and second derivatives of period are zero. Given that the period of the orbit is of the order of hundreds of days, we do not expect the period to change significantly over the Fermi-LAT mission time. Having assigned phases to each photon, we execute a likelihood analysis in 10 evenly-spaced phase bins to produce a phase-folded light-curve, analysing -ray emission by orbital phase in the same way as Xing 19.
Figure 8 shows the phase-folded light-curve of GRO10, alongside the flux points from the monthly-binned light-curve (Figure 7) with a phase calculated for each bin. We see that of the 10 bins across the orbit, a -ray flux is apparent in 3 of these, the 2nd (), 6th (), and 9th bins (). The latter two bins are consistent with the results of Xing 19. However, where they measured a -ray flux in the 7th bin, we find only an upper limit. The monthly bins appear to cluster into two groups, with the first being coincident in phase with the 6th phase-folded bin ( ), and the second being coincident with the 9th bin ( ). We see no monthly flux points coincident with the third phase-folded flux measurement, but given the result in this bin is marginal in significance, this is unsurprising.
Considering the flux measurements in each bin are all below , we do not claim detection of any -rays from this system. While Xing 19 establish that the most significant flux point (in the ninth phase bin) precedes periastron by a bin, the lack of detectable emission in either the first or 10th bin (immediately following and preceding periastron) casts some doubt on these being due to emission from GRO10. That said, the fact that every detectable monthly bin in the light-curve clusters around one of the two points indicates that there is likely some pattern to the apparent -ray excesses in this system, as it is unlikely666We find a chance of these two clusters occurring by chance. that these flux points would cluster by chance in phase space, were they random background fluctuations.
4.5 IGR J17544-2619
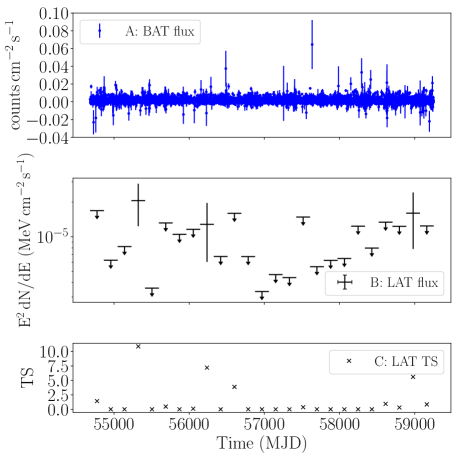
IGR J17544-2619 (henceforth IGR17) is a HMXB system and the prototypical super-fast X-ray transient consisting of a likely pulsar in an unusually short day orbit with a massive (likely O-type) donor star (Bozzo et al., 2016). Over the 12.5 year Fermi-LAT observation period, we detect a -ray excess coincident with the position of IGR17 with (), at a slight angular offset from the position of IGR17 of . Using the gta.localize algorithm, we find a best fit position for this excess of , . At this best fit position, the new angular offset from the position of IGR17 is and the TS of the excess increases slightly to 23.7.
The nearest 4FGL sources in the sky are a source of unknown type, 4FGL J1754.4-2649 (angular offset from IGR17 of , ), 4FGL J1755.4-2552 (SNR G003.7-00.2, offset: , ), and the luminous unassociated -ray source 4FGL J1753.8-2538 (, offset: ). There is no detectable variability in the 6-monthly binned light-curve (Figure 9) of the excess, with 3 bins having a TS in the range. These 3 bins do not correlate with any significant enhancements in the 6 monthly binned light-curves of the 3 closest -ray neighbours in the sky. This suggests that the -ray emission is unlikely to be due to confusion with a flare from a nearby object.
We are unable to fit a model reliably to the SED of the IGR17 coincident excess due to limited photon statistics, and are thus unable to compare the spectrum of the excess with those of nearby sources. We cannot conclusively ascribe this excess to source confusion with the brightest nearby catalogued 4FGL source, 4FGL J1753.8-2538, and we cannot associate any features of the excess with IGR17 itself. However, as 4FGL J1753.8-2538 is very luminous (), we cannot rule this out either.
4.6 IGR J19140+0951
IGR J19140+0951 (henceforth referred to as IGR19) is a HMXB with a likely neutron star accretor (Hannikainen et al., 2004) and a supergiant B star donor (Hannikainen et al. 2007 and Zand et al. 2006). Unlike most cases discussed in this paper, no persistent -ray excess is identified coincident with the position of IGR19. However, we identify 3 bins with a in the 6 monthly binned light-curve shown in Figure 10. None of these 3 bins corresponds to any significant enhancement in the X-ray waveband indicated by the Swift-BAT daily light-curve, also shown in Figure 10.
Three catalogued sources lie within a angular separation from the position of IGR19. These are 4FGL J1912.7+0957 ( and an angular offset of ), 4FGL J1914.7+1012c (, offset: ) and 4FGL J1913.3+1019 (, offset: ), confirmed to be the pulsar PSR J1913+1011. The three flux points do not correlate with any enhancements in the light-curve of any of the three closest sources, so it is unlikely that source confusion is responsible for these -ray excesses. As there is no known orbital information for IGR19 it is not possible to perform a phased analysis for this system, and the lack of a persistent -ray excess means that neither spectral analysis nor source localisation are possible. Although the small excesses at the position of IGR19 are independent of nearby sources, they are not significant enough to claim a detection, nor is there evidence to associate them with IGR19.
4.7 1A 0535+262
1A 0535+262 (henceforth 1A05) is a well-studied pulsar-Be star binary system with an orbital period of 110.3 days (Finger et al., 1996). 1A05 has been the target of previous searches for -ray emission (Acciari et al. 2011 & Lundy et al. 2021) and is well known for its giant X-ray outbursts, the most recent of which was in November 2020 (Bernardini et al. 2020 & Jaisawal et al. 2020) in addition to being a known source of non-thermal radio emission (van den Eijnden et al., 2020). We find a -ray excess at the position of 1A05 with , with the binary system itself being located roughly at the edge of the extended -ray source 4FGL J0540.3+2756e: the supernova remnant S 147, which has an extension radius of (Abdollahi et al., 2020). The centroid of S 147 is offset from 1A05 by , and S 147 has a TS of 1080. The closest nearby 4FGL sources lie within S 147, the most significant of which is the unattributed point source 4FGL J0533.9+2838 (, angular offset from 1A05 of ). Given the large (several degree) separation of the nearest -ray point sources and the position of 1A05, if source confusion is responsible for the 1A05 coincident -ray excess, the confusion is likely with S 147, which is a steady source777Supernova remnants are a non-variable class of -ray emitter, and S 147 has a variability index of 6.7 in the 4FGL-DR2 which supports the hypothesis that no variability is observed on monthly timescales..
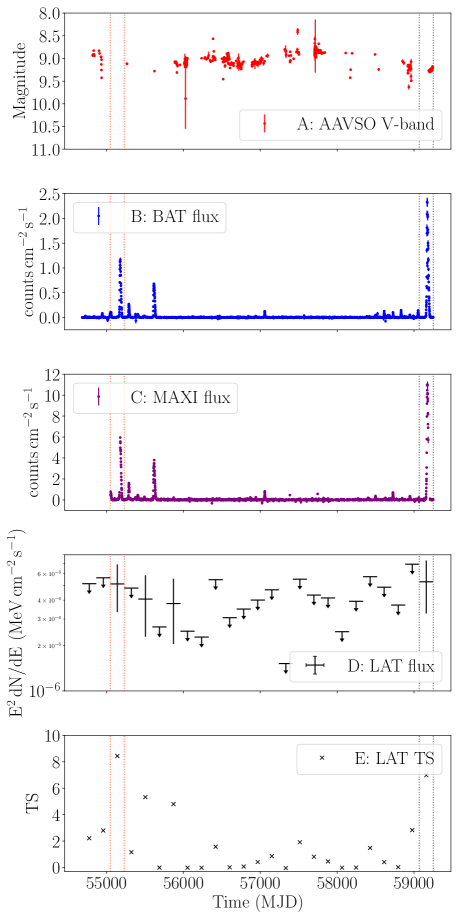
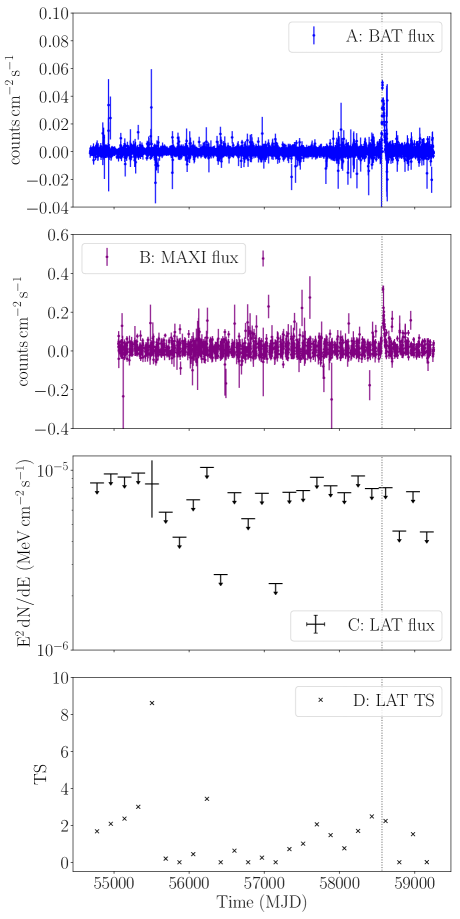
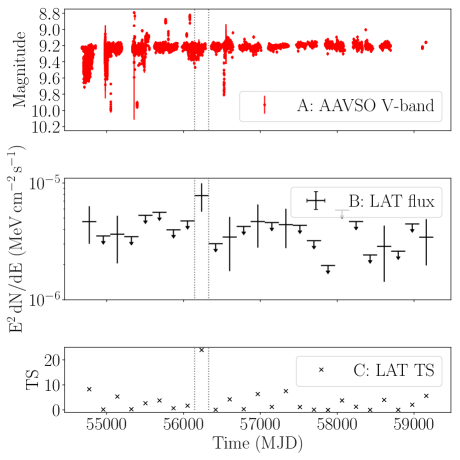
1A05’s giant Type II X-ray outbursts peak at several times the brightness of the Crab Nebula. Figure 11 shows the multi-wavelength light-curve of 1A05, with three very bright X-ray outbursts and numerous smaller outbursts seen with Swift-BAT. There is no obvious correlation between these outbursts and the AAVSO optical measurements, although these observations don’t cover the entire Fermi-LAT mission.
The two brightest outbursts occurring during the Fermi-LAT observations analysed in this work occur during December 2009, with a peak X-ray flux of , and during November 2020, with a peak X-ray flux of . We measure a -ray flux in the significance range in the 6 month bin contemporaneous with both of these outbursts, with these two bins being the most significant in the entire light-curve. In addition to these two bins, two additional -ray flux measurements are made with slightly lower significance, one of which immediately precedes the third largest observed outburst in the Swift-BAT light-curve. We observe that for the majority of our Fermi-LAT observation time (the majority of the 2010s) 1A05 appears to be in relative quiescence, and that our -ray flux points are broadly concentrated around the active periods near the December 2009 and November 2020 outbursts. Although the bins are all of low significance (and thus have limited photon statistics), and longer than the X-ray outbursts themselves, there does appear to be some correlation between the evidence for -ray emission and X-ray activity.
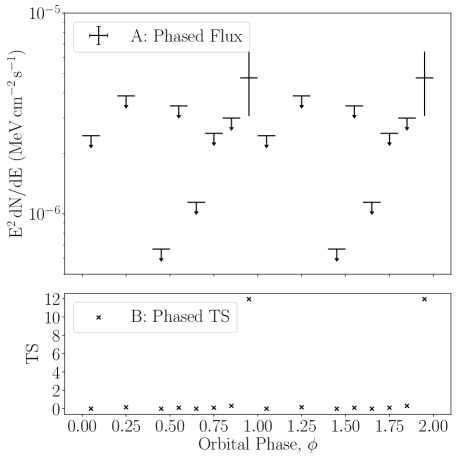
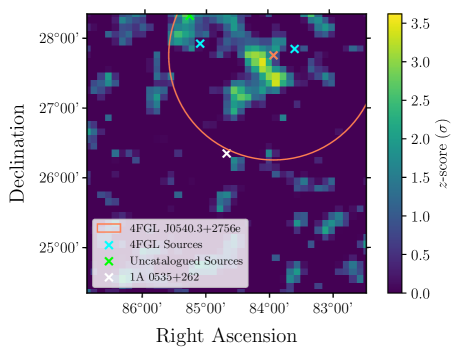
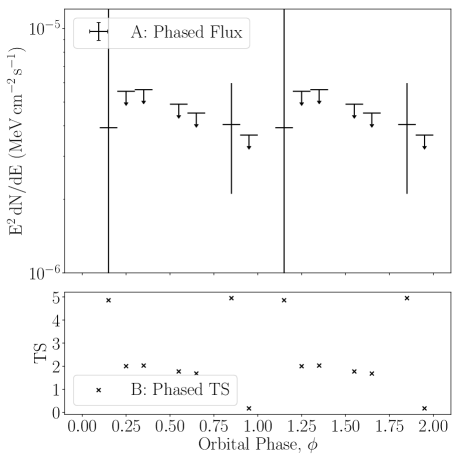
1A05 has a known orbital period of 110.3 days, which enables us to phase-fold the -ray data using GTOPHASE. Figure 12 shows the phase-folded light-curve of the excess coincident with 1A05. This shows that the only measurable -ray emission occurs in the range , immediately preceding periastron. This flux bin has a TS of approximately 12 (), which is comparable to the significance of the excess over the total Fermi-LAT observation time; a significance map for this flux bin is shown in Figure 13. All other bins have a TS of approximately 0, and in two bins it was not possible to fit a point source at the position of 1A05 at all. This indicates that essentially all of the -ray flux from the excess coincident with 1A05 is concentrated in the one phase bin preceding periastron. Whilst it is possible for a phase folded light-curve to be dominated by a short, single, significant event, Figure 11 shows that the flux is spread across several bins, each with comparable significance, so this is not the case here.
Given the 1A05 -ray excess has only a significance, we lack the photon statistics to generate an SED of the source. A combination of this with the fact that 1A05 lies on the edge of the diffuse emission of S 147 also makes positional localisation impossible. Nevertheless, the evidence (if only at the level) suggests that 1A05 could be a very faint -ray binary fueled by wind-wind interactions, or neutron star accretion. This is further supported by the fact that there are no other variable -ray sources near 1A05. Finally, the -ray flux from the mission-long light-curve of the 1A05 excess shows a weak correlation between -ray flux and X-ray activity, with measurable -ray fluxes generally corresponding to periods when 1A05 was in outburst, suggesting that neutron star accretion outbursts could be responsible for the -ray emission.
In order to reach the threshold required for a typical claim of discovery, another 12.5 years of all-sky observations would be needed with Fermi-LAT, assuming the object’s emission characteristics do not change. It is unlikely that Fermi-LAT will continue to operate for this long, but future observatories (for instance, AMEGO (McEnery et al., 2019)) which will operate in the MeV gap where the peak -ray emission of many XRBs may be located could detect the emission from 1A05 more significantly.
4.8 GRO J2058+42
GRO J2058+42 (henceforth GRO20) is a pulsar-Be star HMXB (Wilson et al., 2005) with a 55 day orbital period (Wilson et al., 2000), discovered with the Compton observatory during a Type II outburst in 1995 (Wilson et al. 1995 & Grove 1995). The most recent outburst of GRO20 was in March 2019, with triggers from both Swift-BAT (Barthelmy et al., 2019) and Fermi-GBM, and additional follow up observations from AstroSat (Mukerjee et al., 2020).
There is a small -ray excess coincident with the position of GRO20 with a TS of 16.3 (), with a single flux measurement (MJD 55414 - 55596) in the 6-month binned light-curve (Figure 14) and upper limits otherwise. This measurement is not coincident with the March 2019 X-ray enhancement, which is the only known outburst during the mission time of Fermi-LAT888The outburst in May 2008 (Krimm et al., 2008) occurred several months before the beginning of Fermi-LAT observations.. Additionally, given that the most significant bin in the light-curve of the excess reaches only , evidence for long-term variability is very weak.
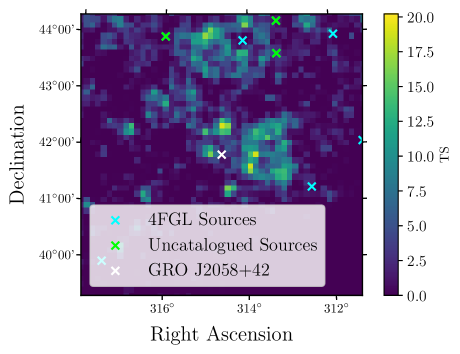
Figure 15 shows the TS map of the region around GRO20, with the HMXB located within a wider -ray excess. There are no catalogued -ray sources within the immediate vicinity of GRO20, the closest sources being 4FGL J2050.0+4114c ( and an angular offset of ) and 4FGL J2056.4+4351c (, offset ) associated with the X-ray source 1RXS J205549.4+435216. Neither of these sources displays any variability according to their variability indices in the 4FGL-DR2.
Given the low () significance of the observed excess, we cannot carry out a spectral analysis or localisation. However, we do have an orbital period and ephemeris for this system (Wilson et al., 2000) so are able to produce a phase-folded light-curve with phase steps of 0.1. Given that GRO20 is a pulsar system with a Be companion star, one might expect -ray emission to peak around periastron (), where the shocks between the pulsar wind and stellar wind are most intense, although if the neutron star is accreting during outburst it is likely that -ray emission could be fuelled by the accretion processes rather than a wind-wind interaction at periastron. Our phase folded light-curve of the GRO20 excess is shown in Figure 16.There are weak () indications of -ray emission in the phase ranges and . We conclude that there is likely no orbital modulation in the weak -ray excess we observe from the position of GRO20.
There is no evidence for any significant variability over the mission time of Fermi-LAT, nor is there evidence for any significant orbital modulation of the putative -ray flux. We conclude that there is no evidence for -ray emission from GRO20. As the immediate area around GRO20 appears to contain diffuse -ray emission, it is possible that a weak, unknown, extended source could be causing source confusion at the position of GRO20. There could also be one, or multiple, unresolved -ray point sources.
4.9 W63 X-1
W63 X-1 is a pulsar X-ray binary system, likely with a Be or OB star companion (Rho et al., 2004) and located within the W63 supernova remnant, itself located within the Cygnus X star forming region (Sabbadin, 1976). We observe a persistent -ray excess coincident with the position of W63 X-1 with (). W63 X-1 is a poorly-studied X-ray binary system; no orbital period is known and there is no recorded flux variability in any waveband.
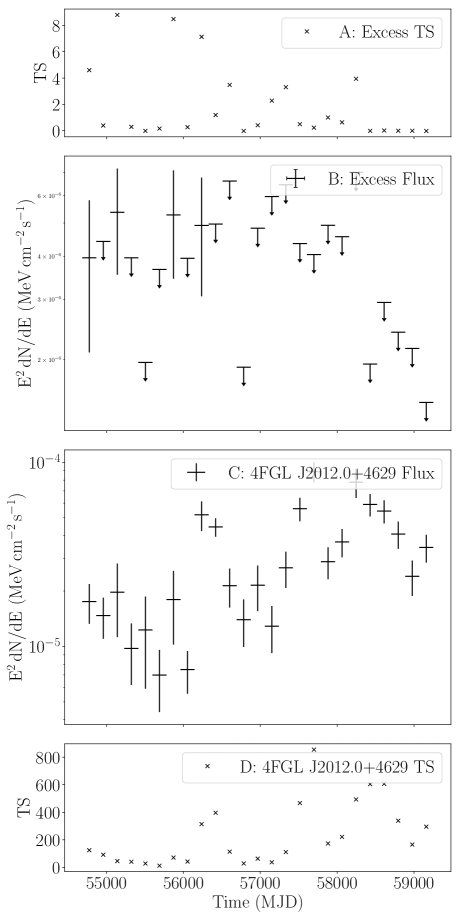
The closest -ray neighbour to the W63 X-1 excess is the highly variable BL Lac type blazar 4FGL J2012.0+4629 also known as 7C 2010+4619. We detect 4FGL J2012.0+4629 to a significance of , and with an angular offset from the position of W63 X-1 of . Although it is unlikely, given the separation between the W63 X-1 excess and the blazar, the highly variable and luminous nature of this source means we must test for source confusion, which we do by generating comparative light-curve of the blazar using the same binning scheme which we use at the binary position.
Figure 17 shows the light-curves of both the W63 X-1 coincident excess, and 4FGL J2012.0+4629. There is weak evidence () for emission from the position of W63 X-1 in 4 time bins, all spread across the first half of the Fermi-LAT mission. At this time, 4FGL J2012.0+4629 appears to be in a lower flux state before a year-long flux enhancement, the beginning of which corresponds with the last -ray bin in the light-curve of the apparent W63 X-1 excess. Confusion with the blazar is therefore unlikely to be the source of the -ray excess.
Given the marginal nature of all of the -ray flux measurements in the light-curve, the lack of measurable variability of the excess and a lack of multi-wavelength data, it is impossible to identify any correlations between wavebands. Poor photon statistics preclude spectral analysis or localisation. We cannot associate the -ray excess with W63 X-1, but nor can we exclude the possibility that the excess is caused by W63 X-1. Given that both the excess and W63 X-1 lie within the larger supernova remnant W63 itself, it is possible that the small -ray excess represents very faint -ray emission from the supernova remnant rather than the binary system.
4.10 RX J2030.5+4751
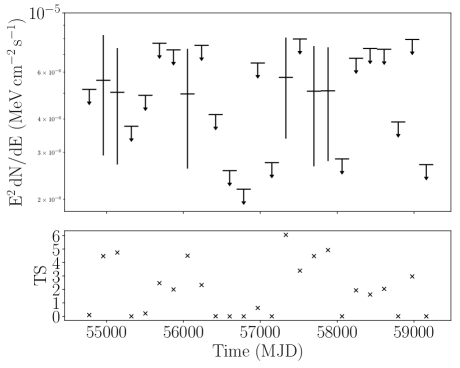
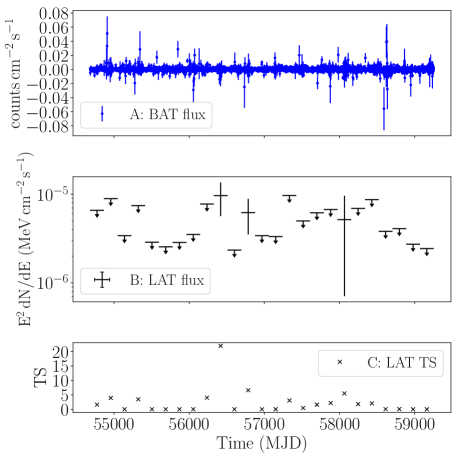
RX J2030.5+4751 (henceforth referred to as RX20) is a HMXB system consisting of a neutron star or black hole and a Be star (Belczynski & Ziolkowski, 2009). The orbital period of this system is unknown, but the 100 year optical light-curve indicates long-term variability on the timescale of decades (Servillat et al., 2013). We identify a -ray excess spatially coincident with the position of RX20 with a TS of 30.81. The 6-monthly binned light-curve of the source indicates that this excess seems to be largely dominated by one bin from MJD 56145-56328 (which reaches approximately ). A measurable flux is observed in 7 other time bins, although at a lower level and with larger uncertainties, so we place upper limits on those bins. There is no enhancement contemporaneous with this -ray enhancement in the optical AAVSO V-band. There are no X-ray light-curves for this source available from either Swift-BAT or MAXI.
The nearest -ray sources to RX20 are 4FGL J2026.0+4718 ( and an angular offset of ), 4FGL J2035.9+4901, associated with the blazar 2MASS J20355146+4901490 (, offset: ) and 4FGL J2029.5+4925, associated with the BL Lac type blazar MG4 J202932+4925 (, offset: ). In addition to these catalogued sources, we also identify a second -ray excess which we name PS J2027.4+4728 (, offset: ).
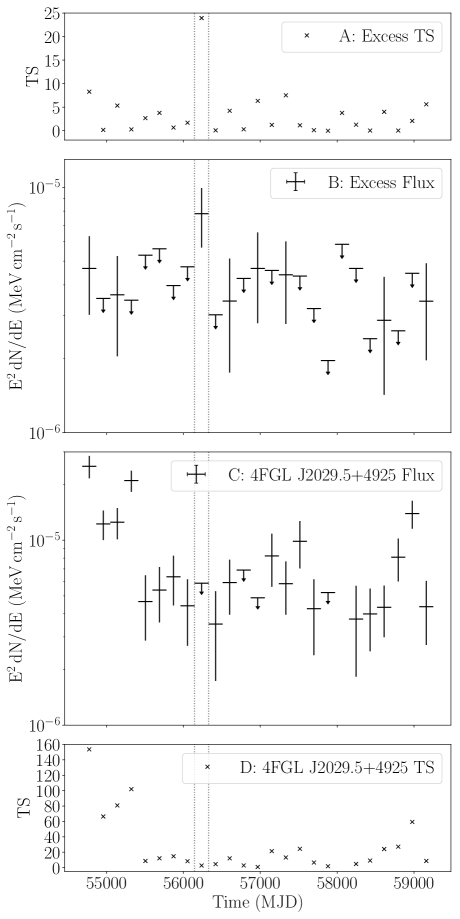
Whilst the observed excess exceeds in significance, we note that the photons almost entirely lie at just above 100 MeV, meaning any SED of the excess would not provide any meaningful observation (as a -ray flux would only be measured in one bin). We note that this is also the case during the time bin of the flare. The very soft nature of the -ray excess coincident with RX20 is somewhat problematic, as Fermi-LAT’s angular resolution in the MeV range is several degrees. Coupled with the relatively low photon count (a few thousand), this means the gta.localize algorithm is unable to properly converge in this case and we cannot unambiguously associate the excess with RX20. As two of the three nearest 4FGL sources to RX20 are blazars, which are usually variable, and the third source is of unknown nature and may also be variable, we generate light-curves of each source in order to examine whether a flare from one of these sources is causing source confusion. Whilst 4FGL J2026.0+4718 and 4FGL J2035.9+4901 are not significantly variable, the BL Lac object, 4FGL J2029.5+4925, is. Figure 19 shows the light-curve of 4FGL J2029.5+4925, and clearly shows that for approximately the first two years of the Fermi-LAT mission the blazar is in an enhanced flux state relative to the rest of the mission. However, during the time where we observe the flare coincident with RX20, there are only flux upper limits from 4FGL J2029.5+4925. Hence we are confident that the -ray excess observed at the position of RX20 is independent of nearby 4FGL -ray sources.
The orbital period and the nature of the accretor in RX20 are unknown, and the system is not a known microquasar which makes -ray emission from a jet unlikely. Given that most Be star HMXBs have a neutron star accretor (Belczynski & Ziolkowski, 2009), it is likely that this is also the case for RX20, and it is possible that the soft -ray flare we observe coincident with RX20 is representative of either a wind driven interaction at the periastron of the system, as observed in the known -ray binary population, or a neutron star accretion outburst. However, without X-ray data for this time we cannot be certain.
4.11 4U 2206+543
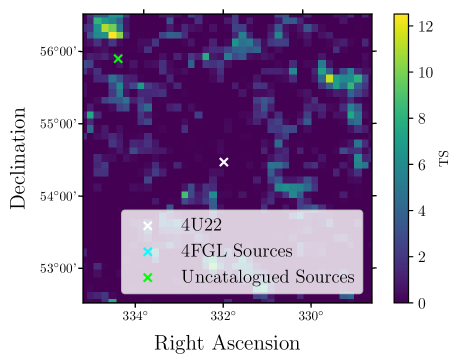
4U 2206+543 (henceforth 4U22) is a HMXB system with a Be star companion, a pulsar accretor (Negueruela & Schurch 2007, Finger et al. 2009 & Wang 2013) and a 9.57 day orbital period. We find a -ray excess coincident with the position of 4U22 with a TS of 30.53. With a Galactic latitude of , 4U22 is on the Galactic plane; however, it is relatively isolated from other -ray point sources. The nearest catalogued source is the pulsar 4FGL J2215.6+5135 (PSR J2215+5135), with a TS of 1940 and an angular offset from the position of 4U22 of . This is a highly significant source, but given the separation between the pulsar and the position of 4U22, it is unlikely that source confusion explains the excess at 4U22’s position. We also identify 4 uncatalogued, sub-threshold -ray excesses between and angular offset from 4U22; these are also unlikely to cause source confusion with 4U22 given that they are all less significant than the excess coincident with 4U22, and are from 4U22.
Similar to RX20 (Section 4.10), 4U22’s spectrum is extremely soft with the entirety of the -ray flux being concentrated at just above 100 MeV, making any meaningful spectral analysis impossible for this source. Given the very soft nature of this apparent excess, the localisation fit fails and as shown in the TS map (Figure 20) there is no visually obvious excess centered on the position of 4U22.
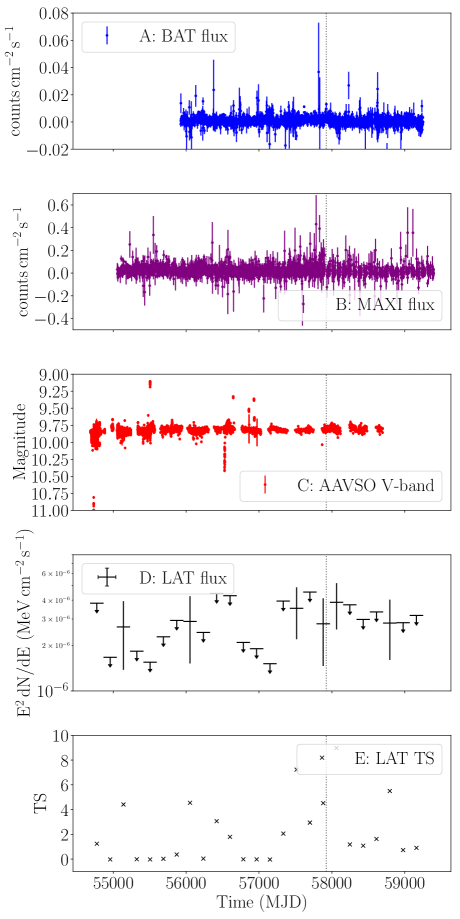
Figure 21 shows the multi-wavelength light-curve of 4U22, with daily X-ray data from both MAXI and Swift-BAT, optical AAVSO V-band photometry and the 6-month binned Fermi-LAT energy flux and associated TS of the spatially coincident excess. The -ray flux of the excess coincident with the position of 4U22 is generally consistent for the bins where a measurement is made, and the upper limits consistent otherwise. The statistical significance of all bins is relatively low, with a maximum measured TS of approximately 9 (3). Due to the short orbital period of 4U22, we cannot identify any regular Type I X-ray outbursts, nor it is possible to identify orbital periodicity from the Fermi-LAT data.
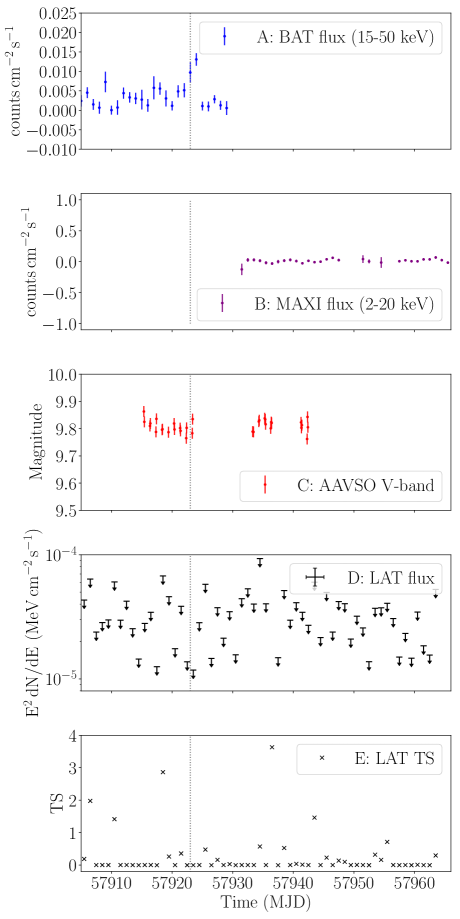
An enhancement of emission between 20 and 100 keV was observed from 4U22 in June 2017 with INTEGRAL (Di Gesu et al., 2017), together with a small enhancement we observe in the Swift-BAT data. No MAXI data are available during the INTEGRAL observation period. There is a measurable -ray flux in the 6-month bin coincident with the 2017 enhancement (denoted by the grey vertical line in Figure 21), but such a flux is not unique to this time. As the hard X-ray/soft -ray enhancement lasted only days, we also generate a daily -ray light-curve to establish whether any -ray emission exists on the timescale of this enhancement. This light-curve is shown in Figure 22. No significant -ray emission is detected on daily timescales during June and July 2017, with only upper limits measured. We conclude that the enhancement reported by Di Gesu et al. (2017) produced no measurable, contemporaneous, high-energy -ray flux.
A lack of variability from the excess coincident with the position of 4U22 and a lack of information regarding the true position of this very soft excess (which has a PSF of ) makes it impossible to associate this excess with 4U22. Given the soft nature of this excess, it is possible that this apparent source is a product of excess very soft photons from the Galactic plane itself, which is very difficult to model, rather than a genuine signature of -ray emission from a HMXB. This hypothesis is further supported by the apparent lack of any point source excess shown in the TS map (Figure 20), coincident with the position of 4U22, despite a point source being fitted to this position.
4.12 IGR J00370+6122
IGR J00370+6122 (den Hartog et al., 2004) (henceforth IGR00) is an X-ray binary system with a pulsar accretor (in’t Zand et al., 2007) and a B1Ib class companion star (Negueruela & Reig, 2004) with an orbital period of 15.7 days (Grunhut et al., 2014). There is a very marginal persistent -ray excess coincident with the position of IGR00, with a (), however in the six monthly binned light-curve we see evidence for emission at () in one of the bins (MJD 56328-56511), and }see weak () evidence for emission in two other bins (MJD 56693 - 56876 and MJD 58155 - 58338). This suggests that there may be transient -ray emission at IGR00’s position. The -ray light-curve of the excess and the IGR00 X-ray light-curve are shown in Figure 23. There is no apparent correlation between the X-ray light-curve of IGR00 and the -ray light-curve of the excess.
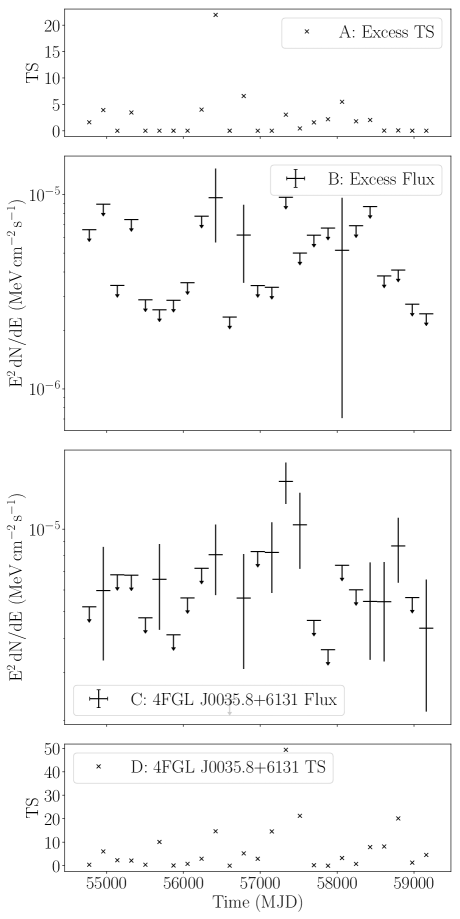
There is a variable blazar 4FGL J0035.8+6131 (also known as LQAC 008+061, at an angular offset of ) close to the position of IGR00. Given the small angular offset between the blazar and position of IGR00, it is likely that source confusion is responsible for the excess, rather than it being a genuine signature of -ray emission from a HMXB. We generate a light-curve of 4FGL J0035.8+6131 using the same 6-month binning scheme used for the light-curve of the excess (Figure 23), which is compared with that of the excess coincident with IGR00 in Figure 24. Where we see apparent emission in the excess light-curve, a similar flux is observed in the light-curve of the blazar. Furthermore, the two proceeding bins (an upper limit and a flux measurement) are also similar in value to those of the blazar. A third, lower significance, flux measurement is observed later in the light-curve of the IGR00 excess where only an upper limit is observed from the blazar. This is likely a chance fluctuation.
The light-curve alone suggests that source confusion is likely the cause of the excess at the position of IGR00. Nonetheless, we reanalyse the ROI using the same parameters as described in Table 1 over the time range of the most significant -ray bin in Figure 23 (MJD 56328 - MJD 56510). Following this reanalysis, we add a point source to the position of IGR00, and perform a localisation fit in order to optimise the positional fit of the excess.

Figure 25 shows the position of the blazar, 4FGL J0035.8+6131, together with the position of IGR00 and the positional uncertainty of the localised excess. As both the position of the blazar and the binary lie within the 95% uncertainty bound, it is impossible to determine which of these is the cause of the excess, or indeed if there is an unresolved source causing it. Therefore we conclude that this -ray excess is unlikely to represent -ray emission from IGR00.
4.13 Confirmed False Positives
Of the 20 binaries where we detect either a persistent or transient -ray excess, we determine that 8 of these have significant evidence which suggest that this is a false positive result. Discussions of each of these false positive excesses are included in Appendix B. The binaries with confirmed false positive results are: IGR J16320-4751, IGR J16358-4726, IGR J16465-4507, 1WGA J0648.0-4419, AX J1740.1-2847, H 1833-076, GS 1839-04 and SAX J2103.5+4545.
The false positives can be broken down into two categories; the first is where we see a significant excess which appears to be coincident with the position of the HMXB in question. Given the significant photon statistics available, we perform a localisation of this excess, and upon examining the new positional fit find that the excess is no longer spatially coincident with the position of the binary, greatly decreasing the likelihood of association between the -ray excess and the HMXB. The second group of false positive excesses are those which are definitively due to source confusion with another source. In this case, this excess cannot be proven to be independent, and therefore cannot be associated with the HMXB in question.
5 Conclusions
We survey the positions of 114 high mass X-ray binaries using Fermi-LAT, searching for -ray emission in the MeV-GeV energy range. Our survey includes 4 known -ray emitting X-ray binaries, LS 5039, Cygnus X-1, Cygnus X-3 and LS I +61 303. These are all detected more significantly than in the most recent Fermi-LAT point source catalogue, the 4FGL-DR2.
We employ a binned likelihood method, using the Fermipy and Fermitools software together with the catalogues of Liu et al. 2006 in order to carry out our survey, where we test for both persistent -ray emission, and transient -ray emission using a 6 month binning scheme. Where a -ray excess is identified a more detailed analysis is performed. We identify some evidence for -ray emission from the positions of 20 HMXBs where no previous emission has been observed. The significances of the -ray excesses observed varied considerably: from over 12.5 years of observations in the case of IGR J16358-4726, to almost in a single 6-month bin in the case of SAX J2103.5+4545, without any evidence for persistent emission.
5.1 Persistent Emission
Many cases where an excess is observed are likely to be false positives, where a detailed analysis establishes that the excess at the position of the binary is likely to be caused by something else. In particular, in the case of 4 HMXBs with a coincident excess (IGR J16358-4726, H 1833-076, GS 1839-04 and SAX J2103.5+4545), localisation of this excess caused its best fit position to move, rendering the excess no longer spatially coincident with the position of the HMXB.
Given the PSF of the LAT instrument, it is possible for photon contamination to occur between sources within of each other, particularly at lower photon energies. Such source confusion is especially prevalent on the Galactic plane. We establish that false positive -ray excesses due to source confusion occur in 4 of 20 cases. These are IGR J16320-4751, 1WGA J0648.0-4419, AX J1740.1-2847 and IGR J00370+6122. Additionally, we suspect that source confusion is also responsible for the excesses observed coincident with IGR J16465-4507 and IGR J17544-2619, although further evidence is needed to establish whether this is the case. Finally, in the case of 4U 2206+543 we observe a very soft, isolated excess which displays no variability and which cannot be associated with the binary itself. In this particular case (given that there are no nearby point sources) the excess may be caused by source confusion with the Galactic -ray background.
In the case of 5 of the excesses, there is a lack of evidence to associate the excess to the binary itself, yet it remains spatially coincident when localised (if photon statistics enable localisation) and there is no evidence for source confusion. In these cases, the -ray excess may represent -ray emission from the binary. However, further evidence is needed, particularly evidence of time-variability, which may be associated with orbital phase. Systems where there is a lack of evidence to determine whether the excess is caused by the binary are 1H 0749-600, 1H 1238-599, IGR J19140+0951, GRO J2058+42, W63 X-1 and also 4U 2206+543, although as noted above, source confusion with the Galactic background may be a factor here.
5.2 Transient Emission
In 2 of the systems, SAX J1324.4-6200 (SAX13) and RX J2030.5+4751 (RX20), we see evidence for transient -ray emission across timescales of months that cannot be attributed to the -ray background or any known source. In the case of RX20, there is roughly evidence for emission in a 6-month time bin, and furthermore a persistent -ray excess of . We rule out source confusion as the cause of this excess, and the variability seen in the light-curve suggests that the excess observed comes from a genuine point source of -rays. Given that the orbit of this system is unknown, the nature of the light-curve and companion star suggests that this system could be a long-orbit -ray binary with the light-curve enhancement caused by the periastron of a likely neutron star and the Be companion star.
In the case of SAX13, we observe a -ray excess which is visible over a continuous 18 month period. This excess is not caused by source confusion with any known source, and localizing the emission reveals that it is consistent with the position of SAX13; it has a power-law spectrum with , which is broadly consistent with the spectral indices of other power-law HMXBs. Given that SAX13 is likely a pulsar-Be star system, and has an unknown orbital period, it is entirely possible that this excess represents -ray emission from around the time of the binary’s periastron, which would make SAX13 a -ray binary with a long orbital period. Further, long-term, study and monitoring of this system in both the X-ray and -ray wavebands are needed to test this hypothesis.
In the final 2 systems, GRO J1008-57 and 1A 0535+262 there is tentative evidence for -ray emission which varies by orbital phase. With GRO10, we see a flux measurement in the MJD 58886 - 59069 bin where , and a less significant bin immediately after apastron. A previous study Xing & Wang 2019 suggested that this represents tentative evidence of orbital modulation and that the -ray excess is caused by GRO10. While we find evidence for some modulation with the orbital phase of GRO10, the lack of any measurable -ray emission in the range makes it harder to reconcile this with a wind-wind collision emission model, where GeV -ray emission would be expected to occur at periastron, although emission peaks are seen at times other than periastron in LSI +61 303.
The case of 1A 0535+262 presents the strongest evidence for new -ray emission from a HMXB from our survey. 1A 0535+262 is a pulsar-Be star system, and not a known microquasar, hence any -ray activity would be expected to originate from either wind-wind interactions or, given that 1A05 is strongly accreting during outburst, a novel accretion related method. We observe a marginal persistent excess coincident with 1A05 with (), and find evidence that -ray activity may be coincident with the giant X-ray flares the system undergoes from time-to-time. The ‘smoking gun’ for the -ray excess originating from this binary is that all of the -ray flux is concentrated in the phase bin immediately preceding periastron, with a measurement in this bin, and in all other phase bins. This suggests that the sustained -ray excess we observe across the 12.5 year dataset is all occurring at periastron. The chances of another undiscovered system with this exact periodic behaviour being within the source confusion radius of 1A05 is exceptionally small. Therefore, whilst the significance of the persistent flux is only , we are reasonably confident that this represents a sub-threshold hint of -ray emission from 1A05.
5.3 Summary
Eight HMXBs have confirmed -ray emission and are listed in the 4FGL-DR2, with several other HMXBs being confirmed as -ray emitters but not included in the 4FGL-DR2. In this paper we identify a promising hint of emission from 1A 0535+262, tentative evidence of -ray excesses from a further 3 HMXBs (SAX J1324.4-6200, GRO J1008-57 and RX J2030.5+4545) and excesses coincident with 5 HMXBs (1H 0749-600, 1H 1238-599, IGR J19140+0951, GRO J2058+42, and W63 X-1), although there is a lack of evidence to establish these 5 -ray excesses as being products of processes occurring in their respective binary systems. Where we are able to produce spectra of these excesses, all appear to be soft, with a spectrum likely reaching a maximum below the Fermi-LAT energy range. This makes these HMXBs ideal targets for instruments with lower energy (i.e. covering the MeV gap), for example the forthcoming mission AMEGO (McEnery et al., 2019). Furthermore, if these excesses represent the dip between the synchrotron and inverse Compton peaks, then these binaries may be detected by instruments with a higher energy detection threshold in the GeV - TeV energy range.
Acknowledgements
The authors would like to acknowledge the excellent data and analysis tools provided by the NASA Fermi collaboration, without which this work could not be done. In addition, this work has made use of the SIMBAD database, operated at CDS, Strasbourg, France. We would like to thank Matthew Capewell for useful discussions, and the anonymous referee for timely and constructive advice.
MH acknowledges funding from Science and Technology Facilities Council (STFC) PhD Studentship ST/S505365/1, and PMC and CBR acknowledge funding from STFC consolidated grant ST/P000541/1.
Data Accessibility
The Fermi-LAT data are all publicly accessible at the NASA LAT data server, located at https://fermi.gsfc.nasa.gov/ssc/data/access/ . For our LAT data analysis we use Fermitools v1.2.23 available at https://fermi.gsfc.nasa.gov/ssc/data/analysis/software/ and Python 2.7 package Fermipy v0.19.0 available at https://fermipy.readthedocs.io/en/latest/install.html . We use the pre-computed Swift-BAT daily light-curves available here https://swift.gsfc.nasa.gov/results/transients/ and the AAVSO photometry data available here https://www.aavso.org/data-download . The MAXI data are located at http://maxi.riken.jp/top/lc.html .
References
- Abdo et al. (2009a) Abdo A. A., et al., 2009a, The Astrophysical Journal, 706, L56
- Abdo et al. (2009b) Abdo A. A., et al., 2009b, The Astrophysical Journal, 707, 55
- Abdo et al. (2010) Abdo A. A., et al., 2010, The Astrophysical Journal, 723, 649
- Abdollahi et al. (2020) Abdollahi S., et al., 2020, The Astrophysical Journal Supplement Series, 247, 33
- Acciari et al. (2011) Acciari V. A., et al., 2011, The Astrophysical Journal, 733, 96
- Acero et al. (2016) Acero F., et al., 2016, The Astrophysical Journal Supplement Series, 223, 26
- Aharonian et al. (2005) Aharonian F., et al., 2005, Astronomy and Astrophysics, 442, 1
- Aharonian et al. (2006) Aharonian F., et al., 2006, The Astrophysical Journal, 636, 777
- Aharonian et al. (2007) Aharonian F. A., et al., 2007, Astronomy and Astrophysics, 469, L1
- Amato (2014) Amato E., 2014, International Journal of Modern Physics: Conference Series, 28
- Amato (2020) Amato E., 2020, arXiv e-prints, 2001, arXiv:2001.04442
- Angelini et al. (1998) Angelini L., Church M. J., Parmar A. N., Balucinska-Church M., Mineo T., 1998, Astronomy and Astrophysics, 339, L41
- Apparao (1994) Apparao K. M. V., 1994, Space Science Reviews, 69, 255
- Araudo et al. (2009) Araudo A. T., Bosch-Ramon V., Romero G. E., 2009, Astronomy and Astrophysics, 503, 673
- Atwood et al. (2009) Atwood W. B., et al., 2009, The Astrophysical Journal, 697, 1071
- Ballet et al. (2020) Ballet J., Burnett T. H., Digel S. W., Lott B., 2020, arXiv:2005.11208 [astro-ph]
- Barthelmy et al. (2019) Barthelmy S. D., Evans P. A., Gropp J. D., Kennea J. A., Klingler N. J., Lien A. Y., Sbarufatti B., 2019, GRB Coordinates Network, 23985, 1
- Baykal et al. (2000) Baykal A., Stark M. J., Swank J., 2000, The Astrophysical Journal, 544, L129
- Belczynski & Ziolkowski (2009) Belczynski K., Ziolkowski J., 2009, The Astrophysical Journal, 707, 870
- Bernardini et al. (2020) Bernardini M. G., D’Avanzo P., Klingler N. J., Page K. L., Sbarrato T., Tohuvavohu A., Neil Gehrels Swift Observatory Team 2020, GRB Coordinates Network, 28919, 1
- Biretta et al. (1999) Biretta J. A., Sparks W. B., Macchetto F., 1999, The Astrophysical Journal, 520, 621
- Bissinger et al. (2013) Bissinger M., et al., 2013. p. 017, doi:10.22323/1.176.0017
- Blay et al. (2006) Blay P., Camero A., Martínez-Núñez S., Reig P., Negueruela I., 2006, Conference Name: The X-ray Universe 2005, 604, 243
- Bodaghee et al. (2012) Bodaghee A., Rahoui F., Tomsick J., Rodriguez J., 2012, Astrophysical Journal, 751
- Bodaghee et al. (2013) Bodaghee A., Tomsick J. A., Pottschmidt K., Rodriguez J., Wilms J., Pooley G. G., 2013, The Astrophysical Journal, 775, 98
- Bordas et al. (2015) Bordas P., Yang R., Kafexhiu E., Aharonian F., 2015, The Astrophysical Journal, 807, L8
- Bozzo et al. (2016) Bozzo E., et al., 2016, Astronomy & Astrophysics, 596, A16
- Casares et al. (2016) Casares J., Jonker P. G., Israelian G., 2016, in Alsabti A. W., Murdin P., eds, , Handbook of Supernovae. Springer International Publishing, Cham, pp 1–28, doi:10.1007/978-3-319-20794-0_111-1, https://doi.org/10.1007/978-3-319-20794-0_111-1
- Chang et al. (2018) Chang Z., Zhang S., Chen Y.-P., Ji L., Kong L.-D., Liu C.-Z., 2018, Research in Astronomy and Astrophysics, 18, 152
- Chaty et al. (2008) Chaty S., Rahoui F., Foellmi C., Tomsick J. A., Rodriguez J., Walter R., 2008, Astronomy and Astrophysics, 484, 783
- Chernyakova & Malyshev (2020) Chernyakova M., Malyshev D., 2020, in Proceedings of Science. Palemero, Italy, doi:https://doi.org/10.22323/1.362.0045, http://arxiv.org/abs/2006.03615
- Corbel (2010) Corbel S., 2010, Proceedings of the International Astronomical Union, 6, 205
- Corbel et al. (2012) Corbel S., et al., 2012, Monthly Notices of the Royal Astronomical Society, 421, 2947
- Corbet et al. (2011) Corbet R. H. D., et al., 2011, The Astronomer’s Telegram, 3221
- Corbet et al. (2016) Corbet R. H. D., et al., 2016, The Astrophysical Journal, 829, 105
- Corbet et al. (2019) Corbet R. H. D., et al., 2019, The Astrophysical Journal, 884, 93
- Di Gesu et al. (2017) Di Gesu L., Diehl R., Sanchez-Fernandez C., Watanabe K., Ferrigno C., 2017, The Astronomer’s Telegram, 10519, 1
- Dubus (2006) Dubus G., 2006, Astronomy & Astrophysics, 456, 801
- Dubus (2013) Dubus G., 2013, The Astronomy and Astrophysics Review, 21, 64
- Dubus (2015) Dubus G., 2015, arXiv:1507.00935 [astro-ph]
- Ducci et al. (2019) Ducci L., et al., 2019, The Astronomer’s Telegram, 12812, 1
- Fabian & Rees (1979) Fabian A. C., Rees M. J., 1979, Monthly Notices of the Royal Astronomical Society, 187, 13P
- Fabrika (2004) Fabrika S., 2004, Astrophysics and Space Physics Reviews, 12, 1
- Fender et al. (2004) Fender R. P., Belloni T. M., Gallo E., 2004, Monthly Notices of the Royal Astronomical Society, 355, 1105
- Finger et al. (1996) Finger M. H., Wilson R. B., Harmon B. A., 1996, The Astrophysical Journal, 459, 288
- Finger et al. (2009) Finger M., Ikhsanov N., Wilson-Hodge C., Patel S., 2009, ApJ, 709
- Franckowiak et al. (2018) Franckowiak A., Jean P., Wood M., Cheung C. C., Buson S., 2018, Astronomy & Astrophysics, 609, A120
- Garcia et al. (2018) Garcia F., Fogantini F. A., Chaty S., Combi J. A., 2018, Astronomy & Astrophysics, 618, A61
- Gotthelf & Vasisht (1997) Gotthelf E. V., Vasisht G., 1997, The Astrophysical Journal, 486, L133
- Grove (1995) Grove J. E., 1995, International Astronomical Union Circular, 6239, 2
- Grunhut et al. (2014) Grunhut J. H., Bolton C. T., McSwain M. V., 2014, Astronomy & Astrophysics, Volume 563, id.A1, <NUMPAGES>8</NUMPAGES> pp., 563, A1
- Hadasch et al. (2012) Hadasch D., et al., 2012, The Astrophysical Journal, 749, 54
- Hannikainen et al. (2004) Hannikainen D. C., Rodriguez J., Cabanac C., Schultz J., Lund N., Vilhu O., Petrucci P. O., Henri G., 2004, Astronomy & Astrophysics, 423, L17
- Hannikainen et al. (2007) Hannikainen D. C., Rawlings M. G., Muhli P., Vilhu O., Schultz J., Rodriguez J., 2007, Monthly Notices of the Royal Astronomical Society, 380, 665
- Harvey et al. (2021) Harvey M., Rulten C. B., Chadwick P. M., 2021, Monthly Notices of the Royal Astronomical Society, 506, 6029
- Hinton et al. (2009) Hinton J. A., et al., 2009, The Astrophysical Journal Letters, 690, L101
- Huckle et al. (1977) Huckle H. E., Mason K. O., White N. E., Sanford P. W., Maraschi L., Tarenghi M., Tapia S., 1977, Monthly Notices of the Royal Astronomical Society, 180, 21P
- Hulleman et al. (1998) Hulleman F., in ’t Zand J. J. M., Heise J., 1998, Astronomy and Astrophysics, v.337, p.L25-L28 (1998), 337, L25
- Israel et al. (2009) Israel G., Stella L., Angelini L., White N., Kallman R., Giommi P., Treves A., 2009, The Astrophysical Journal Letters, 474, L53
- Jaisawal et al. (2020) Jaisawal G. K., et al., 2020, The Astronomer’s Telegram, 14179, 1
- Kaplan et al. (2007) Kaplan D. L., Levine A. M., Chakrabarty D., Morgan E. H., Erb D. K., Gaensler B. M., Moon D.-S., Cameron P. B., 2007, The Astrophysical Journal, 661, 437
- Kaur et al. (2009) Kaur R., Wijnands R., Patruno A., Testa V., Israel G., Degenaar N., Paul B., Kumar B., 2009, Monthly Notices of the Royal Astronomical Society, 394, 1597
- Kaur et al. (2010) Kaur R., Wijnands R., Paul B., Patruno A., Degenaar N., 2010, Monthly Notices of the Royal Astronomical Society, 402, 2388
- Kretschmar et al. (2019) Kretschmar P., et al., 2019, New Astronomy Reviews, 86, 101546
- Krimm et al. (2008) Krimm H. A., et al., 2008, The Astronomer’s Telegram, 1516, 1
- Kupfer et al. (2020) Kupfer T., et al., 2020, The Astrophysical Journal, 891, 45
- Kühnel et al. (2013) Kühnel M., et al., 2013, Astronomy & Astrophysics, 555, A95
- La Parola et al. (2010) La Parola V., Cusumano G., Romano P., Segreto A., Vercellone S., Chincarini G., 2010, Monthly Notices of the Royal Astronomical Society, 405, L66
- Lamb & Macomb (1997) Lamb R. C., Macomb D. J., 1997, The Astrophysical Journal, 488, 872
- Li et al. (2020) Li J., Torres D. F., Liu R.-Y., Kerr M., Wilhelmi E. d. O., Su Y., 2020, Nature Astronomy, pp 1–8
- Liu et al. (2006) Liu Q. Z., van Paradijs J., van den Heuvel E. P. J., 2006, Astronomy and Astrophysics, 455, 1165
- Liu et al. (2007) Liu Q. Z., van Paradijs J., van den Heuvel E. P. J., 2007, Astronomy and Astrophysics, 469, 807
- Lundy et al. (2021) Lundy M., et al., 2021, in Proceedings of 37th International Cosmic Ray Conference — PoS(ICRC2021). Sissa Medialab, Berlin, Germany - Online, p. 856, doi:10.22323/1.395.0856, https://pos.sissa.it/395/856
- Lutovinov et al. (2004) Lutovinov A., Rodrigues J., Budtz-Jorgensen C., Grebenev S., Winkler C., 2004, The Astronomer’s Telegram, 329
- Lutovinov et al. (2005) Lutovinov A., Rodriguez J., Revnivtsev M., Shtykovskiy P., 2005, Astronomy and Astrophysics, 433, L41
- Makino & GINGA Team (1988) Makino F., GINGA Team 1988, International Astronomical Union Circular, 4679, 2
- Martí-Devesa et al. (2020) Martí-Devesa G., Reimer O., Li J., Torres D. F., 2020, Astronomy & Astrophysics, 635, A141
- Massi et al. (2020) Massi M., et al., 2020, Monthly Notices of the Royal Astronomical Society, 498, 3592
- Mattox et al. (1996) Mattox J. R., et al., 1996, The Astrophysical Journal, 461, 396
- McEnery et al. (2019) McEnery J., et al., 2019, arXiv:1907.07558 [astro-ph]
- Mereghetti et al. (2008) Mereghetti S., Romano P., Sidoli L., 2008, Astronomy & Astrophysics, 483, 249
- Mirabel (2012) Mirabel I. F., 2012, Science, 335, 175
- Mirabel & Rodriguez (1994) Mirabel I. F., Rodriguez L. F., 1994, Nature, 371, 46
- Morris et al. (2017) Morris P. J., Cotter G., Brown A. M., Chadwick P. M., 2017, Monthly Notices of the Royal Astronomical Society, 465, 1218
- Mukerjee et al. (2020) Mukerjee K., Antia H. M., Katoch T., 2020, The Astrophysical Journal, 897, 73
- Nakajima et al. (2020a) Nakajima M., et al., 2020a, The Astronomer’s Telegram, 3544
- Nakajima et al. (2020b) Nakajima M., et al., 2020b, The Astronomer’s Telegram, 3750
- Negueruela & Reig (2004) Negueruela I., Reig P., 2004, The Astronomer’s Telegram, 285, 1
- Negueruela & Schurch (2007) Negueruela I., Schurch M. P. E., 2007, Astronomy and Astrophysics, 461, 631
- Nespoli et al. (2010) Nespoli E., Fabregat J., Mennickent R. E., 2010, Astronomy & Astrophysics, 516, A94
- Orellana et al. (2007) Orellana M., Bordas P., Bosch-Ramon V., Romero G. E., Paredes J. M., 2007, Astronomy and Astrophysics, 476, 9
- Paczyński (1971) Paczyński B., 1971, Annual Review of Astronomy and Astrophysics, 9, 183
- Paredes & Bordas (2019) Paredes J. M., Bordas P., 2019, arXiv:1902.09898 [astro-ph]
- Paredes et al. (2000) Paredes J. M., Martí J., Ribó M., Massi M., 2000, Science, 288, 2340
- Petre & Gehrels (1993) Petre R., Gehrels N., 1993, International Astronomical Union Circular, 5877, 3
- Pshirkov (2016) Pshirkov M. S., 2016, Monthly Notices of the Royal Astronomical Society: Letters, 457, L99
- Rahoui et al. (2008) Rahoui F., Chaty S., Lagage P.-O., Pantin E., 2008, Astronomy and Astrophysics, 484, 801
- Rasul et al. (2019) Rasul K., Chadwick P. M., Graham J. A., Brown A. M., 2019, Monthly Notices of the Royal Astronomical Society, 485, 2970
- Reig (2011) Reig P., 2011, Astrophysics and Space Science, 332, 1
- Reig et al. (2005) Reig P., Negueruela I., Papamastorakis G., Manousakis A., Kougentakis T., 2005, Astronomy and Astrophysics, Volume 440, Issue 2, September III 2005, pp.637-646, 440, 637
- Revnivtsev et al. (2003) Revnivtsev M., Lutovinov A., Ebisawa K., 2003, The Astronomer’s Telegram, 131
- Rho et al. (2004) Rho J., Moon D. S., Gotthelf E., Pannuti T., Corbet R., 2004, AAS/High Energy Astrophysics Division, 8, 17.30
- Rodriguez et al. (2003) Rodriguez J., Tomsick J. A., Foschini L., Walter R., Goldwurm A., Corbel S., Kaaret P., 2003, Astronomy & Astrophysics, 407, L41
- Romano et al. (2014) Romano P., et al., 2014, Astronomy & Astrophysics, 562, A2
- Sabbadin (1976) Sabbadin F., 1976, Journal of the Royal Astronomical Society of Canada, 89, 175
- Sakano et al. (2000) Sakano M., Torii K., Koyama K., Maeda Y., Yamauchi S., 2000, Publications of the Astronomical Society of Japan, 52
- Servillat et al. (2013) Servillat M., Tang S., Grindlay J., Los E., 2013, Proceedings of Science
- Torres et al. (2011) Torres D. F., Rea N., Esposito P., Li J., Chen Y., Zhang S., 2011, The Astrophysical Journal, 744, 106
- Tout & Hall (1991) Tout C. A., Hall D. S., 1991, Monthly Notices of the Royal Astronomical Society, 253, 9
- Turland & Scheuer (1975) Turland B. D., Scheuer P. a. G., 1975, Monthly Notices of the Royal Astronomical Society, 170, 281
- Van Paradijs & Van der Klis (2001) Van Paradijs J., Van der Klis M., 2001, in Bleeker J. A. M., Geiss J., Huber M. C. E., eds, , The Century of Space Science. Springer Netherlands, Dordrecht, pp 811–822, doi:10.1007/978-94-010-0320-9_34, https://doi.org/10.1007/978-94-010-0320-9_34
- Verbunt (1993) Verbunt F., 1993, Annual Review of Astronomy and Astrophysics, 31, 93
- Walker et al. (2016) Walker R., Hardee P., Davies F., Ly C., Junor W., Mertens F., Lobanov A., 2016, Galaxies, 4, 46
- Walter et al. (2015) Walter R., Lutovinov A. A., Bozzo E., Tsygankov S. S., 2015, The Astronomy and Astrophysics Review, 23, 2
- Wang (2013) Wang W., 2013, Monthly Notices of the Royal Astronomical Society, 432, 954
- Wilks (1938) Wilks S. S., 1938, The Annals of Mathematical Statistics, 9, 60
- Wilson et al. (1995) Wilson C. A., et al., 1995, International Astronomical Union Circular, 6238, 1
- Wilson et al. (2000) Wilson C. A., Finger M. H., Scott D. M., 2000, AIP Conference Proceedings, 510, 208
- Wilson et al. (2005) Wilson C. A., Weisskopf M. C., Finger M. H., Coe M. J., Greiner J., Reig P., Papamastorakis G., 2005, The Astrophysical Journal, 622, 1024
- Wood et al. (2017) Wood M., Caputo R., Charles E., Di Mauro M., Magill J., Perkins J., 2017, arXiv:1707.09551 [astro-ph]
- Xing & Wang (2019) Xing Y., Wang Z., 2019, The Astrophysical Journal, 882, 112
- Yoneda et al. (2020) Yoneda H., Makishima K., Enoto T., Khangulyan D., Matsumoto T., Takahashi T., 2020, Physical Review Letters, 125, 111103
- Zand et al. (2006) Zand J. J. M. i. t., Jonker P. G., Nelemans G., Steeghs D., O’Brien K., 2006, Astronomy & Astrophysics, 448, 1101
- Zanin et al. (2016) Zanin R., Fernández-Barral A., Wilhelmi E. d. O., Aharonian F., Blanch O., Bosch-Ramon V., Galindo D., 2016, Astronomy & Astrophysics, 596, A55
- den Hartog et al. (2004) den Hartog P. R., Kuiper L. M., Corbet R. H. D., in’t Zand J. J. M., Hermsen W., Vink J., Remillard R., van der Klis M., 2004, The Astronomer’s Telegram, 281, 1
- in’t Zand et al. (2007) in’t Zand J. J. M., Kuiper L., den Hartog P. R., Hermsen W., Corbet R. H. D., 2007, Astronomy and Astrophysics, Volume 469, Issue 3, July III 2007, pp.1063-1068, 469, 1063
- van den Eijnden et al. (2020) van den Eijnden J., et al., 2020, The Astronomer’s Telegram, 14193, 1
Appendix A High Mass X-Ray Binary Sample
| Binary Name | Alt. Name | LII | BII | Position Type | Period | Flux U.L. () |
|---|---|---|---|---|---|---|
| 1H 1253-761 | HD 109857 | 302.14353 | -12.51748 | O | 0.0 | 4.1910-8 |
| IGR J12349-6434 | RT Cru | 301.15792 | -1.75063 | X | 0.0 | 9.6010-8 |
| 2RXP J130159.6-635806 | 304.08824 | -1.12109 | IR | 0.0 | 8.6610-8 | |
| 1H 1249-637 | BZ Cru | 301.95802 | -0.20313 | O | 0.0 | 1.3610-7 |
| 4U 1223-624 | BP CRU ? | 300.09815 | -0.03512 | O | 41.59 | 2.68 10-7 |
| 2S 1417-624 | 313.02125 | -1.59848 | O | 42.12 | 2.5910-8 | |
| 2S 1145-619 | V801 CEN | 295.61107 | -0.24028 | O | 187.5 | 1.5210-7 |
| SAX J1324.4-6200 | 306.79301 | 0.60938 | X | 0.0 | N.A. | |
| 1E 1145.1-6141 | V830 CEN | 295.48987 | -0.00984 | O | 14.4 | 7.3710-8 |
| 1A 1118-615 | HEN 3-640 | 292.49858 | -0.89174 | O | 0.0 | 2.4210-7 |
| 4U 1258-61 | V850 CEN | 304.10272 | 1.24742 | IR | 133.0 | 1.3210-7 |
| IGR J11435-6109 | 294.8992 | 0.70118 | O | 52.46 | 6.5710-8 | |
| 1H 0749-600 | HD 65663 | 273.69327 | -16.85817 | IR | 0.0 | N.A |
| 1A 1244-604 | 302.45915 | 2.22543 | X | 0.0 | 9.76 10-8 | |
| 4U 1119-603 | V779 CEN | 292.09035 | 0.33556 | X | 2.09 | 4.7410-8 |
| 1H 1238-599 | 301.76038 | 2.65032 | X | 0.0 | N.A. | |
| IGR J11215-5952 | HD 306414 | 291.89319 | 1.07292 | O | 0.0 | 7.9610-8 |
| 1A 1246-588 | 302.6956 | 3.74924 | X | 0.0 | 2.2810-7 | |
| GRO J1008-57 | 282.99992 | -1.82173 | O | 135.0 | N.A | |
| 1H 1255-567 | MU.02 CRU | 303.36468 | 5.70047 | O | 0.0 | 1.0310-7 |
| RX J1037.5-5647 | LS 1698 | 285.35291 | 1.4326 | X | 0.0 | 2.3210-8 |
| XTE J1543-568 | 324.95121 | -1.46121 | X | 75.56 | 6.9310-8 | |
| 1H 1555-552 | HD 141926 | 326.97618 | -1.23892 | O | 0.0 | 2.4510-7 |
| 2S 1553-542 | 327.94412 | -0.85703 | X | 30.6 | 2.8310-8 | |
| 1H 0739-529 | HD 63666 | 266.31268 | -13.72584 | O | 0.0 | 3.6610-8 |
| 4U 1538-52 | QV NOR | 327.41949 | 2.1637 | O | 3.73 | 4.3710-8 |
| IGR J16195-4945 | HD 146628? | 333.53932 | 0.33326 | X | 0.0 | 3.5610-7 |
| IGR J16318-4848 | 335.61599 | -0.44776 | O | 0.0 | 2.4610-8 | |
| IGR J16283-4838 | 335.32671 | 0.10203 | X | 0.0 | 2.0310-7 | |
| IGR J16320-4751 | 336.32997 | 0.16892 | X | 8.96 | N.A. | |
| IGR J16358-4726 | 337.12311 | -0.00089 | X | 0.0 | N.A. | |
| AX J1639.0-4642 | 338.00124 | 0.07508 | IR | 0.0 | 4.8910-7 | |
| IGR J16418-4532 | 339.19309 | 0.51511 | X | 0.0 | 4.7210-8 | |
| IGR J16479-4514 | 340.16406 | -0.12466 | X | 0.0 | 6.7510-7 | |
| IGR J16465-4507 | 340.05357 | 0.13505 | IR | 0.0 | N.A. | |
| 1WGA J0648.0-4419 | HD 49798 | 253.70642 | -19.1412 | O | 1.55 | N.A. |
| IGR J16493-4348 | 341.37079 | 0.60251 | X | 0.0 | 1.6710-7 | |
| GS 0834-430 | 262.02096 | -1.51074 | O | 105.8 | 4.0510-8 | |
| AX J1700-419 | 344.04452 | 0.23717 | X | 0.0 | 1.7010-7 | |
| OAO 1657-415 | 344.36915 | 0.31918 | X | 10.4 | 1.0110-7 | |
| 4U 0900-40 | HD 77581 | 263.05839 | 3.92993 | O | 8.96 | 3.2210-8 |
| 4U 1700-37 | HD 153919 | 347.75446 | 2.1734 | O | 3.41 | 1.1010-7 |
| IGR J17091-3624 | 349.52595 | 2.23569 | R | 0.0 | 1.5010-7 | |
| EXO 1722-363 | 351.49727 | -0.35395 | IR | 9.74 | 8.0010-8 | |
| RX J0812.4-3114 | LS 992 | 249.57107 | 1.5477 | IR | 81.3 | 1.8110-8 |
| XTE J1739-302 | 358.06784 | 0.44517 | X | 0.0 | 6.7510-7 | |
| RX J1739.4-2942 | 358.64668 | 0.73046 | X | 0.0 | 2.3710-7 | |
| AX J1740.1-2847 | 359.49377 | 1.08387 | X | 0.0 | 1.0810-7 | |
| AX J1749.1-2733 | 1.5827 | 0.06234 | X | 0.0 | 6.4910-7 | |
| AX J1749.2-2725 | 1.701 | 0.1157 | X | 0.0 | 4.0610-7 | |
| RX J1744.7-2713 | V3892 SGR | 1.35781 | 1.05224 | O | 0.0 | 2.0910-7 |
| GRO J1750-27 | 2.37283 | 0.50774 | X | 29.8 | 1.2410-7 |
| Binary Name | Alt. Name | LII | BII | Position Type | Period | Flux U.L. () |
|---|---|---|---|---|---|---|
| IGR J17544-2619 | 3.23599 | -0.33559 | IR | 0.0 | N.A. | |
| 3A 0726-260 | V441 PUP | 240.28165 | -4.05037 | O | 34.5 | 2.9110-8 |
| SAX J1819.3-2525 | V4641 SGR | 6.75638 | -4.79765 | O | 2.8 | 9.6910-8 |
| SAX J1802.7-2017 | 9.41747 | 1.04356 | X | 4.6 | 1.0510-7 | |
| SAX J1818.6-1703 | HD 168078? | 14.07813 | -0.71028 | X | 0.0 | 1.0410-7 |
| RX J1826.2-1450 | LS 5039 | 16.88157 | -1.28923 | R | 3.9 | N.A. |
| AX J1820.5-1434 | 16.47185 | 0.06991 | X | 0.0 | 2.6110-7 | |
| 4U 1807-10 | 18.60547 | 3.85183 | X | 0.0 | 2.9110-7 | |
| XTE J1829-098 | 21.69699 | 0.2786 | X | 0.0 | 3.4210-7 | |
| H 1833-076 | 24.46252 | -0.16075 | X | 0.0 | N.A | |
| XTE J0658-073 | [M81] I-33 | 220.12859 | -1.76725 | O | 0.0 | 6.2610-8 |
| AX J1838.0-0655 | 25.23678 | -0.19035 | X | 0.0 | 1.4710-7 | |
| GS 1839-06 | 26.61754 | -0.50815 | X | 0.0 | 1.0510-7 | |
| AX J1841.0-0536 | 26.76429 | -0.23879 | O | 0.0 | 1.5210-7 | |
| AX 1845.0-0433 | 28.14552 | -0.65617 | X | 0.0 | 2.6210-8 | |
| GS 1839-04 | 27.87383 | 0.11023 | X | 0.0 | N.A. | |
| IGR J18483-0311 | 29.74117 | -0.75374 | X | 0.0 | 8.3010-8 | |
| GS 1855-02 | 31.24518 | -2.70507 | X | 0.0 | 1.2510-7 | |
| XTE J1855-026 | 31.07627 | -2.09629 | X | 6.067 | 5.8410-8 | |
| 2S 1845-024 | 30.42054 | -0.40562 | X | 241.0 | 7.2210-7 | |
| GS 1843+009 | 33.03653 | 1.6896 | O | 0.0 | 5.2410-8 | |
| XTE J1901+014 | 35.38393 | -1.61576 | O | 0.0 | 2.1610-7 | |
| 4U 1901+03 | 37.1618 | -1.25 | X | 22.58 | 4.0510-8 | |
| XTE J1858+034 | 36.80574 | -0.02467 | O | 0.0 | 4.3110-7 | |
| 3A 1909+048 | SS 433 | 39.69421 | -2.2447 | O,R | 13.1 | 2.1310-7 |
| SAX J0635.2+0533 | 206.15276 | -1.04229 | O | 11.2 | 1.4810-7 | |
| 4U 1909+07 | 41.89715 | -0.81151 | IR | 4.4 | 1.0410-7 | |
| XTE J1859+083 | 41.14664 | 2.06249 | X | 0.0 | 8.3110-8 | |
| XTE J1906+09 | 42.49725 | 1.17483 | O | 0.0 | 1.2110-7 | |
| 4U 1907+09 | 43.74539 | 0.47045 | O | 8.38 | 1.0410-7 | |
| IGR J19140+0951 | 44.29629 | -0.46868 | X | 13.558 | 3.6810-7 | |
| IGR J06074+2205 | 188.38516 | 0.81378 | O | 0.0 | 1.4310-7 | |
| 1A 0535+262 | V725 TAU | 181.44505 | -2.64342 | O | 111.0 | N.A. |
| XTE J1946+274 | 63.20703 | 1.39573 | O | 169.2 | 1.5710-7 | |
| 1H 0556+286 | HD 249179 | 181.28416 | 1.85966 | O | 0.0 | 6.3310-8 |
| KS 1947+300 | 66.08802 | 2.09797 | O | 40.4 | 7.6210-8 | |
| 4U 0352+309 | X PER | 163.07842 | -17.1335 | O | 250.3 | 6.6710-8 |
| 4U 1956+35 | Cyg X-1 | 71.33508 | 3.0668 | O,R | 5.0 | N.A. |
| EXO 2030+375 | 77.15175 | -1.24157 | O | 46.02 | 6.6410-8 | |
| EXO 051910+3737.7 | V420 AUR | 170.05323 | 0.71029 | O | 0.0 | 2.1610-7 |
| 4U 2030+40 | Cyg X-3 | 79.8426 | 0.69512 | R | 0.2 | N.A. |
| GRO J2058+42 | 83.56978 | -2.65543 | O | 55.03 | N.A. | |
| RX J0440.9+4431 | LS V +44 17 | 159.84708 | -1.27013 | O | 0.0 | 4.3010-8 |
| W63 X-1 | 82.31659 | 5.42815 | X | 0.0 | N.A. | |
| SAX J2103.5+4545 | 87.12993 | -0.68507 | O | 12.68 | 6.7610-8 | |
| RX J2030.5+4751 | SAO 49725 | 85.2307 | 5.04764 | O | 0.0 | N.A. |
| 1H 2202+501 | BD +49 3718 | 97.24782 | -4.04112 | O | 0.0 | 2.8110-8 |
| V 0332+53 | BQ CAM | 146.05195 | -2.19388 | O | 34.25 | 7.0410-8 |
| 1H 1936+541 | DM +53 2262 | 85.84987 | 15.9024 | O | 0.0 | 3.6010-8 |
| 4U 2206+543 | BD +53 2790 | 100.60312 | -1.10596 | O | 9.57 | N.A. |
| XTE J0421+560 | CI CAM | 149.17637 | 4.13342 | O | 19.41 | 5.9510-8 |
| 1H 2138+579 | V490 CEP | 99.01253 | 3.31318 | O | 0.0 | 9.5010-8 |
| 2S 0053+604 | GAMMA CAS | 123.57681 | -2.14848 | O | 203.59 | 1.0110-7 |
| 1E 0236.6+6100 | LS I +61 303 | 135.67529 | 1.08626 | O,R | 26.496 | N.A. |
| SAX J2239.3+6116 | 107.73456 | 2.36233 | O | 262.0 | 8.3910-8 | |
| RX J0146.9+6121 | LS I +61 235 | 129.54108 | -0.8001 | O | 0.0 | 1.1910-7 |
| IGR J00370+6122 | BD +60 73 | 121.22213 | -1.46464 | O | 15.665 | 1.4810-7 |
| Binary Name | Alt. Name | LII | BII | Position Type | Period | Flux U.L. () |
|---|---|---|---|---|---|---|
| 4U 0115+634 | V635 CAS | 125.92366 | 1.02574 | O | 24.3 | 6.4710-8 |
| 2S 0114+650 | V662 CAS | 125.70998 | 2.56353 | O | 11.6 | 5.6510-8 |
| IGR J01363+6610 | EM* GGR 212 | 127.39482 | 3.7248 | O | 0.0 | 4.4410-8 |
| IGR J01583+6713 | 129.35216 | 5.18871 | O | 0.0 | 1.0810-7 |
Appendix B False Positive -ray Excesses
B.1 IGR J16320-4751
IGR J16320-4751 (henceforth IGR1632) is a system thought to be a pulsar in orbit with either a giant K-type, or O/B, star (Rodriguez et al., 2003). It is notable for its variable nature in the X-ray waveband and particularly short orbital period of approximately 9 days (Garcia et al., 2018). Over the 12.5 year observation time, we obtain a TS of 31.1 in support of the hypothesis that there is a -ray source at this position, with numerous bins in the 6-month binned light-curve (Figure 26) with , but no clear evidence for variability.
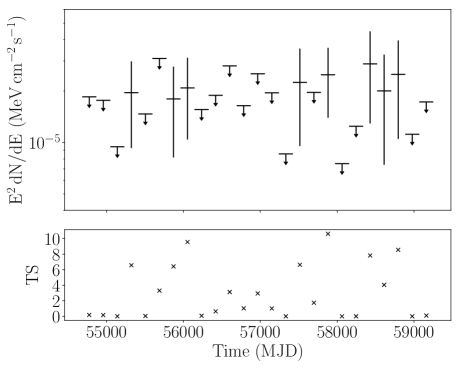

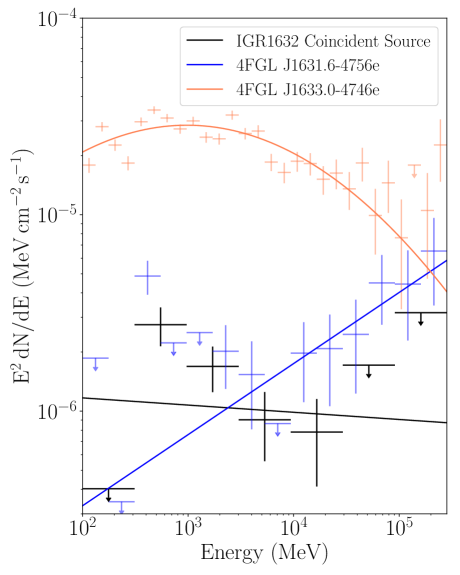
Whilst it is possible that this coincident -ray point source is associated with IGR1632, we strongly suspect source confusion has caused a false detection, as IGR1632 lies away from 4FGL J1631.6-4756e () and away from 4FGL J1633.0-4746e (). Both sources are associated in the 4FGL with the TeV PWN HESS J1632-478 (Aharonian et al., 2006). Such proximity between any two sources can see one source (usually the more significant) contaminating the second with photons. IGR1632 is extremely close to two significant and extended sources rather than a single point source, and lies within our calculated radius of the larger and more significant of the two, 4FGL J1633.0-4746e. Figure 27 shows the extent of the coincident -ray excess with the position of IGR1632 overlaid, and the extent of the two extended sources shown to highlight the positional coincidence between these and the IGR1632 source.
We generate light-curves of both extended sources to compare against the IGR1632 light-curve to identify any correlated variability (a signature of source confusion), or differences in variability (a signature of source independence); however, neither of the extended sources is significantly variable (4FGL J1633.0-4746e is variable at the level, 4FGL J1631.6-4756e at the level), and no correlations are observed between these light-curves and the IGR1632 coincident source light-curve. Therefore, the light-curve calculation does neither supports nor rejects the hypothesis that the IGR1632 excess is the product of source confusion.
We generate an SED of the IGR1632 coincident source across the entire energy range we employ, and find that the best fit to the data is a power law with spectral index , which indicates an almost flat spectrum source, although we note that this fit to the data appears to be poor. This SED is illustrated in Figure 28. We also generate SEDs of 4FGL J1633.0-4746e, which has a log-parabola spectral shape, and 4FGL J1631.6-4756e which is best modelled by a hard power law. The 4FGL indicates a power law spectral index of for the more significant of the two sources, 4FGL J1633.0-4746e, marginally softer than that of the IGR1632 coincident source. It is highly likely that the spectrum for this coincident source is essentially that of 4FGL J1633.0-4746e with a smaller normalisation and a contaminating component from 4FGL J1631.6-4756e which slightly hardens the spectral index. Given this, and the fact that the predicted counts of both extended sources (in a reference model) decrease by roughly the same number of counts as is predicted for the IGR1632 coincident source, we conclude that this apparent source is a false positive, and the emission originates from the extended 4FGL sources.
B.2 IGR J16358-4726
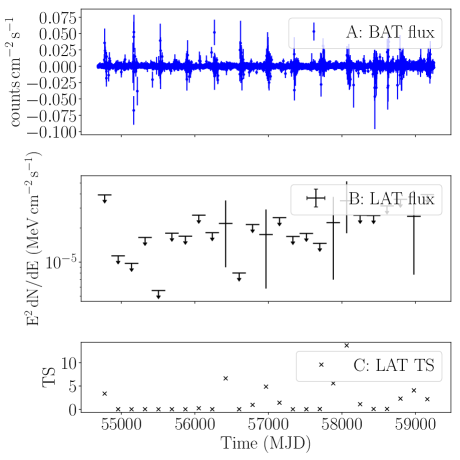
IGR J16358-4728 (Revnivtsev et al. 2003 and Bodaghee et al. 2012) (henceforth IGR1635) is either a HMXB in which a pulsar orbits a super-giant Be star (Chaty et al. 2008 and Rahoui et al. 2008), or, based on the presence of CO lines in the K-band spectrum making the companion star a KM giant, a symbiotic LMXB (Nespoli et al., 2010). Under this former hypothesis, one might expect -ray emission at periastron. We detect a -ray excess coincident with this source with over the LAT observation period, and also measure a flux value where in 5 light-curve bins. This light-curve is shown together with the daily Swift-BAT light-curve in Figure 29. Of the 5 bins which exceed the threshold in this light-curve, only one exceeds the level. This bin, and the preceding bin are the only adjacent bins, making it difficult to perform any subsequent analysis of this source.
It seems likely that the origin of this weak -ray excess is source confusion with the nearby, significantly extended source 4FGL J1636.3-4731e (SNR G337.0-00.1, ) as they are separated by an angular offset of and 4FGL J1636.3-4731e is extended by a radius of , so the apparent excess is within the -ray extension of this SNR. We generate a light-curve for this source and find that it is not variable, with the exception of one particularly low flux point. Both the IGR1635 coincident source and the extended source are well-fitted by a steady source model.
We do not have sufficient photon statistics in the IGR1635 coincident excess for a comparative spectral analysis with 4FGL J1636.3-4731e. As we cannot effectively distinguish one source from the other with variability we cannot prove the independence of the IGR1635 excess from 4FGL J1636.3-4731e, nor associate this excess with the binary in question, hence we conclude it is likely a false positive caused by source confusion.
B.3 IGR J16465-4507
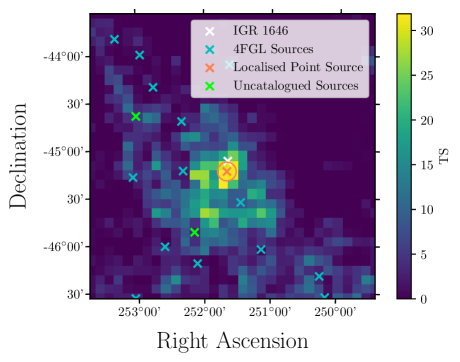
IGR J16465-4507 (henceforth IGR1646) (Lutovinov et al. 2004 and Romano et al. 2014) is a supergiant HMXB system consisting of a Be star (Negueruela & Schurch, 2007) and a pulsar (Lutovinov et al., 2005) orbiting each other with a period of 30.2 days (La Parola et al., 2010). We detect a point source coincident with the position of IGR1646 to , equivalent to , the most significant of all the coincident sources and excesses in our survey. The nearest sources to the IGR1646 coincident source are 4FGL J1645.8-4533c (angular offset = , ) which is tentatively associated with the LMXB 4U 1642-45. Further sources near the IGR1646 coincident source include 4FGL J1649.2-4513c (angular offset = , ) and 4FGL J1649.3-4441 (angular offset = , ). Neither source has a multi-wavelength counterpart.
Figure 30 shows the TS map of the central part of the IGR1646 ROI, centered on the position of IGR1646. Given the significance of the recorded point source, we are able to localise the emission with the gta.localize algorithm and refit our point source to the peak of the -ray emission. We find the best positional fit for the point source is , . There is thus an angular offset from the position of IGR1646 of , compared to a 95% positional uncertainty of . The TS of the source also increases from 50.8 to 59.7 in its new position. Thus, following localisation we no longer consider this point source to be spatially coincident with the binary system and find it more likely that this new point source is either a product of source confusion with one of the nearby 4FGL sources, or an unknown new source which is unlikely to be associated with IGR1646.
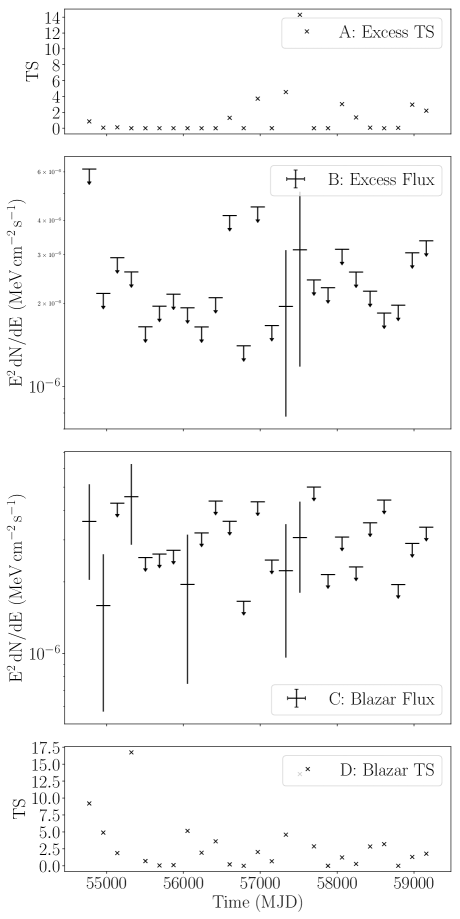
B.4 1WGA J0648.0-4419
1WGA J0648.0-4419 (also known as HD 49798, and henceforth referred to as 1WGA06) is a binary system consisting of a pulsar (Israel et al., 2009) and an O-type sub-dwarf star (Kupfer et al., 2020). We find a -ray excess coincident with the position of 1WGA06 with a TS of 18.5, giving a -score of . The nearest 4FGL source to 1WGA06 is 4FGL J0647.7-4418 (associated with the blazar SUMSS J064744-441946), with an angular offset of , less than one spatial bin width from the position of the binary. With a point source fitted to the position of 1WGA06, the blazar is only marginally detected, with a TS of 8.18 (slightly below ). This is far less than the detection significance given in the 4FGL-DR2, which is . It is possible that the -ray excess observed at the position of 1WGA06 is due to source confusion with this blazar; temporal variability is used to test whether this is the case.
A similar occurrence of source confusion between a -ray excess at the position of an X-ray binary (in this case V404 Cygni), and a blazar is dealt with in Harvey et al. (2021), where the apparent -ray excess was actually originating from a nearby flaring blazar. Given that we measure only two -ray flux points in the 6-month binned light-curve of the 1WGA06 excess, we can remove this excess from the model and generate a light-curve of the blazar to see whether these -ray flux points would otherwise be attributed to the blazar. If this is the case, then the excess at the position of 1WGA06 is not independent of the blazar, and source confusion is occurring. Figure 31 shows both the light-curve of the 1WGA06 excess and the light-curve of the blazar. Given that we see only two -ray flux measurements amongst an otherwise complete set of upper limits for the excess, and we see corresponding flux points in the light-curve of the blazar, the -ray excess coincident with 1WGA06 is likely due to source confusion with the blazar.
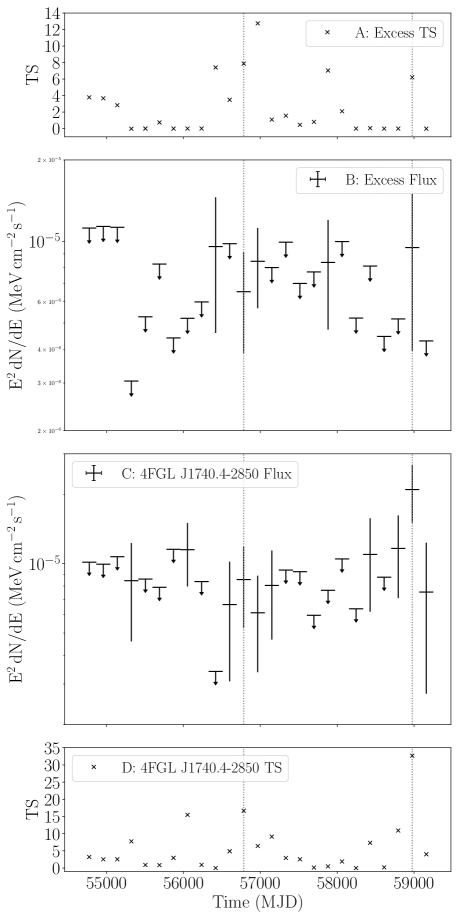
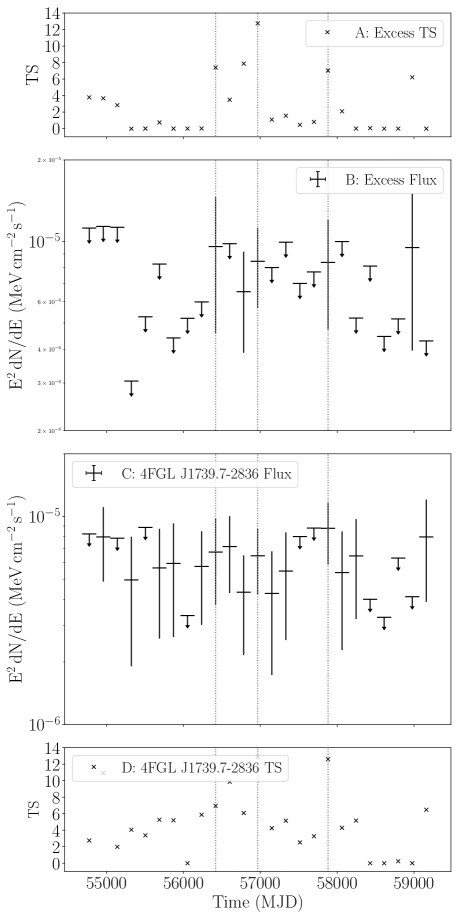
B.5 AX J1740.1-2847
AX J1740.1-2847 (henceforth AX17) is a HMXB system with a long-period pulsar (Sakano et al., 2000) in orbit around an unknown companion star (Kaur et al., 2010). Over the entire observation window, we find a -ray excess coincident with the position of AX17 with a TS of 7.17, giving a -score of . Across the 6 month binned light-curve we identify 5 bins with , with the peak TS being 12.8 (3.6 ). This -ray excess is very likely due to source confusion given that the nearest sources are 4FGL J1740.4-2850 ( and an angular offset from AX17 of ) and 4FGL J1739.7-2836 (, offset ). Neither of these sources has any association with sources at other wavelengths. The primary source confusion counterpart for the -ray excess is likely to be 4FGL J1740.4-2850, with an angular offset that is less than one bin width. This presents a similar case to 1WGA06, dealt with in Section B.4, where we establish that the -ray excess is not independent of its nearest 4FGL neighbour. We calculate the 6 monthly binned light-curves of the AX17 excess and 4FGL J1740.4-2850, shown in Figure 32, and also 4FGL J1739.7-2836 (shown with the AX17 excess) in Figure 33. Unlike 1WGA06, source confusion in this case cannot be attributed to a single source, but rather to contamination from both nearby sources.
Figures 32 and 33, show that the bins from the -ray excess where a flux is measured (as opposed to an upper limit) typically correlate with an enhancement in the TS values of one of the two nearby 4FGL sources. In particular, four of the five bins with measured -ray flux in the excess light-curve correlate in time with the two most significant bins from the 4FGL sources. These are indicated by the dotted grey lines. The evidence suggests that the -ray excess is not independent of either of its neighbouring sources, and therefore does not represent a legitimate detection of -rays from AX17.
B.6 H 1833-076
H 1833-076 (also known as Sct X-1 (Makino & GINGA Team, 1988) and henceforth referred to as H18) is a high mass X-ray binary system, thought to consist of an accreting pulsar and red supergiant donor star (Kaplan et al., 2007). We identify a -ray excess coincident with the position of H18 with an angular offset from the X-ray position of H18 of . This excess has a TS of 29.2 and a positional uncertainty of . Given that the position of this excess lies right at the edge of the positional uncertainty bound, we localise its position to improve the uncertainty. Using the localize algorithm, we find a best fit position for the excess of , with an overall positional uncertainty of . Given the shift in excess position and smaller, improved uncertainty, the -ray excess is no longer coincident with the position of H18 and we therefore believe it is unlikely to represent -ray emission from this X-ray binary.
B.7 GS 1839-04
GS 1839-04 (henceforth referred to as GS18) is an X-ray binary system with an unknown accretor and unknown companion star. We observe a -ray excess identified by the gta.find_sources algorithm coincident with the position of GS18 which we designate PS J1842.0-0418. This has a TS value of 17.8 and an angular offset from the position of GS18 of , although the 95% positional uncertainty around PS J1842.0-0418 is unusually large at . Contained within this uncertainty region are 7 4FGL sources, with the nearest neighbours to PS J1842.0-0418 being the unidentified source 4FGL J1842.5-0359c (TS = 318 and an angular offset from the position of GS18 of ) and 4FGL J1840.8-0453e, the young supernova remnant Kes 73 (Gotthelf & Vasisht, 1997) (TS = 1050, offset ). Given that the positional uncertainty of PS J1842.0-0418 is so large, encompasses numerous, luminous -ray sources and that PS J1842.0-0418 is extended, we localise its position, even though the TS of PS J1842.0-0418 is below 25999Usually we lack photon statistics for more advanced analysis methods at such low source significance..
Figure 34 shows a TS map centered on GS18, highlighting the extent of the PS J1842.0-0418 uncertainty and the sources within it. After localising the -ray emission from PS J1842.0-0418 we find that the 95% positional uncertainty shrinks by approximately an order of magnitude to . As shown by Figure 34, this means that the X-ray position of GS18 is no longer within the 95% positional uncertainty of PS J1842.0-0418 and therefore PS J1842.0-0418 is very unlikely to represent -ray emission from GS18.
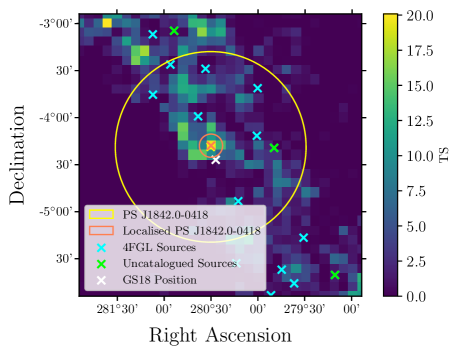
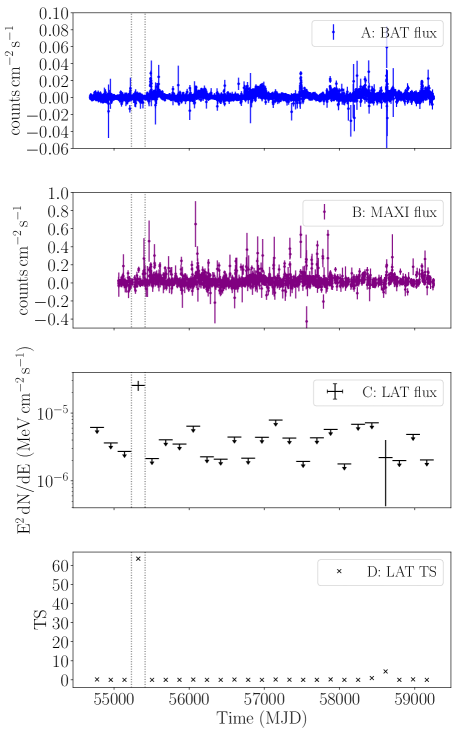
B.8 SAX J2103.5+4545
SAX J2103.5+4545 (henceforth SAX21) is a pulsar (Hulleman et al., 1998) accretor in orbit with a Be star companion (Reig et al., 2005) with an orbit of 12.7 days (Baykal et al., 2000). SAX21 is the closest known neutron star-Be star system to Earth (Blay et al., 2006). SAX21 is a well-studied system, with outbursts well documented since its discovery, the most recent of which was in 2019 (Ducci et al., 2019), and persistent monitoring with Swift-BAT meaning a wealth of multi-wavelength data is available for the source. Unlike the majority of X-ray binaries we report on here, we identify no persistent -ray excess coincident with the position of SAX21. However, we do identify significant transient emission in the 6-monthly binned light-curve.
Figure 35 shows the X-ray light-curve of SAX21 together with the -ray light-curve generated at the position of SAX21. We measure 2 flux points, one with () and the other with (). Given that we have 25 bins, we would expect one of these to be of in a simply noise dominated distribution, however given the significance of the bin, there is no statistical doubt that this represents a flaring -ray point source of some morphology.
To test whether this transient point source represents -ray emission from SAX21, or another undiscovered source, we perform a full analysis using the same parameters as detailed in Table 1, with the exception that our time range now exclusively encompasses the bin containing the -ray flare (MJD 55231 - MJD 55414). We then fit a -ray source to the position of SAX21 and localise its position. We then generate a TS map of the ROI, and plot the positions of all known sources, together with the position of SAX21 and the now localised position of the -ray excess, and its associated 95% positional uncertainty.
Figure 36 shows the TS map of the SAX21 ROI during the 6 month period of the -ray flare, which is the dominant feature of the plot. Whilst the white cross indicates the position of the binary itself, the orange cross indicates the localised position of the -ray flare, with the orange circle representing the bound of the 95% positional uncertainty of the flare. As can be seen, SAX21 lies outside the positional uncertainty bound following localisation, so it is unlikely that SAX21 is the cause of this flare.