Abstract
This paper presents a comprehensive review of methods covering significant subjective and objective human stress detection techniques available in the literature. The methods for measuring human stress responses could include subjective questionnaires (developed by psychologists) and objective markers observed using data from wearable and non-wearable sensors. In particular, wearable sensor-based methods commonly use data from electroencephalography, electrocardiogram, galvanic skin response, electromyography, electrodermal activity, heart rate, heart rate variability, and photoplethysmography both individually and in multimodal fusion strategies. Whereas, methods based on non-wearable sensors include strategies such as analyzing pupil dilation and speech, smartphone data, eye movement, body posture, and thermal imaging. Whenever a stressful situation is encountered by an individual, physiological, physical, or behavioral change is induced which help in coping with the challenge at hand. A wide range of studies has attempted to establish a relationship between these stressful situations and the response of human beings by using different kinds of psychological, physiological, physical, and behavioral measures. Inspired by the lack of availability of a definitive verdict about the relationship of human stress with these different kinds of markers, a detailed survey about human stress detection methods is conducted in this paper. In particular, we explore how stress detection methods can benefit from artificial intelligence utilizing relevant data from various sources. This review will prove to be a reference document that would provide guidelines for future research enabling effective detection of human stress conditions.
keywords:
Human stress assessment; Wearable sensors; Multimodal machine learning; Feature extraction; Classification.1 \issuenum1 \articlenumber0 \datereceived \daterevised \dateaccepted \datepublished \hreflinkhttps://doi.org/ \TitleHuman Stress Assessment: A Comprehensive Review of Methods Using Wearable Sensors and Non-wearable Techniques \TitleCitationHuman Stress Assessment: A Comprehensive Review of Methods Using Wearable Sensors and Non-wearable Techniques \AuthorAamir Arsalan 1\orcidA, Muhammad Majid 2*\orcidB, Imran Fareed Nizami 3, Waleed Manzoor 4, Syed Muhammad Anwar 5,6, and Jihyoung Ryu 7\orcidC \AuthorCitationArsalan, A.; Majid, M.; Nizami, I. F.; Manzoor, W.; Anwar, S.M.; Ryu, J. \corresCorrespondence: Muhammad Majid (m.majid@uettaxila.edu.pk);
1 Introduction
Human stress research is significant since it plays a vital role in social, physiological, and psychological health. Stress research has a wide range of applications that include stress monitoring during the daily routine, stress assessment for improving health and work productivity, and preventing the onset of serious diseases. This research domain is beneficial for both individuals and society. Stressful conditions manifest in the form of adverse effects on an individual’s working abilities and health. This makes them vulnerable to various kinds of diseases and weakens the recovery process for the human body from various clinical conditions (Subhani et al., 2017). Long-term exposure to heightened stress could cause symptoms of depression. Besides this, the strong connection between depression and stress could boost anxiety and mood disorders (Dempsey, 2018). Depression affects almost 350 million people worldwide and the situation seems to be worse in developing countries (Organization et al., 2015). There are multiple causes of stress in human life that could also lead to mental disorders. These factors include but are not limited to, internal conflicts, political unrest, economic instability, rising poverty, crime rates, and natural disasters, etc. Hence, stressful conditions could severely affect human life in day-to-day activities and could trigger mental and clinical conditions. Therefore, methods that are efficient in stress detection are needed for the time. Recently, the global change in lifestyle owing to COVID-19 is also believed to infest various mental conditions. We are forced to a change in our daily life and have minimal social interaction, which is bound to affect our mental health. Experts believe that this could result in a mental pandemic if not handled properly Spoorthy et al. (2020) Ransing et al. (2020). Hence, monitoring and detecting stress at the right time has become a need of time.
A large segment of the human population is living in a constant state of stress without even knowing its serious consequences. Most individuals are unaware of their current stress levels, and ironically one of the reasons for heart attacks and strokes is a high level of human stress. There are varied causes for stress such as poor income, joblessness, higher crime rates, natural disasters, and many others. According to a survey by the American Psychological Association in 2017, 62% of the individuals have stress due to financial problems, 62% due to problems at the workplace, 57% due to political unrest in the country, and 51% due to violence and crime in the society (Association et al., 2017). Despite such serious consequences, the definition of human stress in medicine is sometimes vague. Hence, priority should be given to focusing on stress quantification with precise numerical indexes. In the near future, it will not be enough to tell patients (dealing with stress) that it is all in their heads since advancements in diagnostic tools would aid in quantifying stress levels more precisely. Human stress is a difficult phenomenon to explain because every individual perceives it differently. There is a common perception in society that stress is a bad thing, but this is not always true as good stress also exists. For instance, an individual might have increased productivity under a stressful or challenging situation. In recent years, there has been an effort to develop strategies for stress assessment in a variety of daily life activities. For instance, in Can et al. (2020), authors have proposed a stress detection scheme based on heart activity, skin conductance, accelerometer, and skin temperature of the subject. The stress measurement protocol is composed of baseline, lecture, exam, and recovery sessions. Maximum accuracy of 94.52% is achieved for three class stress classification using a random forest classifier. A study focused on cognitive training and stress detection in older adults suffering from mild cognitive impairment (MCI) while they were participating in a cognitive and motor rehabilitation session Delmastro et al. (2020). An acute multi-level stress classification framework using photoplethysmography signals in response to the mental arithmetic task was presented in Zubair and Yoon (2020). A stress and anxiety detection mechanism using physiological signals for the academic environment was proposed in Rodríguez-Arce et al. (2020). A study to evaluate the physical and psychological stress in firefighters using the heart rate variability parameter was presented in Pluntke et al. (2019). Detection of human stress using ECG data with car driving and mental arithmetic task as a stimulus and deep neural network classifier was performed in a study conducted in Cho et al. (2019) with an achieved stress classification accuracy of 90.19%. Regression analysis for the measurement of perceived stress using rest state EEG signal was presented in Gillani et al. (2021). A review study about human stress assessment using physiological signals was presented in Gedam and Paul (2021). One of the major shortcomings of this review is that it only focuses on physiological measures of stress and does not enlighten other common methods of stress measurement like physical and psychological measures. Moreover, discussion about publicly existing datasets of human stress is not available.
Generally, stress is defined as a response of the human body to different kinds of situations like a threat or a challenge (Muthukumar and Nachiappan, 2010). There are two main systems of the human body i.e., the autonomic nervous system (ANS) and hypothalamic-pituitary-adrenal (HPA) axis, which responds to stress (Ulrich-Lai and Herman, 2009). When a stressor is encountered by a person, it activates neurons present in the hypothalamus. It releases a hormone called corticotropin-releasing hormone (CRH), which consequently causes the release of another hormone (adrenocorticotropin hormone (ACTH)) from the pituitary gland. ACTH travels in the blood and affects the adrenal glands, which in turn triggers the release of stress hormones including cortisol, epinephrine, and norepinephrine (Kajantie and Phillips, 2006). Cortisol is released in response to stress and it helps an individual to cope with an immediate threat.
In terms of treatment and cure, stress is categorized into three main types i.e., acute stress, episodic stress, and chronic stress based on the symptoms and duration (Werner, 1993). Acute stress (also termed instantaneous stress) originates from a specific event that is novel or unpredictable for an individual. For instance a public speaking task, a nearly missed road accident, and an interview. These stressors are not prone to affect an individual’s health, rather are good for human health. Since such events provide a chance for the human body to practice and develop the fight response to any stressful situation in the future (Segerstrom and Miller, 2004). Whereas severe stressors, which persist for a longer duration, can lead to serious health disorders. Episodic stress occurs when a person faces multiple acute stressors over a shorter period. Episodic stress is commonly faced by individuals that take on more responsibilities than they can easily manage at a given time. Individuals facing episodic stress are often in a hurry and have disorganized personalities. Individuals who have a pessimistic approach toward daily life routine tasks tend to have episodic stress. Unlike acute stress, episodic stress has negative effects on individual health. People facing episodic stress have low confidence in their abilities and they assume that they will never be able to come out of a stressful situation (Sincero, 2012). Chronic stress (also called long-term stress) originates due to a variety of reasons like an unsatisfactory job, tense family life, and financial crises (Hiriyappa, 2013). Unlike acute stressors which can be negative as well as positive, chronic stress is always negative. Chronic stress affects the personality of an individual and can be the cause of many serious diseases which include heart attacks, cancer, and lung diseases (Salleh, 2008).
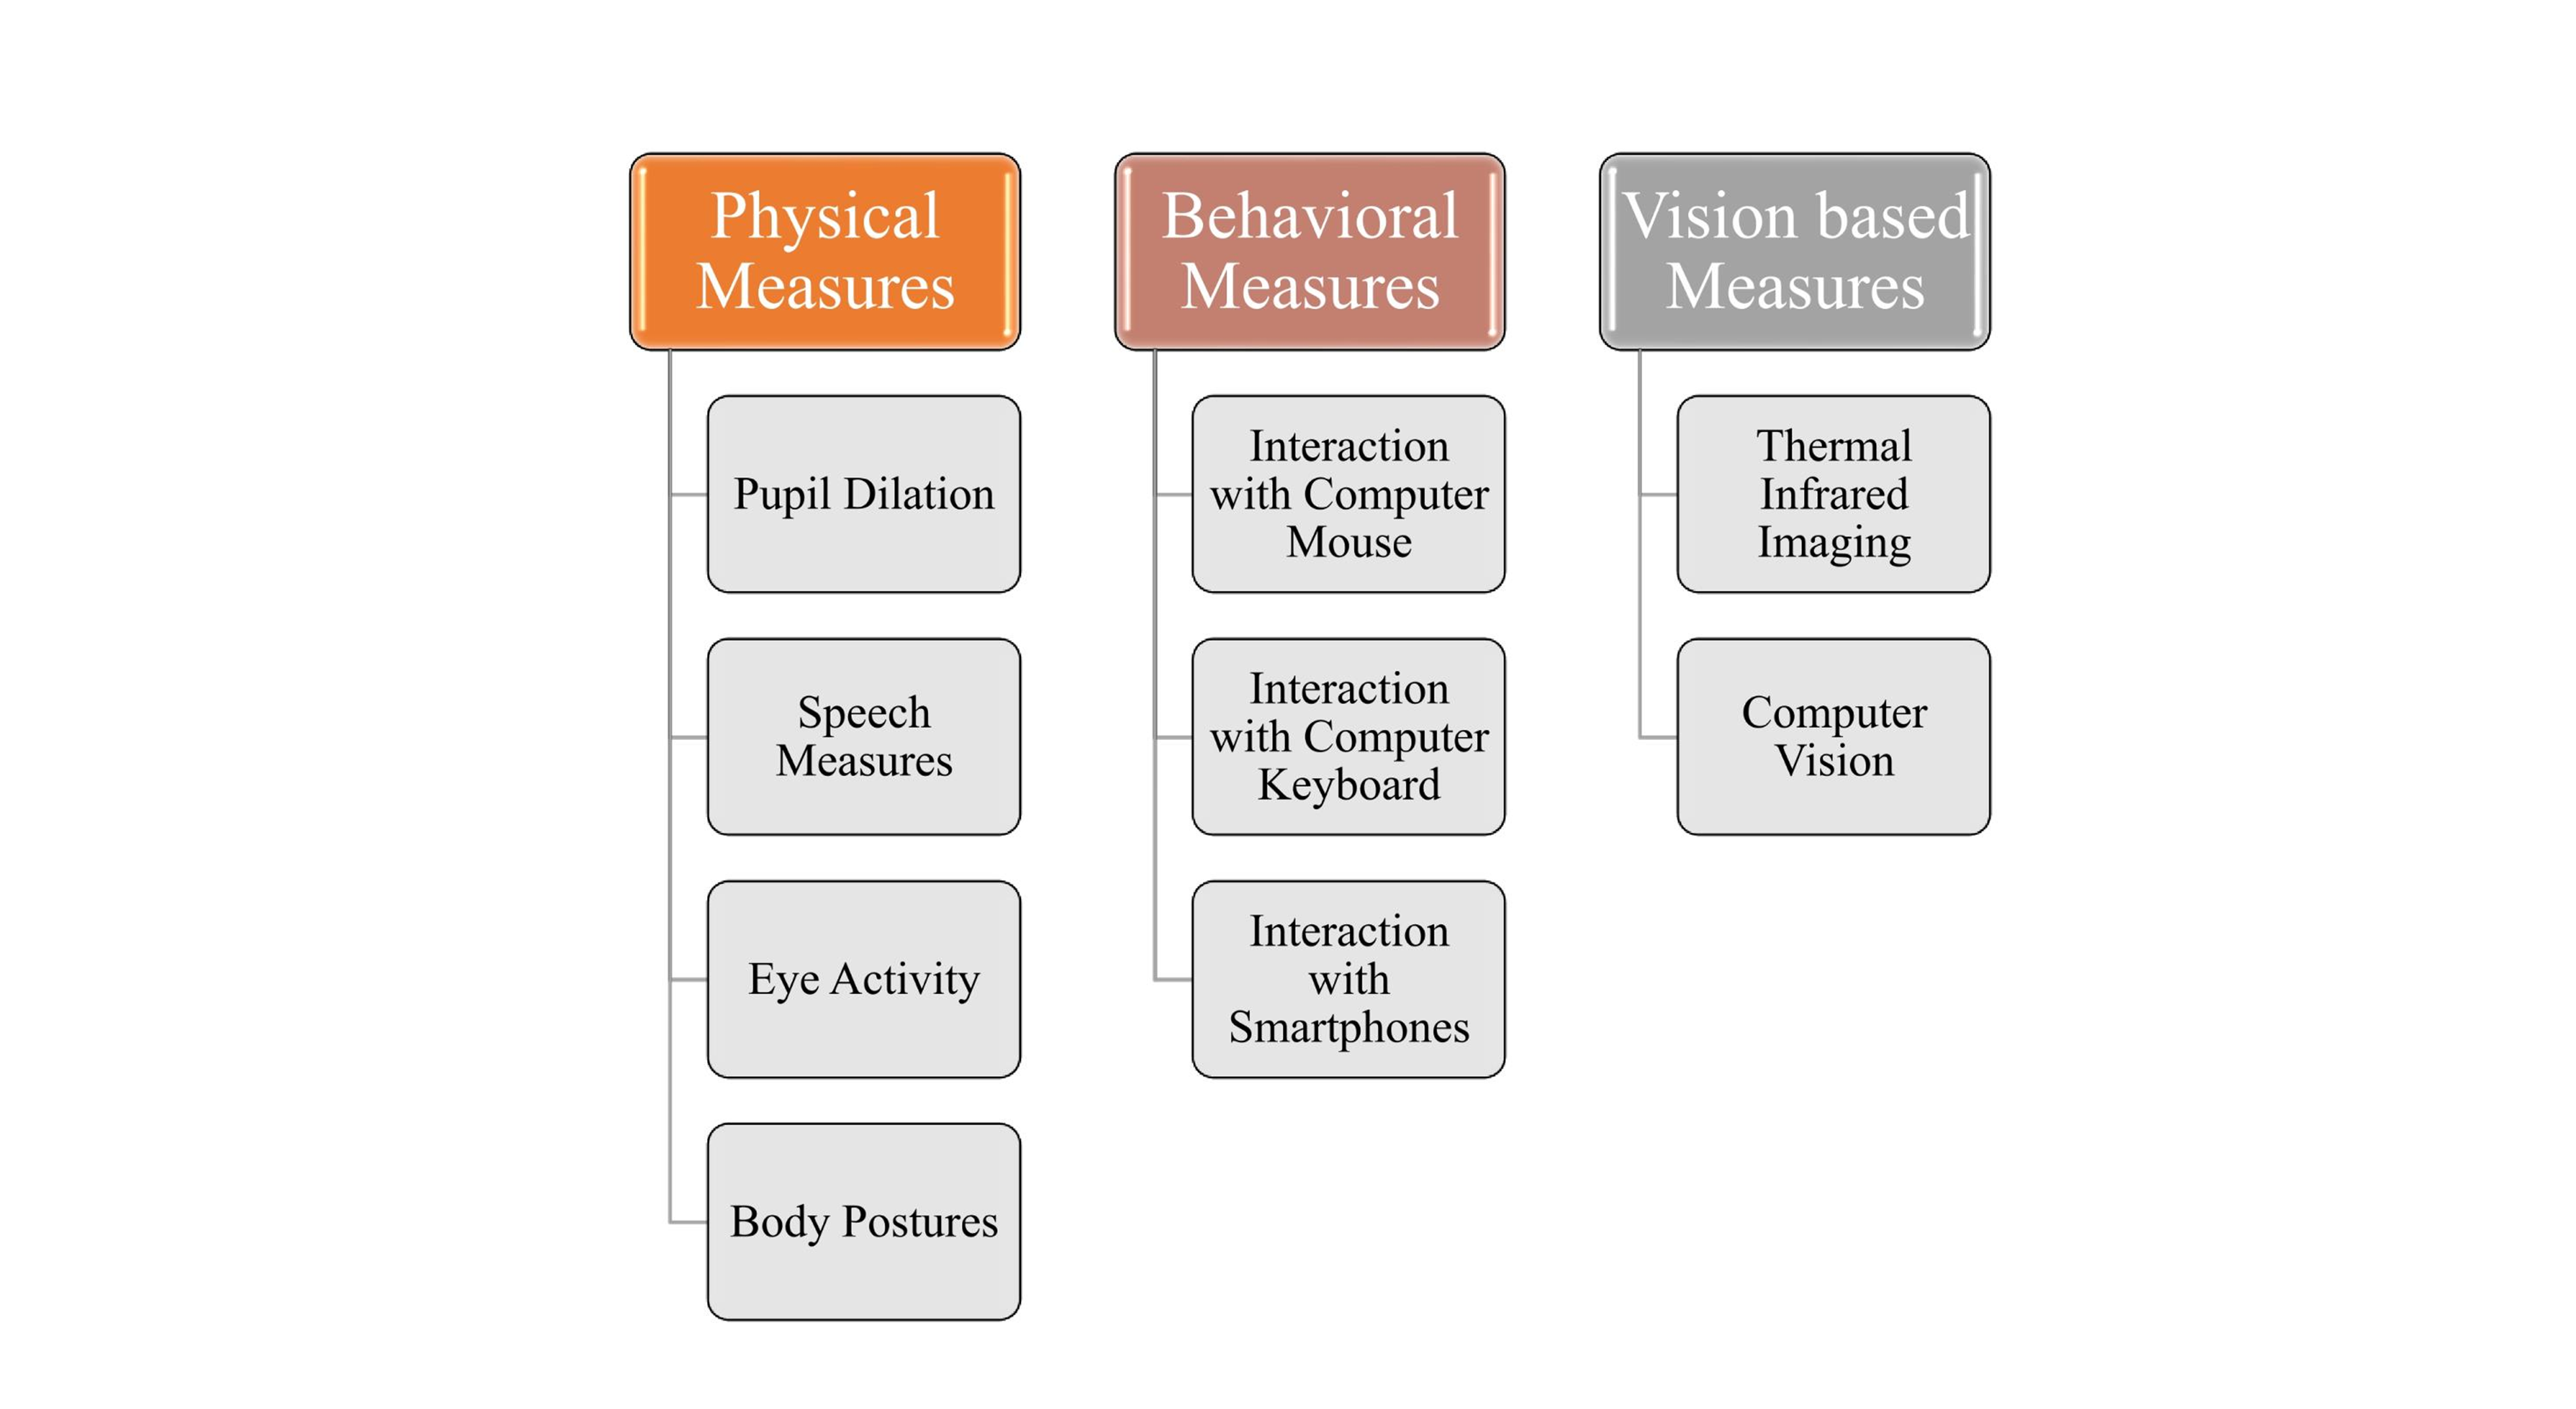
For the assessment of human stress, subjective and objective measures have been used (Gross and Seebaß, 2016; Föhr et al., 2015). For subjective stress assessment, two different ways are used including standard stress measurement questionnaires designed by field experts and conducting sessions with psychologists (Gurung, 2013). Whereas, objective measures of stress further include physiological and physical measures (Onorati et al., 2013; Arsalan et al., 2019). In physical measures, visible changes in the human body are observed such as facial expressions (Deschênes et al., 2015), eye blinking rate (Gowrisankaran et al., 2012), and dilation of the pupil (Schulte-Mecklenbeck et al., 2011). Whereas, for physiological measures, sensors are placed on the human body to measure internal changes. Towards this, various biomarkers have been employed including heart rate variability (HRV), heart rate (HR) (Subahni et al., 2012), electrodermal activity (Liapis et al., 2015), respiration (Wielgosz et al., 2016), and cortisol (Liew et al., 2015).
Further, in recent years the application of machine learning for developing artificially intelligent systems has gained pace. One of the driving factors for this scientific advancement has been the success of deep learning algorithms. Machine learning is poised to significantly change and improve how healthcare systems work. The improvement in computational power will allow the development of embedded systems that are AI-enabled in healthcare. Human stress detection could also benefit from these advancements. Machine learning can be deployed for both offline and online stress assessments. Some challenges that need to be handled include dealing with unpaired data, assigning reliable labels, and developing algorithms that reliably work with limited data and are explainable.
Some studies focus on reviewing the current state of affairs related to human stress detection. For instance, a review on human stress detection using bio-signals is presented in (Giannakakis et al., 2019). However, a discussion about the psychological, physical, and behavioral measures of human stress is found lacking. Further, publicly available databases for human stress measurement were also not explored. In another study, objective, subjective, physical, and behavioral measures for stress detection, as well as publicly available data used for human stress, are discussed. Another application-specific human stress measurement survey focusing on driver stress level is presented in (Rastgoo et al., 2018). Physical and physiological measures of human stress for driver stress detection are explored in detail. The limitation of this survey is that it only discusses a specific application i.e., driver stress level, and is not generic. Similarly, a review of methods developed for human stress measurement at the workplace is discussed in (Carneiro et al., 2017). The limitation of this survey is that it only discusses the stress measurement methods about a specific application i.e., workplace environment and there is also no discussion about the publicly available existing databases for human stress assessment. Human stress measurement survey using smartphones and wearable sensors is presented in (Can et al., 2019). The paper presents the in-lab and out-of-laboratory environment stress measurement studies. The major limitation of the presented survey was the lack of discussion of existing publicly available datasets for human stress detection and the presentation of a limited amount of literature as compared to other available stress assessment surveys. A survey of devices available in the market was presented in (Thapliyal et al., 2017) without any information on the studies using those devices. In summary, there is a need for a comprehensive presentation of the available human stress measurement methods. To the best of our knowledge, the current review addresses most of the shortcomings of existing human stress assessment survey papers by thoroughly investigating all the subjective and objective measures of human stress. In particular, our major contributions include,
-
1.
Subjective measures, which include psychological questionnaires, are explored in detail for completeness.
-
2.
Objective measures of stress comprising of data acquired from wearable and non-wearable sensors are elaborated.
-
3.
Publicly available human stress measurement databases and commonly used stimuli for inducing stress are also discussed in detail.
-
4.
Future research directions in the domain of automated human stress detection using artificial intelligence are identified.
The organization of this review paper is as follows. Section 1 presents an introduction to available stress measurement techniques categorization and a discussion about the existing stress measurement reviews and their limitations. Section 2 presents a review of the commonly used stressors adopted in stress measurement studies for inducing stress in the participants followed by a brief discussion about publicly available stress detection databases. Subjective stress measurement techniques commonly used in literature are explored in Section 3 followed by objective stress measurement techniques, its general framework, and its associated literature is explored in Section 4. Section 5 presents the multimodal stress detection schemes available in the literature followed by a discussion about the limitations of the existing schemes and future directions in Section 6 and conclusion in Section 7.
2 Stress Detection Datasets and Stressors
The section is subdivided into two parts: first, we discuss some commonly used stressors for inducing stress in humans, secondly, we summarize publicly available datasets for human stress detection.
2.1 Stress Inducers: Stressors
Human stress measurement methods presented in the literature use a wide variety of stressors, which could include a public speaking task, an interview, an arithmetic task stressor, and many others. Stress is measured in response to these stressors by using different physiological and psychological techniques. Herein, we will review the most commonly used stressors for inducing stress in the participants and their related literature.
2.1.1 Stroop Color Word Test (SWT)
SWT is a neuropsychological test which has been developed by J.R. Stroop in 1935 and it has been widely adopted for experimental as well as clinical purposes. SWT was composed of three different tasks (Stroop, 1935), where the first task consists of names of all colors written in black, in the second task the names of the colors and the color of the written text are different, whereas, in the third task, there are squares of different colors. During the test, a participant should answer the color of the word and not the word itself. In another version of SWT, three tasks were named as neutral (introductory session), congruent or non-conflict task, and non-congruent or conflict task. In the introductory session, all color names are written in black. In the congruent session, all color names are written in the same color as the color name. Whereas, in the non-congruent session, the name of the color is written in a different color from the color name. SWT has undergone a wide range of changes since its inception in 1935. The alterations include an increase or decrease in the task duration, the addition of more colors to the experimental tasks, and the selection of one or more non-congruent colors among the number of congruent colors. Stroop color-word test has been widely used in brain imaging and human attention measurement studies (Pujol et al., 2001) and for the measurement and identification of human stress (Pehlivanoğlu et al., 2005; Tulen et al., 1989; Svetlak et al., 2010; Renaud and Blondin, 1997; Zhai and Barreto, 2006; Lundberg et al., 1994; Alonso et al., 2015; Ren et al., 2012; Kurniawan et al., 2013; Giannakakis et al., 2017; Giakoumis et al., 2012; Karthikeyan et al., 2012; Krantz et al., 2004).
2.1.2 Mental Arithmetic Task (MAT)
MAT is one of the most commonly used stimuli for inducing stress (Lundberg et al., 1994; Ushiyama et al., 1991; Tomaka et al., 1994; Seraganian et al., 1997; Ring et al., 2002; Hassellund et al., 2010; Linden, 1991). Mental arithmetic task is a mechanism to increase the mental workload by performing a series of arithmetic operations with a varying range of difficulty. This stimulus is easy to implement and does not require any special instrument. Another variant of the mental arithmetic task is Montreal Imaging Stress Task (MIST) (Dedovic et al., 2005), which is a computer-based stress-inducing protocol mainly consisting of mental arithmetic problems and has been used as a stressor in several studies (Setz et al., 2009; Minguillon et al., 2016; Al-Shargie et al., 2015, 2016)
2.1.3 Cold Pressor Test (CPT)
The CPT is another stimulus that is commonly used for inducing stress in stress measurement experiments. CPT was first introduced by Hines and Brown in 1932 (Hines, 1932). In particular, CPT involves immersion of the human hand or limb in cold water for a duration of 2 to 3 minutes. During this experiment, the subject feels uncomfortable and it is painful to adapt to a particular temperature for quite some time. The CPT protocol is widely used in laboratory experiments because of its ease of use. CPT triggers the activation of the sympathetic nervous system which increases blood pressure, heart rate, and skin conductance of the human body (Lovallo, 1975). A rise in cortisol level is also observed during CPT (al’Absi et al., 2002; Bullinger et al., 1984). Various versions of CPT have been used in different experiments which include immersion of both hands (Suter et al., 2007) or both feet in hot or cold water (Previnaire et al., 2012). In (Frings et al., 2013), bilateral foot immersion was used to elicit stress response increasing salivary cortisol concentration and heart rate. In (Hassellund et al., 2010), the author conducted a study in which the right hand of the subject was immersed completely in cold water for a time duration of one minute. In another study (Shi et al., 2010), the participant was asked to keep their hand in ice water until they started to feel discomfort.
2.1.4 Social Evaluative Tasks
Psycho-social stress is a type of human stress which occurs when an individual has to face people or a group of people as in public speaking task. When a socially threatening situation occurs, two mechanisms of the human body are affected, which include the autonomic nervous system and the neuroendocrine system. Hypothalamus activates both these systems to monitor the environmental demand (i.e., stress) as well as the internal state of the subject (Bitsika et al., 2014). Based on these two mechanisms, physiological as well as behavioral response is activated to generate a fight-or-flight response (Taylor et al., 2000). The physiological system of a human being is affected and has an immediate impact with exposure to a social stressor (Dickerson and Kemeny, 2004). Exposure to social stressors has been the cause of many diseases including depression (McEwen, 2005), cardiovascular diseases (Kemp et al., 2012), and immune dysfunction (Glaser and Kiecolt-Glaser, 2005). Obesity, anxiety, and psychosocial stress have also been found interlinked with each other (Pittig et al., 2013). Hence, curing social stress is important, towards which exposure therapies have been developed to treat anxiety. Real-life social evaluative situations generate psychosocial stress (Wolpe, 2013).
Instead of real-life events exposure, virtual reality has also been used as a stressor (Parsons and Rizzo, 2008). Virtual reality exposure therapy (VRET) is an intermediate phase between thoughts and real-life events. Virtual reality is useful for a person who has difficulty imagining fearful tasks. VRET has also the advantage that if the stimuli become too threatening for the patient, the therapist has the control to stop the stimuli. VRET is a very effective method of treating social anxiety and based on this VRET patients learn methods to face such a threatening situation in real life (Bordnick et al., 2012). The public speaking task as a social stressor has been a focus in very few studies. Existing literature either focuses on the real audience (Kudielka et al., 2009) or a virtual audience (Slater et al., 2006; Felnhofer et al., 2014). A complete study based on different physiological measures to find the impact of social stress in the real world as well as a controlled environment is still pending.
Existing literature has shown that a virtual audience has been able to induce stress based on a virtual public speaking task based on heart rate and self-reported anxiety measure (Slater et al., 2006; Felnhofer et al., 2014; Pertaub et al., 2002). Moreover, literature exists on the comparison of stress based on gender. It is shown in (Kudielka et al., 2009) that when men and women are both subjected to real-life stressors, no significant difference based on gender was found. HPA has also been found to have no changes between male and female participants (Kelly et al., 2008). It has been established in the literature that women have a decreased happiness level after facing social stressors. A study presented in (Hemmeter et al., 2005) shows that men have higher cortisol concentration than females when facing a virtual stressor. Social rejection shows higher cortisol levels in women as compared to men in a study given in (Stroud et al., 2002). In (Kothgassner et al., 2016) author examined the stress response of a public speaking task in front of a real audience, a virtual audience, and in an empty lecture hall. Gender difference in stress response was also evaluated and heart rate, heart rate variability, and saliva cortisol were used as a parameter of measurement.
2.1.5 Music
The effect of music on human stress has also been the subject of various studies. In (Escher et al., 1993), authors experimented with cortisol changes and found that positive cortisol changes occur when the subject was asked to listen to music before and during stressful medical treatment. In (Suda et al., 2008), the author has demonstrated the effect of music on suppressing stress with an increase of cortisol level whereas, on the other hand in another study, the authors have demonstrated the fact that for a non-music condition, the cortisol levels decreased after the stressor period (Khalfa et al., 2003). Another parameter of research is the effect of music on the SNS system of an individual. Different experiments have been conducted in this regard to establish the effect of music on the SNS system. In (Bartlett, 1996), a decrease in SNS activity was observed in response to music. But few other studies contradict these findings. An investigation into the fact that whether human stress is relieved due to music is reported in (Allen et al., 2001). It was concluded that the level of relaxation and the ability to cope with challenges is increased with a decrease in the perceived level of stress of an individual. A decrease in anxiety in response to listening to music is a consistent finding of many studies (Knight and Rickard, 2001). Few studies exist that have reported no reduction in anxiety in response to music (Evans, 2002).
2.1.6 International Affective Picture System (IAPS)
IAPS is a collection of photos that have been widely used to elicit an emotional response either positive or negative in the viewers (Lang et al., 1997). IAPS is a set of photos that have been evaluated on a 9-scale rating of valance and arousal. IAPS has been used as a very effective tool to induce stress in stress recognition experiments (Baltaci and Gokcay, 2016; Liao et al., 2005; Giannakakis et al., 2017; Nhan and Chau, 2009; Khalilzadeh et al., 2010). The database is developed by the National Institute of Mental Health Center for Emotion and Attention at the University of Florida and is composed of 956 images that have been categorized into pleasant (to elicit positive feelings), non-pleasant (to elicit negative feelings) and neutral images. The database consists of a normative rating which is developed on three dimensions i.e., valance, arousal, and dominance, representing the average rating of the emotion induced by each picture. This rating helps the researchers using IAPS in their research to select an appropriate set of images for inducing relevant emotions. The establishment of this type of average rate is termed standardization by psychologists. The standard rating of IAPS was obtained from 100 students composed of 50 males and 50 females having US-American origin. Normative rating of IAPS is also obtained from non-US participants of other origins i.e., Hungarian (Deák et al., 2010), German (Grühn and Scheibe, 2008), Portuguese (Lasaitis et al., 2008), Indian (Lohani et al., 2013), and Spanish (Dufey et al., 2011). Various kind of physiological modalities which include fMRI (Caria et al., 2010), EEG (Hajcak and Dennis, 2009), magnetoencephalography (Styliadis et al., 2015), skin conductance (D’Hondt et al., 2010), heart rate (Bradley et al., 2001), and electromyography (Baglioni et al., 2010) have been used along with IAPS stimulus.
2.1.7 Trier Social Stress Test (TSST)
TSST is a psychological stress-inducing protocol in the laboratory environment and was developed by Clemens Kirschbaum in 1993 (Kirschbaum et al., 1993). TSST consists of two parts which include an anticipation period of 10 minutes and a test period of 10 minutes in which the subject has to deliver a speech and perform a mental arithmetic task in front of an audience. TSST has been used in a variety of stress measurement studies for inducing stress (Kurniawan et al., 2013; Engert et al., 2014; Vinkers et al., 2013; Nater et al., 2005).
2.2 Publicly Available Datasets for Human Stress Detection
Only a few human stress assessment datasets have been curated by the research community and are publicly available for further research. In this section, we present details of publicly available data for this task using physiological signals. A human stress measurement data (https://physionet.org/content/drivedb/1.0.0/) to measure the driver stress using physiological signals of electrocardiogram, electromyogram, skin conductance, and respiration is presented in (Healey and Picard, 2005). The physiological signals from 24 drivers were acquired during three different phases i.e., the rest condition, highway driving, and city driving. The three conditions (rest, highway, city) under which the data is acquired were mapped onto three stress levels i.e., low stressed, medium stressed, and highly stressed, respectively. One of the major limitations of this database is that the sampling rate of all the acquired physiological sensors is low e.g., the electromyogram signal is recorded at a sampling rate of 15.5 Hz.
Another dataset to measure driver workload (http://www.hcilab.org/automotive/) using physiological signals of heart rate, skin conductance, and body temperature and GPS, acceleration, and brightness level data obtained from the smartphone are presented in (Schneegass et al., 2013). The data from 10 drivers (7 males and 3 females) is acquired while driving on the pre-defined route of 23.6 km on five different road types i.e., 30 km/h zone, 50 km/h zone, highway, freeway, and tunnel. Moreover, the labels depicting different levels of workload i.e., no workload to maximum workload are also provided in the database. The dataset can be used for the assessment of different levels of workload based on physiological signals.
Another publicly available human stress measurement dataset (https://physionet.org/content/noneeg/1.0.0/) using bio-signals of electrodermal activity, temperature, acceleration, heart rate, and arterial oxygen level is presented in (Birjandtalab et al., 2016). It consists of data from 20 participants consisting of 16 males and 4 females. Data acquisition is performed under four different conditions i.e., relaxed state, physical stress, cognitive stress, and emotional stress. Relaxation condition is achieved by asking the participants to listen to a soothing music track. Physical stress is induced by making the participants jog on a treadmill at 3 miles/hour. Cognitive stress is elicited by asking the participants to count backward from 2485 in a step of seven. Lastly, emotional stress is evoked by watching a video clip from a movie.
Another dataset (https://osf.io/c42cn/wiki/home/) to measure the driver’s behavior under different kinds of emotional, cognitive, and startling stressors which are the major cause of accidents is presented in (Taamneh et al., 2017). The dataset was acquired by involving 68 drivers, who drove under four different conditions i.e., no distraction, emotional distraction, cognitive distraction, and sensorimotor distraction in a controlled environment in a driving simulator. Modalities used for acquiring the driver response include heart rate, respiration rate, facial expressions, gaze, and electrodermal activity from the palm of the subject. Different types of subjective questionnaires were used to measure the cognitive state, personality type, and task load of the subject.
WEarable Stress and Affect Dataset (WESAD) (https://ubicomp.eti.uni-siegen.de/home/datasets/) is a publicly available data consisting of physiological and motion data of subjects for both emotion and stress stimuli (Schmidt et al., 2018). Here 15 participants were involved in the experiment which includes 12 male and 3 female participants and the data were acquired in the laboratory setting. Data for each subject were recorded in three different conditions i.e., baseline recording done by performing a reading task, funny condition achieved by watching a set of funny videos, and stressed condition achieved by exposure to trier social stressor test. Sensor modalities used in the data acquisition include electrocardiography, electrodermal activity, electromyography, blood volume pulse, respiration, body temperature, and three-axis acceleration.
A multimodal Smart reasoning system for WELL-being at work and at home Knowledge Work (SWELL-KW) dataset (http://cs.ru.nl/~skoldijk/SWELL-KW/Dataset.html) for research on human stress and user modeling is developed in (Koldijk et al., 2014). Data were curated from 25 participants performing a variety of knowledge work tasks, which included report writing, preparing presentations, checking emails, and information search. Stress was induced by telling the participants that they have to present one of the prepared presentations to get the full experiment participation fee. Data for each participant were recorded for a duration of three hours, which was subdivided into three one-hour blocks. Each block started with an eight-minute relaxation period block and then after that, the participant was assigned to the tasks on which he/she has to work. The participants had to write two reports and prepare one presentation in each block of the experiment. Stress was induced by showing a countdown timer flashing the remaining time for task completion.
A dataset (https://catalog.ldc.upenn.edu/LDC99S78) to measure the effect of human stress on speech signals was presented in (Steeneken and Hansen, 1999). Three different databases named Speech Under Stress Conditions (SUSC), Speech Under Simulated and Actual Stress (SUSAS), and DERA License Plate (DLP) datasets were developed in this research work to develop robust speech processing algorithms for the identification of human stress in the speech signals. Towards this, 32 speakers constituting 19 male and 13 female participants with an age bracket ranging from 22 to 76 years participated in the experiment to record 16,000 voice samples. The speech signals were sampled using a 16-bit analog-to-digital converter at a sampling rate of 8 kHz.
Another dataset (https://www.sensornetworkslab.com/clas) for Cognitive Load, Affect and Stress Recognition (CLAS) was presented in (Markova et al., 2019). The database consists of the physiological recording of ECG, PPG, and EDA and motion data of accelerometer from 62 healthy participants (45 men and 17 women) with ages ranging from 20-50 years. The data was acquired while performing three interactive and two perspective tasks. The interactive tasks include mathematical problems, logic tasks, and Stroop color-word tests, whereas perspective tasks are composed of images and audio-video stimuli. All the physiological signals were acquired at a sampling rate of 256 Hz with a resolution of 16 bits per sample.
Another publicly available dataset for the assessment of social stress in humans using physiological signals of blood volume pulse and electrodermal activity is presented in Meziatisabour et al. (2021). Moreover, video recording was done to measure the remote photoplethysmography and facial features. A total of 68 undergraduate students from the psychology department participated in the experiment. The Competitive State Anxiety Inventory (CSAI) questionnaire was used to measure the three dimensions of self-reported anxiety which include cognitive anxiety, somatic anxiety, and self-confidence. Trier Social Stress Test has been used as a stimulus during which the physiological signals and the video recording is performed.
A perceived human stress measurement dataset (https://sites.google.com/site/simplrgp/resources) using EEG signal was presented in (Arsalan et al., 2019). The database consists of EEG recordings from 28 participants (13 male and 15 females) with ages ranging from 18 to 40 years, in three different phases of the experiment i.e., pre-activity, during activity, and post-activity. EEG recording was performed while the participant was delivering a presentation on an unknown topic for a time duration of five minutes. Subjective scores from the perceived stress scale questionnaire were also recorded.
3 Subjective Stress Assessment
Subjective measures for human stress assessment have been traditionally used for many decades. While here our objective is to review methods that use data from wearable and non-wearable sensors for automated stress detection using artificial intelligence. However, subjective measures are explored herein for completeness. Further, such assessments have been used to benchmark machine learning-based methods. Towards this, there exists a wide range of questionnaires developed by psychologists for measuring different types of stress. These measures are based on the questionnaire being filled out by the subject. Psychological questionnaires are being used by the researchers to validate the objective measures obtained from the sensors. Perceived stress scale (PSS) questionnaire (Cohen et al., 1983) is commonly used by psychologists to measure chronic stress. Acute stress disorder (ASD) scale questionnaire (Bryant et al., 2000) is developed by psychologists to measure acute stress. Some of the other questionnaires used by the psychologists are relative stress scale (RSS) (Ulstein et al., 2007), daily stress inventory (DSI) (Brantley et al., 1987), brief symptom inventory (Derogatis and Spencer, 1993) and trier inventory for the assessment of chronic stress (TICS) (Schulz and Schlotz, 1999). A brief review of the commonly used questionnaires for stress assessment is given below.
3.1 Acute Stress Disorder (ASD)
ASD is a subjective self-reporting questionnaire inventory that is used to quantify acute stress disorder and post-traumatic stress disorder. ASD is a self-reporting version of the Acute Stress Disorder Interview (ASDI) questionnaire. ASD was developed with three aims i.e., (a) identification of ASD, (b) a self-report version of ASDI, and (c) a measure of post-traumatic stress disorders (PSTD). It is a 19-item questionnaire and is compliant with the Diagnostic and Statistical Manual of Mental Disorders criteria. The scale has been successfully used to measure the acute stress order among a wide range of subjects (Bryant et al., 2000). The 19 questions of the ASD questionnaire are composed of 5 dissociatives, 4 reexperiencing, 4 avoidance, and 6 arousal items. The questions for the ASD questionnaire are rated on a five-point Likert scale, where 1 means that a condition did not occur at all and 5 means the particular situation occurred very strongly. The minimum score of the questionnaire can be 19 and the maximum score of 85. A study to analyze the factor structure of acute stress disorder in the earthquake victims of the Chinese population is conducted in (Wang et al., 2010). The study was conducted on a sample of 353 samples consisting of 180 men and 173 women with a mean age of 29.36 and a standard deviation of 11.45. The study concluded that a four-factor model consisting of dissociation, reexperiencing, avoidance, and arousal is consistent with the conceptualization of ASD. A wide range of studies has been conducted to establish a correlation between PSTD and ASD. The studies report that around three-quarters of the survivors of trauma patients who show symptoms of ASD ultimately develop PSTD (Harvey and Bryant, 1998, 1999, 2000; Brewin et al., 1999). A study conducted for motor vehicle/industrial accidents in (Harvey and Bryant, 1998) found a 3-factor model consisting of acute post-traumatic stress reactions, dissociative symptoms, and dissociative amnesia. The study was conducted on 99 participants consisting of 65 men and 34 women with a mean age of 31.59 and a standard deviation of 11.28.
3.2 Brief Symptom Inventory (BSI)
BSI is a questionnaire developed by a psychologist to measure psychological distress and psychiatric disorders in people (Derogatis and Spencer, 1993). The data collected from the questionnaire can be used to diagnose and treat the patients. BSI is a 53-item questionnaire with each question being answered on a five-point scale of 1 to 5. The 53 items of BSI consist of questions of nine symptoms dimensions including Somatization, Obsession-Compulsion, Interpersonal Sensitivity, Depression, Anxiety, Hostility, Phobic Anxiety, Paranoid Ideation, and Psychoticism, and three indices of distress i.e., Global Severity Index, Positive Symptom Distress Index, and Positive Symptom Total. The time required by the subject to complete the questionnaire is approximately 8 to 12 minutes. The respondent to the questionnaire answers the questions on a scale from 0 (condition never occurs) to 5 (a condition that occurs very frequently). The minimum score of the questionnaire can be 53 whereas a maximum score of 265 can be recorded. The somatization dimensions are calculated from items 2, 7, 23, 29, 30, 33, and 37, obsession-compulsion dimension is obtained from items 5, 15, 26, 27, 32, and 36, interpersonal sensitivity is measured from items 20, 21, 22, and 42, depression dimension is evaluated from items 9, 16, 17, 18, 35, and 50, anxiety is obtained from items 1, 12, 19, 38, 45, and 49, hostility dimension is calculated from items 6, 13, 40, 41, and 46, phobic anxiety is taken from items 8, 28, 31, 43, and 47, paranoid ideation is evaluated from items 4, 10, 24, 48, and 51, and psychoticism is measured from items 3, 14, 34, 44, and 53 of the questionnaire. Items 11, 25, 39, and 52 did not contribute to the calculation of any dimension but they are recorded because of their clinical importance. Global Severity Index is calculated by the sum of the items of all the nine dimensions as well as the four items which were not included for the calculation of any dimension and then dividing the sum by the total number of items a particular person answered. The positive Symptom Total is calculated by counting the number of items whose responses are non-zero. Positive Symptom Distress Index is obtained by dividing the sum of the non-zero response items by the positive symptom total. BSI has been used for examining the relationship among psycho-social family risk factors, parental psychological distress, and quality of life in pediatric cancer survivors in a study conducted in (Racine et al., 2018). The study reports that families having a low level of distress have a lesser impact on the quality of life of pediatric cancer survivors. The relationship between psycho-pathological symptoms and technological addictions has also been studied. In a study conducted among 126 university students, the nine dimensions obtained from the BSI questionnaire were found to be significantly correlated to internet addiction (Adalıer and Balkan, 2012). A significant association was found between anxiety level and internet addiction in adolescents in a study conducted in (Stavropoulos et al., 2017).
3.3 Relative Stress Scale (RSS)
RSS is a commonly used subjective marker to measure the psychiatric disorders among the individuals who act as caretakers of dementia patients. It is a 15-item questionnaire and is a reliable measure of stress disorders among the carers of dementia patients. The items of the questionnaire are scored on a scale of 0 to 5, where 0 means a particular event never occurred and 5 means a particular event occurs very frequently. The minimum score of the questionnaire is 0 whereas the maximum score is 60. Age gender, education, occupation, and the relationship of the carer with the patient are also recorded in RSS. The carer of the patients was also asked to specify their routine and estimated time they used to take care of and assist the patient in a week. The RSS questionnaire covers many different aspects of the carer burden like a subjective emotional response (emotional distress), the negative feeling associated with the behavior of patients (negative feelings), and restrictions in the patient carer’s social life (social distress). Question items 1, 2, 3, 4, 5, and 6 of the RSS questionnaire measures emotional distress, items 7, 8, 9, 10, 11, and 13 measure social distress, and items 12, 14, and 15 measure the negative feelings of the patient carers. Emotional distress in carers is directly proportional to the amount of time spent per week with the patient and more specifically the emotional distress is higher in female carers supporting the fact that female carers are more emotional in their approach (Fitting et al., 1986) whereas their counterpart males are more task or goal oriented (Corcoran, 1992). Social distress is also higher in carers who spend more time with the patients and patients with high social distress need help and a break from caring for dementia patients. The negative feelings in the carer are associated with the patient’s age, i.e., the younger the patient, the more negative feelings that occur in the patient’s carers. RSS has been widely adopted in Norway for clinical purposes and research to measure the carer burden (Brækhus et al., 1999; Thommessen et al., 2002). RSS has been used in literature for the validation of the distress scale of the Neuropsychiatric Inventory (Kaufer et al., 1998). In (Greene et al., 1982), RSS has been used to provide a useful basis for discussion with carers of dementia patients.
3.4 Daily Stress Inventory (DSI)
DSI is another measure developed to provide research scientists and doctors with information about the psychiatric issues of patients after they have gone through some stressful events. DSI is specifically designed for the measurement of small stressful events that need to be measured on daily basis. DSI possesses useful and unique qualities for the measurement of stressful events. DSI is a 58-item questionnaire that allows the participant to indicate the events which occurred in the last 24 hours. After indicating the events that occurred, the subject rated the stressfulness of those events on a Likert-type scale from 1 to 7. 1 refers to the events which occurred but they were not stressful whereas a score of 7 means that a particular event caused panic to the subject. At the end of the DSI inventory, two blank items were provided to let the subject report those events which were not included in the 58 items. However, the scores of the blank items were not counted toward the calculation of stress scores. The minimum score of the DSI inventory can be 58 whereas a maximum score of 406 can be obtained. Three different scores are computed for each individual, (i) the number of events that are reported by the subject to have occurred, (ii) the sum of the total score of all these events, and (iii) the average of the scores of these events. DSI inventory has been used frequently in research studies and has shown good validity ad reliability (Maslach et al., 1997). DSI was aimed at daily monitoring over a course of seven to ten days to measure the changes in daily faced stressors and to observe the relationship of these stressors to physical and psychological symptoms (Brantley and Jones, 1993). This daily monitoring leads to a better association between these small stressors and the illness of the subject. A study conducted in (Goreczny et al., 1988) monitored 24 patients with asthma and chronic obstructive pulmonary disease. Daily stress score was recorded via DSI inventory and respiratory symptoms was recorded for a time of 21 days. The study depicted the fact that on a highly stressful day, asthma symptoms in patients worsened. DSI has been used for correlation with other medical conditions like headache (Mosley Jr et al., 1991; Waggoner, 1986), Crohn’s disease (Garrett et al., 1991) and diabetes (Goetsch et al., 1990).
3.5 Perceived Stress Scale (PSS)
PSS is a questionnaire developed to measure the chronic stress of an individual. The questionnaire assesses the extent to which an individual has been stressed in the last thirty days. PSS is a 10-item questionnaire scored on a scale of 0 to 4 where 0 means that a particular situation never occurred whereas 4 means a situation occurred very frequently. The score from all the items of the questionnaire is summed up to get the PSS questionnaire score. The minimum and maximum score that can be obtained from the PSS questionnaire is 0 and 40, respectively. PSS’s final score is obtained by reversing the four-item of the questionnaire which include items 4, 5, 7, and 8, and using the other items of the questionnaire as it is. PSS has been used in a wide range of studies for the assessment of chronic stress among individuals.
3.6 Trier Inventory for the Assessment of Chronic Stress (TICS)
The TICS is a standardized questionnaire for assessing nine interrelated factors of chronic psychosocial stress and is a very reliable and effective tool. The nine factors which are addressed by TICS include Work Overload (e.g., "I have too many tasks to perform."), Social Overload (e.g., "I must frequently care for the well-being of others."), Pressure to Perform (e.g., "I have tasks to fulfill that pressure me to prove myself."), Work Discontent (e.g., "Times when none of my tasks seem meaningful to me."), Excessive Demands at Work (e.g., "Although I try, I do not fulfill my duties as I should."), Lack of Social Recognition (e.g., "Although I do my best, my work is not appreciated."), Social Tensions (e.g. "I have unnecessary conflicts with others."), Social Isolation (e.g., "Times when I have too little contact with other people."), and Chronic Worrying (e.g., "Times when I worry a lot and cannot stop). TICS is a 57-item questionnaire that is rated on a 5-point scale from 0 to 4 based on whether the participant experienced a particular situation in the last 3 months or not. On the 5-point scale, 0 means a situation never occurred, 1 means a situation very rarely occurs, 2 means a situation sometimes occurs, 3 means a particular situation often occurs, and 4 means a particular situation occurs very frequently. The total score of the TICS questionnaire can range from 0 to 228. In a study conducted in (Sturmbauer et al., 2019), a correlation between the Stress and Adversity Inventory (STRAIN) with TICS and PSS was examined. It was found that STRAIN is more correlated to TICS as compared to PSS. A correlation between the TICS score and central serous chorioretinopathy (CSC) named syndrome in young and middle-aged adults was established in (Buehl et al., 2012). The study found that people with CSC syndrome have higher TICS scores as compared to individuals with no CSC syndrome.
Subjective measures of human stress have been widely used in the literature but there exist some limitations and shortcomings in these methods. One of the major shortcomings of these subject measures is that these questionnaires are being responded to by the subject himself and if the subject answers the items of the questionnaire in a biased manner then the score obtained for stress measurement is unreliable and incorrect. Secondly, to answer the questionnaires, the subject has to be literate and able to properly read the items of the questionnaire. Thirdly, the questionnaires for stress measurement are not available in all the languages thus creating a bottleneck and hence cannot be used by individuals whose first language is not the one in which the questionnaire has been developed. Keeping in view these limitations, using only subjective measures is not a reliable indicator of stress, thus objective measures of stress are essential for the development of better stress measurement protocols.
4 Objective Stress Detection
Objective measures of stress include physiological and physical measures. Physiological measures of stress need sensors to be connected to the human body at some specified location e.g., EEG, ECG, and EDA whereas, in the case of physical sensors the measurement can be done at a distance from the subject without the need of any physical contact. Objective measures of stress are free from human intervention and hence cannot be biased like the subjective questionnaire and it is the major benefit of objective measures over the subjective assessment of stress. Moreover, the studies which use objective measures of stress also validate their finding using subjective questionnaires (Healey and Picard, 2005). The data acquisition protocols in case of objective measures of stress are time-consuming and complicated and hence recording data for a large population sample is difficult. The limited capacity of the existing stress modeling protocol and the lack of a large data sample make it necessary to include the conventional subjective stress measurement methods for the validation of objective measures. It is because of these factors, subjective measures are still regarded as an efficient measure of stress (Ulstein et al., 2007; Weidner et al., 1989). In this section, we will discuss a general framework for human stress assessment and review all the literature available for human stress measurement using objective methods. The general machine learning framework of human stress detection includes data acquisition and annotation, pre-processing, feature extraction and selection, and classification steps that are shown in Fig. 1. Each of these steps plays a vital role in accurate human stress detection and is discussed below.
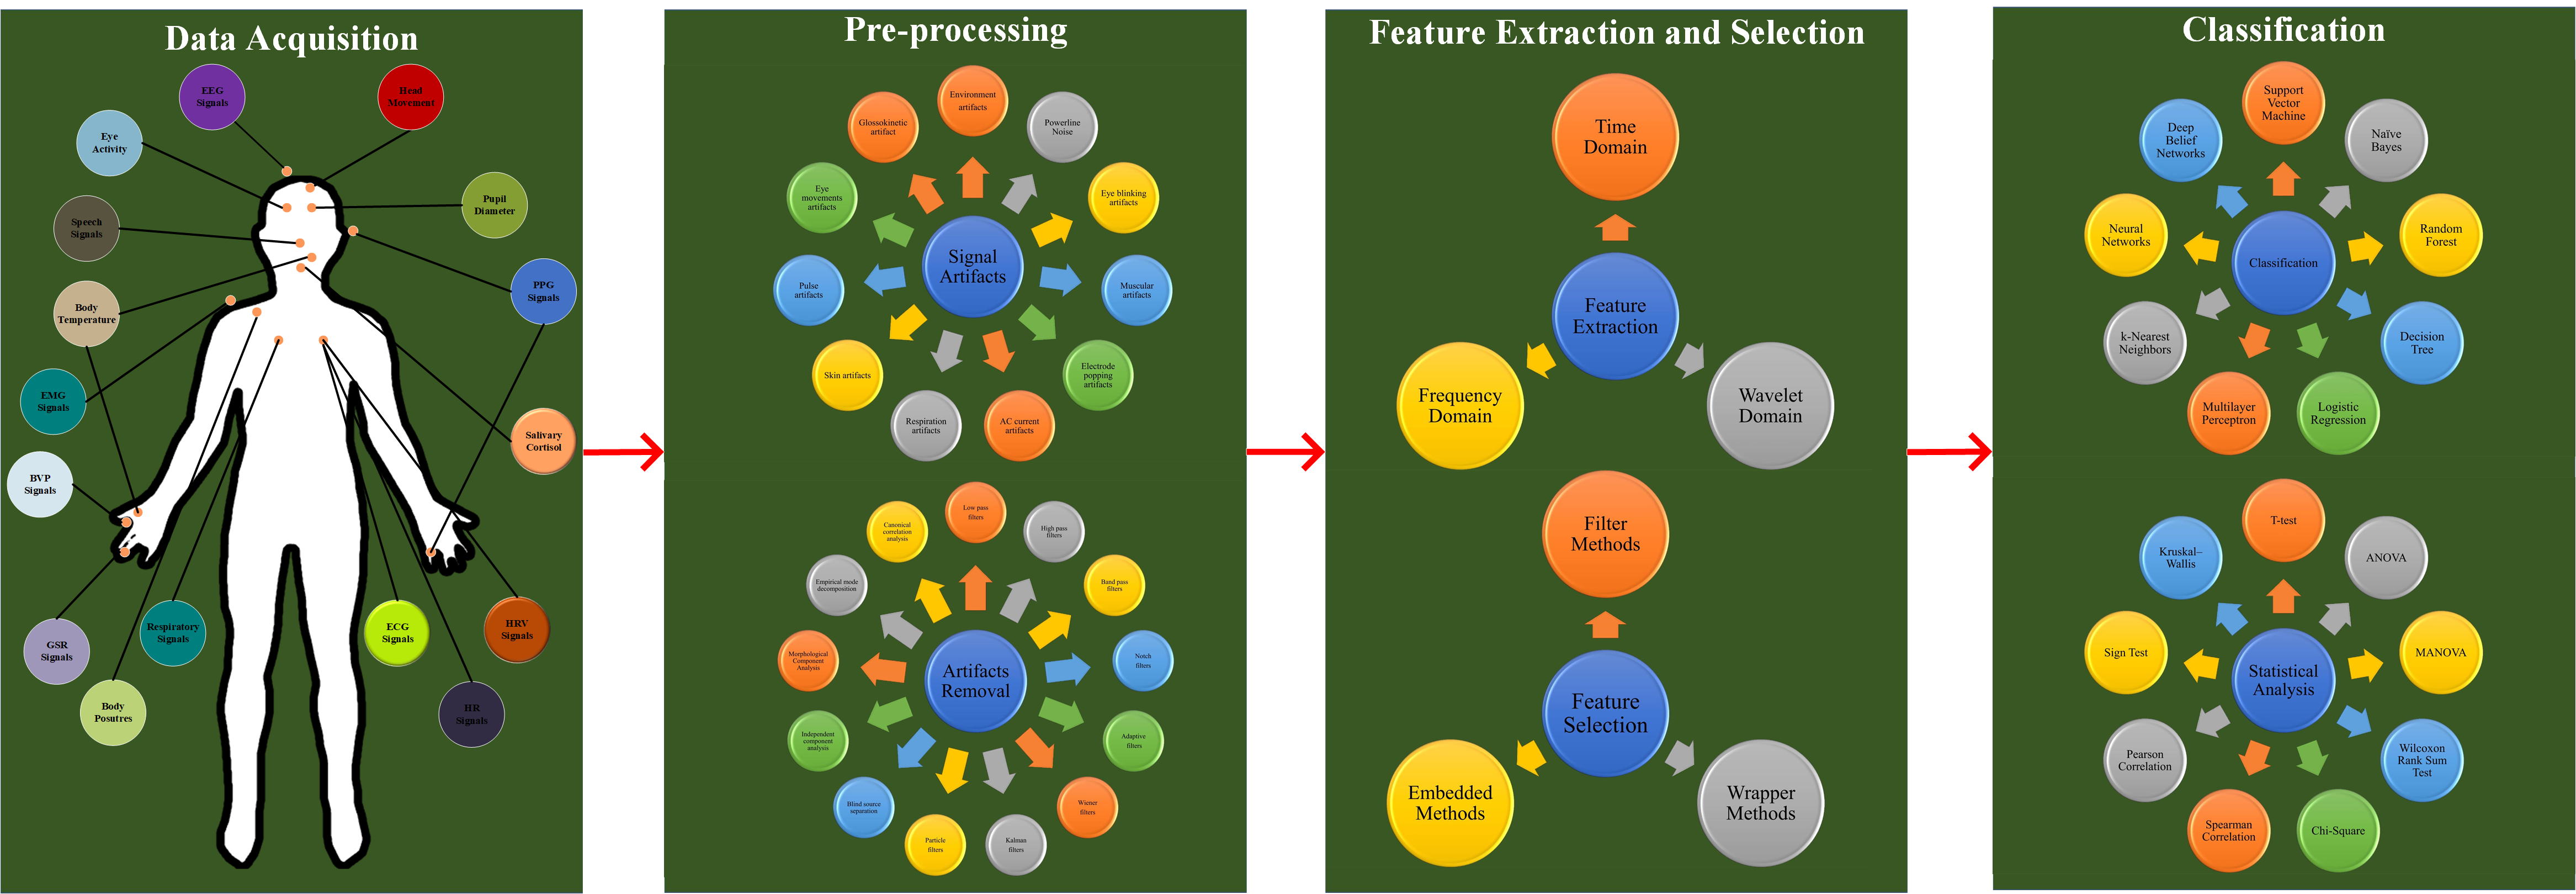 |
Data Acquisition and Annotation is one of the most important steps in the human stress detection framework. The quality of the acquired data is of utmost importance for the robust analysis of human stress and to draw a reliable conclusion. Before the start of data acquisition, a good experimental design following the standard protocols is needed. In stress measurement studies, there exist two types of experimental protocols which include (i) measuring stress induced by an external stimulus also called acute or instantaneous stress, and (ii) measuring perceived or chronic stress without using any external stimulus. Before data acquisition, the stress-inducing protocol which will be used needs to be defined. Another important factor that needs to be considered for data acquisition is whether the data need to be acquired in laboratory settings or out-of-laboratory environment. The number of participants in the experiment is also important because if the number of participants is small, the findings of the study could not be generalized and there is also a chance that data acquired from some participants might get corrupted on the other hand, acquiring data from a large number of participants is a time-consuming and cumbersome process to follow. The physical and physiological sensors for whom data is to be recorded should be selected before the start of data acquisition. In addition to the above-mentioned parameters, another important factor that needs to be considered in data acquisition is data annotation. Data annotation is the process of assigning each training example of the data to a particular class depending on some criteria. Commonly used criteria for data annotation in stress measurement studies include the use of subjective questionnaire (Asif et al., 2019; Arsalan et al., 2019) and evaluation by psychologists (Saeed et al., 2020). This variation in the labeling technique also poses challenges to the comparison of the available techniques with each other.
Pre-processing is the second step in the stress detection pipeline and plays an important role in the whole process. Signals acquired by using wearable and non-wearable sensors during the data acquisition phase are affected by different kinds of noises which include power line (Lin et al., 2016), eye blinking artifacts (Shoker et al., 2005), muscular artifacts (Chen et al., 2014), and posture or physical activity (Alamudun et al., 2012). Noise removal techniques for pre-processing different kinds of modalities have been developed in the literature. Accelerometer sensor has been used in stress detection studies and the noise which affects accelerometer data is composed of high-frequency components and can be removed by using low-pass filtering. Authors have applied low pass filtering to remove high-frequency artifacts from the accelerometer signal in their stress assessment studies conducted in (Mozos et al., 2017; Gjoreski et al., 2017). Two of the main steps for pre-processing an ECG signal are to identify the R-peaks and RR interval. Algorithms like Pan and Tompkin’s algorithm (Pan and Tompkins, 1985) have been developed to identify the R-peaks of the ECG signal. Moreover, to identify the valid RR-intervals algorithms have also been proposed (Hovsepian et al., 2015). Pre-processing of PPG signals has been explored in the literature. PPG signals are affected by low-frequency noise which can be mitigated by the use of high-frequency filtering (Elgendi, 2012). Meaningful information in an EDA signal is normally contained in low-frequency components and the noise is the high-frequency component of the signal which can be removed by passing the EDA signal through a low-pass filter. Another important pre-processing task performed with the EDA signals is its segmentation into a slow-varying baseline conductivity known as skin conductance level (SCL) and a high-frequency component called skin conductance response (SCR). Authors in (Choi et al., 2011) have proposed a technique to separate the SCL and SCR components of the EDA signal. Techniques for pre-processing an EMG have been proposed in the literature. A two-step noise removal technique for EMG signals is proposed in (Wijsman et al., 2010). In the first step, band-pass filtering is applied to the EMG signal to limit the signal from 20 to 450 Hz. In the second step, power line interference is negated by applying notch filters at frequencies of 50, 100, 150, 200, 250, and 350 Hz. Another important contamination source for EMG signals is ECG signals i.e., cardiac artifacts. Different algorithms to remove cardiac noise from EMG signals have been compared in a study conducted in (Willigenburg et al., 2012).
Feature Extraction and Selection are critical for an efficient machine learning model. Feature extraction corresponds to the process of extraction of meaningful features from the acquired data. Meaningful features are the extracted set of features that are descriptive i.e., the features have discriminating values for instances from different classes. The extracted features constitute a feature vector which is fed as input to the classification stage. The extracted features can be categorized differently e.g., time or frequency or wavelet domain features, linear features vs non-linear features, and unimodal vs multimodal features. The computational complexity of the extracted set of features can range from simple statistical features e.g., mean, median, minimum, and maximum to complex features based on certain modalities. A different set of features are extracted from each sensor for human stress recognition. Some of the commonly used features for accelerometer sensors in stress recognition studies include mean, standard deviation, variance, maximum, absolute value, signal magnitude area, root mean squared, energy, differential entropy, discrete Fourier transform, peak magnitude frequency, peak power, and zero crossing (Garcia-Ceja et al., 2015; Can et al., 2019; Sano and Picard, 2013). List of some of the features extracted from ECG and the PPG signals in stress measurement studies include the mean and standard deviation of the R-R interval, root mean square difference of the consecutive R-R interval, heart rate, heart rate variability, mean R peak amplitude, mean standard deviation, skewness, kurtosis, percentile, geometric and harmonic mean, low-frequency power, high-frequency power, power ratio, crest time, and instantaneous pulse ratio (Bong et al., 2012; Ahn et al., 2019; Mohino-Herranz et al., 2015; Cho et al., 2019; Charlton et al., 2018). Common features extracted from the EEG signals in human stress measurement studies include divisional asymmetry, rational asymmetry, mean power, power spectral density, alpha asymmetry index, normalized band power, relative power, coherence, and amplitude asymmetry (Arsalan et al., 2019; Ahn et al., 2019; Asif et al., 2019). Looking at EDA-based human stress measurement studies, statistical features of mean, standard deviation, mean of the absolute values, root mean square, the proportion of negative samples, the slope of the EDA level, mean EDA peak rate, and height, minimum and maximum have been commonly used (Giakoumis et al., 2012; Setz et al., 2009). Feature selection is defined as a process that aims at selecting the subset of features that have the highest discriminative power and yield the highest classification accuracy from among the extracted set of features. Different features selection algorithms have been used in stress classification studies which include genetic algorithm (Shon et al., 2018), t-test (Saeed et al., 2020), minimum redundancy maximum relevance (mRMR) (Subhani et al., 2017), principal component analysis (PCA) (Deng et al., 2012), particle swarm optimization (PSO) (Yerigeri and Ragha, 2019), wrapper based feature selection (Hasan and Kim, 2019), Bhattacharya distance (Subhani et al., 2017), and independent component analysis (ICA) (Palacios et al., 2019).
Classification is the last step in the human stress detection framework and is an important part of the whole process. The classification process can be performed by either use of statistical measures (t-test or ANOVA) or by using machine learning techniques. For both types of techniques, the selected or extracted set of features is fed as input to the classification stage. The t-test is a type of inferential statistics test that is aimed at finding whether there is any significant difference between the means of two groups or not. The t-test is based on the assumption that the dependent variable of the data follows a normal distribution and we can identify the probability of a particular instance. T-test produces a p-value whose acceptable value is considered to be less than 0.05. A p-value of 0.01 means that the likelihood to get the difference in the two groups by chance is 1 out of 100 times. The t-test is applied to cases in which we need to find the difference between two groups where to find the difference between more than two groups ANOVA test is applied. The second type of method used for the classification of human stress in the literature includes machine learning techniques. A wide variety of algorithms depending on the situation have been employed in human stress recognition studies. Multilayer perceptron (MLP) is a type of feed-forward neural network which is composed of at least three layers i.e., input layer, hidden layer, and output layer. MLP has been used for binary as well as multi-class stress classification tasks in a wide range of human stress recognition studies (Arsalan et al., 2019, 2019). Another commonly used classification technique for human stress recognition is the Naive Bayes algorithm. The naive Bayes algorithm is a type of algorithm that is based on the Bayes probability theorem and the conditional probability rule. Some of the stress recognition studies which have used the Naive Bayes algorithm include (Ahuja and Banga, 2019; Saeed et al., 2017). Support vector machine has also been used in a sizable amount of human stress recognition studies. Support vector machine (SVM) is a supervised machine learning classifier and it works by defining a separating a hyperplane with the help of support vectors. Some of the human stress recognition studies involving the SVM classifier include (Saeed et al., 2018, 2020; Vanitha and Suresh, 2013; Attallah, 2020). k-nearest neighbors (kNN) is a type of supervised and non-linear machine learning algorithm used for classification tasks. k-nearest neighbors assign the new data point by calculating the distance of the point from the k-nearest neighbors and the data point is assigned to the class whose nearest neighbor has the lowest distance metric. The value of k can be any odd number i.e., 1, 3,5, etc. Higher the value of k, the more reliable results kNN produces. Some of the stress classification studies which have used kNN as a classifier include (Rahman et al., 2015; Karthikeyan et al., 2012; Shon et al., 2018). Some of the other classifiers used in stress recognition studies include logistic regression (Asif et al., 2019; Vasavi et al., 2018), deep belief networks (Song and Kim, 2017), deep neural network (Sardeshpande and Thool, 2019; Masood and Alghamdi, 2019), and random forest (Uddin and Canavan, 2019).
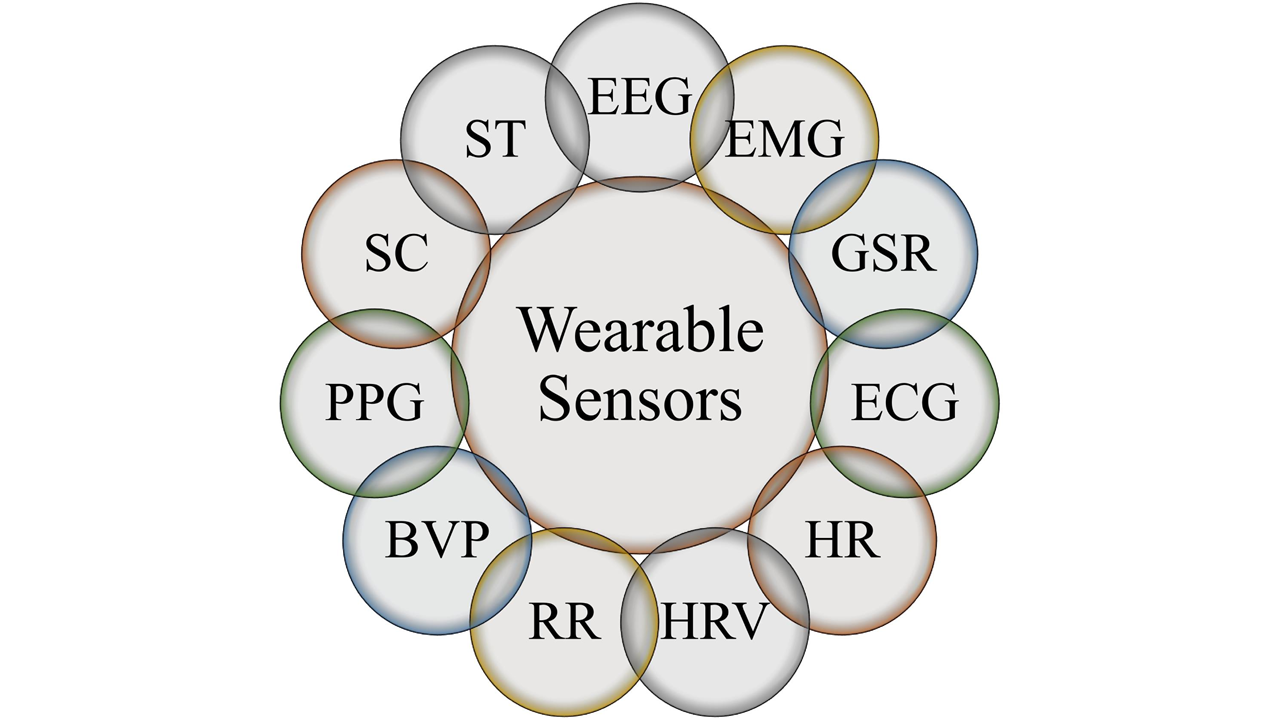
The objective measures of stress can be categorized into methods based on wearable sensors and non-wearable sensors as shown in Fig. 2 and Fig. 3 respectively. The literature corresponding to each of these categories is reviewed in the following subsections.
 |
 |
4.1 Wearable Sensors based Human Stress Detection
Wearable sensors need physical devices to be connected to the body of an individual to measure the stress response of the body. The autonomic nervous system (ANS) of a human being has two parts i.e., the sympathetic nervous system and the parasympathetic nervous system. When a person is under stress, changes in human ANS occur. Sympathetic nervous system (SNS) activity is increased whereas activity in the parasympathetic nervous system (PNS) decreases in stressful situations. Wearable sensors-based stress detection is important because it can overcome the limitation of wrong self-reporting by an individual (Garcia and Gustavson, 1997; Northrup, 1997). Wearable sensors used for human stress monitoring include electroencephalography (EEG), electromyography (EMG), galvanic skin response (GSR) or electrodermal activity (EDA), electrocardiography (ECG), heart rate (HR), skin temperature (ST), respiratory rate (RR), heart rate variability (HRV), blood volume pressure (BVP), photoplethysmography (PPG), and salivary cortisol (SC).
4.1.1 Electroencephalography based Stress Detection
Brain activity has a strong relationship with stress (Dharmawan, 2007). For analysis of brain activity, functional magnetic resonance imaging (fMRI), positron emission tomography (PET), and EEG are commonly used. Out of all these methods, EEG is the most commonly used method due to its low cost and non-invasive nature. EEG field originated back in 1924 when the first time EEG recording was performed (Berger, 1929). EEG is a physiological measure used by the research community as well as physicians to record brain activity for the analysis and diagnosis of brain diseases and disorders (Chandra et al., 2017). EEG signals acquisition can be performed using commercially available consumer-grade as well as medical-grade EEG devices. Medical-grade systems are quite expensive as well as sophisticated and are commonly used for patient monitoring in hospitals, whereas consumer-grade EEG headsets are less expensive but they are not as accurate when compared to medical-grade devices. Both types of systems can consist of dry as well as wet electrodes. Each type of electrode has its pros and cons and thus many factors contribute to the type of device, which is selected for data acquisition. Consumer-grade EEG headsets have several electrodes ranging from to (Sawangjai et al., 2019), whereas medical-grade EEG caps can have several electrodes ranging from to or even more (Troy M et al., 2012). EEG electrodes are small metal plates made of steel and have a silver coating to record brain activity. These electrodes are placed on the human scalp to record brain activity. International 10-20 electrode positioning system specifies the electrode positions in the EEG acquisition system (Technologies, 2012). Each electrode has a specified name comprising of a letter and a number and a location on the human head, which is standardized. The letter in the name shows the area of the brain where the electrode is placed e.g., F for the frontal lobe and T for the temporal lobe. The right side of the head has even-numbered electrodes, whereas the left side has odd-numbered electrodes (Oostenveld and Praamstra, 2001). EEG electrodes are connected to the data acquisition system in a wired or wireless manner. When there is a change in brain activity the voltage level at different electrodes varies, which corresponds to different diseases and disorders. Amplitude values of EEG signals are approximately around . EEG signal is composed of five different frequency bands. The behavior of each EEG frequency band is different in different situations. The frequency range of the EEG signal is from 1 Hz to 50 Hz. Based on the frequency ranges the descending order of brain waves is gamma, beta, alpha, theta, and delta.
-
1.
Gamma Band: The brain activity that lies in the range of 30 - 45 Hz is usually regarded as a gamma wave or fast beta wave. The occurrence of this wave is rare and associated with brain diseases. The gamma wave is considered a good indicator of event-related synchronization (ERS) of the brain. Tongue movement, right and left index finger movement, and right toe movement have been demonstrated to relate to gamma waves. The association of gamma-band and human stress has been established in literature (Minguillon et al., 2016).
-
2.
Beta Band: The electrical activity of the brain that lies in the range of 14 - 26 Hz is considered a beta wave. This rhythm is found in waking normal individuals and is associated with thinking, attention, focus, and a panic state. Beta activity is mainly originated in the frontal and central regions of the brain. It occurs around the tumor regions of the brain. Among different neural oscillations, a higher level of beta waves acts as a marker denoting that a person is not in a calm state (Sanei and Chambers, 2013). The presence of stress has been shown to increase the spectral power in the EEG beta band (Saeed et al., 2015; Hamid et al., 2015).
-
3.
Alpha Band: Alpha waves (8 - 13 Hz) can be detected in all parts of the posterior lobes of the brain and commonly appears like a sine wave or a round-shaped signal. Relaxed alertness without attention is considered associated with alpha waves. The alpha wave is the most observable brain activity due to its prominence. The alpha wave is claimed to be awaiting pattern by visual regions of the brain as in a closed eye state alpha wave is produced. Activities like opening the eyes, listening to unfamiliar sounds, anxiety, or mental attention can reduce or even eliminate the alpha waves. It has an amplitude that is normally less than 50 V and is found over occipital regions. Its origin and significance are not known physiologically and require more research and experimentation. Stress has been shown to be associated with a fall in alpha waves (Hoffmann, 2005).
-
4.
Theta Band: Theta waves (4 - 7.5 Hz) originate due to drowsiness and have been associated with creative inspiration and deep meditation. The arousal of an individual is determined by the theta wave. Pathological problems show larger groups of abnormal theta activity in waking adults. Variations in the theta activity are also used in human stress recognition-based studies (Arsalan et al., 2019).
-
5.
Delta Band: Delta waves (0.5 - 4 Hz) are considered to reflect deep sleep. and the slowest brain waves. Newborn babies and very young children have strong delta wave activities. As the age of the individual increases, the amplitude and occurrence of delta waves are reduced. Delta waves are associated with a deep level of relaxation. These waves can be confused with muscular artifacts produced by the neck and jaw. Therefore, these artifacts need to be removed by applying simple signal processing methods to the EEG signals.
Asymmetry analysis of the EEG signal is an established feature for the classification of different psychological states (Gatzke-Kopp et al., 2014; Giannakakis et al., 2015). The asymmetry index of the EEG signal is the difference between the natural logarithm of the power of the right hemisphere from the left hemisphere of the brain. Commonly used locations for the estimation of the alpha asymmetry in stress-related studies are F3-F4 (Seo et al., 2008; Lewis et al., 2007) because these locations are directly affected by the stressful events (Qin et al., 2009). However apart from the frontal part of the brain, stress-related studies involving lateral region i.e., F7-F8 (Lopez-Duran et al., 2012), anterior region i.e., Fp1-Fp2 (Peng et al., 2013), and posterior regions i.e., T5-T6 (Minguillon et al., 2016) of the brain have been reported in the literature. A large number of studies have a consensus over the fact that the alpha band activity in the right frontal part of the brain is dominating as compared to the left half of the brain under stressful condition (Acharya et al., 2012). This phenomenon is present in a variety of stressful situations like students feeling stressed during examinations (Giannakakis et al., 2015) when presented with a stimulus of sad/happy/horror movie (Lopez-Duran et al., 2012; Tomarken et al., 1990) and even in case of chronic stress (Peng et al., 2013).
The human stress response has been explored using power spectrum and relative power index in a significant number of studies (Hosseini et al., 2010; Khosrowabadi et al., 2011; Sharma and Gedeon, 2014; Ko et al., 2009; Giannakaki et al., 2017). Alpha band activity is dominant in the relaxation phase when the cognitive demands are minimal whereas on the contrary it has been found that situations involving high strain or alertness, beta-band activity is found to be significant (Hayashi et al., 2009). Even though the findings of the stress-related studies are contradictory, still stressful conditions has found to decrease the alpha band activity (Alonso et al., 2015; Demerdzieva, 2011; Al-Shargie et al., 2015; Tran et al., 2007; Seo and Lee, 2010) and increase the beta band activity (Katsis et al., 2011). Stress is found to be correlated to the beta wave in the temporal part of the brain (Choi et al., 2015). Coherence among different brain regions is another important factor that varies with stress. Beta and theta band coherence is increased whereas the alpha band coherence is decreased in the anterior location of the brain hemisphere (Alonso et al., 2015). When the person is having a negative mood or depression the alpha and beta band activity is dominant (Huiku et al., 2007). Alpha band activity of the prefrontal electrodes is reduced when the person is facing a stressful event (Marshall et al., 2015). The temporal lobe electrode shows a dominant activity of alpha-band when the stressful event occurs (Choi et al., 2015). To classify the mental stress from the resting state EEG a method is proposed in (Sharma and Gedeon, 2012).
Different level of mental stress is measured in participants using single-channel EEG headset and mental workload and public speaking task as a stimulus in a study conducted in (Secerbegovic et al., 2017). Alpha and beta bands of the EEG signal are found to be statistically significant bands and a classification accuracy of 83.33% for binary stress classification was reported. An EEG-based multiple-level human stress classification framework using 128 channels EEG cap and MIST as a stimulus was presented in (Subhani et al., 2017). The study reported an average classification accuracy of 94.6% and 83.4% for binary and multi-level stress classification respectively. Another study for acute stress classification using SWT as a stressor and EEG as a modality is presented in (Hou et al., 2015). Two, three, and four levels of stress were measured in this study with an average classification accuracy of 85.71%, 75.22%, and 67.06%, respectively. Another human stress classification study for two and three-class problems with the mental arithmetic task as a stimulus and Emotiv EPOC as an EEG data acquisition device is presented in (Jun and Smitha, 2016). Classification accuracy of 96% and 75% is achieved for two and three-level stress classes, respectively. A study in (Duru et al., 2013) focuses on stress level detection of the surgeon during the most stressful phases of an operation via EEG. In (Calibo et al., 2013) authors used the Stroop colored word test to elicit stress in the subjects. After applying preprocessing techniques to the EEG data, features were extracted for further analysis which was then classified using k nearest neighbor and logistic regression classifiers with an accuracy of 73.96%. In (Pomer-Escher et al., 2014) authors proposed a methodology for analyzing the stress of military firefighters based on asymmetry levels of alpha waves. In (Vijayaragavan et al., 2015), the authors developed an android application that reduces stress using music and yoga. EEG signals were recorded using the Neurosky headset and were preprocessed by using a high pass filter and proprietary algorithms of Neurosky. A survey of 100 users was conducted in which better relaxation waveforms were observed in the case of yoga by 67% members and 29% readings showed better results in the case of music and 4% reported no results. Hand movement, heart rate variation, and EEG are used to analyze stress, and office syndrome was detected by an intelligent watch in (Reanaree et al., 2016).
In another study, the mind-ball game has been used to establish a correlation between human stress and the winning percentage of the game. The study concludes that the person with a lower stress level wins the game more often (Lin and John, 2006). An EEG and Hilbert Huang Transform-based stress measurement method with a support vector machine (SVM) as a classifier has been proposed in (Vanitha and Krishnan, 2016). Another stress measurement scheme using EEG signals is proposed in (Kalas and Momin, 2016). A method of measuring mental stress is proposed based on the Montreal Imaging Stress Task (MIST) as a stimulus, power spectral density, and energy as a feature, and SVM as a classifier (Al-Shargie et al., 2015). Another EEG-based mental stress classification scheme using mental arithmetic tasks as a stimulus to classify stress into three levels is proposed in (Pandiyan et al., 2013). A stress classification framework in response to Urdu and English music tracks is presented in (Asif et al., 2019). Classification accuracy of 98.76% and 95.06% for two- and three classes is achieved using a logistic regression classifier. A driver stress measurement framework using an EEG signal has been presented in (Halim and Rehan, 2020). In the proposed scheme data from 86 automobile drivers were used. EEG data were recorded to log the ongoing brain activity during driving to find a correlation between the brain activity with the emotional response of the driver. Three different classification algorithms which include SVM, neural network and RF were used to classify the driver’s emotional state based on the labeling obtained by the self-reporting questionnaire. The SVM classifier was found to be the best among them with an achieved classification accuracy of 97.95% for stress vs relaxed state. An EEG-based multilevel stress classification scheme in nurses and non-health professionals is presented in Akella et al. (2021). An accuracy of 91% is reported for four-level stress classification. Another EEG-based stress measurement scheme using K-Means Clustering and Support Vector Machine classifier is presented in Wen and Aris (2022). An accuracy of 98% is achieved for three-level stress classification. An EEG-based stress recognition framework using Symmetric Convolutional and Adversarial Neural Networks is presented in Fu et al. (2022). The highest classification accuracy of 85.1% is achieved for five-level stress classification. Another EEG-based study to analyze the brain activity of stressed and non-stressed individuals in response to high arousal images as a stimulus is presented in Batool et al. (2022). The study found no significant difference in the EEG data for the two groups.
All of the EEG stress detection methods discussed above are for acute stress. EEG signals have also been used to assess and classify perceived stress. An EEG-based study to identify the appropriate phase of EEG recording for the classification of perceived stress is presented in (Arsalan et al., 2019). EEG data of the participants were recorded for a duration of three minutes in open-eye conditions before and after performing the public speaking activity. The study concluded that the pre-activity phase was better for perceived stress classification. Two-level and three-level stress classification were performed and the classification accuracy of 92.85% and 64.28% was achieved, respectively. A perceived stress classification study using closed-eye resting-state EEG data is presented in (Saeed et al., 2015). The authors reported that there exists a relationship between the PSS questionnaire score and the EEG data of the subject. The beta band of the EEG signal was found to be directly proportional to the level of perceived stress i.e., individuals having high perceived stress have increased beta-band activity and vice versa. Another single-channel EEG headset-based stress quantification study using resting-state and closed-eye EEG data is presented in (Saeed et al., 2017). Multiple linear regression analysis was performed and beta waves of the EEG signals were found to be the optimum frequency band for the prediction of the PSS questionnaire score of the subject with a confidence interval of 94%. The correlation-based feature selection (CFS) method has been used in an EEG-based perceived human stress classification scheme proposed in (Saeed et al., 2018). The CFS method yielded the result that beta and low gamma frequency bands have the highest correlation with the PSS score of an individual. A significant difference in the energy spectral density of the alpha and beta bands of the EEG signals in the right and left hemispheres of the brain for stressed and non-stressed individuals is observed in a study conducted in (Hamid et al., 2015). Alpha asymmetry has been found as a useful marker of the relationship between human stress and EEG signals in a study conducted in (Sulaiman et al., 2011). The left hemisphere of the brain has strong activity among individuals who have low chronic stress whereas, on the other hand, the right hemisphere of the brain has strong activation in subjects having moderate and high chronic stress. A study conducted in (Hamid et al., 2010) found that the PSS questionnaire score and ratio of alpha and beta band of the EEG signal have a negative correlation among themselves. Therefore individuals with high PSS scores have a negative ratio whereas individuals with low PSS scores have been found to have a positive ratio. The correlation of the EEG temporal characteristics with the recorded EEG signals and the PSS questionnaire score is presented in (Luijcks et al., 2015). The study concluded the fact that the theta and delta wave of the EEG signal of the participants having high PSS questionnaire scores has an increased activation in the post-stimulus phase when compared to the pre-stimulus phase. Moreover, theta band activity in the frontal part of the brain was higher in the post-stimulus phase. Another perceived stress classification study using resting-state EEG data based on the PSS questionnaire as well as psychologist interview labeling is presented in (Saeed et al., 2020). The study concluded that by using the psychologist interview labeling, a classification accuracy of 85.20% was achieved. Table 1 presents a summary of human stress classification schemes using EEG signals.
| Method | Type of Stress | Number of Subjects (M/F) | Age | Stimulus | Features Domain | Classifier | Accuracy (Classes) |
|---|---|---|---|---|---|---|---|
| (Halim and Rehan, 2020) | Acute | 86 | – | Driving | Time and Frequency | SVM, RF, NN | 97.95% (2) |
| (Subhani et al., 2017) | Acute | 22 | 19-25 | MIST | Frequency | LR, SVM, NB | 94.60% (2) 83.40% (multilevel) |
| (Dharmawan, 2007) | Acute | 20 (18/2) | 20-35 | Game | Frequency | DT | 79.08% |
| (Secerbegovic et al., 2017) | Acute | 9 (6/3) | 19.3-22.7 | MAT, Computer Games | Time and Frequency | SVM | 86.66% (3) |
| (Hou et al., 2015) | Acute | 9 | 21-28 | SCWT | Frequency | SVM | 85.71% (2) 75.22% (3) 67.06% (4) |
| (Jun and Smitha, 2016) | Acute | 10 (9/1) | 20-35 | MAT, SCWT | Frequency | SVM | 75.00% (3) 96.00% (2) 88.00% (2) |
| (Calibo et al., 2013) | Acute | 18 | – | SCWT | Frequency | LR, kNN | 73.96% (2) |
| (Hosseini et al., 2010) | Acute | 15 (15/0) | 20-24 | IAPS | Frequency | SVM | 82.00% (2) |
| (Giannakaki et al., 2017) | Acute | 5 (5/0) | 22-38 | IAPS | Frequency | RF | 75.12% (2) |
| (Al-Shargie et al., 2015) | Acute | 12 (12/0) | 20-24 | MIST | Wavelet | SVM | 94.00% (L1), 85.00% (L2), 80.00% (L3) |
| (Vanitha and Krishnan, 2016) | Acute | 6 | – | MQ | Frequency | hierarchical SVM | 89.07% (2) |
| (Asif et al., 2019) | Acute | 27 (13/14) | 20-35 | Music Tracks | Frequency | SMO, LR | 98.76% (2) 95.06% (3) |
| (Khosrowabadi et al., 2011) | Chronic | 26 (20/6) | 18-30 | University Exam | Frequency | kNN, SVM | 90.00% (2) |
| (Saeed et al., 2015) | Chronic | 28 (18/10) | 22-33 | Baseline | Frequency | SVM | 71.42% (2) |
| (Saeed et al., 2017) | Chronic | 28 (18/10) | 22-33 | Baseline | Frequency | NB | 71.42% (2) |
| (Saeed et al., 2018) | Chronic | 28 (18/10) | 22-33 | Baseline | Frequency | SVM | 78.57% (2) |
| (Saeed et al., 2020) | Chronic | 33 (20/13) | 18-40 | Baseline | Frequency | SVM | 85.20% (2) |
| (Arsalan et al., 2019) | Chronic | 28 (13/15) | 18-40 | Baseline | Frequency | MLP | 92.85% (2) 64.28% (3) |
LR: Logistic Regression, SVM: Support Vector Machine, kNN: k- Nearest Neighbors, NB: Naive Bayes, SMO: Sequential minimal optimization, RF: Random Forest, MLP: Multilayer Perceptron, DT: Decision Tree, NN: Neural Networks, MIST: Montreal Imaging Stress Task, MAT: Mental Arithmetic Task, SCWT: Stroop color-word test, IAPS: International Affective Picture System, MQ: Mathematical questions
4.1.2 Electromyography based Stress Detection
EMG is a biomedical signal that deals with the electric current generated in the muscles of the human body during its contraction representing neuromuscular activities. EMG signal is recorded via a device called an electromyograph. EMG signals are recorded by placing the sensors near the muscle whose movement needs to be measured. The amplitude of the signal lies in the range of 1-10 mV and the frequency range of the EMG signal is 0-500 Hz with the dominant frequencies between 50-150 Hz (De Luca, 2002). EMG is a complicated signal being controlled by the human nervous system and is strongly dependent on the physiological and anatomical characteristics of the skeletal muscles. EMG signals become noisy while moving through different tissues of the human skin. Moreover, the EMG data acquisition device acquires signals from various motor units resulting in an overlap of other muscles’ movement to the desired muscle movement.
Recently, the measurement of EMG signals using sophisticated equipment has gained a lot of interest in the field of biomedical engineering (Farfán et al., 2010). EMG has also been a focus of biomedical experts because of its clinical and diagnostic applications. Robotic arms and rehabilitation of patients have been potentially identified as key areas of applications for EMG signal recording. Motor Unit Action Potentials (MUAPs) (their shapes and firing rates) are useful for the treatment of a variety of neuromuscular disorders.
Advancement in the available signal processing techniques has made the design and development of state-of-the-art EMG detection and diagnosis techniques a practical possibility. A wide range of mathematical and artificial intelligence (AI) based techniques have gained attention (Reaz et al., 2006). Mathematical models used for EMG signal analysis include wavelet transform, Wigner-Ville Distribution (WVD), Fourier transform, and higher-order statistics. On the other hand, AI-based techniques used include artificial neural networks, dynamic recurrent neural networks, and fuzzy logic. The recorded EMG signal faces two important challenges which include (i) the signal-to-noise ratio (i.e., the ratio of the energy of the EMG signal to the energy of the noise) and (ii) distortion in the recorded EMG signal (i.e., there should be no alteration in the contribution of each frequency component of the signal). A typical EMG recording is done in two phases i.e., the baseline recording and EMG recording in response to some stimulus, and then measured as a ratio of baseline and stimulus-response. Baseline recording is necessary because this level is different for every individual depending on a variety of factors (Weyers et al., 2006). Facial EMG has been extensively used in the literature to record facial expressions in response to some kind of stimulus. This finding has been reported by Ekman and Friesen in their study in (Ekman et al., 1978).
The relationship between human stress and EMG signal has been discussed in a wide range of studies in the literature. A study to investigate the relationship between the changes in human stress level and muscular tension via EMG signal is presented in (Karthikeyan et al., 2012). Stroop color-word test was used as a stimulus and EMG data were acquired from the left trapezius muscle of the participants. Pre-processing of the acquired EMG data was performed using the wavelet de-noising technique and time-domain features were extracted from the data. kNN classifier was used and a classification accuracy of 90.70% was achieved. A study to validate the stress-EMG paradigm using an unpredictable and uncontrollable stimulus is presented in (Luijcks et al., 2014). The stimulus given to the participants was an electro-shocker to give electric shocks of 10 milliseconds duration. The experiment performed includes a 3-minutes baseline recording, 3 minutes recording before the stimulus, and 2 minutes post-stimulus recording. EMG activity of the trapezius muscles was significantly higher than in the pre-activity phase when compared to the other two phases of the experiment. The study concluded that the presented stimulus is a reliable and valid test to identify the difference between stressed and non-stressed individuals. The activities of the human muscles like the trapezius are associated with stress (Lundberg et al., 1994; Wijsman et al., 2010; Larsson et al., 1995). In (Lundberg et al., 1994), the author has designed an experimental study to investigate the effect of mental stress and physical workload separately and in the combined form on the perceived human stress, physiological signals, and the muscular tension faced by an individual by using EMG signal. Stressor given to the subjects includes mental arithmetic task, Stroop color-word test, cold pressor test, standardized test contractions (TC), and a combination of SWT with TC. The results indicate that when compared to baseline recording, stressors induced an increase in blood pressure, heart rate, salivary cortisol, urinary catecholamines, and self-reported questionnaire score. Mental arithmetic tasks caused a significant amount of increase in the EMG activity, SWT when used alongside TC produced more pronounced changes in the EMG signal as compared to SWT alone. The study concluded that an increase in muscular tension was observed when facing only mental stress as well as facing mental stress along with physical workload. Human stress measurement using EMG signals recorded from the upper trapezius muscle is presented in a study conducted in (Wijsman et al., 2010). The authors have designed two new stress measurement tests for the experiment. Three different stressful situations which include a memory task, a logical puzzle, and a calculation task were presented to the subject and EMG signals of the upper trapezius muscle were recorded. The study revealed the fact that EMG activity of the upper trapezius muscle was higher when facing a stressor as compared to rest condition thus making EMG signal a good indicator of mental stress. Another study to correlate mental stress, blood flow, and the EMG signals recorded from the upper trapezius muscles using the Stroop color-word test is presented in (Larsson et al., 1995). The study concluded that there was a decrease in muscle blood flow and an increase in heart rate during the stressor phase. EMG activity of trapezius muscle is increased in response to stress during cold pressor and Stroop color-word test (Krantz et al., 2004). Moreover, an increase in the blood pressure, heart rate, and urinary epinephrine and norepinephrine was observed when facing the stressor but no correlation could be found with the salivary cortisol measure. Another important finding of the study was that men have higher blood pressure and an increase in epinephrine as compared to women, whereas, on the other hand, women have an increased heart rate as compared to men. A positive correlation between the negative stress rating and EMG signal during work has been found in a study conducted in (Rissén et al., 2000). A study reported that the EMG of the trapezius muscle is increased under low or high mental workload during computer data entry work (Schleifer et al., 2008). Moreover, a decrease in the EMG-gap of the left, as well as right trapezius muscles, was greater during high mental workload as compared to low mental workload. Another study to measure the influence of EMG-based methods and human stress-based methods on the shoulder muscles forces is presented in (Engelhardt et al., 2015). Another study to analyze the stress in the lower back of a subject while at work for different postures and positions using the EMG signal is presented in (Tyagi et al., 2017). The study founds an application in the area of chair design for a comfortable sitting posture of an individual at work. Table 2 presents a summary of human stress classification schemes using EMG signals.
| Method | Type of Stress | Number of Subjects (M/F) | Age | Stimulus | Features Domain | Classifier | Accuracy (Classes) |
| (Karthikeyan et al., 2012) | Acute | 10 (0/10) | – | SCWT | Wavelet | kNN | 90.70% (4) |
SCWT: Stroop color-word test, kNN: k- Nearest Neighbors
4.1.3 GSR based Stress Detection
The skin response of an individual is affected whenever we confront an emotional stimulus like listening to audio, watching a video, or an emotional real-life event. It is pertinent to mention that whatever the reason for the emotional arousal i.e., whether it is due to happiness or excitement or due to fear, anger, depression, or stress, in either case, the skin response of the person changes (Farnsworth, 2018). The response of the human skin is not under human conscious control (Udovičić et al., 2017) and is dependent on the changes in the sweating pattern of a subject and thus reflects the behavior of the sympathetic nervous system (Wu et al., 2010). Another study supports the fact that some signals are generated from the sympathetic nervous system when a change in the skin conductance of a person occurs (Lidberg and Wallin, 1981). Sweat reaction occurs due to any emotional change that can be seen in the fingers and palm. The amount of salt in the human skin varies as a result of a sweat reaction thus causing a change in the electrical conductance of the skin (Ayata et al., 2017). As time goes on the sweat glands of a person become more active resulting in a dis-balance of positive and negative ions and thus as a result affecting the flow of current through the skin (Critchley, 2002).
GSR measurement locations are part of the body with a large number of sweat glands. There exist a variety of possible locations on the human body for the measurement of GSR. Common locations for measuring skin response include the fingers, shoulders, feet, and wrists of a person. According to the studies, the palm and fingers of the skin have the highest number of sweat glands and are used as a location for GSR recording in experiments. GSR activity is typically measured in “micro-Siemens ()” or “micro-Mho ()”. Sweating secretion is increased when a person faces some emotional stimuli, whether positive or negative and due to these measurable changes in skin conductance occurs.
One of the most widely used measures of skin activity is GSR, which is also called Electrodermal Activity (EDA) or Skin Conductance (SC). EDA is a physiological measure of the flow of electricity through human skin. Even a small amount of sweating, which is not visible to the naked eye on the surface of the human skin causes a change in its electrical conductivity. EDA can be divided into (i) Skin Conductance Level (SCL) which is the slowly changing part of the EDA, (ii) Skin Conductance Response (SCR) which corresponds to the peaks in the EDA due to some kind of stimulus, and (iii) Non-specific Skin Conductance Response (NS.SCR) which exists even without the existence of any external stimulus. The pattern of the skin response data is distinct according to the state of the person and is considered one of the reliable stress measurement method (Kurniawan et al., 2013). SCR part of EDA increases when encountered with an emotionally arousing situation (Dawson et al., 2007). NS.SCR part of the EDA corresponds to the cognitive processes and the psycho-physiological states (Nikula, 1991).
The skin conductance of a person is increased when the person is stressed, whereas skin conductance gets reduced when the person is relaxed (Liao et al., 2005). GSR has been used for cognitive load measurement in the literature (Shi et al., 2007). The index and the middle finger of the hand of the subject are commonly used as a location for the placement of GSR electrodes because of the existence of a sufficient number of sweat glands to measure the skin response changes. The use of GSR sensors for stress measurement has been the focus of study in (Healey, 2000). Whenever the person is under stress, the moisture in the human skin increases resulting in an increase in the SCL (Giakoumis et al., 2012; Blechert et al., 2006; Ritz et al., 2000; Reinhardt et al., 2012; Hoehn-Saric et al., 1989) and SCR (Setz et al., 2009; Ren et al., 2012; Lee et al., 2004; Blechert et al., 2006; Hoehn-Saric et al., 1989; Nomikos et al., 1968; Lanzetta et al., 1976) part of the electrodermal activity. SCR peaks commonly appear between 1.5 and 6.5 seconds after the start of the stimulus. In another study, SCL was found to be the most effective marker for measuring stress in comparison to HRV and EMG. Some of the commonly extracted features from the electrodermal activity for human stress detection include SCR frequency, SCR amplitude, SCR latency, SCR rise time, SCR half recovery, SCR recovery time, SCR response onset, and SCR half recovery. Another interesting fact observed in a study conducted in (Nomikos et al., 1968) is that even the expectation of a stressful situation that has yet not occurred can cause an increase in the EDA similar to the situation if the event has occurred. Many other factors that can affect GSR measurement include the temperature and humidity of the environment. In summary, it can be concluded that the SCR and SCL part of the EDA consistently increases under stress conditions. A chronic stress measurement mechanism using GSR signals is presented in (Panigrahy et al., 2017). Data from the participants is recorded in three different states i.e., sitting, standing, and sleeping. Stressed and relaxed conditions are discriminated against with a classification accuracy of 76.5%. Another human stress measurement scheme for the office environment using physiological signals of GSR is proposed in (Hernandez et al., 2011). An analysis of the self-reported measure obtained from the employees and call logs checked to determine the number of stressed and non-stressed calls were performed. The SVM classifier was used to classify the stressed and non-stressed individuals and a classification accuracy of 73% was achieved. Another framework for the measurement of stress at the workplace using EDA signal is proposed in (Kocielnik et al., 2013). Self-Assessment Manikin Questionnaire was used as a subjective measure and pre-processing of data were performed by the removal of data from the first 15 seconds and the last 10 seconds of the recorded signal. The authors did not report any classification accuracy but they stated that the results obtained from the analysis are meaningful and provide useful information. A likelihood ratios-based stress detection framework using EDA sensors is presented in Lee et al. (2021). An accuracy of 87.5% is achieved for stressed vs relaxed state classification. Table 3 presents a summary of human stress classification schemes using GSR signals.
| Method | Type of Stress | Number of Subjects (M/F) | Age | Stimulus | Features Domain | Classifier | Accuracy (Classes) |
|---|---|---|---|---|---|---|---|
| (Healey, 2000) | Acute | 9 | – | Car driving | Time | LDA | 96.00% (4) |
| (Blechert et al., 2006) | Acute | 42 (14/28) | 42.29.9 | Pictures | Time | DFA | 83.30% (2) |
| (Setz et al., 2009) | Acute | 33 (33/0) | 24.06 | MIST | Time | LDA | 82.80% (2) |
| (Ren et al., 2012) | Acute | 30 (14/16) | 26.82.56 | SCWT | Time | NB | 85.5% (2) |
| (Lee et al., 2004) | Acute | 80 | – | SCWT | Time | MLP, GRNN, ANFIS | 96.67% (2) |
| (Panigrahy et al., 2017) | Acute | 10 | – | Computer game | Time | J48 | 76.50% (2) |
| (Hernandez et al., 2011) | Acute | 9 (4/5) | – | Call center | Time | SVM | 73.41% (2) |
MIST: Montreal Imaging Stress Task, SCWT: Stroop color-word test, NB: Naive Bayes, MLP: Multilayer Perceptron, J48: Decision Tree, LDA: Linear Discriminant Analysis, DFA: Discriminant function analysis, GRNN: Generalized regression neural network, ANFIS: Adaptive network-based fuzzy inference system
4.1.4 Electrocardiography based Stress Detection
ECG is one of the most commonly used techniques for monitoring the functionality of the heart. ECG is a non-invasive modality used for the assessment of the electrical activity of the heart in real time. The activity of the heart is correlated to the human central system. Apart from the monitoring of heart functionality, it is also useful for human stress measurement (Ahn et al., 2019). The most commonly used method for the measurement of ECG is a 12-lead ECG technique. In this technique, nine sensors are placed on the human body at specified locations. Three main sensors are placed on the right arm, left arm, and left leg of the person. The sensor placed on the right leg act as a reference electrode for the ECG acquisition system. Even though the complete picture of the heart cannot be obtained by using only these three sensors, but a physician can use these schemes for quick analysis in case of emergency treatment. For higher resolution results, six sensors are placed on the chest of the individual. Using these nine sensors along with the leads (Lead I, Lead II, Lead III) interconnecting their results in a total of twelve leads. One of the most important advantages of this twelve lead system is that it gives detailed information about the heart activity of the subject thus leading to a better diagnosis and cure, whereas, on the other hand, the largest disadvantage of this 12 lead system is that it produces a huge amount of data especially when recording is done for many hours. ECG signals are characterized by peaks that include P, Q, R, S, T, and U. Each of these peaks has its characteristics and gives a piece of specific information about the heart activity of the individual (Al Khatib et al., 2007). Commonly used parameters for the assessment of ECG signals include P, PR, QRS complex, and QT. For medical purposes, all these four parameters are evaluated. For other applications, there may be some peaks that are more important than others.
A wide range of studies for human stress measurement using ECG signals has been presented in literature (Karthikeyan et al., 2012, 2011). A human stress classification scheme using ECG signal and mental arithmetic task as a stimulus is presented in (Karthikeyan et al., 2012). Statistical features are extracted using discrete wavelet transform and low and high-frequency bands of the ECG signals are analyzed separately. Three-level human stress classification i.e., low stress, medium stress, and high stress is performed using a kNN classifier. Maximum classification accuracy of 96.3% and 75.9% is achieved for low-frequency and high-frequency bands, respectively using the covariance feature. Another human stress recognition framework using ECG and discrete wavelet transform is presented (Karthikeyan et al., 2011). The Stroop color-word test is used as a stimulus and heart rate variability is extracted as a feature from the recorded ECG signal. An accuracy of 96.41% is achieved for stress vs relaxed state classification using the kNN classifier. Another human stress assessment scheme based on a mono-fuzzy index extracted from ECG or GSR signals is presented in (Charbonnier et al., 2018). Four different stress tasks are used in the experiment which includes a mental arithmetic stress task, a mental arithmetic control task, a trier social stress test, and a trier social control test, and a classification accuracy of 72% was achieved for stress and no-stress classes. In (Liu and Ulrich, 2014), the authors presented a stress classification scheme using ECG signals. The dataset used in the experiment was adopted from PhysioNet (Goldberger et al., 2000) and it consists of physiological signals of GSR and ECG recorded while drivers are in a rest state or were experiencing stressful events. Time and frequency domain features of the heart rate variability and spectral power of the ECG signal are used. An F-measure of 0.85 is achieved for stress classification using an SVM classifier. Acute stress classification using ECG signals is presented in (Tanev et al., 2014). Four different stimuli which include images, audio, mental tasks, and rest state are used in the experiment. Linear, as well as non-linear features, are extracted from the HRV data obtained from the ECG signals and classification accuracy of 80% is achieved for acute stress classification. ECG signal has been analyzed for human stress classification in (Bong et al., 2012). Time-domain features which include heart rate, mean R peak amplitude and mean R-R intervals are extracted from the ECG signal. kNN and SVM were used for classification and mean classification accuracy of 77.69% and 66.49% is achieved for two and three classes, respectively. Short-term ECG and heart rate variability signals are used for human stress classification in a study conducted in (Karthikeyan et al., 2013). The Stroop color-word test is used as a stimulus, and pre-processing of the acquired data is performed using a wavelet de-noising algorithm. Frequency domain features are extracted from the HRV signal which is obtained from the recorded ECG signals. Classification is performed using a probabilistic neural network and kNN classifiers with an average achieved an accuracy of 91.66%. A driver stress recognition framework using ECG is proposed in (Keshan et al., 2015). The study aimed at the classification of stress at three different levels i.e., low, medium, and highly stressed. Seven different classifiers which include the Naive Bayes, Logistic Regression, Multilayer Perceptron, SVM, J48, kNN, and random forest classifiers are used for the classification purpose. The decision tree algorithm gave the best classification results with achieved accuracy of 88% for three classes. A stress measurement mechanism among students during an oral exam using ECG signals is presented in (Castaldo et al., 2016). ECG data of the student is recorded during the oral exam as well as after the vacations which acted as a baseline recording. Time and frequency domain features are extracted from the recorded data and subjected to classification using Naive Bayes, Decision Tree, SVM, and Multilayer Perceptron classifiers. The best classification accuracy of 80% is achieved using a decision tree classifier. Table 4 presents a summary of human stress classification schemes using ECG signals.
| Method | Type of Stress | Number of Subjects (M/F) | Age | Stimulus | Features Domain | Classifier | Accuracy (Classes) |
|---|---|---|---|---|---|---|---|
| (Karthikeyan et al., 2012) | Acute | 10 (0/10) | 20-25 | MAT | Wavelet | kNN | 96.30% (4) |
| (Karthikeyan et al., 2011) | Acute | 10 (0/10) | 20-25 | SCWT | Wavelet | kNN | 96.41% (2) |
| (Charbonnier et al., 2018) | Acute | 20 | 19-30 | SCWT | Frequency | mono-feature fuzzy index | 72.00% (4) |
| (Tanev et al., 2014) | Acute | 10 (8/2) | 22-26 | IAPS, IADS | Time and Frequency | NB | 90.00% (2) |
| (Bong et al., 2012) | Acute | 5 | – | Audio-visual | Time | SVM,kNN | 77.69% (2) 66.49% (3) |
| (Karthikeyan et al., 2013) | Acute | 60 (30/30) | 21-25 | SCWT | Time and Frequency | kNN, PNN | 91.66% (2) |
| (Keshan et al., 2015) | Acute | 17 | – | Driving | Time | NB, LR, MLP, SVM, DT, kNN, RF | 88.00% (3) |
| (Castaldo et al., 2016) | Acute | 42 | – | Oral Examination | Time and Frequency | NB, DT, SVM, MLP | 80.00% (2) |
MAT: Mental Arithmetic Task, SCWT: Stroop color-word test, NB: Naive Bayes, MLP: Multilayer Perceptron, LR: Logistic Regression, DT: Decision Tree, SVM: Support Vector Machine, kNN: k- Nearest Neighbors, RF: Random Forest, IAPS: International Affective Picture System, IADS: International Affective Digital Sounds, PASAT: Paced Auditory Serial Addition Task, FDA: Fisher discriminant algorithm, PNN: Probabilistic neural network
4.1.5 Heart Rate based Stress Detection
HR is one of the most widely used measures of human stress available in the literature. Heart rate is defined as the number of heartbeats in one minute (measured in beats per minute (bpm)). The RR interval of the ECG signal, which is defined as the interval between consecutive heartbeats has an inverse relationship with the heart rate of a person. In literature, there exist a large number of studies that report a significant increase in heart rate when facing a stressful situation (Giannakakis et al., 2017; Engert et al., 2014; Vinkers et al., 2013; Lundberg et al., 1994; Krantz et al., 2004; Finsen et al., 2001; Reinhardt et al., 2012; Acerbi et al., 2016; Moriguchi et al., 1992; Steptoe et al., 2001; Ring et al., 2002; Tugade and Fredrickson, 2004; Vuksanović and Gal, 2007; Schubert et al., 2009; Clays et al., 2011; Lackner et al., 2011; van Lien et al., 2015). A human stress detection framework based on facial cues using features of eye movement, mouth activity, head movement, and heart rate acquired via PPG signal is presented in (Giannakakis et al., 2017). Four different stressors which include social exposure, emotional recall, stressful images, and stressful videos are used in the experiment. Feature selection is applied to select the optimum set of features for the discrimination of a stress state from a neutral state. Five different classifiers which include kNN, Generalized Likelihood Ratio, SVM, the Naïve Bayes, and the AdaBoost classifier are employed for classification purposes. Maximum classification accuracy of 91.68% is achieved by the AdaBoost classifier using social exposure stressors. Another study presenting a comparison of the use of thermal infrared imaging for measurement of human stress with other stress biomarkers of heart rate, heart rate variability, alpha-amylase, cortisol, and finger temperature is presented in (Engert et al., 2014). Two different stressors which include the cold pressor test and the trier social stressor test are used in the experiment. The study reported the fact that under stressful situations heart rate of the subjects is increased whereas it decreased in the recovery phase. In another study conducted in (Lundberg et al., 1994), the authors reported an increase in the heart rate of the individuals under stress conditions as compared to baseline rest state condition. Women are found to have an increased heart rate as compared to men when facing stressors, whereas men have higher blood pressure as compared to women under stress conditions in a study presented in (Krantz et al., 2004). The cardiovascular response of individuals in response to computer mouse work with and without memory demands is discussed in a study presented in (Finsen et al., 2001). The study found that with the increasing memory demands, the heart rate of the individuals is increased. A new stress induction protocol named Mannheim Multi-component Stress Test (MMST) is designed in a study conducted in (Reinhardt et al., 2012). The MMST protocol included mental arithmetic tasks, effective images, sounds, and motivational stressors. The heart rate of the subjects is found to have an increasing pattern when facing the stressor. Another human stress measurement study based on wearable sensors is presented in (Acerbi et al., 2016). The mean of the heart rate feature is extracted from the recorded heart rate variability signal. The study concluded that stressed and non-stressed individuals have significant differences in the heart rate of the subjects. The influence of acute mental stress on the cardiovascular response and concentrations of inflammatory cytokines are examined in a study conducted in (Steptoe et al., 2001). The study reported that participants have an increased heart rate and blood pressure when facing stressors as compared to the baseline condition. Another human stress measurement study conducted in (Vuksanović and Gal, 2007) proved the fact that an increase in the heart rate of the subject in mental stress aloud condition is due to the changes in autonomous modulation of the spectral power of high-frequency bands of the ECG signal. A study to examine the effects of chronic and short-term stress on heart rate and heart rate variability is presented in (Schubert et al., 2009). The speech task has been used as a stressor for the experiment and time, frequency, and phase domain measures were examined. The study reported the finding that the heart rate of the subjects is significantly increased when performing the public speaking task as compared to the rest state. A study to correlate the perception of work stressors with the measure of heart rate variability is presented in (Clays et al., 2011). The mean of correlation, multiple linear regression, and ANOVA is used to analyze the HRV signal. The mean of the heart rate is extracted as a feature from the HRV signal and it is found that the mean HR was raised in the high work stressor group as compared to the low stressor group.
On the contrary, few studies exist in the literature which report no change in the heart rate under stress (McDuff et al., 2014; Blechert et al., 2006; Hynynen et al., 2011; Cinaz et al., 2013; McDuff et al., 2016). Remote measurement of cognitive stress using heart rate, heart rate variability, and breathing rate have been performed in a study conducted in (McDuff et al., 2014). Physiological data is acquired from the participants in the rest state and stress condition i.e., while performing a mental arithmetic task. The study concluded that there is a significant difference in the breathing rate and the heart rate variability of the subjects in stress vs rest condition, whereas the heart rate of the subject did not show any significant difference in stressed vs relaxed state. Identifying the difference between anxiety and rest state using a variety of physiological signals which include EDA, breathing rate, and cardiovascular measure of heart rate variability and heart rate is presented in (Blechert et al., 2006). Physiological data were acquired in the rest state as well as while facing electric shocks. The study concludes that EDA showed a significant difference in the rest vs stressed state whereas cardiovascular measures show very little difference between the two groups. A study to correlate the self-reported questionnaire with the cardiac autonomic modulation in real-life scenarios is discussed in (Hynynen et al., 2011). The PSS questionnaire is filled out by the participants and the participants were grouped into low and high-stress groups based on PSS scores. R-R interval data is recorded while participants were sleeping at night and during the orthostatic test after awakening in the morning. R-R interval data is used to extract HRV and HR features in time as well as frequency domain. The study concluded that a high score on the stress questionnaire is correlated with lower HRV in the orthostatic test. Moreover, there is no difference observed in the heart rate and heart rate variability of the low and high-stress participants. A new stress recognition framework using the using contact-free camera as an apparatus and computer-based tasks as a stimulus is proposed in (McDuff et al., 2016). PPG signals are recorded and the heart rate, heart rate variability, and breathing rate features are extracted and used for the identification of stress during the tasks. The study identified the fact that heart rate variability has significant changes during the stressor where on the other hand there is no difference in the heart rate and breathing rate of the two groups. It can be observed from the above studies that heart rate has been widely used as a marker for human stress measurement because it is a reliable indicator of arousal due to stress. Table 5 presents a summary of human stress classification schemes using heart rate.
| Method | Type of Stress | Number of Subjects (M/F) | Age | Stimulus | Features Domain | Classifier | Accuracy (Classes) |
|---|---|---|---|---|---|---|---|
| (Blechert et al., 2006) | Acute | 42 (14/28) | 42.29.9 | Pictures | Time | DFA | 83.30% (2) |
| (Giannakakis et al., 2017) | Acute | 23 (16/7) | 45.110.6 | SCWT, IAPS, videos | Time | Adaboost | 91.68% (2) |
| (McDuff et al., 2014) | Acute | 10 (3/7) | 18-30 | MAT | Frequency | SVM | 85.00% (2) |
| (McDuff et al., 2016) | Acute | 10 (5/5) | 18-28 | BCST | Frequency | NB | 86.00% (2) |
MAT: Mental Arithmetic Task, SCWT: Stroop color-word test, NB: Naive Bayes, SVM: Support Vector Machine, IAPS: International Affective Picture System, DFA: Discriminant function analysis, BCST: Berg Card Sorting Task
4.1.6 Skin Temperature based Stress Detection
Skin temperature is the temperature of the outermost surface of the body. The normal skin temperature of the outer surface of the skin lies between and . Our sense of hot and cold depends on the amount of energy to and from the skin. Skin temperature depends on the temperature of the air and time spent in that environment. Human skin temperature is strongly correlated to the heart activity and sweat reaction of an individual. Changes in skin temperature are connected to stressful and anxious conditions (McFarland, 1985). Skin temperature has been measured at a variety of locations on the human body like a finger, arm, face, and armpits. Measurement of different positions gives different results under stress because the temperature on some parts of the body increases whereas on some other parts of the body temperature decreases.
In (Zhai and Barreto, 2006), a skin temperature-based human stress measurement method has been developed. Skin temperature has a negative correlation to human stress, i.e., a decrease in stress level corresponds to an increase in ST and vice versa (Reisman, 1997). A patch-based human stress monitoring using skin temperature and skin conductance is proposed in (Yoon et al., 2016). Skin temperature has shown a negative correlation with the level of chronic stress (Lee et al., 2010; Torii et al., 1992). Changes in skin temperature to identify different levels of stress are studied in (Karthikeyan et al., 2012). The Stroop color-word test is used as a stimulus and the probabilistic neural network as a classifier to achieve an accuracy of 88% for four levels of stress. The effect of the core and peripheral body temperature on human stress is discussed in (Vinkers et al., 2013). The study reported a decrease in the temperature of the fingertips and palm whereas, on the contrary, the temperature of the upper arm increased. An acute human stress measurement system using skin temperature is presented in (Herborn et al., 2015). Skin temperature when measured with an axillary thermometer tends to increase under stressful situations (Marazziti et al., 1992). Some other studies analyzing skin temperature on the surface of the finger under human stress report a decrease in temperature (Lee et al., 2004; Rimm-Kaufman and Kagan, 1996; Vinkers et al., 2013; Karthikeyan et al., 2012; Engert et al., 2014). Slope of skin temperature has been used in some stress studies instead of temperature means value (Barreto et al., 2007). A study reporting different temperature changes in different parts of the body under a stressful stimulus of an interview (Rimm-Kaufman and Kagan, 1996). The temperature on the hands of the person is decreased whereas the cheeks and eyes of the person tend to show an increase in temperature. Moreover, there also exists a temperature difference in the left and right cheeks of the participants. Table 6 presents a summary of human stress detection schemes using skin conductance.
| Method | Type of Stress | Number of Subjects (M/F) | Age | Stimulus | Features Domain | Classifier | Accuracy (Classes) |
|---|---|---|---|---|---|---|---|
| (Lee et al., 2004) | Acute | 80 | – | SCWT | Time | MLP, GRNN,ANFIS | 96.67% (2) |
| (Zhai and Barreto, 2006) | Acute | 32 | 21-42 | SCWT, Emotional pictures | Time and Frequency | SVM | 90.10% (2) |
| (Karthikeyan et al., 2012) | Acute | 60 (30/30) | 22.52.5 | SCWT | Time | PNN | 88.00% (4) |
SCWT: Stroop color-word test, MLP: Multilayer Perceptron, PNN: Probabilistic Neural Network, GRNN: Generalized regression neural network, ANFIS: Adaptive network-based fuzzy inference system. SVM: Support Vector Machine
4.1.7 Respiratory Rate-based Stress Detection
The respiration rate of a person can be defined as the number of breaths a person takes in a duration of one minute. Two of the most common measures of respiration are breath rate and breath amplitude or depth (Simoes et al., 1991). The breath rate of a person is increased under stressful conditions, whereas on the contrary it is decreased in calm situation (Vinkers et al., 2013; McDuff et al., 2014; Grossman, 1983). Stress is associated with the irregularities of the respiratory rate (Singh and Queyam, 2013), the shift from abdominal to thoracic breathing (Ahmed et al., 2015), and faster and shallower breathing (Kreibig, 2010). The breath rate sensor has been reported to be an accurate estimation of the respiratory rate. Breathing activity monitoring using chest cavity expansion has been reported in (Stern et al., 2001). For the detection of human stress, respiratory signals have been acquired using an elastic hall effect sensor placed at the lower part of the chest (Healey and Picard, 2005) and by use of thermistors placed in the nasal passage of the subject (Shin et al., 1998). Respiratory rate signal has also been used in combination with other biomedical sensors for the assessment of human stress (Hosseini and Naghibi-Sistani, 2011). Oxygen consumption rate has been extracted from the respiratory rate of the person and is considered a considerably reliable measure of human stress because the oxygen demand is increased under stress (Seematter et al., 2002). In (Fernández and Anishchenko, 2018), the authors proposed another stress recognition study using respiratory signals. Another study for human stress assessment using a respiration sensor is presented in (Shan et al., 2020). Table 7 presents a summary of human stress classification schemes using respiration rate.
| Method | Type of Stress | Number of Subjects (M/F) | Age | Stimulus | Features Domain | Classifier | Accuracy (Classes) |
|---|---|---|---|---|---|---|---|
| (McDuff et al., 2014) | Acute | 10 (3/7) | 18-30 | MAT | Frequency | SVM | 85.00% (2) |
| (Ahmed et al., 2015) | Acute | 25 (15/10) | 18-35 | SCWT and Public speaking | Time and Frequency | GEE | 88.00% (2) |
| (Hosseini and Naghibi-Sistani, 2011) | Acute | 15 (15/0) | 20-24 | Picture presentation test | Time and Frequency | SVM | 76.95% (2) |
| (Wijsman et al., 2013) | Acute | 30 (25/5) | 19-53 | Calculation and memory task | Time and Frequency | GEE | 74.50% (2) |
| (Rigas et al., 2011) | Acute | 13 (10/3) | 22-41 | Car driving | Time and Frequency | BN | 96.00% (2) |
| (Singh and Queyam, 2013) | Acute | 10 | – | Car driving | Time | ANN | 80.00% (2) |
| (Wijsman et al., 2011) | Acute | 30 (25/5) | 19-53 | Calculation, puzzle and memory task | Time and Frequency | ANN, LBN, QBN, FLS | 80.00% (3) |
| (Shan et al., 2020) | Acute | 89 (47/42) | 18-23 | SCWT | Time | SVM | 93.90% (2) 93.40% (2) 89.05% (2) |
| (Fernández and Anishchenko, 2018) | Acute | 43 (26/17) | 18-22 | Maths problem | Time and Frequency | MLP | 94.44% (2) |
MAT: Mental Arithmetic Task, SCWT: Stroop color-word test, FDA: Fisher Discriminant Analysis, GEE: generalized estimating equation, SVM: Support Vector Machine, BN: Bayesian networks, ANN: Artificial Neural Network, LBN: Linear Bayes Normal, QBN: Quadratic Bayes Normal, FLS: Fisher’s Least Square, MLP: Multilayer Perceptron
4.1.8 Heart Rate Variability based Stress Detection
HRV is the measure of the variation in the time interval between consecutive heartbeats of an individual. ANS activities can be reliably measured by using the HRV parameter and is a strong tool for human stress assessment (Pflanzer, 2013). HRV shows distinct changes in response to changes in individuals (Acharya et al., 2006). HRV can be obtained using ECG as well as PPG sensor data. HRV measurement methods based on ECG signals have been developed in (Clifford, 2002). An ECG recordings-based study is conducted in (Sloan et al., 1994) to analyze the relationship of RR intervals (time between consecutive heartbeats), HRV, and human stress. The study concludes that the increase in heart rate is correlated with the decrease in RR interval. Another study for human stress assessment using physiological signals of ECG and HRV is introduced in (Karthikeyan et al., 2013). Classification accuracy of 94.66% for normal vs stressed class using a fusion of ECG and HRV signals is achieved. In (Jobbágy et al., 2017), authors have proposed a stress recognition system to characterize human stress using HRV signals. The influence of HR and HRV on human stress is discussed in (Taelman et al., 2009). The HR and HRV of the subjects are recorded in the rest state as well as while performing a mental stressor. The study concluded that the HR and HRV of the subject change when facing a mental stressor and hence can be used as a potential biomarker for the assessment of human stress. Another study about the association of mental stress with HRV is presented in (Salahuddin et al., 2007). Correlation between the perceived stress face by college students and the HRV is explored in (Lombardo and Vick, 2019). Another cognitive stress measurement model using HRV with an accuracy of 85% is proposed in (McDuff et al., 2014). A deep learning model for the identification of mental stress in firefighters using HRV data is presented in (Oskooei et al., 2019). A study about the correlation of mental stress and HRV of the students during the university final examination is presented in (Hammoud et al., 2019). The study reports that HRV in female students is significantly lower as compared to their male counterparts before and after taking the exam. A study to find the correlation between the perceived mental stress and the HRV parameters of the subjects is discussed in (Orsila et al., 2008). A strong correlation between the perceived stress and the values of triangular interpolation of rhythm-to-rhythm (RR) interval histogram (TINN) and the root mean square of differences of successive RR intervals (RMSSD) of the HRV data obtained in the morning and during the workday is found in the study.
Some studies claim that the HRV data needs to be of around five minutes for some reasonable analysis (Malik, 1996), whereas, on the other hand, some studies negate this conclusion by claiming that an even smaller amount of data could be used as a reliable marker of human stress (Hall et al., 2004; Salahuddin et al., 2007). The standard deviation of the NN interval (SDNN) is found to be reduced under stressful condition (Blechert et al., 2006; Acerbi et al., 2016; Schubert et al., 2009; Clays et al., 2011; Hynynen et al., 2011; Cinaz et al., 2013; Bernardi et al., 2000; Taelman et al., 2011; Tharion et al., 2009; Visnovcova et al., 2014; Madden and Savard, 1995). A study to monitor human stress using physiological signals of electrodermal activity and heart rate variability recorded via wearable sensors is presented in (Acerbi et al., 2016). A new stress-inducing protocol named TransSafe (The Ambient Response to Avoid Negative Stress and enhance SAFEty) is developed in this study. Subjective questionnaires of the State-Trait Anxiety Inventory (STAI) and Shortened State Stress Questionnaire (SSSQ) are filled by the participants before and after facing the stressor. Time and frequency domain features are extracted from the HRV signal. A statistical test is applied to the extracted features and a significant difference is found in some of the features of the EDA and HRV signal. A study to examine the effect of short-term and chronic stress on the heart rate variability of the subject is conducted in (Schubert et al., 2009). The speech task has been used as a stressor in the experiment and it is found that the standard deviation of the R-R interval got reduced when facing the stressor. Perception of work stressor relationship with heart rate variability is examined in a study conducted in (Clays et al., 2011). Perception of the work stressors is measured using a 27-item job stress questionnaire. An association between the percentage of differences between adjacent normal RR intervals (pNN50), lower high-frequency power, and a higher ratio of the low frequency over high-frequency power and the worker’s stress is found. Moreover, no significant correlation between low-frequency power and worker stress is found. An investigation of the relationship of self-reported measures with heart rate variability in real-life situations is explored in (Hynynen et al., 2011). SDNN features extracted from the HRV signal got reduced in a high-stress condition when compared to a low-stress condition. Monitoring of mental workload in office work scenarios using heart rate variability feature is proposed in (Cinaz et al., 2013). The NASA Task Load Index questionnaire is used to obtain the subjective mental workload of the participants. Time and frequency domain features are extracted from the HRV signal and the pNN50 feature was found to decrease significantly and the SDNN feature is found to give a consistent decrease under stress conditions. Another study to access that whether talking or reading aloud or silently affects heart rate variability is presented in (Bernardi et al., 2000). An increase in the speed of breathing and a decrease in the mean and variance of the RR interval as compared to normal breathing are observed when reading silently as compared to reading aloud. A study to monitor instantaneous changes in heart rate activity due to mental workload in an office environment is proposed in (Taelman et al., 2011). The participants are asked to perform a low mental workload task and a high mental workload task twice where each of these tasks is followed by a rest state condition. A significant difference in the heart rate and heart rate variability is observed under mental workload conditions as compared to baseline rest conditions. A study to explore the heart rate variability in students during examination time is presented in (Tharion et al., 2009). The mean of the RR interval is reported to be significantly lower whereas mean arterial pressure and SDNN are found to be higher during the examination time. A study to understand the relation of acute mental stress and complexity and time asymmetry of HRV signal is proposed in (Visnovcova et al., 2014). Two different stimuli which include SWT and mental arithmetic tasks are used. The study reveals the fact that SDNN was found to be significantly lower when facing a stressful situation as compared to the recovery period. The effect of mental state on the heart rate and blood pressure variability in both males and females is examined in a study conducted in (Madden and Savard, 1995). The mental arithmetic task is used as a stimulus for the experiment. As compared to the control condition, the stressor condition causes a decrease in SDNN, log standard deviation of systolic blood pressure, log total power, and log fractal powers. Root Mean Square of the Successive Differences (RMSSD) is another HRV feature that has been explored in the literature and it has been established to decrease under stress (Acerbi et al., 2016; Ring et al., 2002; Hynynen et al., 2011; Cinaz et al., 2013; Taelman et al., 2011; Tharion et al., 2009). Authors in (Li et al., 2009) reported that RMSSD, a time-domain feature of HRV and high frequency (HF) power, a frequency domain feature of HRV get decreased in stress condition. Another important frequency-domain feature of HRV discussed in the literature is the ratio of Low-frequency power (LF) to HF power which is increased under stressful situation (McDuff et al., 2014; Blechert et al., 2006; Acerbi et al., 2016; Moriguchi et al., 1992; Vuksanović and Gal, 2007; Schubert et al., 2009; Clays et al., 2011; Cinaz et al., 2013; McDuff et al., 2016; Lucini et al., 2002; Taelman et al., 2011; Tharion et al., 2009; Taelman et al., 2009; Hjortskov et al., 2004; Hall et al., 2004). Very low-frequency (VLF) band of the HRV signal is found to be increased in some studies (Acerbi et al., 2016; Moriguchi et al., 1992). Another HRV feature named correlation dimension D2 is reduced under stress in a study conducted on university students during their examination time in (Melillo et al., 2011). A new framework for the remote measurement of heart rate variability using a webcam for the detection of stress is proposed in (Bousefsaf et al., 2013). HRV is investigated for different stress factors which include stressed, tensed, concentrated, and stimulated conditions. The study concluded that remote measurement of HRV can be used as a reliable marker of human stress assessment. Another stress recognition study using HRV signals is discussed in (Kim et al., 2008). A self-reporting questionnaire was used to label the participants into low and high-stress groups. HRV data were recorded for three different periods during the day and it was concluded that the highly stressed participants showed a decrease in the HRV patterns as compared to the low-stress group. Moreover, using logistic regression as a classifier accuracy of 63.2% is achieved for the low vs high stressed group. Another HRV-based stress measurement scheme using time and frequency domain features is presented in (Boonnithi and Phongsuphap, 2011). Stress detection using ECG and HRV features is presented in (Melillo et al., 2013). Variation in the heart rate variability of the students in rest conditions and during the examination phase was examined using a non-parametric classifier called Classification and Regression Tree (CART). Sensitivity and specificity of 83.33% and 90.48% for the stress vs rest state classification is achieved. Another study for four-level stress classification i.e., no stress, low stress, medium stress, and high stress using HRV features is discussed in (Vanitha and Suresh, 2014). The database used for the experiment in this study was the MIT-BIH multi-parameter database where different driving tasks are used as a stimulus. Hierarchical SVM is used as a classifier to classify the four stress state with a classification accuracy of 92%. Driver stress level recognition using HRV features along with support vector machine classifier is performed in (Munla et al., 2015). The database used in this experiment is stress recognition in automobile driver database and a classification accuracy of 83% is reported. A stress recognition measurement scheme for driver stress monitoring using HRV data is proposed in (Wang et al., 2013). DriveDB database is used in this study for measuring driver stress and features are extracted using parameter-based methods. Kernel-based class separability (KBCS) method for feature selection is used to select the optimum feature set. LDA and PCA algorithms are used for dimensionality reduction. Next, the classification of driver stress is performed using a kNN classifier with an achieved accuracy of 97%. Taking into consideration the studies presented in the literature, it is evident that the relationship between HRV to stress is not very straightforward. However many of the studies presented in the literature present a consistent relationship with certain HRV features and hence can help draw some useful conclusions. Table 8 presents a summary of human stress detection schemes using HRV.
| Method | Type of Stress | Number of Subjects (M/F) | Age | Stimulus | Features Domain | Classifier | Accuracy (Classes) |
|---|---|---|---|---|---|---|---|
| (Blechert et al., 2006) | Acute | 42 (14/28) | 42.29.9 | Pictures | Time | DFA | 83.30% (2) |
| (Karthikeyan et al., 2013) | Acute | 60 (30/30) | 21-25 | SCWT | Time and Frequency | kNN, PNN | 91.66% (2) |
| (McDuff et al., 2014) | Acute | 10 (3/7) | 18-30 | MAT | Frequency | SVM | 85.00% (2) |
| (McDuff et al., 2016) | Acute | 10 (5/5) | 18-28 | BCST | Frequency | NB | 86.00% (2) |
| (Melillo et al., 2011) | Acute | 42 | – | University Examination | Time | LDA | 90.00% (2) |
| (Melillo et al., 2013) | Acute | 42 (19/23) | 20-28 | University Examination | Time and Frequency | CART | 87.00% (2) |
| (Vanitha and Suresh, 2014) | Acute | 16 | – | Car driving | Time and Frequency | hierarchical SVM | 92.00% (4) |
| (Munla et al., 2015) | Acute | 16 | – | Car driving | Time and Frequency | SVM-RBF | 83.00% (2) |
| (Wang et al., 2013) | Acute | 27 | – | Car driving | Time and Frequency | kNN | 97.00% (2) |
| (Kim et al., 2008) | Chronic | 68 | 10-30 | Baseline | Time and Frequency | LR | 66.1% (2) |
MAT: Mental Arithmetic Task, SCWT: Stroop color-word test, DFA: Discriminant function analysis, kNN: k- Nearest Neighbors, PNN: Probabilistic Neural Network, SVM: Support Vector Machine, NB: Naive Bayes, LDA: Linear Discriminant Analysis, CART: Classification and Regression Tree, RBF: radial basis function, LR: Logistic Regression, BCST: Berg Card Sorting Task
4.1.9 Blood Volume Pressure based Stress Detection
BVP is a method to measure the amount of pressure exerted on the blood vessels. When measuring blood pressure, we get two values, the first value is systolic blood pressure (SBP) and the second number is called diastolic blood pressure (DBP). The human body releases a large number of stress hormones under stressful conditions which increases blood pressure (Gasperin et al., 2009) thus making blood pressure a good indicator for stress measurement (Pickering et al., 1996). A 3-year duration study conducted revealed the fact that individuals who have stress at the workplace tend to have higher SBP and DBP, whereas during sleep they have increased SBP (Schnall et al., 1998). SBP and DBP have been reported to be higher during a mental stressor task in (Ring et al., 2002; Lundberg et al., 1994; Carroll et al., 2003, 2011). A study presented in (Ring et al., 2002) discussed the hemodynamics due to which the increase in blood pressure occurs during exposure to stress for a longer time duration. Mean arterial pressure (MAP), cardiac output (CO), and total peripheral resistance (TPR) parameters were measured during three phases of the experiment i.e., rest phase, mental arithmetic task phase, and recovery phase. MAP increased at a constant rate during the stressor, CO increased during the first half of the stressor and decreased back to rest state condition toward the end of the task, whereas on the other hand TPR kept on increasing as the mental arithmetic task progressed. In a study conducted in (Lundberg et al., 1994), it is found that the blood pressure of the subjects i.e., both systolic and diastolic increased in case of stress session as compared to the baseline condition. Authors in (Carroll et al., 2003) present a study to examine the relationship of human stress to the future value of blood pressure and how it is affected by the gender, age, and socioeconomic condition of the subject. The blood pressure of the subjects was recorded in rest condition and under mental stressors. Moreover, five years of follow-up resting-state blood pressure data of the participants were also available. The findings of the study are that the systolic blood pressure reaction to human stress is found to be positively correlated with the follow-up systolic blood pressure where no correlation could be found with diastolic blood pressure. Another conclusion of the study is that the magnitude of the predicted blood pressure has an association with the gender and socioeconomic position of a person. Another study to correlate the reaction of blood pressure to acute stress and future blood pressure condition is proposed in (Carroll et al., 2011). Blood pressure readings in a rest state and with facing stressors are recorded. Moreover, after twelve years, resting-state blood pressure reading was again taken. The study concluded that the systolic blood pressure positively made a prediction about future systolic pressure and there is an increasing pattern of blood pressure over the span of 12 years. However, these findings are not observed in the case of diastolic blood pressure. However, in another study, the author claims that the mental stress of a person does not affect the recorded BVP (Hjortskov et al., 2004). There exists a wide of studies in which SBP and DBP is reported to increase under stressful conditions (Finsen et al., 2001; Vinkers et al., 2013; Lundberg et al., 1994; Krantz et al., 2004; Moriguchi et al., 1992; Steptoe et al., 2001; Ring et al., 2002; Bernardi et al., 2000; Hjortskov et al., 2004; Schnall et al., 1998; Carroll et al., 2003, 2011). Men have been found to have higher blood pressure under stress as compared to women in a study conducted in (Krantz et al., 2004). In a study conducted in (Vinkers et al., 2013), authors reported that when participants are facing a standard stressor there is an increase in their blood pressure i.e., systolic and diastolic as compared to a baseline recording. Authors in (Finsen et al., 2001) reported that an increase in the blood pressure of the participants is observed when increasing memory demands. An increase in the blood pressure of the participants is observed when facing a stressor in an experimental study conducted in (Moriguchi et al., 1992). The correlation of mental stress with the cardiovascular response is examined in (Steptoe et al., 2001). The blood pressure of the participants is recorded during the rest state as well as while performing stressful tasks. The stressed group has significantly higher blood pressure as compared to the control group. The effect of reading aloud or silently on the blood pressure of the participants is examined in a stress measurement study performed in (Bernardi et al., 2000). The effect of mental stress on the HRV and blood pressure of the participants performing computer work is examined in (Hjortskov et al., 2004). The study concludes that reading silently causes an increase in the blood pressure of the participant. Hence, looking at these trends, BVP can be considered a reliable marker of stress.
4.1.10 Photoplethysmography based Stress Detection
PPG is a technique to measure the blood volumetric changes in the vessels (Challoner, 1979). PPG is a widely accepted technique being used in clinical applications as well as commercial devices, e.g., a pulse oximeter. PPG sensor is quite simple consisting of an infrared light source that is used to illuminate tissue of the skin and a photodetector is used to measure the changes in the light illumination due to blood flow. Many commercial devices that measure blood pressure, oxygen saturation, and cardiac output are based on a PPG sensor. For the acquisition of PPG signals, currently, a large variety of devices are available in the market. The component of a PPG data acquisition system includes a light source, an LED for lightening up the tissue, and a photodetector to receive the light and measure the variations of the light. Light sources commonly used in PPG sensors include red, light green, or infrared color. Green color has a shorter wavelength and thus it produces a larger variation of light intensity to cardiac changes (Maeda et al., 2011). Heart rate calculation has also been performed using the PPG sensors (Kageyama et al., 2007). Many algorithms have been developed to measure the heart rate and heart rate variability parameters, which can be used to measure different physiological responses including human stress (Štula, 2003). PPG signal can also be used to calculate the value of pulse rate, pulse rate variability, blood volume pressure, blood oxygen saturation level, and blood pressure (Giannakakis et al., 2019). Table 9 presents a summary of human stress detection schemes using PPG signals.
| Method | Type of Stress | Number of Subjects (M/F) | Age | Stimulus | Features Domain | Classifier | Accuracy (Classes) |
|---|---|---|---|---|---|---|---|
| (McDuff et al., 2014) | Acute | 10 (3/7) | 18-30 | MAT | Frequency | SVM | 85.00% (2) |
| (McDuff et al., 2016) | Acute | 10 (5/5) | 18-28 | BCST | Frequency | NB | 86.00% (2) |
| (Chauhan et al., 2018) | Acute | 10 | 30-58 | PASAT | Frequency and Wavelet | Adaboost | 93.00% (2) |
| (Cho et al., 2019) | Acute | 17 (8/9) | 29.8212.02 | MAT | Frequency | ANN | 78.33% (2) |
| (Li et al., 2018) | Acute | 178 (85/93) | 16-36 | MAT | Frequency | elastic net | 86-91% (2) |
| (Zangróniz et al., 2018) | Acute | 50 (28/22) | 20-28 | IAPS | Time and Frequency | DT | 82.35% |
MAT: Mental Arithmetic Task, ANN: Artificial Neural Network, SVM: Support Vector Machine, NB: Naive Bayes, DT: Decision Tree, BCST: Berg Card Sorting Task, PASAT: Effects of the Paced Auditory Serial Addition Task, IAPS: International Affective Picture System
4.1.11 Salivary Cortisol based Stress Detection
Cortisol is a well-known biomarker for measuring psychological stress. Salivary cortisol has been used by physicians as a diagnostic tool for the measurement of psychological stress and many other diseases for over two decades and has been reported to be a very good measure of human stress (Kirschbaum and Hellhammer, 1989). As it is established that stress is a phenomenon that is affected by a wide range of factors, so a reliable measure is required for the accurate estimation of stress. It has been reported that when the person is under an acute stressor, the level of cortisol release increases (Fink, 2000). In (Hellhammer et al., 2009), the author has presented a correlation between stress and cortisol level. Human HPA activity is affected by stress and is reflected in cortisol thus making it a very practical tool for stress detection. An acute stress measurement scheme using cortisol secretion is presented in (Boucher and Plusquellec, 2019). A study measuring the response of sweating cortisol to human stress is presented in (Tu et al., 2019). The study deduced the fact that there exists a strong association between the diet and cortisol of a person and therefore adjusting the diet may help in lowering the cortisol level and thus preventing stress-related health issues. The relationship between the changes in the cortisol level of a subject due to mental stress is discussed in (Luo et al., 2012). The study concluded that the cortisol level of a person is increased due to mental stress. Another stress detection study using cortisol as a biomarker is presented in (Nath et al., 2020). The model achieved a classification accuracy of 92%. Acute stress measurement using cortisol as a biomarker is discussed in (Selvaraj, 2015). Emotional stress measurement using cortisol is introduced in (Rey et al., 2014). The study reveals that the cortisol level of men is found to increase under stress. Salivary cortisol has been used as a measure of assessing the mental workload in (Nomura et al., 2009).
4.2 Non-Wearable Sensor-based Human Stress Detection
Non-wearable sensors are the type of sensors in which no physical device needs to be connected to the human body rather the data can be acquired at a considerable distance from the subject. Non-wearable sensors for human stress measurement can be subdivided into physical measures, behavioral measures, and computer vision-based measures. Physical measures are one in which some observable parameters of the human body like human pupil dilation, human speech, human eye activity, and body postures are recorded, whereas, on the other hand, behavioral measures are the ones in which human stress is measured based on the interaction of the subject with some device like keyboard, mouse, and smartphones. The third and last type of non-wearable sensors used for human stress measurement is computer vision-based sensors like video cameras and thermal imaging.
4.2.1 Physical Measures
A physical property is defined as a property that is observable by humans with the naked eye. To acquire physical measures, sophisticated equipment, and sensors are required. Physical measures of stress can be subdivided into four main categories, which include pupil dilation, speech-based measures, eye movement, and body postures. Literature corresponding to each of these categories is given below.
-
1.
Pupil Dilation: The eye pupil is a hole located at the center of the iris, which allows light to enter the retina. The color of the eye pupil is black because the light entering the pupil is either absorbed directly by the eye tissues or absorbed after diffusion. The pupil of the eye may appear to open i.e., dilate, or close i.e., constrict but it is the iris that governs its movement. Under bright lighting conditions, the pupil constricts to allow less light to enter the eye, whereas under dark conditions the pupil dilates to allow more light to enter the eye. The size of the pupil is controlled by two muscles i.e., constrictor and dilator pupillae, which are in turn controlled by the sympathetic (SNS) and parasympathetic (PNS) part of the ANS (Beatty et al., 2000). Just like the physiological responses of an individual, pupil dilation is not under subject control and is strongly associated with cognitive and emotional arousal (Bradley et al., 2008).
The relationship between the affective states and pupil dilation has been discussed in a number of studies (Onorati et al., 2013; Partala and Surakka, 2003; Al-Omar et al., 2013; Bradley et al., 2008; Ren et al., 2012; Pedrotti et al., 2014). Moreover, pupil dilation has been used as a marker of stress and anxiety assessment (Honma, 2013; Simpson and Molloy, 1971; Baltaci and Gokcay, 2016; Zhai and Barreto, 2006). Another human stress measurement study based on pupil diameter along with physiological signals of Galvanic Skin Response (GSR), Blood Volume Pulse (BVP), and Skin Temperature (ST) is proposed in (Zhai and Barreto, 2006). SVM is used for the classification of stress and relaxed state with an achieved accuracy of 90.10%. The study concluded that in comparison to physiological signals pupil diameter was a more effective indicator of stress. In a laboratory environment, when the subject is presented with a stressful stimulus the pupil diameter is increased (De Berker et al., 2016). Stress measurement based on pupil dilation has been the subject of study in (Barreto et al., 2007). An increase in pupil dilation diameter suggests that the pupil dilates at a higher frequency and it means the person is in a stressed state. Experimental studies have shown that due to negative and positive arousing sounds, the diameter of the human pupil is increased quite significantly (Partala and Surakka, 2003). The mean value of pupil diameter has also been used as a parameter for stress detection. Increasing mean values over a time period shows the increasing level of stress. Images having negative valance tend to have a stronger effect on the eye pupil of the subject who feels more stressed (Kimble et al., 2010). Moreover, positive as well as negative sounds cause an increase in the pupil diameter of the person (Partala and Surakka, 2003). Public speaking anxiety also affects pupil size (Simpson and Molloy, 1971). The size of the pupil is directly proportional to the anxiety level of a person i.e, the more the anxiety level more the pupil diameter and vice versa (Wang and Yue, 2011). Another study about the widening of a pupil under stress is presented in (Liao et al., 2005). In (Torres-Salomao et al., 2015), authors presented a study for human stress classification scheme using pupil diameter. Mental arithmetic task questions were asked of the participants in front of a camera and the changes in pupil diameter were observed. The authors concluded that pupil diameter can be a good indicator of mental stress but for better classification results it needs to be combined with physiological signals.
The use of pupil dilation for stress analysis has some limitations, which need to be addressed. The size of the human pupil is not constant throughout life i.e., the size of the pupil decreases with increasing age (Winn et al., 1994). Ambiguity exists on the effect of gender in the pupil size because there exist some studies which show no correlation (Winn et al., 1994). On the other hand, some studies show gender affects pupil size when faced with a painful (Ellermeier and Westphal, 1995) and audio stimulus (Partala and Surakka, 2003). Lightening conditions affect pupil size due to the in-built light reflexes of the human being (Pedrotti et al., 2014; Reeves, 1920). Thus, to use pupil dilation for human stress assessment it is necessary to take into consideration these limitations and precautionary measures need to be taken beforehand. Table 10 presents a summary of human stress classification schemes using pupil dilation.
Table 10: Summary of Human Stress Detection Studies using Pupil Dilation. Method Type of Stress Number of Subjects (M/F) Age Stimulus Features Domain Classifier Accuracy (Classes) (Ren et al., 2012) Acute 30 (14/16) 26.82.56 SCWT Time NB 85.5% (2) (Zhai and Barreto, 2006) Acute 32 21-42 SCWT and Emotional pictures Time and Frequency SVM 90.10% (2) (Pedrotti et al., 2014) Acute 33 (16/17) 23-54 Driving task Frequency ANN 79.20% (2) (Baltaci and Gokcay, 2016) Acute 11 (9/2) 29-40 IAPS Time ABRF 65-83.8% (2) SCWT: Stroop color-word test, ANN: Artificial Neural Network, SVM: Support Vector Machine, NB: Naive Bayes, ABRF: Adaboost with Random Forest, IAPS: International Affective Picture System
-
2.
Speech Based Measures: Stress measurement using speech features has been one of the focuses of the research community. Stress in the voice is defined as “observable variability in certain speech features due to a response to stressors (Murray et al., 1996). Stress measurement from a human voice is a dynamic process. Stress is measured by the nonverbal component of voice. Speech components have variations while facing a stressful stimulus (Womack and Hansen, 1999). Vocal stress analysis has been performed to identify the discriminating voice features of stressed and neutral conditions (Lefter et al., 2015). The pitch of the speech signal is found as a distinct feature under emotional stress and is increased when an individual is feeling stressful (Williams and Stevens, 1972; Hansen, 1988; Cairns and Hansen, 1994; Junqua, 1996; Protopapas and Lieberman, 1997; Hansen and Patil, 2007; Gharavian, 2012; Lu et al., 2012; Kurniawan et al., 2013; Sondhi et al., 2015; Hansen et al., 2011). In (Nwe et al., 2003), the author suggests that the change in speed of fundamental frequency of voice is the most important feature for stress measurement. Speech signals-based human stress measurement has also been discussed in (Fernandez and Picard, 2003; Healey and Picard, 2005; Lefter et al., 2011). Articulatory, excitation, and cepstral-based features have been used in (Womak and Hansen, 1996) to identify stress in speech signals, and a classification accuracy of 91% is achieved. A study conducted in (Cairns and Hansen, 1994) distinguished between the loud, angry, neutral, clear speech, and Lombard effect by using speech features of intensity, spectral tilt, and energy. Another speech-based stress classification scheme using spatial and spectral domain features is presented in (Devillers and Vidrascu, 2006). The frequency of the speech signal in an angry, Lombard effect, and loud state is different from each other (Hollien, 2002). In (Simantiraki et al., 2016), the author extracted the spectral tilt feature from the speech signal and found it to be less negative under stressful conditions. The energy of the equivalent rectangular bandwidth band obtained from the spectrogram and Gabor filters are used in (He et al., 2009) to identify stress recognition with an accuracy of 79%. Stress classification in a noisy environment is performed using the Teager Energy Operator (TEO) features in (Hanson et al., 1993). Speech signal has been analyzed for stress using multi-resolution wavelet analysis (MWA) in (Sarikaya and Gowdy, 1998) and a fusion of TEO and MWA in (Fernandez and Picard, 2003). Hidden Markov Model (HMM) and TEO have been used for the analysis of stress in speech signals (Hansen et al., 2011). Physical features of the vocal cords of a person are examined in (Yao et al., 2012) to identify stress in speech. The performance of automatic speech recognition could be improved if the speaker stress is accurately identified (Kadambe, 2007). Another speech-based human stress measurement scheme is proposed in (Soury and Devillers, 2013). TSST was used as a stimulus and an SVM classifier were used to classify the stress with an achieved recall rate of 72%. Table 11 presents a summary of human stress classification schemes using speech-based measures.
Table 11: Summary of Human Stress Detection Studies using Speech based Measures. Method Type of Stress Number of Subjects (M/F) Age Stimulus Features Domain Classifier Accuracy (Classes) (Kurniawan et al., 2013) Acute 10 – SCWT, MAT Time and Frequency SVM 92.00% (2) (Womack and Hansen, 1999) Acute 44 (30/14) 22-76 Speech Time and Frequency HMM 92.41% (2) (Lefter et al., 2015) Acute 16 – Speech Time and Frequency BN 73.00% (2) (Cairns and Hansen, 1994) Acute 32 (19/13) 22-76 SUSAS Frequency HMM 99.10% (2) (Hansen and Patil, 2007) Acute 32 (19/13) 22-76 SUSAS Frequency HMM 73.80% (2) (Lu et al., 2012) Acute 14 (4/10) 22.86 Job Interview Frequency GMM 81.00% (2) (Fernandez and Picard, 2003) Acute 4 – driver speech Frequency SVM 51.20% (4) (Womak and Hansen, 1996) Acute 32 (19/13) 22-76 SUSAS Frequency HMM 80.64% (3) (Simantiraki et al., 2016) Acute 32 (19/13) 22-76 SUSAS Frequency RF 92.06% (2) (He et al., 2009) Acute 32 (19/13) 22-76 SUSAS Frequency GMM 81.00% (2) (Sarikaya and Gowdy, 1998) Acute 32 (19/13) 22-76 SUSAS Frequency MLP 70.00% (2) (Soury and Devillers, 2013) Acute 29 (12/17) – TSST Time and Frequency SVM 72.00% (2) MAT MAT: Mental Arithmetic Task, SCWT: Stroop color-word test, SVM: Support Vector Machine, FDA: Fisher discriminant algorithm, HMM: Hidden Markov Model, BN: Baysian network, GMM: Gaussian Mixture Model, RF: Random Forest, MLP: Multilayer Perceptron
-
3.
Eye Activity: Functioning and behavior of the eye are affected by stress and this fact is supported by different studies. A study for human stress detection using eye blink rate and brain activity of the subject was proposed in (Haak et al., 2009). The stimulus used in the experiment was driving a car in a simulator on a road that included steep and sharp curves and were having many attention-seeking advertising boards. While driving on this road, stressful emotions were elicited in the drivers resulting in a change in eye blink rate and brain activity. A correlation between the eye blinks of the participants and the experienced stress level was established and a higher frequency of eye blinks was observed as an indication of the individual experiencing a stressful condition. The stressful stimulus causes an increase in the eye blink rate of the person as reported in the studies conducted in (Haak et al., 2009; Giannakakis et al., 2017). A biometric identification application of human stress detection is proposed in (Pavlidis et al., 2000). Images are used to detect the facial expressions and eye movements corresponding to anxiety, alertness, and fearfulness, and rapid eye movement under a stress state was reported. The biometric application was based on the idea of "what you are doing" instead of the traditional approach of "who are you". The study reported encouraging results of the proposed scheme. A human stress detection framework based on facial cues using features of eye movement, mouth activity, head movement, and heart rate acquired via PPG signal is presented in (Giannakakis et al., 2017). Four different stressors which include social exposure, emotional recall, stressful images, and stressful videos were used in the experiment. Social exposure stressors included a task of the text reading and self-description speech. Eye blink rate was reported to be increased in response to stressful images and the Stroop color-word test, whereas reading a difficult text causes the eye blink rate to get reduced. Moreover, an increase in the eye aperture was observed in a stressful situation. Stress affects the eye gaze behavior of a person. In (Laretzaki et al., 2011), authors presented a study to determine if and how threat and trait anxiety interact to affect the stability of gaze fixation. Video oculography was used to estimate the gaze position with and without gaze fixation stimulus in a safe and verbal threat condition in subjects characterized for their trait anxiety. Trait anxiety significantly showed that there is a gaze fixation instability under threat conditions. Some stress detection studies have employed different gaze features like gaze direction, congruence, and size of gaze-cue for the assessment of stress (Fox et al., 2007; Staab, 2014). A study to investigate the role of neutral, angry, happy, and fearful facial expressions in enhancing orienting to the direction of eye gaze is presented in (Fox et al., 2007). Photographs of faces with either direct or averted gaze are used as a stimulus in the experiment. A target letter appeared unpredictably to the left and right sides of the face. approximately 300 ms or 700 ms after the eye gaze direction changed. It is observed from the results that the response time of the participant is less when the eyes in the image gazed toward the subject as compared to the conditions when the eye gazed away from the subject. An enhanced orientation to the eye-gaze of faces with fearful expressions is reported in participants with high trait anxiety scores as compared to participants with low trait anxiety scores. A review to analyze the effect of anxiety on the ocular motor control and the gaze of the subject is presented in (Staab, 2014). Another human stress measurement scheme using the eye-tracking feature is proposed in (Mokhayeri and Akbarzadeh-T, 2011). SWT is used to induce stress in the participants of the experiment. A genetic algorithm is employed to detect the human eye and the noise is removed by using a fuzzy filter. Fuzzy-SVM classifier is used to classify human stress into two classes with an accuracy of 70%. Table 12 presents a summary of human stress classification schemes using eye activity measures.
Table 12: Summary of Human Stress Detection Studies using Eye Activity Measure. SCWT: Stroop color-word test, SVM: Support Vector Machine, IAPS: International Affective Picture System
-
4.
Body Postures: Body language is a non-verbal type of communication in which physical behavior instead of words is used to convey information. Visual cues-based behavioral features for human stress measurement are presented in (Aigrain et al., 2015). Behavioral body language features used in the study are visual cues that are extracted from the data acquired by Kinect and an HD camera. The stimulus used for eliciting stress in the participant was a mental arithmetic task. Classification accuracy of 77% is achieved using a support vector machine classifier. Another human stress measurement scheme based on activity-related behavioral features is proposed in (Giakoumis et al., 2012). Accelerometer, video-based camera, ECG, and GSR sensors are used to record the behavioral features of the subject. The Stroop color-word test is used as a stress-inducing stimulus for the experiment. The study concluded that the behavioral features extracted correlated with the self-reported response. Behavioral features proved to be better as compared to other physiological signals for the measurement of stress. Classification is performed using linear discriminant analysis and maximum classification accuracy of 96.30% is achieved. A human stress recognition framework by use of behavioral features extracted by their interaction with technological devices is proposed in (Carneiro et al., 2012). Eight different behavioral, cognitive, and physical features are examined for the analysis of the effect of different levels of acute stress. A statistical test is applied to measure the difference between different levels of stress. The study revealed the fact that the mean and maximum intensity of the touch is the feature that correlated strongly to human stress. It is also observed that if the stress level of an individual is high then there is less movement in the upper part of the human body. Emotional states including anxiety of an individual are examined using facial cues and gestures from the upper part of the body in (Gunes and Piccardi, 2007). Stress monitoring by the movement of head and mouth muscles is done (Liao et al., 2005; Bevilacqua et al., 2018). A study to analyze the facial cues for the estimation of the difference between boredom and stress of a computer game player is presented in (Bevilacqua et al., 2018). Seven different facial features are extracted from the players playing the game and it is concluded that 5 out of these 7 features showed a significant difference in boredom and stress state. The head moves under stressful conditions have been reported to be more often (Liao et al., 2005), more quick (Dinges et al., 2005; Giannakakis et al., 2018), and the overall head movement is also large (Hadar et al., 1983; Giannakakis et al., 2018). In a study conducted in (Dinges et al., 2005), the authors proposed a scheme to detect facial changes during a performance by using optical character recognition in response to low and high stress. Workload and social feedback are used as stress-inducing stimuli in the experiment. The study concluded that the OCR algorithm when applied using mouth and eyebrow region features was able to identify around 75-88% of the stressed and non-stressed individuals. A study conducted to find the association of the head poses with different kinds of stressors IS proposed in (Giannakakis et al., 2018). Four different stressors which included, social exposure, emotional recall, stress images or mental tasks, and stressful videos are used to induce stress in the participant. Video recording of the subject is performed when facing each stressor. Head movement and pose features are extracted from the recorded videos. The study reports the fact that more quick head movement is observed in participants when facing stressful situations. The Pitch feature showed a significant difference in the stress and neutral state. The highest classification accuracy of 98.6% for neutral vs stress state classification is achieved using a kNN classifier with K=3. A study to analyze the head movement in the context of speech during neutral and stress conditions is presented in (Giannakakis et al., 2018). The tasks involved in stimulus presented to the participants included neutral tasks, interviews, reading text, anxious and stressful event recall, and stressful images and videos. Translational and rotational head movements are used as a feature to assess the stress and neutral state. The study reveals the fact that facing a stressful situation makes the head movement pattern swift and fast. Emotional situations have been identified using head shakes and nods in (Adams et al., 2015). Another study about the relationship of body postures with human stress level is presented in (Arnrich et al., 2009). The study is aimed at finding whether stress-related information can be obtained from the posture data in an office work scenario. MIST is used as a stimulus and features are extracted from the pressure distribution on the chair and given to a self-organizing map classifier to classify the stress response. A classification accuracy of 73.75% is achieved for the proposed scheme. Table 13 presents a summary of human stress classification schemes using body postures.
Table 13: Summary of Human Stress Detection Studies using Body Postures. Method Type of Stress Number of Subjects (M/F) Age Stimulus Features Domain Classifier Accuracy (Classes) (Carneiro et al., 2012) Acute 19 – Computer game Time DT 78% (2) (Giannakakis et al., 2018) Acute 24 (17/7) 47.39.3 MAT, stressful images Time GLR 97.90% (2) (Dinges et al., 2005) Acute 60 (29/31) 30 Workload and social feedback Time OCR 75-88% (2) (Arnrich et al., 2009) Acute 33 (33/0) 24.06 MIST Frequency SOM 73.75% (2) MIST: Montreal Imaging Stress Task, MAT: Mental Arithmetic Task, OCR: Optical Character Recognition, SOM: Self-Organizing Map, DT: Decision Tree, GLR: Generalized Likelihood Ratio
4.2.2 Behavioral Measures
Behavior measures correspond to the type of behavior a person adopts when interacting with a certain thing. Behavioral measures have been used in literature for the detection of human stress. Behavioral measures of stress can be sub-divided into the following types i.e., interaction with a computer mouse, interaction with a computer keyboard, and interaction with smartphones. Literature corresponding to each of these types is presented as follows.
-
1.
Interaction with Computer Mouse: Different mouse interaction-based stress measurement studies have been developed in the literature. An approach to measuring human stress by embedding sensors in the computer mouse to measure the physiological signals while the user is using the mouse is presented in (Liao et al., 2005). Cameras, pressure sensors, temperature sensors, and GSR sensors are integrated within the mouse to measure the physiological signals to correlate them to the stress of an individual. A capacitive mouse that measures the amount of interaction and the pressure exerted on the computer mouse is developed in (Hernandez et al., 2014). The authors concluded that the stressed individuals have a significantly higher contact time with the mouse as compared to non-stressed individuals. Another model of how the user moves the mouse under stress is developed in (Sun et al., 2014). The authors proposed an arm-hand dynamics model to measure the muscle stiffness of the subject while moving the mouse. Mouse speed, click rate, and mouse inactivity have been correlated to stress in (Lim et al., 2014). Different features extracted from the movement of the mouse are associated with stress during examination (Carneiro et al., 2015). Table 14 presents a summary of human stress classification schemes using computer-mouse interaction.
Table 14: Summary of Human Stress Detection Studies using Computer Mouse Interaction. SVM: Support Vector Machine, DT: Decision Tree, NB: Naive Bayes
-
2.
Interaction with Computer Keyboard: Interaction with a computer keyboard has also been used as a measure of human stress in the literature. A study presented in (Rodrigues et al., 2013) developed a keyboard dynamics-based approach to measure stress in university students by recording their key latency and writing speed on the keyboard. Another study considered average key latency, average typing speed on the keyboard, and the error rate as a feature to measure the human stress (Lim et al., 2014). Case-based reasoning systems along with multiple features extracted from the interaction with the keyboard have been used for human stress classification (Andrén and Funk, 2005). A pressure-sensitive keyboard has been developed in (Hernandez et al., 2014) that gives a pressure value between 0 and 255 for each keystroke on the keyboard. Using the pressure values obtained from the keyboard, the stress of the user is measured. Keystroke dynamics is an important measure of human stress because stress causes an effect on different muscles of the human body like around arms, hands, and shoulder muscles. Author in (Gunawardhane et al., 2013) developed a stress measurement scheme using three features of keystroke dynamics which include durations between key pressers of specific digraphs, trigraphs, and an error rate of backspace and delete. A statistical test was applied to the data to show that there exists a significant difference in the keystroke dynamics of the stressed and non-stressed individuals.
-
3.
Interaction with Smartphones: Smartphones have completely been revolutionized in the last decade and evolved into a mini-computer with far more functionalities and power as compared to traditional mobile phones. Due to this technological revolution, smartphones have facilitated physicians to get real-time data of patients in just no time. Moreover, applications for smartphones have been built, which enable the users to monitor their health and get advice or alerts on a particular situation (Kailas et al., 2010). Mobile phones are being embedded with sensors like heart rate and body temperature to analyze the health state in a very cost-effective manner. Mobile applications make use of these in-built sensors for health monitoring. Even though these applications are being built with a lack of any kind of scientific validity, but due to their low or even no cost can reach hundreds of thousands of users in no time. Azumio’s Stress Check and StressViewer (Carneiro et al., 2017) apps utilize the light and the camera of the smartphone to monitor the heart rate of the user. Different apps are also available that not only measure the stress but also provide breathing and some other exercises for relieving the stress. DeStressify (Lee and Jung, 2018) is another app, which is developed to relieve stress based on music. EDA sensor is used by stress-relieving apps named PIP Relax and Race (Dillon et al., 2016). In these two apps, the user has to participate in a race and the participant which is more relaxed wins the race. DroidJacket (Colunas et al., 2011) is another app integrated with VitalJacket-a shirt with an integrated ECG sensor to continuously monitor the health of a person (Colunas et al., 2011). A specific sensor platform named a Personal Biomonitoring System is used along with smartphones to measure the stress (Gaggioli et al., 2012). Another smartphone-based approach for the measurement of stress using the features of the speech signal of the user is discussed in (Lu et al., 2012). A stress classification accuracy of 82.9% is achieved for indoor scenarios and 77.9% for outdoor scenarios. Stress-related changes in human behavior using GPS, WiFi, Bluetooth, phone calls, and SMS logs features of a smartphone are explored in (Bauer and Lukowicz, 2012). Human stress measurement at the workplace is very important to measure for the better mental and physical health of the employees. A human stress measurement scheme to measure the stress of workers during the workday and sleep at night is presented in (Muaremi et al., 2013). Features extracted from the audio, physical activity, and communication data recorded during daytime and heart rate variability data recorded during night sleep are used to build logistic regression models. A leave-one-out cross-validation scheme is used for the classification purpose and a classification accuracy of 61% is achieved for three-level stress classification. A new stress recognition framework named AMMON (Affective and Mental health MONitor) which is a speech analysis library for analyzing effect and stress directly on mobile phones is proposed in (Chang et al., 2011). Stress classification is performed and a classification accuracy of 84% is achieved for two-class stress classification. A stress recognition framework using the accelerometer sensor of the smartphone is proposed in (Garcia-Ceja et al., 2015). Oldenburg burnout inventory (OLBI) questionnaire is used to acquire the subjective response from the users and features are extracted in the time and frequency domain and fed to a Naive Bayes and decision tree classifier. A classification accuracy of 71% is achieved for user-specific models. A driver stress monitoring system using inertial sensors is proposed in (Lee and Chung, 2016). For comparison of the results, GSR, self-reporting questionnaire, and facial expressions are employed. Forty-six features are extracted from the data which were subjected to feature selection resulting in 22 features. SVM classifier is used to discriminate the low-stressed participants from the high-stressed participants with achieved accuracy of 94%. A student stress measurement mechanism using smartphone sensors is proposed in (Gjoreski et al., 2015). The authors used an accelerometer, GPS, WiFi, time and duration of calls, light sensor data, and a self-reported questionnaire for the classification of stress. Forty-seven features are extracted from the acquired data and a classification accuracy of 60% is achieved for three classes. Classification in this study is performed in such a manner that the data of each student is divided into two parts ie., some features of each student are used for training, and some features are used for testing. An automatic stress measurement system for graduate students using smartphone data is proposed in (Bogomolov et al., 2014a, b). Smartphone data which included mobile phone activity of call and SMS logs and Bluetooth proximity hits, weather conditions, and personality traits are recorded from 227 students for a duration of one year. Weather conditions are divided into mean temperature, pressure, total precipitation, humidity, visibility, and wind speed whereas personality traits are obtained by using the big five personality trait questionnaire and are labeled into extraversion, neuroticism, agreeableness, conscientiousness, and openness to experience. Subjective labeling of stress for the recorded data is obtained by using a self-reported questionnaire. A wide range of classification algorithms is applied but the random forest algorithm proved to be the best with an achieved classification accuracy of 72% and a feature reduction from 500 features to 32 features. Another human stress mechanism using mobile phone activity both in the laboratory environment and out of the lab environment is proposed in (Ciman and Wac, 2016). For the controlled lab environment part of the experiment, an android application that contained search and writing tasks is developed. The user activities which are monitored during the performance of these tasks include users’ tap, scroll, swipe, and text input gestures. Stressors are used to induce stress in the participants and the Experience Sampling Method is used to obtain the subject stress scores. kNN, SVM, decision trees, and neural networks classifiers are used with achieved accuracy of 80%. For the out-of-lab environment, the activities of the subjects including the type of applications used, user physical activity, and light values of the screen are recorded using the daily life usage of mobile phones. The achieved classification accuracy for this part of the experiment is 70%. Another smart sensor-based and context-aware stress measurement scheme for daily life stress monitoring is proposed in (Gjoreski et al., 2017). Real-life data of 55 days is recorded and precision and recall of 95% and 70% are achieved, respectively. Smartphone data has been used in the stress recognition framework proposed in (Gimpel et al., 2015). The authors developed an android application and used 36 software and hardware sensors in their study. The authors did not report any classification accuracy but they found that high smartphone usage, average battery temperature, the maximum number of running applications, and the frequency of switching the display on are the features that are strongly correlated to stress. Another daily life stress monitoring system using smartphone sensors is proposed in (Sysoev et al., 2015). Audio, gyroscope, accelerometer, ambient light sensor data, screen mode changing frequency, self-assessment, and activity type are used as a feature, and NASA-TLX is used as a subjective stress questionnaire. Activity recognizer is used along with the stress recognition system to achieve a classification accuracy of 77%. Another stress recognition framework called as StayActive is developed for android phones in (Kostopoulos et al., 2017). Social interaction, physical activity, and sleeping patterns are used for the measurement of stress. A fusion of offline mathematical modeling and online machine learning models is used to identify stress and give some relaxation therapy when the stress is identified. The Circumplex Model of Effect with some modifications about stress measurement is used as a questionnaire to obtain the subjective score. The number of sleeping hours is used as a feature of sleep patterns, the number of touches on the screen, the number of calls, and SMSs are used as a feature of social interaction. The author did not report any accuracy but they intended to use physiological signals along with a smartphone in the future to further improve the results of the proposed stress measurement scheme. Another unsupervised stress classification scheme using smartphone data is proposed in (Vildjiounaite et al., 2018). The hidden Markov model is used for stress classification and an accuracy of 68% is achieved. Table 15 presents a summary of human stress classification schemes using smartphone interaction.
Table 15: Summary of Human Stress Detection Studies using Smartphone Interaction. Method Type of Stress Number of Subjects (M/F) Age Stimulus Features Domain Classifier Accuracy (Classes) (Lu et al., 2012) Acute 14 (4/10) 22.86 Job interviews,Marketing jobs Time and Frequency GMM 81.00% (2) (Muaremi et al., 2013) Acute 35 (24/11) 25-62 Day long recording Time and Frequency LR 61.00% (3) (Garcia-Ceja et al., 2015) Chronic 30 (18/12) 37.467.26 Day long recording Time and Frequency DT, NB,ONB 71.00% (2) (Lee and Chung, 2016) Acute 8 (6/2) 305 Car Driving Time and Frequency SVM 94.78% (2) (Gjoreski et al., 2015) Chronic 48 – Day long recording Time SVM, DT, RF 60.00% (3) (Ciman and Wac, 2016) Acute 13 (7/6) 22-32 MAT Time kNN, SVM,DT, NN 80.00% (5) (Gjoreski et al., 2017) Chronic 21 284 Day long recording Time and Frequency DT, NB,kNN, SVM, RF, ES 73.00% (3) (Sysoev et al., 2015) Chronic – – Real life activities Time RF, SL 77.00% (2) (Vildjiounaite et al., 2018) Chronic 30 – Real life activities Time and Frequency HMM 68.00% (2) MAT MAT: Mental Arithmetic Task, SVM: Support Vector Machine, DT: Decision Tree, kNN: K- nearest neighbors, NN: Neural Network, NB: Naive Bayes, ONB: Ordinal Naive Bayes, ES: Ensemble Selection, SL: Simple Logic, GMM: Gaussian Mixture Models, LR: Logistic Regression, RF: Random Forest, HMM: Hidden Markov Model
4.2.3 Vision based Measures
Vision-based measures have also been used for human stress detection and used some kind of imaging modality for measuring the response of the user. Vision-based techniques can be sub-divided into thermal infrared (IR) and computer vision-based techniques. Literature for each of these sub-divisions is given below.
-
1.
Thermal Infrared Imaging: Thermal IR imaging is a non-invasive and contactless technique used to measure the temperature of the human skin. In this technique, a thermal infrared camera is used to record the oxygen tissue saturation level. The benefit of this technique is that it is not affected by skin color and lighting conditions. When a person is feeling stressed, the flow of blood in the vessels get increases, and hence the temperature in the adjacent regions is raised. Human affective states like fear (Levine et al., 2001), arousal (Nozawa and Tacano, 2009), and stress (Ioannou et al., 2014) have been recognized using thermal imaging (Nhan and Chau, 2009). In most of the affect recognition studies, facial skin temperature is measured using thermal IR imaging to extract some useful information (Nhan and Chau, 2009; Shastri et al., 2008) Skin temperature of the nose, chin, and corrugator is affected due to stressors (Hong and Hong, 2016). Even though no conclusive remarks can be given of the effect of stress on a specific region of the face. However, in studies conducted in (Puri et al., 2005; Chen et al., 2014), forehead temperature is raised under stressful conditions. Periorbital areas also show signs of increasing temperature under anxious states (Pavlidis and Levine, 2002; Pavlidis et al., 2000). Skin temperature is also reported to increase in supraorbital and periorbital areas under stress (Shastri et al., 2008). Studies conducted in (Engert et al., 2014; Vinkers et al., 2013; Kang et al., 2006) showed an increase in nose temperature when an unknown task is presented to the participants. A decrease in the temperature of the perinasal area is found under stressful condition (Pavlidis et al., 2012; Shastri et al., 2012). Another thermal camera-based stress recognition framework is proposed in studies conducted in (Cho et al., 2017a, b). A thermal camera is used to detect breathing and a respiratory spectrogram was used to extract features. SWT and the mental arithmetic task are used as a stimulus to induce stress in the lab environment. Convolutional Neural Network (CNN) classifier is used for two and three-level stress classification. Two-level stress classification accuracy of 84.59% and three-level stress classification of 56.52% is achieved for the proposed scheme. Table 16 presents a summary of human stress classification schemes using thermal imaging.
Table 16: Summary of Human Stress Detection Studies using Thermal Imaging. Method Type of Stress Number of Subjects (M/F) Age Stimulus Features Domain Classifier Accuracy (Classes) (Nhan and Chau, 2009) Acute 12 (3/9) 242.9 Visual stimulus Time and Frequency LDA 70-80% (6) (Hong and Hong, 2016) Acute 41 20-65 TSST Frequency DEFP 90.00% (2) (Chen et al., 2014) Acute 21 (19/2) 25 TSST Frequency Binary classifier 88.10% (2) (Cho et al., 2017a) Acute 8 (5/3) 18-53 SCWT, MAT Time CNN 84.59% (2), 56.52% (3) TSST: Trier Social Stressor Test, MAT: Mental Arithmetic Task, SCWT: Stroop color-word test, LDA: Linear Discriminant Analysis, DEFP: Differential Energy between Philtrum and Forehead, CNN: Convolutional Neural Network
-
2.
Computer Vision: In computer vision-based, human stress assessment, many different organs, and locations of the human body have been used, but the face is the most commonly used location for monitoring stress. Authors proposed a computer recognition algorithm for use by astronauts to identify the facial changes occurring in response to low and high stressor (Dinges et al., 2005). Another study to identify the stress of the drivers using facial expressions is presented (Gao et al., 2014). Thermal imaging can be used to measure blood perfusion which is correlated to human stress (Derakhshan et al., 2014). Another study analyzed the recorded video by use of both temporal thermal spectrum and visible spectrum video features to measure the stress (Sharma et al., 2014). Another human stress measurement scheme using Kinect sensors is proposed in (Aigrain et al., 2015). The participants of the experiment are asked to give answers to the time-constrained arithmetic questions in front of a video camera. Facial features along with body postures are extracted and fed to an SVM classifier for stress classification. An accuracy of 77% is achieved for stress vs non-stressed class classification. Changes in the facial blood flow using thermal and visible cameras are used for stress detection in the study conducted in (Mohd et al., 2015). It was reported in the study that facial thermal features are difficult to attain due to low contrast so they applied a Nostril mask to focus on the nostril area. Noise smoothing is performed using graph cut algorithms and feature extraction is performed using Scale Invariant Feature Transform resulting in a classification accuracy of 88.6% for two classes. Facial hyperspectral imaging (HSI) technique and tissue oxygen saturation (StO2) data are used to identify stress in a study conducted in (Chen et al., 2014). Results obtained from thermal imaging and HSI are compared in the proposed scheme. TSST is applied to induce stress in the participants of the experiment. It is reported that the StO2 in the eye and forehead of the subject are discriminative features for the identification of stress. An accuracy of 76% with automatic thresholding and 88% for manual thresholding is achieved for two-level stress using computer vision-based techniques.
Table 17: Summary of Human Stress Detection Studies using Computer Vision Based Techniques. Method Type of Stress Number of Subjects (M/F) Age Stimulus Features Domain Classifier Accuracy (Classes) (Gao et al., 2014) Acute 21 – Car driving Time SVM 90.50% (2) (Derakhshan et al., 2014) Acute 12 – peak of tension (POT) test Time SVM 96.00% (2) (Sharma et al., 2014) Acute 35 (22/13) – Video clips Time and Frequency SVM 86.00% (2) (Aigrain et al., 2015) Acute 14 (11/3) 24.82.8 Public speaking, MAT Time and Frequency SVM 77.00% (2) MAT: Mental Arithmetic Task, SVM: Support Vector Machine
5 Multimodal Stress Detection
Multimodal human stress detection has been focused on in literature in a wide range of studies. The primary aim of the multimodal stress detection framework is to increase the system accuracy as compared to single-modality stress measurement systems. Multimodal stress detection schemes available in the literature can be sub-divided into (i) fusion of data recorded from different physiological modalities, (ii) fusion of data obtained from motion and physiological sensors (iii) fusion of data obtained from imaging modalities and physiological sensors, (iv) fusion of data obtained from smartphones and physical, behavioral and physiological sensors. In this section, we will discuss available literature for stress measurement using all kinds of multimodal fusion approaches.
A multimodal human stress measurement is proposed in (Al-Shargie et al., 2016), where EEG and functional near-infrared spectroscopy (fNIRS) are used to classify acute stress. Classification accuracy of 96.6% is achieved with EEG and fNIRS data. Another human stress measurement system using GSR and skin temperature is carried out in (Kyriakou et al., 2019) with an achieved accuracy of 84%. Another real-time stress detection scheme using heart rate, skin conductance, and accelerometer sensors is proposed in (Can et al., 2019). Using a fusion of features from these sensors an accuracy of 92.15% is achieved for three-level stress classification. A multimodal stress classification framework for drivers using the physiological signal of PPG and inertial sensors of accelerometer, gyroscope, and magnetometer is proposed in (Lee et al., 2016). Driving was performed in a simulator environment and a driving behavior survey questionnaire is used to obtain the subjective response from the subjects. Time and frequency domain features are extracted from the acquired data and stress classification is performed using an SVM classifier with a radial basis function (RBF) with an achieved accuracy of 95% for two classes. A stress recognition framework for driver stress monitoring using physiological signals of GSR, ECG, and respiration is proposed in (Chen et al., 2017). Features are extracted in time, frequency, and wavelet domain, and PCA and Sparse Bayesian Learning (SBL) algorithms are applied for feature selection and SVM for classification resulting in an accuracy of 99% for three classes. Another multimodal driver stress recognition framework using DRIVE DB from the PHYSIONET database and physiological signals of GSR, EMG, and ECG is proposed in (Ghaderi et al., 2015). Three-level stress classification is performed using kNN and SVM classifier and a classification accuracy of 98% is achieved. Another multimodal stress classification scheme using physiological signals of BVP, HR, ST, GSR, and RR is proposed in (Gjoreski et al., 2016). The mental arithmetic task is used for the induction of stress and 63 features are extracted from the recorded data. For the in-lab experiment, two (non-stressed, stressed) and three (no stress, low stress, and high stress) level stress classification is performed. For two-level stress classification, an accuracy of 83% is achieved whereas for a three-class problem, an accuracy of 72% is achieved. For the out-of-lab environment, experimental activities of walking, sitting, running, and cycling are recorded. All these activities are numbered according to their intensities i.e., 1 for lying and 5 for running. To determine the stress-inducing interval, the average intensity of the interval was calculated. The importance of recording the activities along with their intensity was to provide context to the situation to create a distinction between a strong physical activity and a stressful situation. The day-long activity is subdivided into one-hour episodes. An accuracy of 76% and 92% is achieved with no-context and with context scenarios, respectively. Another multimodal stress recognition frame framework using ECG signals along with activity and contextual data is proposed in a study conducted in (Maier et al., 2014). The application they designed measured the stress and when the stress exceeded a certain threshold the user is allowed to quit a stressful situation or is given some relaxation therapy to reduce the level of stress. Accelerometer and GPS data are added to the HRV data obtained from ECG data to achieve the accuracy of the system. The authors did not report any classification accuracy for the proposed scheme. Another stress measurement scheme using accelerometer and EDA data obtained from the wrist sensors, call and SMS data, location and screen on/off features obtained from mobile phones, and subjective stress score using questionnaires is proposed in (Sano and Picard, 2013). Sequential Forward Floating Selection (SFFS) is used to select the optimum set of features which selected screen on/off, mobility, call acceleration, and EDA data features, and an accuracy of 75% is achieved for class stress classification using SVM and kNN as a classifier. Moreover, high-stress behavior is found to be associated with acceleration during sleep in the second half of the day, a small amount of SMS, and screen time. Another multimodal stress classification scheme using respiratory, ECG, and accelerometer sensors is proposed in (Hovsepian et al., 2015). The experimental setup included baseline recording, public speaking task, mental arithmetic task, and cold pressure test. This data is used to train the model using laboratory settings and data from 23 participants is recorded in the out-of-lab environment for testing purposes. SVM is used as a classifier and a recall of 89% is achieved on the test data from the lab environment and a classification accuracy of 72% is achieved on testing data from the out-of-lab environment. Another multimodal stress measurement study using an accelerometer, EDA, and Bluetooth sensor is presented in (Zubair et al., 2015). The experiment is performed in a controlled environment and logistic regression is used as a classifier to achieve an accuracy of 91% for two-class stress classification. A real-time stress recognition methodology using HR and EDA signals is proposed in (de Santos Sierra et al., 2010). The public speaking task is used as a stimulus and the kNN classifier is used to detect stress and relaxed state with an accuracy of 95%. PPG and EDA signals are used to identify stress in subjects in a study conducted in (Sandulescu et al., 2015). TSST is used to induce stress and an SVM classifier is used to classify stress into two levels with an accuracy of 80%. Another study using a combination of EDA and HRV signals for measurement of stress is proposed in (Martinez et al., 2017). Puzzles are used as a stress-inducing stimulus and an F-measure value of 0.984, 0.970, and 0.943 is achieved for the high, medium, and low-stress groups, respectively. Another stress detection scheme using physiological and sociometric sensors is proposed in (Mozos et al., 2017). Physiological sensors include EDA and PPG whereas sociometric sensors include microphone and accelerometer sensors. Public speaking is used as a stressor to induce stress in the participants and kNN, SVM, and AdaBoost are used as a classifier. AdaBoost classifier produces the highest accuracy of 94% for discriminating stress and neutral condition. In another study presented in (Kurniawan et al., 2013) author made use of GSR and speech signals for the measurement of stress. SWT, TMST (Trier Mental Stress Test), and TSST are used to induce stress in the participants. Time and frequency domain features are extracted from the speech signals. K-means, GMM, SVM, and decisions are used for classification purposes, SVM produced the best results for each type of stressor. Speech signals resulted in better classification accuracy as compared to EDA data. The fusion of speech data with the GSR signal did not increase the classification accuracy for stress classification. Another multimodal stress classification scheme using cardiac features along with EMG, GSR, and respiratory sensors and a Kinect-based video camera is proposed in (Aigrain et al., 2016). Moreover, in addition to the self-reported questionnaire feedback from the psychology expert is also added to the proposed system. SVM is used as a classifier and a classification accuracy of 85% for two classes is achieved. Pupil dilation and periorbital temperature data are used for stress classification in a study proposed in (Baltacı and Gökçay, 2014). IAPS is used as a stress-inducing stimulus for the experiment. The decision tree classifier resulted in a classification accuracy of 90% for two classes. The study proposed in (Baltacı and Gökçay, 2014) is improved by authors in their study conducted in (Baltaci and Gokcay, 2016) by the addition of entropy feature for the physiological signals. The study resulted in better classification accuracy as compared to the earlier studies by using the AdaBoost classifier with the Random Forest classifier instead of the decision tree. Human gaze and mouse click behavior are used for stress classification in (Huang et al., 2016). The stress stimulus used in the experiment is a mental arithmetic task. Random forest classifier achieved the highest accuracy of 60% for two classes for the generalized stress model. Another multimodal stress recognition framework for computer users using physiological signals of EEG, ECG, EMG, and EOG is proposed in (Akhonda et al., 2014). EEG data and the subjective questionnaire score is obtained only once at the start of the experimental procedure, whereas ECG, EOG, and EMG data are acquired continuously. A neural network is used as a classifier and three class stress recognition is performed with an achieved accuracy of 80%.
A stress detection system using physiological signals of ECG, respiration rate, skin temperature, and GSR is presented in (Shi et al., 2010) with a recall of 80%. Another human stress detection system using wearable EEG and ECG sensors is presented in (Ahn et al., 2019). Stroop color-word and the mental arithmetic test is used as a stimulus and an accuracy of 87.5% is achieved for stress classification. The fusion of ECG, EMG, GSR, and respiration signals are used to measure the driver’s stress in (Healey and Picard, 2005). Classification accuracy of 97% is achieved for three levels of stress. Another study to analyze the impact of human stress on the sleep pattern using wearable sensors of ECG, GSR, body temperature, and respiration is presented in (Muaremi et al., 2014). SVM, kNN, NN, RF (Random Forest), and logistic regression classifiers are used to classify the stress and SVM produced the best classification accuracy of 73% for three classes of stress. A cluster-based technique for the detection of perceived stress using EEG, ECG, GSR, and EMG signals is presented in (Xu et al., 2014). Real-time human stress classification using ECG and thoracic electrical bioimpedance (TEB) signals is presented in (Mohino-Herranz et al., 2015) with an error rate of 21%. Another stress detection study focusing the working people using ECG and GSR signals is presented in (Sriramprakash et al., 2017). The database used in the study was SWELL-KW and a classification accuracy of 72.82% is achieved for stressed vs non-stressed classes.
Another stress recognition system using respiratory rate along with GSR, EEG, and blood volume pressure is presented in (Hosseini and Khalilzadeh, 2010) with a classification accuracy of 82.7%. A stress assessment study for the office environment using HR, HRV, GSR, EMG, and respiratory rate is discussed in (Wijsman et al., 2013) with 74.5% as a reported accuracy. Driver stress has been monitored using ECG, GSR, and respiration rate in (Rigas et al., 2011). GSR, EMG, respiration, and HR combination have also explored driver stress level (Singh and Queyam, 2013). A study to classify the emotional states of stress and anger using GSR, EMG, BVP, and respiratory rate signals is discussed in (Picard et al., 2001). ECG, GSR, EMG, and respiration rate have also been explored for human stress assessment in (Wijsman et al., 2011). HRV, respiration, GSR, EMG, and geographical locations have been used for the detection of mental stress in (Choi, 2011). Stress level estimation using GSR, EMG, HR, and respiration sensors is presented in (Gjoreski et al., 2016). A human perceived stress measurement system using smartphone PPG and thermal imaging is presented in (Cho et al., 2019) with a reported average classification accuracy of 78.3%.
Another study to correlate the results of the human stress detection system based on ECG, EDA, and EEG sensors with the changes in the cortisol level of the subject is discussed in (Betti et al., 2017). The study reveals that the changes in cortisol levels were strongly in line with the physiological signal response. Classification accuracy of 86% is achieved for the stress classification. Another stress classification scheme using HRV features and cortisol as a reference is proposed in (Liew et al., 2015). Classification accuracy of 80% is achieved using a cortisol bio-marker. ECG and salivary cortisol are used for the measurement of different levels of psycho-social stress in (Nater et al., 2005). Bad childhood experience has been reported to cause a change in the physiological processes and can determine the magnitude of the stress response. HRV, BVP, ECG, and salivary cortisol are used in (Aimie-Salleh et al., 2018) to propose a stress response index that could be used as a future biomarker for such individuals. A fusion of keyboard strokes along with the linguistic features of the written text has been used in (Vizer et al., 2009) to measure the cognitive and physical stress of the user. The fusion of features from pupil diameter and physiological signals is used in (Barreto et al., 2007; Zhai and Barreto, 2008) to measure the stress. The stress of a computer user is measured by a fusion of features from physical appearance, physiological signals, and behavioral data in a study conducted in (Liao et al., 2005). In another study, accelerometer data and recorded videos are analyzed to monitor the stress response (Giakoumis et al., 2012). A novel stress detection framework based on three different state-of-the-art technologies which include Deep Learning (DL), blockchain, and the Internet of Medical Things (IoMT) has been proposed in Qi et al. (2023). The authors claim that the blend of these three technologies can help in mitigating the effects occurring due to long-term stress. The deep learning part of the system was evaluated on a publicly available WESAD dataset with a reported average accuracy of 99%. A stress detection framework for individuals suffering from communication diseases like COVID-19 is proposed in Khan et al. (2022). Wearable sensors which include ECG, oximeter, temperature, accelerometer, GPS, and pressure sensors are embedded in the clothes of the subject. The data from these sensors is transferred to a cloud-based service to execute the machine-learning-based prediction of human stress. A study focusing on human stress measurement of construction workers using heart rate, galvanic skin response, and the camera is presented in Rescio et al. (2023). An accuracy of 75.1% is reported for binary stress classification. A multimodal human stress assessment scheme using temperature, respiration, ECG, and EDA signals is presented in Mohammadi et al. (2022). A classification accuracy of 96% is reported using the KNN classifier. A deep learning-based multimodal worker’s stress recognition framework using electrocardiogram (ECG), respiration (RESP), and video data is presented in Seo et al. (2022). An average accuracy of 73.3% and 54.4% is reported for two and three-level stress classification. A CNN-based stress detection framework using physiological signals of EDA and ECG is presented in Kuttala et al. (2023). An accuracy of 97.6% is achieved for three-level stress classification. A human stress measurement scheme using a fusion of data from EDA, PPG, and ST sensors is presented in Nath and Thapliyal (2021). An accuracy of 94% is reported for two-level stress classification. A stress level detection framework using a fusion of features from ECG, EDA and EMG while playing a virtual reality video game is presented in Orozco-Mora et al. (2022) with an accuracy of 99% for four-level stress classification. A driver stress recognition scheme using a fusion of data from ECG, GSR and eye-tracking is presented in Vaitheeshwari et al. (2022) with a reported accuracy of 95.1%. A multimodal human stress assessment scheme using a fusion of data from GSR, PPG, and EEG signals in response to public speaking activity is presented in Arsalan and Majid (2021). An accuracy of 96.25% is reported for two-level stress classification. A study for the assessment of mental fatigue in construction workers using EEG signals and facial features is presented in Mehmood et al. (2022). A strong correlation was found between the recorded EEG signals and the facial features of the construction workers. Table 18 presents a summary of multimodal human stress classification schemes available in the literature.
| Method | Type of Stress | Modalities | Number of Subjects (M/F) | Age | Stimulus | Features Domain | Classifier | Accuracy (Classes) |
|---|---|---|---|---|---|---|---|---|
| (Al-Shargie et al., 2016) | Acute | EEG, fNIRS | (22 (22/0)) | 22-30 | MIST | Frequency | SVM | 95.10% (2) |
| (Kyriakou et al., 2019) | Acute | GSR, ST | 19 (8/11) | 25-45 | Audio | Time | – | 84.00% (2) |
| (Can et al., 2019) | Acute | HR, GSR, Acc | 21 (18/3) | 20 | Computer programming | Frequency | MLP | 92.15% (3) |
| (Lee et al., 2016) | Acute | Acc, Gyro, Mag | 28 (18/10) | 3516 | Car driving | Time and Frequency | SVM | 95.00% (2) |
| (Chen et al., 2017) | Acute | ECG, GSR, RR | 9 | – | Car driving | Time and Frequency | SVM | 99.00% (3) |
| (Ghaderi et al., 2015) | Acute | RR, GSR, HR, EMG | 17 | – | Car driving | Time and Frequency | SVM, kNN | 98.00% (3) |
| (Gjoreski et al., 2016) | Acute | BVP, HR, ST,GSR and RR | 21 | 284.1 | MAT | Time and Frequency | RF | 92.00% (2) |
| (Sano and Picard, 2013) | Acute | SC, Acc | 18 (15/3) | 28 7.8 | Daily Life Activity | Time and Frequency | SVM, kNN | 75.00% (2) |
| (Hovsepian et al., 2015) | Chronic | RR, ECG,Acc | 23 | – | Day long recording | Time | SVM | 95.30% (2) |
| (Zubair et al., 2015) | Acute | EDA, Acc, Bluetooth | 12 | – | MAT, Emotional pictures | Time | LR | 91.00% (2) |
| (de Santos Sierra et al., 2010) | Acute | HR, EDA | 80 (0/80) | 19-32 | Public Speaking | Time | kNN | 95.00% (2) |
| (Sandulescu et al., 2015) | Acute | PPG, EDA | 5 | 18-39 | TSST | Time and Frequency | SVM | 80.00% (2) |
| (Mozos et al., 2017) | Acute | EDA, PPG, Acc, microphone | 18 | – | Public Speaking | Time and Frequency | kNN, SVM, AdaBoost | 94.00% (2) |
| (Kurniawan et al., 2013) | Acute | GSR, Speech | 10 | – | SCWT, TMST, TSST | Time and Frequency | k-mean, SVM, GMM | 92.00% (2) |
| (Aigrain et al., 2016) | Acute | EMG, GSR, RR, Kinect | 21 (6/15) | 26.34.6 | MAT | Time and Frequency | SVM | 85.00% (2) |
| (Baltaci and Gokcay, 2016) | Acute | pupil dilation, periorbital temperature | 11 (9/2) | 29-40 | IAPS | Time | ABRF | 65%-84% (2) |
| (Huang et al., 2016) | Acute | Eye gaze, mouse click behaviour | 20 (13/7) | 20-33 | MAT | Time | RF | 60.00% (2) |
| (Akhonda et al., 2014) | Acute | EEG, ECG, EMG, EOG | 12 | – | Computer Work | Time and Frequency | NN | 80.00% (3) |
| (Ahn et al., 2019) | Acute | EEG, ECG | 7 | 29.32.4 | MAT, SWT | Time and Frequency | SVM | 87.50% (2) |
| (Healey and Picard, 2005) | Acute | ECG, EMG, GSR | 24 | – | Car driving | Time and Frequency | FDA | 97.00% (3) |
| (Muaremi et al., 2014) | Acute | ECG, GSR, ST, RR | 10 (7/3) | 41 | Sleep data | Time and Frequency | SVM, kNN, NN, RF, LR | 73.00% (3) |
| (Xu et al., 2014) | Chronic | EEG, ECG, GSR, EMG | 44 (44/0) | 28.67.2 | PASAT | Time and Frequency | k-Mean | 85.20% (3) |
| (Sriramprakash et al., 2017) | Chronic | ECG, GSR | 25 | – | Office work | Time and Frequency | SVM, kNN | 72.82% (2) |
| (Hosseini and Khalilzadeh, 2010) | Acute | GSR, EEG, BVP | 15 (15/0) | 20-24 | IAPS | Time and Frequency | SVM | 84.10% (2) |
| (Wijsman et al., 2013) | Acute | HR, HRV, GSR, EMG, RR | 30 (25/5) | 19-53 | calculation, puzzle and memory task | Time and Frequency | GEE | 74.50% (2) |
| (Rigas et al., 2011) | Acute | ECG, GSR, RR | 13 (10/3) | 22-41 | Car driving | Time and Frequency | BN | 96.00% (2) |
| (Wijsman et al., 2011) | Acute | ECG, RR, GSR, EMG | 30 (25/5) | 19-53 | calculation, puzzle and memory task | Time and Frequency | LBN | 80.00% (2) |
| (Gjoreski et al., 2016) | Acute | GSR, EMG, HR, RR | 26 | – | Daily life activity | Time and Frequency | RF | 92.00% (2) |
| (Cho et al., 2019) | Acute | PPG, Thermal imaging | 17 (8/9) | 29.82 | Mental workload | Time and Frequency | NN | 78.33% (2) |
| (Betti et al., 2017) | Acute | ECG, EDA, EEG | 26 (8/7) | 60.89.5 | MAST | Time and Frequency | SVM | 86.00% (2) |
| (Liew et al., 2015) | Acute | HRV, Cortisol | 22 (17/5) | 21 | TSST | Time and Frequency | FAM | 80.00% (2) |
| (Vizer et al., 2009) | Acute | keystroke, linguistic features | 24 (10/14) | 18-56 | Cognitive task | Time | DT, kNN, SVM, ANN | 75.00% (2) |
| (Barreto et al., 2007) | Acute | BVP, GSR, ST, PD | 32 | 21-42 | SCWT | Time and Frequency | SVM | 90.10% (2) |
| (Zhai and Barreto, 2008) | Acute | BVP, GSR, ST, PD | 32 | 21-42 | SCWT | Time | SVM | 90.10% (2) |
| (Giakoumis et al., 2012) | Acute | ECG, GSR, Acc, Video | 21 (17/4) | 30.43.7 | SCWT | Time | LDA | 100% (2) |
TSST TSST: Trier Social Stressor Test, TMST: Trier Mental Stress Test, PASAT: Effects of the Paced Auditory Serial Addition Task, LDA: Linear Discriminant Analysis, LBN: Linear Bayes Normal, MAST: Maastricht Acute Stress Test, FAM: Fuzzy ARTMAP, GMM: Gaussian Mixture Model, ABRF: Adaptive Boosting Random Forest, FDA: Fisher Discriminant Analysis, GEE: Generalized Estimating Equations
6 Future Directions
In this section, future directions which could be adopted for the improvement of existing human stress measurement methods and the open challenges that still need to be addressed in the literature are discussed.
One of the most important limitations of most of the existing stress measurement schemes is that they are performed in a well-controlled lab environment whereas measurement of stress in real-life poses a different set of challenges as compared to the lab environment. The challenges posed by real-life stress measurement scenarios include the occurrence of multiple stressors at the same time (unlike lab environment where a particular stressor is given to the participant at one time), incomplete contextual information like lack of information about changing room temperature, and the effect of outdoor environmental conditions on the acquired physiological signals. The addition of contextual information in real life, as well as laboratory settings, has been found useful toward efficient measurement of human stress in a study conducted in (Gjoreski et al., 2016) thus supporting the fact that contextual information is important and has not been widely considered in the available literature. In future stress measurement studies, challenges occurring due to the out-of-lab environment should be explored to make the available stress measurement method more practical in a real-life scenario.
The availability of the ground truth for labeling data used for training the stress detection model is another open research issue. Either in the lab environment or real-life scenario, we don’t have the ground truth and the majority of the studies in the literature have to rely on subjective scoring which can vary from person to person. It has been observed that physiological data from two participants may have the same pattern but one of the participant’s labeled as "stressed" whereas the other is labeled as "non-stressed" in subjective labeling (Liapis et al., 2015). This type of labeling ambiguity degrades the performance of the system and thus needs to be rectified by developing a more robust mechanism for labeling the data.
Power consumption of data acquisition is another important factor that needs to be considered while recording the data in an out-of-lab environment. In lab stress measurement system can use medical-grade and other data acquisition devices with constant power supply and there is no power outage, whereas in real-life scenarios all the devices whether they are EEG headsets, skin conductance, and heart rate measurement modules or smartwatches all have limited battery life and can last approximately around 4-5 hours. But to record the activities of a user for a complete day, the power consumption of the devices needs to be kept at a minimum level so that the battery can work for more time. Existing literature has not examined this power consumption factor and needs to be addressed to be able to manufacture efficient and long-lasting data acquisition devices for monitoring stress, especially for real-life environments.
Noise affects the data acquisition part of the stress recognition measurement in the lab as well as the out-of-lab environment. Physiological signals which include EEG, EMG, ECG, PPG, and RR are most commonly affected by the individual body movement parts and severely degrade the signal quality. Artifact removal techniques include low, high, and bandpass filtering, least mean square, notch filtering, recursive least mean square, principal component analysis (PCA), independent component analysis (ICA), and wavelet denoising. Even though these techniques have been found quite useful in the removal of noise from the bio-signals in the lab environment, but still the data acquired out-of-lab presents a wider range of challenges like environmental conditions i.e., temperature, humidity, and lightning affecting these recorded physiological signals and other body functions. An example of the effect of these environmental conditions includes pupil diameter changes in response to light stimulation and changes in skin conductance of the human body due to temperature and physical activity. Thus in an outdoor environment, these conditions are very difficult to remain constant which can somehow be maintained in-lab environment thus posing a greater challenge and affecting the stress measurement study results.
Most of the human stress measurement studies available in the literature have focused on acute stress and very little attention has been given to chronic stress detection techniques. Even though it is a fact that chronic stress can be fatal in comparison to acute stress and has given billions of dollars lost to many companies and is affecting their worker’s health severely (Gottlieb, 2013). Chronic stress if poorly managed and prolonged for a longer time duration turns into a traumatic disorder that can permanently damage an individual’s life. Thus in future stress measurement work chronic stress measurement should be given its due importance so that it can be properly diagnosed and treated before it becomes a permanent part of one’s life. Most of the stress measurement studies in the literature have used their dataset for the detection of stress and thus it is difficult to compare the results of different schemes directly because of the lack of standard publicly available stress measurement datasets, hence the curation of data for measurement of stress like DEAP database for emotions (Koelstra et al., 2011) using globally accepted practices is the need of the hour.
The deep learning-based method has been proven a powerful mechanism for classification in a variety of applications including handwriting and image recognition but the use of deep learning for human stress detection has still not been explored to a great extent in the literature. It is because deep learning-based algorithms require a large dataset to train the model and acquiring a large dataset for stress is a cumbersome task and it is still an open research problem to acquire a large dataset for the deep learning models to be implemented. Only a few studies focusing on deep learning-based stress classification have been presented in the literature (Song and Kim, 2017) and thus this area needs further exploration. Keeping in view all the above mentioned limitations of the existing methods, new work on human stress detection should address these challenges so that a more robust system that is practically possible to be implemented for real-life stress monitoring solutions in the future.
7 Conclusion
Human stress is one of the most significant challenges faced by modern civilization with a long-lasting impact on both society and the social life of an individual. This also impacts the economic condition of those individuals that are facing stress-related situations. Therefore, automatic recognition of stress is of utmost importance to bring positive change in society. Some of the important benefits of automated stress monitoring could include a better attitude toward the workplace, an increase in productivity, and a decrease in the number of road accidents to name a few. In general, better stress management for individuals would have far-reaching benefits for both individuals and society. Towards this, we have surveyed available literature for human stress measurement including both subjective and objective measures. Commonly used stressors used for inducing stress followed by publicly available stress measurement databases are also examined. Multimodal approaches for human stress detection along with a discussion about the limitations of the existing work and the open research issues which need to be addressed in future stress measurement studies are also explored. In particular, we have focused on methods that use or are suitable for employing artificial intelligence techniques for automated stress detection. The information presented here will provide a platform for designing future studies for stress detection, particularly for employing AI with domain knowledge. With this, we also provide a better context for methods that can be used for daily life stress detection (acute) and for situations that are more demanding (chronic). Towards, this we have comprehensively highlighted the current challenges and future directions.
References
References
- Subhani et al. (2017) Subhani, A.R.; Mumtaz, W.; Saad, M.N.B.M.; Kamel, N.; Malik, A.S. Machine learning framework for the detection of mental stress at multiple levels. IEEE Access 2017, 5, 13545–13556.
- Dempsey (2018) Dempsey, L.A. Stress-induced depression. Nature immunology 2018, 19, 99–99.
- Organization et al. (2015) Organization, W.H.; et al. Depression. Fact sheet No. 369/October 2012, 2015.
- Spoorthy et al. (2020) Spoorthy, M.S.; Pratapa, S.K.; Mahant, S. Mental health problems faced by healthcare workers due to the COVID-19 pandemic–A review. Asian journal of psychiatry 2020, 51, 102119.
- Ransing et al. (2020) Ransing, R.; Ramalho, R.; Orsolini, L.; Adiukwu, F.; Gonzalez-Diaz, J.M.; Larnaout, A.; da Costa, M.P.; Grandinetti, P.; Bytyçi, D.G.; Shalbafan, M.; et al. Can COVID-19 related mental health issues be measured? Brain, behavior, and immunity 2020, 88, 32.
- Association et al. (2017) Association, A.P.; et al. Stress in America: Coping with change. Stress in America survey 2017.
- Can et al. (2020) Can, Y.S.; Chalabianloo, N.; Ekiz, D.; Fernandez-Alvarez, J.; Riva, G.; Ersoy, C. Personal stress-level clustering and decision-level smoothing to enhance the performance of ambulatory stress detection with smartwatches. IEEE Access 2020, 8, 38146–38163.
- Delmastro et al. (2020) Delmastro, F.; Di Martino, F.; Dolciotti, C. Cognitive training and stress detection in mci frail older people through wearable sensors and machine learning. IEEE Access 2020, 8, 65573–65590.
- Zubair and Yoon (2020) Zubair, M.; Yoon, C. Multilevel mental stress detection using ultra-short pulse rate variability series. Biomedical Signal Processing and Control 2020, 57, 101736.
- Rodríguez-Arce et al. (2020) Rodríguez-Arce, J.; Lara-Flores, L.; Portillo-Rodríguez, O.; Martínez-Méndez, R. Towards an anxiety and stress recognition system for academic environments based on physiological features. Computer methods and programs in biomedicine 2020, 190, 105408.
- Pluntke et al. (2019) Pluntke, U.; Gerke, S.; Sridhar, A.; Weiss, J.; Michel, B. Evaluation and classification of physical and psychological stress in firefighters using heart rate variability. In Proceedings of the 2019 41st Annual International Conference of the IEEE Engineering in Medicine and Biology Society (EMBC). IEEE, 2019, pp. 2207–2212.
- Cho et al. (2019) Cho, H.M.; Park, H.; Dong, S.Y.; Youn, I. Ambulatory and laboratory stress detection based on raw electrocardiogram signals using a convolutional neural network. Sensors 2019, 19, 4408.
- Gillani et al. (2021) Gillani, S.F.; Saeed, S.M.U.; Shabbir, Z.; Habib, F.; et al. Prediction of Perceived Stress Scores Using Low-Channel Electroencephalography Headband. In Proceedings of the 2021 International Bhurban Conference on Applied Sciences and Technologies (IBCAST). IEEE, 2021, pp. 401–406.
- Gedam and Paul (2021) Gedam, S.; Paul, S. A Review on Mental Stress Detection using Wearable Sensors and Machine Learning Techniques. IEEE Access 2021.
- Muthukumar and Nachiappan (2010) Muthukumar, K.; Nachiappan, V. Cadmium-induced oxidative stress in Saccharomyces cerevisiae 2010.
- Ulrich-Lai and Herman (2009) Ulrich-Lai, Y.M.; Herman, J.P. Neural regulation of endocrine and autonomic stress responses. Nature reviews neuroscience 2009, 10, 397–409.
- Kajantie and Phillips (2006) Kajantie, E.; Phillips, D.I. The effects of sex and hormonal status on the physiological response to acute psychosocial stress. Psychoneuroendocrinology 2006, 31, 151–178.
- Werner (1993) Werner, E.E. Risk, resilience, and recovery: Perspectives from the Kauai Longitudinal Study. Development and psychopathology 1993, 5, 503–515.
- Segerstrom and Miller (2004) Segerstrom, S.C.; Miller, G.E. Psychological stress and the human immune system: a meta-analytic study of 30 years of inquiry. Psychological bulletin 2004, 130, 601.
- Sincero (2012) Sincero, S.M. Three different kinds of stress. Retrieved June 2012, 17, 2014.
- Hiriyappa (2013) Hiriyappa, B. Stress Management: Leading To Success; Booktango, 2013.
- Salleh (2008) Salleh, M.R. Life event, stress and illness. The Malaysian journal of medical sciences: MJMS 2008, 15, 9.
- Gross and Seebaß (2016) Gross, C.; Seebaß, K. The standard stress scale (SSS): Measuring stress in the life course. In Methodological Issues of Longitudinal Surveys; Springer, 2016; pp. 233–249.
- Föhr et al. (2015) Föhr, T.; Tolvanen, A.; Myllymäki, T.; Järvelä-Reijonen, E.; Rantala, S.; Korpela, R.; Peuhkuri, K.; Kolehmainen, M.; Puttonen, S.; Lappalainen, R.; et al. Subjective stress, objective heart rate variability-based stress, and recovery on workdays among overweight and psychologically distressed individuals: a cross-sectional study. Journal of Occupational Medicine and Toxicology 2015, 10, 39.
- Gurung (2013) Gurung, R.A. Health psychology: A cultural approach; Cengage Learning, 2013.
- Onorati et al. (2013) Onorati, F.; Barbieri, R.; Mauri, M.; Russo, V.; Mainardi, L. Reconstruction and analysis of the pupil dilation signal: Application to a psychophysiological affective protocol. In Proceedings of the 2013 35th Annual International Conference of the IEEE Engineering in Medicine and Biology Society (EMBC). IEEE, 2013, pp. 5–8.
- Arsalan et al. (2019) Arsalan, A.; Majid, M.; Butt, A.R.; Anwar, S.M. Classification of Perceived Mental Stress Using A Commercially Available EEG Headband. IEEE journal of biomedical and health informatics 2019, 23, 2257–2264.
- Deschênes et al. (2015) Deschênes, A.; Forget, H.; Daudelin-Peltier, C.; Fiset, D.; Blais, C. Facial expression recognition impairment following acute social stress. Journal of vision 2015, 15, 1383–1383.
- Gowrisankaran et al. (2012) Gowrisankaran, S.; Nahar, N.K.; Hayes, J.R.; Sheedy, J.E. Asthenopia and blink rate under visual and cognitive loads. Optometry and Vision Science 2012, 89, 97–104.
- Schulte-Mecklenbeck et al. (2011) Schulte-Mecklenbeck, M.; Kühberger, A.; Johnson, J.G. A handbook of process tracing methods for decision research: A critical review and user’s guide; Psychology Press, 2011.
- Subahni et al. (2012) Subahni, A.R.; Xia, L.; Malik, A.S. Association of mental stress with video games. In Proceedings of the 2012 4th International Conference on Intelligent and Advanced Systems (ICIAS2012). IEEE, 2012, Vol. 1, pp. 82–85.
- Liapis et al. (2015) Liapis, A.; Katsanos, C.; Sotiropoulos, D.; Xenos, M.; Karousos, N. Recognizing emotions in human computer interaction: Studying stress using skin conductance. In Proceedings of the IFIP Conference on Human-Computer Interaction. Springer, 2015, pp. 255–262.
- Wielgosz et al. (2016) Wielgosz, J.; Schuyler, B.S.; Lutz, A.; Davidson, R.J. Long-term mindfulness training is associated with reliable differences in resting respiration rate. Scientific reports 2016, 6, 1–6.
- Liew et al. (2015) Liew, W.S.; Seera, M.; Loo, C.K.; Lim, E.; Kubota, N. Classifying stress from heart rate variability using salivary biomarkers as reference. IEEE transactions on neural networks and learning systems 2015, 27, 2035–2046.
- Giannakakis et al. (2019) Giannakakis, G.; Grigoriadis, D.; Giannakaki, K.; Simantiraki, O.; Roniotis, A.; Tsiknakis, M. Review on psychological stress detection using biosignals. IEEE Transactions on Affective Computing 2019.
- Rastgoo et al. (2018) Rastgoo, M.N.; Nakisa, B.; Rakotonirainy, A.; Chandran, V.; Tjondronegoro, D. A critical review of proactive detection of driver stress levels based on multimodal measurements. ACM Computing Surveys (CSUR) 2018, 51, 1–35.
- Carneiro et al. (2017) Carneiro, D.; Novais, P.; Augusto, J.C.; Payne, N. New methods for stress assessment and monitoring at the workplace. IEEE Transactions on Affective Computing 2017, 10, 237–254.
- Can et al. (2019) Can, Y.S.; Arnrich, B.; Ersoy, C. Stress detection in daily life scenarios using smart phones and wearable sensors: A survey. Journal of biomedical informatics 2019, 92, 103139.
- Thapliyal et al. (2017) Thapliyal, H.; Khalus, V.; Labrado, C. Stress detection and management: A survey of wearable smart health devices. IEEE Consumer Electronics Magazine 2017, 6, 64–69.
- Stroop (1935) Stroop, J. Stroop color word test. J Exp Physiol 1935, 18, 643–62.
- Pujol et al. (2001) Pujol, J.; Vendrell, P.; Deus, J.; Junqué, C.; Bello, J.; Martı-Vilalta, J.L.; Capdevila, A. The effect of medial frontal and posterior parietal demyelinating lesions on Stroop interference. Neuroimage 2001, 13, 68–75.
- Pehlivanoğlu et al. (2005) Pehlivanoğlu, B.; Durmazlar, N.; Balkancı, D. Computer adapted Stroop colour-word conflict test as a laboratory stress model. Erciyes Medical Journal 2005, 27, 58–63.
- Tulen et al. (1989) Tulen, J.; Moleman, P.; Van Steenis, H.; Boomsma, F. Characterization of stress reactions to the Stroop Color Word Test. Pharmacology Biochemistry and Behavior 1989, 32, 9–15.
- Svetlak et al. (2010) Svetlak, M.; Bob, P.; Cernik, M.; Kukleta, M. Electrodermal complexity during the Stroop colour word test. Autonomic Neuroscience 2010, 152, 101–107.
- Renaud and Blondin (1997) Renaud, P.; Blondin, J.P. The stress of Stroop performance: Physiological and emotional responses to color–word interference, task pacing, and pacing speed. International Journal of Psychophysiology 1997, 27, 87–97.
- Zhai and Barreto (2006) Zhai, J.; Barreto, A. Stress detection in computer users based on digital signal processing of noninvasive physiological variables. In Proceedings of the 2006 international conference of the IEEE engineering in medicine and biology society. IEEE, 2006, pp. 1355–1358.
- Lundberg et al. (1994) Lundberg, U.; Kadefors, R.; Melin, B.; Palmerud, G.; Hassmén, P.; Engström, M.; Dohns, I.E. Psychophysiological stress and EMG activity of the trapezius muscle. International journal of behavioral medicine 1994, 1, 354–370.
- Alonso et al. (2015) Alonso, J.; Romero, S.; Ballester, M.; Antonijoan, R.; Mañanas, M. Stress assessment based on EEG univariate features and functional connectivity measures. Physiological measurement 2015, 36, 1351.
- Ren et al. (2012) Ren, P.; Barreto, A.; Gao, Y.; Adjouadi, M. Affective assessment by digital processing of the pupil diameter. IEEE Transactions on Affective computing 2012, 4, 2–14.
- Kurniawan et al. (2013) Kurniawan, H.; Maslov, A.V.; Pechenizkiy, M. Stress detection from speech and galvanic skin response signals. In Proceedings of the Proceedings of the 26th IEEE International Symposium on Computer-Based Medical Systems. IEEE, 2013, pp. 209–214.
- Giannakakis et al. (2017) Giannakakis, G.; Pediaditis, M.; Manousos, D.; Kazantzaki, E.; Chiarugi, F.; Simos, P.G.; Marias, K.; Tsiknakis, M. Stress and anxiety detection using facial cues from videos. Biomedical Signal Processing and Control 2017, 31, 89–101.
- Giakoumis et al. (2012) Giakoumis, D.; Drosou, A.; Cipresso, P.; Tzovaras, D.; Hassapis, G.; Gaggioli, A.; Riva, G. Using activity-related behavioural features towards more effective automatic stress detection. PloS one 2012, 7, e43571.
- Karthikeyan et al. (2012) Karthikeyan, P.; Murugappan, M.; Yaacob, S. Descriptive analysis of skin temperature variability of sympathetic nervous system activity in stress. Journal of Physical Therapy Science 2012, 24, 1341–1344.
- Krantz et al. (2004) Krantz, G.; Forsman, M.; Lundberg, U. Consistency in physiological stress responses and electromyographic activity during induced stress exposure in women and men. Integrative Physiological & Behavioral Science 2004, 39, 105–118.
- Ushiyama et al. (1991) Ushiyama, K.; Ogawa, T.; Ishii, M.; Ajisaka, R.; Sugishita, Y.; Ito, I. Physiologic neuroendocrine arousal by mental arithmetic stress test in healthy subjects. The American journal of cardiology 1991, 67, 101–103.
- Tomaka et al. (1994) Tomaka, J.; Blascovich, J.; Swart, L. Effects of vocalization on cardiovascular and electrodermal responses during mental arithmetic. International Journal of Psychophysiology 1994, 18, 23–33.
- Seraganian et al. (1997) Seraganian, P.; Szabo, A.; Brown, T.G. The effect of vocalization on the heart rate response to mental arithmetic. Physiology & behavior 1997, 62, 221–224.
- Ring et al. (2002) Ring, C.; Drayson, M.; Walkey, D.G.; Dale, S.; Carroll, D. Secretory immunoglobulin A reactions to prolonged mental arithmetic stress: inter-session and intra-session reliability. Biological psychology 2002, 59, 1–13.
- Hassellund et al. (2010) Hassellund, S.S.; Flaa, A.; Sandvik, L.; Kjeldsen, S.E.; Rostrup, M. Long-term stability of cardiovascular and catecholamine responses to stress tests: an 18-year follow-up study. Hypertension 2010, 55, 131–136.
- Linden (1991) Linden, W. What do arithmetic stress tests measure? Protocol variations and cardiovascular responses. Psychophysiology 1991, 28, 91–102.
- Dedovic et al. (2005) Dedovic, K.; Renwick, R.; Mahani, N.K.; Engert, V.; Lupien, S.J.; Pruessner, J.C. The Montreal Imaging Stress Task: using functional imaging to investigate the effects of perceiving and processing psychosocial stress in the human brain. Journal of Psychiatry and Neuroscience 2005, 30, 319.
- Setz et al. (2009) Setz, C.; Arnrich, B.; Schumm, J.; La Marca, R.; Tröster, G.; Ehlert, U. Discriminating stress from cognitive load using a wearable EDA device. IEEE Transactions on information technology in biomedicine 2009, 14, 410–417.
- Minguillon et al. (2016) Minguillon, J.; Lopez-Gordo, M.A.; Pelayo, F. Stress assessment by prefrontal relative gamma. Frontiers in computational neuroscience 2016, 10, 101.
- Al-Shargie et al. (2015) Al-Shargie, F.; Tang, T.B.; Badruddin, N.; Kiguchi, M. Mental stress quantification using EEG signals. In Proceedings of the International Conference for Innovation in Biomedical Engineering and Life Sciences. Springer, 2015, pp. 15–19.
- Al-Shargie et al. (2016) Al-Shargie, F.; Kiguchi, M.; Badruddin, N.; Dass, S.C.; Hani, A.F.M.; Tang, T.B. Mental stress assessment using simultaneous measurement of EEG and fNIRS. Biomedical optics express 2016, 7, 3882–3898.
- Hines (1932) Hines, E.A. A standard stimulus for measuring vasomotor reactions: its application in the study of hypertension. In Proceedings of the Mayo Clin Proc, 1932, Vol. 7, pp. 332–335.
- Lovallo (1975) Lovallo, W. The cold pressor test and autonomic function: a review and integration. Psychophysiology 1975, 12, 268–282.
- al’Absi et al. (2002) al’Absi, M.; Petersen, K.L.; Wittmers, L.E. Adrenocortical and hemodynamic predictors of pain perception in men and women. Pain 2002, 96, 197–204.
- Bullinger et al. (1984) Bullinger, M.; Naber, D.; Pickar, D.; Cohen, R.M.; Kalin, N.H.; Pert, A.; Bunney Jr, W.E. Endocrine effects of the cold pressor test: relationships to subjective pain appraisal and coping. Psychiatry research 1984, 12, 227–233.
- Suter et al. (2007) Suter, S.E.; Huggenberger, H.J.; Schächinger, H. Cold pressor stress reduces left cradling preference in nulliparous human females. Stress 2007, 10, 45–51.
- Previnaire et al. (2012) Previnaire, J.G.; Soler, J.M.; Leclercq, V.; Denys, P. Severity of autonomic dysfunction in patients with complete spinal cord injury. Clinical Autonomic Research 2012, 22, 9–15.
- Frings et al. (2013) Frings, C.; Larra, M.F.; Gräbener, A.; Moeller, B.; Schächinger, H. Stress disrupts distractor-based retrieval of SR episodes. Biological psychology 2013, 93, 58–64.
- Shi et al. (2010) Shi, Y.; Nguyen, M.H.; Blitz, P.; French, B.; Fisk, S.; De la Torre, F.; Smailagic, A.; Siewiorek, D.P.; al’Absi, M.; Ertin, E.; et al. Personalized stress detection from physiological measurements. In Proceedings of the International symposium on quality of life technology, 2010, pp. 28–29.
- Bitsika et al. (2014) Bitsika, V.; Sharpley, C.F.; Sweeney, J.A.; McFarlane, J.R. HPA and SAM axis responses as correlates of self-vs parental ratings of anxiety in boys with an Autistic Disorder. Physiology & Behavior 2014, 127, 1–7.
- Taylor et al. (2000) Taylor, S.E.; Klein, L.C.; Lewis, B.P.; Gruenewald, T.L.; Gurung, R.A.; Updegraff, J.A. Biobehavioral responses to stress in females: tend-and-befriend, not fight-or-flight. Psychological review 2000, 107, 411.
- Dickerson and Kemeny (2004) Dickerson, S.S.; Kemeny, M.E. Acute stressors and cortisol responses: a theoretical integration and synthesis of laboratory research. Psychological bulletin 2004, 130, 355.
- McEwen (2005) McEwen, B.S. Glucocorticoids, depression, and mood disorders: structural remodeling in the brain. Metabolism 2005, 54, 20–23.
- Kemp et al. (2012) Kemp, A.H.; Quintana, D.S.; Felmingham, K.L.; Matthews, S.; Jelinek, H.F. Depression, comorbid anxiety disorders, and heart rate variability in physically healthy, unmedicated patients: implications for cardiovascular risk. PloS one 2012, 7.
- Glaser and Kiecolt-Glaser (2005) Glaser, R.; Kiecolt-Glaser, J.K. Stress-induced immune dysfunction: implications for health. Nature Reviews Immunology 2005, 5, 243–251.
- Pittig et al. (2013) Pittig, A.; Arch, J.J.; Lam, C.W.; Craske, M.G. Heart rate and heart rate variability in panic, social anxiety, obsessive–compulsive, and generalized anxiety disorders at baseline and in response to relaxation and hyperventilation. International journal of psychophysiology 2013, 87, 19–27.
- Wolpe (2013) Wolpe, J. The Systematic Desensitization Treatment of Neuroses”. Experiments in Behaviour Therapy: Readings in Modern Methods of Treatment of Mental Disorders Derived from Learning Theory 2013, 132, 21.
- Parsons and Rizzo (2008) Parsons, T.D.; Rizzo, A.A. Affective outcomes of virtual reality exposure therapy for anxiety and specific phobias: A meta-analysis. Journal of behavior therapy and experimental psychiatry 2008, 39, 250–261.
- Bordnick et al. (2012) Bordnick, P.S.; Traylor, A.C.; Carter, B.L.; Graap, K.M. A feasibility study of virtual reality-based coping skills training for nicotine dependence. Research on social work practice 2012, 22, 293–300.
- Kudielka et al. (2009) Kudielka, B.M.; Hellhammer, D.H.; Wüst, S. Why do we respond so differently? Reviewing determinants of human salivary cortisol responses to challenge. Psychoneuroendocrinology 2009, 34, 2–18.
- Slater et al. (2006) Slater, M.; Pertaub, D.P.; Barker, C.; Clark, D.M. An experimental study on fear of public speaking using a virtual environment. CyberPsychology & Behavior 2006, 9, 627–633.
- Felnhofer et al. (2014) Felnhofer, A.; Kothgassner, O.D.; Hetterle, T.; Beutl, L.; Hlavacs, H.; Kryspin-Exner, I. Afraid to be there? Evaluating the relation between presence, self-reported anxiety, and heart rate in a virtual public speaking task. Cyberpsychology, Behavior, and Social Networking 2014, 17, 310–316.
- Pertaub et al. (2002) Pertaub, D.P.; Slater, M.; Barker, C. An experiment on public speaking anxiety in response to three different types of virtual audience. Presence: Teleoperators & Virtual Environments 2002, 11, 68–78.
- Kelly et al. (2008) Kelly, M.M.; Tyrka, A.R.; Anderson, G.M.; Price, L.H.; Carpenter, L.L. Sex differences in emotional and physiological responses to the Trier Social Stress Test. Journal of behavior therapy and experimental psychiatry 2008, 39, 87–98.
- Hemmeter et al. (2005) Hemmeter, U.; Störmer, R.; Mager, R.; Kuntze, M.; Mueller-Spahn, F.; Hennig, J.; Amditis, A.; Bekiaris, A.; Bullinger, A. Modification of virtual reality combined with a mental task stimulates cortisol in volunteers. Neuropsychobiology 2005, 51, 165–172.
- Stroud et al. (2002) Stroud, L.R.; Salovey, P.; Epel, E.S. Sex differences in stress responses: social rejection versus achievement stress. Biological psychiatry 2002, 52, 318–327.
- Kothgassner et al. (2016) Kothgassner, O.D.; Felnhofer, A.; Hlavacs, H.; Beutl, L.; Palme, R.; Kryspin-Exner, I.; Glenk, L.M. Salivary cortisol and cardiovascular reactivity to a public speaking task in a virtual and real-life environment. Computers in human behavior 2016, 62, 124–135.
- Escher et al. (1993) Escher, J.; Höhmann, U.; Anthenien, L.; Dayer, E.; Bosshard, C.; Gaillard, R. Music during gastroscopy. Schweizerische Medizinische Wochenschrift 1993, 123, 1354–1358.
- Suda et al. (2008) Suda, M.; Morimoto, K.; Obata, A.; Koizumi, H.; Maki, A. Emotional responses to music: towards scientific perspectives on music therapy. Neuroreport 2008, 19, 75–78.
- Khalfa et al. (2003) Khalfa, S.; Bella, S.D.; Roy, M.; Peretz, I.; Lupien, S.J. Effects of relaxing music on salivary cortisol level after psychological stress. ANNALS-NEW YORK ACADEMY OF SCIENCES 2003, 999, 374–376.
- Bartlett (1996) Bartlett, D.L. Physiological responses to music and sound stimuli. Handbook of music psychology 1996, pp. 343–385.
- Allen et al. (2001) Allen, K.; Golden, L.H.; Izzo Jr, J.L.; Ching, M.I.; Forrest, A.; Niles, C.R.; Niswander, P.R.; Barlow, J.C. Normalization of hypertensive responses during ambulatory surgical stress by perioperative music. Psychosomatic medicine 2001, 63, 487–492.
- Knight and Rickard (2001) Knight, W.E.; Rickard, N.S. Relaxing music prevents stress-induced increases in subjective anxiety, systolic blood pressure, and heart rate in healthy males and females. Journal of music therapy 2001, 38, 254–272.
- Evans (2002) Evans, D. The effectiveness of music as an intervention for hospital patients: a systematic review. Journal of advanced nursing 2002, 37, 8–18.
- Lang et al. (1997) Lang, P.J.; Bradley, M.M.; Cuthbert, B.N.; et al. International affective picture system (IAPS): Technical manual and affective ratings. NIMH Center for the Study of Emotion and Attention 1997, 1, 39–58.
- Baltaci and Gokcay (2016) Baltaci, S.; Gokcay, D. Stress detection in human–computer interaction: Fusion of pupil dilation and facial temperature features. International Journal of Human–Computer Interaction 2016, 32, 956–966.
- Liao et al. (2005) Liao, W.; Zhang, W.; Zhu, Z.; Ji, Q. A real-time human stress monitoring system using dynamic Bayesian network. In Proceedings of the 2005 IEEE Computer Society Conference on Computer Vision and Pattern Recognition (CVPR’05)-Workshops. IEEE, 2005, pp. 70–70.
- Nhan and Chau (2009) Nhan, B.R.; Chau, T. Classifying affective states using thermal infrared imaging of the human face. IEEE Transactions on Biomedical Engineering 2009, 57, 979–987.
- Khalilzadeh et al. (2010) Khalilzadeh, M.A.; Homam, S.M.; HOSSEINI, S.A.; Niazmand, V. Qualitative and quantitative evaluation of brain activity in emotional stress 2010.
- Deák et al. (2010) Deák, A.; Csenki, L.; Révész, G. Hungarian ratings for the International Affective Picture System (IAPS): A cross-cultural comparison. Empirical Text and Culture Research 2010, 4, 90–101.
- Grühn and Scheibe (2008) Grühn, D.; Scheibe, S. Age-related differences in valence and arousal ratings of pictures from the International Affective Picture System (IAPS): Do ratings become more extreme with age? Behavior Research Methods 2008, 40, 512–521.
- Lasaitis et al. (2008) Lasaitis, C.; Ribeiro, R.L.; Bueno, O.F.A. Brazilian norms for the International Affective Picture System (IAPS): comparison of the affective ratings for new stimuli between Brazilian and North-American subjects. Jornal Brasileiro de Psiquiatria 2008, 57, 270–275.
- Lohani et al. (2013) Lohani, M.; Gupta, R.; Srinivasan, N. Cross-cultural evaluation of the International Affective Picture System on an Indian sample. Psychological Studies 2013, 58, 233–241.
- Dufey et al. (2011) Dufey, M.; FERNÁNDEZ, A.; Mayol, R. Adding support to cross-cultural emotional assessment: Validation of the International Affective Picture System in a Chilean sample. Universitas psychologica 2011, 10, 521–533.
- Caria et al. (2010) Caria, A.; Sitaram, R.; Veit, R.; Begliomini, C.; Birbaumer, N. Volitional control of anterior insula activity modulates the response to aversive stimuli. A real-time functional magnetic resonance imaging study. Biological psychiatry 2010, 68, 425–432.
- Hajcak and Dennis (2009) Hajcak, G.; Dennis, T.A. Brain potentials during affective picture processing in children. Biological psychology 2009, 80, 333–338.
- Styliadis et al. (2015) Styliadis, C.; Ioannides, A.A.; Bamidis, P.D.; Papadelis, C. Distinct cerebellar lobules process arousal, valence and their interaction in parallel following a temporal hierarchy. Neuroimage 2015, 110, 149–161.
- D’Hondt et al. (2010) D’Hondt, F.; Lassonde, M.; Collignon, O.; Dubarry, A.S.; Robert, M.; Rigoulot, S.; Honoré, J.; Lepore, F.; Sequeira, H. Early brain-body impact of emotional arousal. Frontiers in human neuroscience 2010, 4, 33.
- Bradley et al. (2001) Bradley, M.M.; Codispoti, M.; Cuthbert, B.N.; Lang, P.J. Emotion and motivation I: defensive and appetitive reactions in picture processing. Emotion 2001, 1, 276.
- Baglioni et al. (2010) Baglioni, C.; Lombardo, C.; Bux, E.; Hansen, S.; Salveta, C.; Biello, S.; Violani, C.; Espie, C.A. Psychophysiological reactivity to sleep-related emotional stimuli in primary insomnia. Behaviour research and therapy 2010, 48, 467–475.
- Kirschbaum et al. (1993) Kirschbaum, C.; Pirke, K.M.; Hellhammer, D.H. The ‘Trier Social Stress Test’–a tool for investigating psychobiological stress responses in a laboratory setting. Neuropsychobiology 1993, 28, 76–81.
- Engert et al. (2014) Engert, V.; Merla, A.; Grant, J.A.; Cardone, D.; Tusche, A.; Singer, T. Exploring the use of thermal infrared imaging in human stress research. PloS one 2014, 9.
- Vinkers et al. (2013) Vinkers, C.H.; Penning, R.; Hellhammer, J.; Verster, J.C.; Klaessens, J.H.; Olivier, B.; Kalkman, C.J. The effect of stress on core and peripheral body temperature in humans. Stress 2013, 16, 520–530.
- Nater et al. (2005) Nater, U.M.; Rohleder, N.; Gaab, J.; Berger, S.; Jud, A.; Kirschbaum, C.; Ehlert, U. Human salivary alpha-amylase reactivity in a psychosocial stress paradigm. International Journal of Psychophysiology 2005, 55, 333–342.
- Healey and Picard (2005) Healey, J.A.; Picard, R.W. Detecting stress during real-world driving tasks using physiological sensors. IEEE Transactions on intelligent transportation systems 2005, 6, 156–166.
- Schneegass et al. (2013) Schneegass, S.; Pfleging, B.; Broy, N.; Heinrich, F.; Schmidt, A. A data set of real world driving to assess driver workload. In Proceedings of the Proceedings of the 5th international conference on automotive user interfaces and interactive vehicular applications, 2013, pp. 150–157.
- Birjandtalab et al. (2016) Birjandtalab, J.; Cogan, D.; Pouyan, M.B.; Nourani, M. A non-EEG biosignals dataset for assessment and visualization of neurological status. In Proceedings of the 2016 IEEE International Workshop on Signal Processing Systems (SiPS). IEEE, 2016, pp. 110–114.
- Taamneh et al. (2017) Taamneh, S.; Tsiamyrtzis, P.; Dcosta, M.; Buddharaju, P.; Khatri, A.; Manser, M.; Ferris, T.; Wunderlich, R.; Pavlidis, I. A multimodal dataset for various forms of distracted driving. Scientific data 2017, 4, 170110.
- Schmidt et al. (2018) Schmidt, P.; Reiss, A.; Duerichen, R.; Marberger, C.; Van Laerhoven, K. Introducing wesad, a multimodal dataset for wearable stress and affect detection. In Proceedings of the Proceedings of the 20th ACM International Conference on Multimodal Interaction, 2018, pp. 400–408.
- Koldijk et al. (2014) Koldijk, S.; Sappelli, M.; Verberne, S.; Neerincx, M.A.; Kraaij, W. The swell knowledge work dataset for stress and user modeling research. In Proceedings of the Proceedings of the 16th international conference on multimodal interaction, 2014, pp. 291–298.
- Steeneken and Hansen (1999) Steeneken, H.J.; Hansen, J.H. Speech under stress conditions: overview of the effect on speech production and on system performance. In Proceedings of the 1999 IEEE International Conference on Acoustics, Speech, and Signal Processing. Proceedings. ICASSP99 (Cat. No. 99CH36258). IEEE, 1999, Vol. 4, pp. 2079–2082.
- Markova et al. (2019) Markova, V.; Ganchev, T.; Kalinkov, K. CLAS: A Database for Cognitive Load, Affect and Stress Recognition. In Proceedings of the 2019 International Conference on Biomedical Innovations and Applications (BIA). IEEE, 2019, pp. 1–4.
- Meziatisabour et al. (2021) Meziatisabour, R.; Benezeth, Y.; De Oliveira, P.; Chappe, J.; Yang, F. UBFC-Phys: A Multimodal Database For Psychophysiological Studies Of Social Stress. IEEE Transactions on Affective Computing 2021.
- Cohen et al. (1983) Cohen, S.; Kamarck, T.; Mermelstein, R. A global measure of perceived stress. Journal of health and social behavior 1983, pp. 385–396.
- Bryant et al. (2000) Bryant, R.A.; Moulds, M.L.; Guthrie, R.M. Acute Stress Disorder Scale: a self-report measure of acute stress disorder. Psychological assessment 2000, 12, 61.
- Ulstein et al. (2007) Ulstein, I.; Bruun Wyller, T.; Engedal, K. The relative stress scale, a useful instrument to identify various aspects of carer burden in dementia? International Journal of Geriatric Psychiatry: A journal of the psychiatry of late life and allied sciences 2007, 22, 61–67.
- Brantley et al. (1987) Brantley, P.J.; Waggoner, C.D.; Jones, G.N.; Rappaport, N.B. A daily stress inventory: Development, reliability, and validity. Journal of behavioral medicine 1987, 10, 61–73.
- Derogatis and Spencer (1993) Derogatis, L.R.; Spencer, P. Brief symptom inventory: BSI; Vol. 18, Pearson Upper Saddle River, NJ, 1993.
- Schulz and Schlotz (1999) Schulz, P.; Schlotz, W. The Trier Inventory for the Assessment of Chronic Stress (TICS): scale construction, statistical testing, and validation of the scale work overload. Diagnostica 1999, 45, 8–19.
- Wang et al. (2010) Wang, L.; Li, Z.; Shi, Z.; Zhang, Y.; Shen, J. Factor structure of acute stress disorder symptoms in Chinese earthquake victims: A confirmatory factor analysis of the acute stress disorder scale. Personality and individual differences 2010, 48, 798–802.
- Harvey and Bryant (1998) Harvey, A.G.; Bryant, R.A. The relationship between acute stress disorder and posttraumatic stress disorder: a prospective evaluation of motor vehicle accident survivors. Journal of consulting and clinical psychology 1998, 66, 507.
- Harvey and Bryant (1999) Harvey, A.; Bryant, R. A two-year prospective evaluation of the relationship between acute stress disorder and posttraumatic stress disorder. Journal of Consulting and Clinical Psychology 1999, 67, 985–988.
- Harvey and Bryant (2000) Harvey, A.G.; Bryant, R.A. Two-year prospective evaluation of the relationship between acute stress disorder and posttraumatic stress disorder following mild traumatic brain injury. American Journal of psychiatry 2000, 157, 626–628.
- Brewin et al. (1999) Brewin, C.R.; Andrews, B.; Rose, S.; Kirk, M. Acute stress disorder and posttraumatic stress disorder in victims of violent crime. American Journal of Psychiatry 1999, 156, 360–366.
- Racine et al. (2018) Racine, N.; Khu, M.; Reynolds, K.; Guilcher, G.; Schulte, F. Quality of life in pediatric cancer survivors: contributions of parental distress and psychosocial family risk. Current Oncology 2018, 25, 41.
- Adalıer and Balkan (2012) Adalıer, A.; Balkan, E. The relationship between internet addiction and psychological symptoms. International Journal of Global Education 2012, 1.
- Stavropoulos et al. (2017) Stavropoulos, V.; Gomez, R.; Steen, E.; Beard, C.; Liew, L.; Griffiths, M.D. The longitudinal association between anxiety and Internet addiction in adolescence: The moderating effect of classroom extraversion. Journal of behavioral addictions 2017, 6, 237–247.
- Fitting et al. (1986) Fitting, M.; Rabins, P.; Lucas, M.J.; Eastham, J. Caregivers for dementia patients: A comparison of husbands and wives. The Gerontologist 1986, 26, 248–252.
- Corcoran (1992) Corcoran, M.A. Gender differences in dementia management plans of spousal caregivers: implications for occupational therapy. American Journal of Occupational Therapy 1992, 46, 1006–1012.
- Brækhus et al. (1999) Brækhus, A.; Øksengård, A.R.; Engedal, K.; Laake, K. Social and depressive stress suffered by spouses of patients with mild dementia. Scandinavian journal of primary health care 1999, 16, 242–246.
- Thommessen et al. (2002) Thommessen, B.; Aarsland, D.; Braekhus, A.; Oksengaard, A.R.; Engedal, K.; Laake, K. The psychosocial burden on spouses of the elderly with stroke, dementia and Parkinson’s disease. International journal of geriatric psychiatry 2002, 17, 78–84.
- Kaufer et al. (1998) Kaufer, D.I.; Cummings, J.L.; Christine, D.; Bray, T.; Castellon, S.; Masterman, D.; MacMillan, A.; Ketchel, P.; DeKosky, S.T. Assessing the impact of neuropsychiatric symptoms in Alzheimer’s disease: the Neuropsychiatric Inventory Caregiver Distress Scale. Journal of the American Geriatrics Society 1998, 46, 210–215.
- Greene et al. (1982) Greene, J.; Smith, R.; Gardiner, M.; Timbury, G. Measuring behavioural disturbance of elderly demented patients in the community and its effects on relatives: a factor analytic study. Age and Ageing 1982, 11, 121–126.
- Maslach et al. (1997) Maslach, C.; Jackson, S.; Leiter, M.; Zalaquett, C.; Wood, R. Evaluating stress: a book of resources. USA: Scarecrow 1997.
- Brantley and Jones (1993) Brantley, P.J.; Jones, G.N. Daily stress and stress-related disorders. Annals of behavioral medicine 1993, 15, 17–25.
- Goreczny et al. (1988) Goreczny, A.J.; Brantley, P.J.; Buss, R.R.; Waters, W.F. Daily stress and anxiety and their relation to daily fluctuations of symptoms in asthma and chronic obstructive pulmonary disease (COPD) patients. Journal of Psychopathology and Behavioral Assessment 1988, 10, 259–267.
- Mosley Jr et al. (1991) Mosley Jr, T.H.; Penzien, D.B.; Johnson, C.A.; Brantley, P.J.; Wittrock, D.A.; Andrew, M.E.; Payne, T.J. Time-series analysis of stress and headache. Cephalalgia 1991, 11, 306–307.
- Waggoner (1986) Waggoner, C. An investigation of the relationship between stressful life events, affective responses, and headaches. Unpublished doctoral dissertation, Louisiana State University, Baton Rouge, Louisiana 1986.
- Garrett et al. (1991) Garrett, V.D.; Brantley, P.J.; Jones, G.N.; McKnight, G.T. The relation between daily stress and Crohn’s disease. Journal of behavioral medicine 1991, 14, 87–96.
- Goetsch et al. (1990) Goetsch, V.L.; Wiebe, D.J.; Veltum, L.G.; Van Dorsten, B. Stress and blood glucose in type II diabetes mellitus. Behaviour research and therapy 1990, 28, 531–537.
- Sturmbauer et al. (2019) Sturmbauer, S.C.; Shields, G.S.; Hetzel, E.L.; Rohleder, N.; Slavich, G.M. The Stress and Adversity Inventory for Adults (Adult STRAIN) in German: an overview and initial validation. Plos one 2019, 14, e0216419.
- Buehl et al. (2012) Buehl, W.; Kroisamer, J.S.; Gerendas, B.; Roberts, P.; Rezar, S.; Eibenberger, K.; Sacu, S.; Schmidt-Erfurth, U. Trier Inventory for Chronic Stress (TICS) in patients with central serous chorioretinopathy. Investigative Ophthalmology & Visual Science 2012, 53, 5223–5223.
- Ulstein et al. (2007) Ulstein, I.; Wyller, T.B.; Engedal, K. High score on the Relative Stress Scale, a marker of possible psychiatric disorder in family carers of patients with dementia. International Journal of Geriatric Psychiatry: A journal of the psychiatry of late life and allied sciences 2007, 22, 195–202.
- Weidner et al. (1989) Weidner, G.; Friend, R.; Ficarrotto, T.J.; Mendell, N.R. Hostility and cardiovascular reactivity to stress in women and men. Psychosomatic Medicine 1989.
- Asif et al. (2019) Asif, A.; Majid, M.; Anwar, S.M. Human stress classification using EEG signals in response to music tracks. Computers in biology and medicine 2019, 107, 182–196.
- Saeed et al. (2020) Saeed, S.M.U.; Anwar, S.M.; Khalid, H.; Majid, M.; et al. EEG based Classification of Long-term Stress Using Psychological Labeling. Sensors 2020, 20, 1886.
- Lin et al. (2016) Lin, J.; Sun, X.; Wu, J.; Chan, S.C.; Xu, W. Removal of power line interference in EEG signals with spike noise based on robust adaptive filter. In Proceedings of the 2016 IEEE Region 10 Conference (TENCON). IEEE, 2016, pp. 2707–2710.
- Shoker et al. (2005) Shoker, L.; Sanei, S.; Chambers, J. Artifact removal from electroencephalograms using a hybrid BSS-SVM algorithm. IEEE Signal Processing Letters 2005, 12, 721–724.
- Chen et al. (2014) Chen, X.; Liu, A.; Peng, H.; Ward, R.K. A preliminary study of muscular artifact cancellation in single-channel EEG. Sensors 2014, 14, 18370–18389.
- Alamudun et al. (2012) Alamudun, F.; Choi, J.; Gutierrez-Osuna, R.; Khan, H.; Ahmed, B. Removal of subject-dependent and activity-dependent variation in physiological measures of stress. In Proceedings of the 2012 6th International Conference on Pervasive Computing Technologies for Healthcare (PervasiveHealth) and Workshops. IEEE, 2012, pp. 115–122.
- Mozos et al. (2017) Mozos, O.M.; Sandulescu, V.; Andrews, S.; Ellis, D.; Bellotto, N.; Dobrescu, R.; Ferrandez, J.M. Stress detection using wearable physiological and sociometric sensors. International journal of neural systems 2017, 27, 1650041.
- Gjoreski et al. (2017) Gjoreski, M.; Luštrek, M.; Gams, M.; Gjoreski, H. Monitoring stress with a wrist device using context. Journal of biomedical informatics 2017, 73, 159–170.
- Pan and Tompkins (1985) Pan, J.; Tompkins, W.J. A real-time QRS detection algorithm. IEEE transactions on biomedical engineering 1985, pp. 230–236.
- Hovsepian et al. (2015) Hovsepian, K.; Al’Absi, M.; Ertin, E.; Kamarck, T.; Nakajima, M.; Kumar, S. cStress: towards a gold standard for continuous stress assessment in the mobile environment. In Proceedings of the Proceedings of the 2015 ACM international joint conference on pervasive and ubiquitous computing, 2015, pp. 493–504.
- Elgendi (2012) Elgendi, M. On the analysis of fingertip photoplethysmogram signals. Current cardiology reviews 2012, 8, 14–25.
- Choi et al. (2011) Choi, J.; Ahmed, B.; Gutierrez-Osuna, R. Development and evaluation of an ambulatory stress monitor based on wearable sensors. IEEE transactions on information technology in biomedicine 2011, 16, 279–286.
- Wijsman et al. (2010) Wijsman, J.; Grundlehner, B.; Penders, J.; Hermens, H. Trapezius muscle EMG as predictor of mental stress. In Wireless Health 2010; 2010; pp. 155–163.
- Willigenburg et al. (2012) Willigenburg, N.W.; Daffertshofer, A.; Kingma, I.; Van Dieën, J.H. Removing ECG contamination from EMG recordings: A comparison of ICA-based and other filtering procedures. Journal of electromyography and kinesiology 2012, 22, 485–493.
- Garcia-Ceja et al. (2015) Garcia-Ceja, E.; Osmani, V.; Mayora, O. Automatic stress detection in working environments from smartphones’ accelerometer data: a first step. IEEE journal of biomedical and health informatics 2015, 20, 1053–1060.
- Can et al. (2019) Can, Y.S.; Chalabianloo, N.; Ekiz, D.; Ersoy, C. Continuous stress detection using wearable sensors in real life: Algorithmic programming contest case study. Sensors 2019, 19, 1849.
- Sano and Picard (2013) Sano, A.; Picard, R.W. Stress recognition using wearable sensors and mobile phones. In Proceedings of the 2013 Humaine Association Conference on Affective Computing and Intelligent Interaction. IEEE, 2013, pp. 671–676.
- Bong et al. (2012) Bong, S.Z.; Murugappan, M.; Yaacob, S. Analysis of electrocardiogram (ecg) signals for human emotional stress classification. In Proceedings of the International Conference on Intelligent Robotics, Automation, and Manufacturing. Springer, 2012, pp. 198–205.
- Ahn et al. (2019) Ahn, J.W.; Ku, Y.; Kim, H.C. A novel wearable EEG and ECG recording system for stress assessment. Sensors 2019, 19, 1991.
- Mohino-Herranz et al. (2015) Mohino-Herranz, I.; Gil-Pita, R.; Ferreira, J.; Rosa-Zurera, M.; Seoane, F. Assessment of mental, emotional and physical stress through analysis of physiological signals using smartphones. Sensors 2015, 15, 25607–25627.
- Cho et al. (2019) Cho, Y.; Julier, S.J.; Bianchi-Berthouze, N. Instant Stress: Detection of Perceived Mental Stress Through Smartphone Photoplethysmography and Thermal Imaging. JMIR mental health 2019, 6, e10140.
- Charlton et al. (2018) Charlton, P.H.; Celka, P.; Farukh, B.; Chowienczyk, P.; Alastruey, J. Assessing mental stress from the photoplethysmogram: a numerical study. Physiological measurement 2018, 39, 054001.
- Shon et al. (2018) Shon, D.; Im, K.; Park, J.H.; Lim, D.S.; Jang, B.; Kim, J.M. Emotional Stress State Detection Using Genetic Algorithm-Based Feature Selection on EEG Signals. International journal of environmental research and public health 2018, 15, 2461.
- Subhani et al. (2017) Subhani, A.R.; Mumtaz, W.; Kamil, N.; Saad, N.M.; Nandagopal, N.; Malik, A.S. MRMR based feature selection for the classification of stress using EEG. In Proceedings of the 2017 Eleventh International Conference on Sensing Technology (ICST). IEEE, 2017, pp. 1–4.
- Deng et al. (2012) Deng, Y.; Wu, Z.; Chu, C.H.; Yang, T. Evaluating feature selection for stress identification. In Proceedings of the 2012 IEEE 13th International Conference on Information Reuse & Integration (IRI). IEEE, 2012, pp. 584–591.
- Yerigeri and Ragha (2019) Yerigeri, V.V.; Ragha, L. Meta-heuristic approach in neural network for stress detection in Marathi speech. International Journal of Speech Technology 2019, 22, 937–957.
- Hasan and Kim (2019) Hasan, M.J.; Kim, J.M. A Hybrid Feature Pool-Based Emotional Stress State Detection Algorithm Using EEG Signals. Brain Sciences 2019, 9, 376.
- Palacios et al. (2019) Palacios, D.; Rodellar, V.; Lázaro, C.; Gómez, A.; Gómez, P. An ICA-based method for stress classification from voice samples. Neural Computing and Applications 2019, pp. 1–11.
- Arsalan et al. (2019) Arsalan, A.; Majid, M.; Anwar, S.M.; Bagci, U. Classification of Perceived Human Stress using Physiological Signals. In Proceedings of the 2019 41st Annual International Conference of the IEEE Engineering in Medicine and Biology Society (EMBC). IEEE, 2019, pp. 1247–1250.
- Ahuja and Banga (2019) Ahuja, R.; Banga, A. Mental Stress Detection in University Students using Machine Learning Algorithms. Procedia Computer Science 2019, 152, 349–353.
- Saeed et al. (2017) Saeed, S.M.U.; Anwar, S.M.; Majid, M. Quantification of human stress using commercially available single channel eeg headset. IEICE Transactions on Information and Systems 2017, 100, 2241–2244.
- Saeed et al. (2018) Saeed, U.; Muhammad, S.; Anwar, S.M.; Majid, M.; Awais, M.; Alnowami, M. Selection of neural oscillatory features for human stress classification with single channel eeg headset. BioMed research international 2018, 2018.
- Vanitha and Suresh (2013) Vanitha, L.; Suresh, G. Hybrid SVM classification technique to detect mental stress in human beings using ECG signals. In Proceedings of the 2013 International Conference on Advanced Computing and Communication Systems. IEEE, 2013, pp. 1–6.
- Attallah (2020) Attallah, O. An Effective Mental Stress State Detection and Evaluation System Using Minimum Number of Frontal Brain Electrodes. Diagnostics 2020, 10, 292.
- Rahman et al. (2015) Rahman, T.; Ghosh, A.K.; Shuvo, M.; Rahman, M.M. Mental stress recognition using K-nearest neighbor (KNN) classifier on EEG signals. In Proceedings of the Int. Conf. Materials, Electronics & Information Engineering (ICMEIE), 2015, pp. 1–4.
- Karthikeyan et al. (2012) Karthikeyan, P.; Murugappan, M.; Yaacob, S. A study on mental arithmetic task based human stress level classification using discrete wavelet transform. In Proceedings of the 2012 IEEE Conference on Sustainable Utilization and Development in Engineering and Technology (STUDENT). IEEE, 2012, pp. 77–81.
- Vasavi et al. (2018) Vasavi, S.; Neeharica, P.; Wadhwa, B. Regression Modelling for Stress Detection in Humans by assessing most prominent Thermal Signature. In Proceedings of the 2018 IEEE 9th Annual Information Technology, Electronics and Mobile Communication Conference (IEMCON). IEEE, 2018, pp. 755–762.
- Song and Kim (2017) Song, S.H.; Kim, D.K. Development of a stress classification model using deep belief networks for stress monitoring. Healthcare informatics research 2017, 23, 285–292.
- Sardeshpande and Thool (2019) Sardeshpande, K.; Thool, V.R. Psychological Stress Detection Using Deep Convolutional Neural Networks. In Proceedings of the International Conference on Computer Vision and Image Processing. Springer, 2019, pp. 180–189.
- Masood and Alghamdi (2019) Masood, K.; Alghamdi, M.A. Modeling mental stress using a deep learning framework. IEEE Access 2019, 7, 68446–68454.
- Uddin and Canavan (2019) Uddin, M.T.; Canavan, S. Synthesizing physiological and motion data for stress and meditation detection. In Proceedings of the 2019 8th International Conference on Affective Computing and Intelligent Interaction Workshops and Demos (ACIIW). IEEE, 2019, pp. 244–247.
- Garcia and Gustavson (1997) Garcia, J.; Gustavson, A.R. The science of self-report. APS Observer 1997, 10.
- Northrup (1997) Northrup, D.A. The problem of the self-report in survey research; Institute for Social Research, York University, 1997.
- Dharmawan (2007) Dharmawan, Z. Analysis of computer games player stress level using EEG data. Master of Science Thesis Report, Faculty of Electrical Engineering, Mathematics and Computer Science, Delft University of Technology, Netherlands 2007.
- Berger (1929) Berger, H. Über das elektroenkephalogramm des menschen. Archiv für psychiatrie und nervenkrankheiten 1929, 87, 527–570.
- Chandra et al. (2017) Chandra, S.R.; Asheeb, A.; Dash, S.; Retna, N.; Teja, K.V.R.; Issac, T.G. Role of electroencephalography in the diagnosis and treatment of neuropsychiatric border zone syndromes. Indian Journal of Psychological Medicine 2017, 39, 243.
- Sawangjai et al. (2019) Sawangjai, P.; Hompoonsup, S.; Leelaarporn, P.; Kongwudhikunakorn, S.; Wilaiprasitporn, T. Consumer grade eeg measuring sensors as research tools: A review. IEEE Sensors Journal 2019, 20, 3996–4024.
- Troy M et al. (2012) Troy M, L.; Joseph T, G.; Daniel P, F. How many electrodes are really needed for EEG-based mobile brain imaging? Journal of Behavioral and Brain Science 2012, 2012.
- Technologies (2012) Technologies, T.C. 10/20 System Positioning Manual., 2012.
- Oostenveld and Praamstra (2001) Oostenveld, R.; Praamstra, P. The five percent electrode system for high-resolution EEG and ERP measurements. Clinical neurophysiology 2001, 112, 713–719.
- Sanei and Chambers (2013) Sanei, S.; Chambers, J.A. EEG signal processing; John Wiley & Sons, 2013.
- Saeed et al. (2015) Saeed, S.M.U.; Anwar, S.M.; Majid, M.; Bhatti, A.M. Psychological stress measurement using low cost single channel EEG headset. In Proceedings of the 2015 IEEE International Symposium on Signal Processing and Information Technology (ISSPIT). IEEE, 2015, pp. 581–585.
- Hamid et al. (2015) Hamid, N.H.A.; Sulaiman, N.; Murat, Z.H.; Taib, M.N. Brainwaves stress pattern based on perceived stress scale test. In Proceedings of the 2015 IEEE 6th control and system graduate research colloquium (ICSGRC). IEEE, 2015, pp. 135–140.
- Hoffmann (2005) Hoffmann, E. Brain training against stress: Theory, methods and results from an outcome study. Stress Report 2005, 4, 1–24.
- Gatzke-Kopp et al. (2014) Gatzke-Kopp, L.M.; Jetha, M.K.; Segalowitz, S.J. The role of resting frontal EEG asymmetry in psychopathology: Afferent or efferent filter? Developmental psychobiology 2014, 56, 73–85.
- Giannakakis et al. (2015) Giannakakis, G.; Grigoriadis, D.; Tsiknakis, M. Detection of stress/anxiety state from EEG features during video watching. In Proceedings of the 2015 37th Annual International Conference of the IEEE Engineering in Medicine and Biology Society (EMBC). IEEE, 2015, pp. 6034–6037.
- Seo et al. (2008) Seo, S.; Gil, Y.; Lee, J. The relation between affective style of stressor on EEG asymmetry and stress scale during multimodal task. In Proceedings of the 2008 Third International Conference on Convergence and Hybrid Information Technology. IEEE, 2008, Vol. 1, pp. 461–466.
- Lewis et al. (2007) Lewis, R.S.; Weekes, N.Y.; Wang, T.H. The effect of a naturalistic stressor on frontal EEG asymmetry, stress, and health. Biological psychology 2007, 75, 239–247.
- Qin et al. (2009) Qin, S.; Hermans, E.J.; van Marle, H.J.; Luo, J.; Fernández, G. Acute psychological stress reduces working memory-related activity in the dorsolateral prefrontal cortex. Biological psychiatry 2009, 66, 25–32.
- Lopez-Duran et al. (2012) Lopez-Duran, N.L.; Nusslock, R.; George, C.; Kovacs, M. Frontal EEG asymmetry moderates the effects of stressful life events on internalizing symptoms in children at familial risk for depression. Psychophysiology 2012, 49, 510–521.
- Peng et al. (2013) Peng, H.; Hu, B.; Zheng, F.; Fan, D.; Zhao, W.; Chen, X.; Yang, Y.; Cai, Q. A method of identifying chronic stress by EEG. Personal and ubiquitous computing 2013, 17, 1341–1347.
- Acharya et al. (2012) Acharya, U.R.; Sree, S.V.; Ang, P.C.A.; Yanti, R.; Suri, J.S. Application of non-linear and wavelet based features for the automated identification of epileptic EEG signals. International journal of neural systems 2012, 22, 1250002.
- Tomarken et al. (1990) Tomarken, A.J.; Davidson, R.J.; Henriques, J.B. Resting frontal brain asymmetry predicts affective responses to films. Journal of personality and social psychology 1990, 59, 791.
- Hosseini et al. (2010) Hosseini, S.A.; Khalilzadeh, M.A.; Naghibi-Sistani, M.B.; Niazmand, V. Higher order spectra analysis of EEG signals in emotional stress states. In Proceedings of the 2010 Second International Conference on Information Technology and Computer Science. IEEE, 2010, pp. 60–63.
- Khosrowabadi et al. (2011) Khosrowabadi, R.; Quek, C.; Ang, K.K.; Tung, S.W.; Heijnen, M. A Brain-Computer Interface for classifying EEG correlates of chronic mental stress. In Proceedings of the The 2011 International Joint Conference on Neural Networks. IEEE, 2011, pp. 757–762.
- Sharma and Gedeon (2014) Sharma, N.; Gedeon, T. Modeling a stress signal. Applied Soft Computing 2014, 14, 53–61.
- Ko et al. (2009) Ko, K.E.; Yang, H.C.; Sim, K.B. Emotion recognition using EEG signals with relative power values and Bayesian network. International Journal of Control, Automation and Systems 2009, 7, 865.
- Giannakaki et al. (2017) Giannakaki, K.; Giannakakis, G.; Farmaki, C.; Sakkalis, V. Emotional state recognition using advanced machine learning techniques on EEG data. In Proceedings of the 2017 IEEE 30th International Symposium on Computer-Based Medical Systems (CBMS). IEEE, 2017, pp. 337–342.
- Hayashi et al. (2009) Hayashi, T.; Okamoto, E.; Nishimura, H.; Mizuno-Matsumoto, Y.; Ishii, R.; Ukai, S. Beta activities in EEG associated with emotional stress. International Journal of Intelligent Computing in Medical Sciences & Image Processing 2009, 3, 57–68.
- Demerdzieva (2011) Demerdzieva, A. EEG characteristics of generalized anxiety disorder in childhood. Acta Informatica Medica 2011, 19, 9.
- Tran et al. (2007) Tran, Y.; Thuraisingham, R.; Wijesuriya, N.; Nguyen, H.; Craig, A. Detecting neural changes during stress and fatigue effectively: a comparison of spectral analysis and sample entropy. In Proceedings of the 2007 3rd International IEEE/EMBS Conference on Neural Engineering. IEEE, 2007, pp. 350–353.
- Seo and Lee (2010) Seo, S.H.; Lee, J.T. Stress and EEG. Convergence and hybrid information technologies 2010, 1, 413–424.
- Katsis et al. (2011) Katsis, C.D.; Katertsidis, N.S.; Fotiadis, D.I. An integrated system based on physiological signals for the assessment of affective states in patients with anxiety disorders. Biomedical Signal Processing and Control 2011, 6, 261–268.
- Choi et al. (2015) Choi, Y.; Kim, M.; Chun, C. Measurement of occupants’ stress based on electroencephalograms (EEG) in twelve combined environments. Building and Environment 2015, 88, 65–72.
- Huiku et al. (2007) Huiku, M.; Uutela, K.; Van Gils, M.; Korhonen, I.; Kymäläinen, M.; Meriläinen, P.; Paloheimo, M.; Rantanen, M.; Takala, P.; Viertiö-Oja, H.; et al. Assessment of surgical stress during general anaesthesia. British journal of anaesthesia 2007, 98, 447–455.
- Marshall et al. (2015) Marshall, A.C.; Cooper, N.R.; Segrave, R.; Geeraert, N. The effects of long-term stress exposure on aging cognition: a behavioral and EEG investigation. Neurobiology of aging 2015, 36, 2136–2144.
- Sharma and Gedeon (2012) Sharma, N.; Gedeon, T. Objective measures, sensors and computational techniques for stress recognition and classification: A survey. Computer methods and programs in biomedicine 2012, 108, 1287–1301.
- Secerbegovic et al. (2017) Secerbegovic, A.; Ibric, S.; Nisic, J.; Suljanovic, N.; Mujcic, A. Mental workload vs. stress differentiation using single-channel EEG. In CMBEBIH 2017; Springer, 2017; pp. 511–515.
- Hou et al. (2015) Hou, X.; Liu, Y.; Sourina, O.; Tan, Y.R.E.; Wang, L.; Mueller-Wittig, W. EEG based stress monitoring. In Proceedings of the 2015 IEEE International Conference on Systems, Man, and Cybernetics. IEEE, 2015, pp. 3110–3115.
- Jun and Smitha (2016) Jun, G.; Smitha, K.G. EEG based stress level identification. In Proceedings of the 2016 IEEE International Conference on Systems, Man, and Cybernetics (SMC). IEEE, 2016, pp. 003270–003274.
- Duru et al. (2013) Duru, D.G.; Duru, A.D.; Barkana, D.E.; Sanli, O.; Ozkan, M. Assessment of surgeon’s stress level and alertness using EEG during laparoscopic simple nephrectomy. In Proceedings of the 2013 6th International IEEE/EMBS Conference on Neural Engineering (NER). IEEE, 2013, pp. 452–455.
- Calibo et al. (2013) Calibo, T.K.; Blanco, J.A.; Firebaugh, S.L. Cognitive stress recognition. In Proceedings of the 2013 IEEE International Instrumentation and Measurement Technology Conference (I2MTC). IEEE, 2013, pp. 1471–1475.
- Pomer-Escher et al. (2014) Pomer-Escher, A.G.; de Souza, M.D.P.; Bastos Filho, T.F. Methodology for analysis of stress level based on asymmetry patterns of alpha rhythms in EEG signals. In Proceedings of the 5th ISSNIP-IEEE Biosignals and Biorobotics Conference (2014): Biosignals and Robotics for Better and Safer Living (BRC). IEEE, 2014, pp. 1–5.
- Vijayaragavan et al. (2015) Vijayaragavan, G.R.; Raghav, R.; Phani, K.; Vaidyanathan, V. EEG monitored mind de-stressing smart phone application using Yoga and Music Therapy. In Proceedings of the 2015 International Conference on Green Computing and Internet of Things (ICGCIoT). IEEE, 2015, pp. 412–415.
- Reanaree et al. (2016) Reanaree, P.; Tananchana, P.; Narongwongwathana, W.; Pintavirooj, C. Stress and office-syndrome detection using EEG, HRV and hand movement. In Proceedings of the 2016 9th Biomedical Engineering International Conference (BMEiCON). IEEE, 2016, pp. 1–4.
- Lin and John (2006) Lin, T.; John, L. Quantifying Mental Relaxation with EEG for use in Computer Games. In Proceedings of the International conference on internet computing. Citeseer, 2006, pp. 409–415.
- Vanitha and Krishnan (2016) Vanitha, V.; Krishnan, P. Real time stress detection system based on EEG signals 2016.
- Kalas and Momin (2016) Kalas, M.S.; Momin, B. Stress detection and reduction using EEG signals. In Proceedings of the 2016 International Conference on Electrical, Electronics, and Optimization Techniques (ICEEOT). IEEE, 2016, pp. 471–475.
- Pandiyan et al. (2013) Pandiyan, P.M.; Yaacob, S.; et al. Mental stress level classification using eigenvector features and principal component analysis. Communications in Information Science and Management Engineering 2013, 3, 254.
- Halim and Rehan (2020) Halim, Z.; Rehan, M. On identification of driving-induced stress using electroencephalogram signals: A framework based on wearable safety-critical scheme and machine learning. Information Fusion 2020, 53, 66–79.
- Akella et al. (2021) Akella, A.; Singh, A.K.; Leong, D.; Lal, S.; Newton, P.; Clifton-Bligh, R.; Mclachlan, C.S.; Gustin, S.M.; Maharaj, S.; Lees, T.; et al. Classifying multi-level stress responses from brain cortical EEG in nurses and non-health professionals using machine learning auto encoder. IEEE Journal of Translational Engineering in Health and Medicine 2021, 9, 1–9.
- Wen and Aris (2022) Wen, T.Y.; Aris, S.A.M. Hybrid approach of eeg stress level classification using k-means clustering and support vector machine. IEEE Access 2022, 10, 18370–18379.
- Fu et al. (2022) Fu, R.; Chen, Y.F.; Huang, Y.; Chen, S.; Duan, F.; Li, J.; Wu, J.; Jiang, D.; Gao, J.; Gu, J.; et al. Symmetric Convolutional and Adversarial Neural Network Enables Improved Mental Stress Classification From EEG. IEEE Transactions on Neural Systems and Rehabilitation Engineering 2022, 30, 1384–1400.
- Batool et al. (2022) Batool, W.; Umar Saeed, S.M.; Majid, M. Brain Activity Analysis of Stressed and Control Groups in Response to High Arousal Images. In Proceedings of the Mobile and Ubiquitous Systems: Computing, Networking and Services: 18th EAI International Conference, MobiQuitous 2021, Virtual Event, November 8-11, 2021, Proceedings. Springer, 2022, pp. 872–883.
- Sulaiman et al. (2011) Sulaiman, N.; Taib, M.N.; Lias, S.; Murat, Z.H.; Aris, S.A.M.; Mustafa, M.; Rashid, N.A.; Hamid, N.H.A. Intelligent system for assessing human stress using EEG signals and psychoanalysis tests. In Proceedings of the 2011 Third International Conference on Computational Intelligence, Communication Systems and Networks. IEEE, 2011, pp. 363–367.
- Hamid et al. (2010) Hamid, N.H.A.; Sulaiman, N.; Aris, S.A.M.; Murat, Z.H.; Taib, M.N. Evaluation of human stress using EEG power spectrum. In Proceedings of the 2010 6th International Colloquium on Signal Processing & its Applications. IEEE, 2010, pp. 1–4.
- Luijcks et al. (2015) Luijcks, R.; Vossen, C.J.; Hermens, H.J.; van Os, J.; Lousberg, R. The influence of perceived stress on cortical reactivity: a proof-of-principle study. PloS one 2015, 10.
- De Luca (2002) De Luca, C.J. Surface electromyography: Detection and recording. DelSys Incorporated 2002, 10, 1–10.
- Farfán et al. (2010) Farfán, F.D.; Politti, J.C.; Felice, C.J. Evaluation of EMG processing techniques using information theory. Biomedical engineering online 2010, 9, 72.
- Reaz et al. (2006) Reaz, M.B.I.; Hussain, M.S.; Mohd-Yasin, F. Techniques of EMG signal analysis: detection, processing, classification and applications. Biological procedures online 2006, 8, 11–35.
- Weyers et al. (2006) Weyers, P.; Mühlberger, A.; Hefele, C.; Pauli, P. Electromyographic responses to static and dynamic avatar emotional facial expressions. Psychophysiology 2006, 43, 450–453.
- Ekman et al. (1978) Ekman, P.; Friesen, W.; Hager, J. A technique for the measurement of facial action. Facial action coding system (FACS) 1978, p. 22.
- Karthikeyan et al. (2012) Karthikeyan, P.; Murugappan, M.; Yaacob, S. EMG signal based human stress level classification using wavelet packet transform. In Proceedings of the International Conference on Intelligent Robotics, Automation, and Manufacturing. Springer, 2012, pp. 236–243.
- Luijcks et al. (2014) Luijcks, R.; Hermens, H.J.; Bodar, L.; Vossen, C.J.; van Os, J.; Lousberg, R. Experimentally induced stress validated by EMG activity. PloS one 2014, 9.
- Larsson et al. (1995) Larsson, S.E.; Larsson, R.; Zhang, Q.; Cai, H.; Öberg, P.Å. Effects of psychophysiological stress on trapezius muscles blood flow and electromyography during static load. European journal of applied physiology and occupational physiology 1995, 71, 493–498.
- Rissén et al. (2000) Rissén, D.; Melin, B.; Sandsjö, L.; Dohns, I.; Lundberg, U. Surface EMG and psychophysiological stress reactions in women during repetitive work. European journal of applied physiology 2000, 83, 215–222.
- Schleifer et al. (2008) Schleifer, L.M.; Spalding, T.W.; Kerick, S.E.; Cram, J.R.; Ley, R.; Hatfield, B.D. Mental stress and trapezius muscle activation under psychomotor challenge: a focus on EMG gaps during computer work. Psychophysiology 2008, 45, 356–365.
- Engelhardt et al. (2015) Engelhardt, C.; Malfroy Camine, V.; Ingram, D.; Müllhaupt, P.; Farron, A.; Pioletti, D.; Terrier, A. Comparison of an EMG-based and a stress-based method to predict shoulder muscle forces. Computer methods in biomechanics and biomedical engineering 2015, 18, 1272–1279.
- Tyagi et al. (2017) Tyagi, P.; Arora, A.S.; Rastogi, V. Stress analysis of lower back using EMG signal 2017.
- Farnsworth (2018) Farnsworth, B. GSR and Emotions: What Our Skin Can Tell Us About How We Feel, 2018.
- Udovičić et al. (2017) Udovičić, G.; Ðerek, J.; Russo, M.; Sikora, M. Wearable emotion recognition system based on GSR and PPG signals. In Proceedings of the Proceedings of the 2nd International Workshop on Multimedia for Personal Health and Health Care, 2017, pp. 53–59.
- Wu et al. (2010) Wu, G.; Liu, G.; Hao, M. The analysis of emotion recognition from GSR based on PSO. In Proceedings of the 2010 International symposium on intelligence information processing and trusted computing. IEEE, 2010, pp. 360–363.
- Lidberg and Wallin (1981) Lidberg, L.; Wallin, B.G. Sympathetic skin nerve discharges in relation to amplitude of skin resistance responses. Psychophysiology 1981, 18, 268–270.
- Ayata et al. (2017) Ayata, D.; Yaslan, Y.; Kamaşak, M. Emotion recognition via galvanic skin response: Comparison of machine learning algorithms and feature extraction methods. Istanbul University-Journal of Electrical & Electronics Engineering 2017, 17, 3147–3156.
- Critchley (2002) Critchley, H.D. Electrodermal responses: what happens in the brain. The Neuroscientist 2002, 8, 132–142.
- Dawson et al. (2007) Dawson, M.; Schell, A.; Filion, D. The electrodermal system. Handbook of Psychophysiology, 2, 200-223, 2007.
- Nikula (1991) Nikula, R. Psychological correlates of nonspecific skin conductance responses. Psychophysiology 1991, 28, 86–90.
- Shi et al. (2007) Shi, Y.; Ruiz, N.; Taib, R.; Choi, E.; Chen, F. Galvanic skin response (GSR) as an index of cognitive load. In Proceedings of the CHI’07 extended abstracts on Human factors in computing systems, 2007, pp. 2651–2656.
- Healey (2000) Healey, J.A. Wearable and automotive systems for affect recognition from physiology. PhD thesis, Massachusetts Institute of Technology, 2000.
- Blechert et al. (2006) Blechert, J.; Lajtman, M.; Michael, T.; Margraf, J.; Wilhelm, F.H. Identifying anxiety states using broad sampling and advanced processing of peripheral physiological information. Biomedical sciences instrumentation 2006, 42, 136–141.
- Ritz et al. (2000) Ritz, T.; Steptoe, A.; DeWilde, S.; Costa, M. Emotions and stress increase respiratory resistance in asthma. Psychosomatic Medicine 2000, 62, 401–412.
- Reinhardt et al. (2012) Reinhardt, T.; Schmahl, C.; Wüst, S.; Bohus, M. Salivary cortisol, heart rate, electrodermal activity and subjective stress responses to the Mannheim Multicomponent Stress Test (MMST). Psychiatry research 2012, 198, 106–111.
- Hoehn-Saric et al. (1989) Hoehn-Saric, R.; McLeod, D.R.; Zimmerli, W.D. Somatic manifestations in women with generalized anxiety disorder: Psychophysiological responses to psychological stress. Archives of General Psychiatry 1989, 46, 1113–1119.
- Lee et al. (2004) Lee, M.h.; Yang, G.; Lee, H.K.; Bang, S. Development stress monitoring system based on personal digital assistant (PDA). In Proceedings of the The 26th Annual International Conference of the IEEE Engineering in Medicine and Biology Society. IEEE, 2004, Vol. 1, pp. 2364–2367.
- Nomikos et al. (1968) Nomikos, M.S.; Opton Jr, E.; Averill, J.R. Surprise versus suspense in the production of stress reaction. Journal of Personality and Social Psychology 1968, 8, 204.
- Lanzetta et al. (1976) Lanzetta, J.T.; Cartwright-Smith, J.; Eleck, R.E. Effects of nonverbal dissimulation on emotional experience and autonomic arousal. Journal of Personality and Social Psychology 1976, 33, 354.
- Panigrahy et al. (2017) Panigrahy, S.K.; Jena, S.K.; Turuk, A.K. Study and analysis of human stress detection using galvanic skin response (GSR) sensor in wired and wireless environments. Research Journal of Pharmacy and Technology 2017, 10, 545–550.
- Hernandez et al. (2011) Hernandez, J.; Morris, R.R.; Picard, R.W. Call center stress recognition with person-specific models. In Proceedings of the International Conference on Affective Computing and Intelligent Interaction. Springer, 2011, pp. 125–134.
- Kocielnik et al. (2013) Kocielnik, R.; Sidorova, N.; Maggi, F.M.; Ouwerkerk, M.; Westerink, J.H. Smart technologies for long-term stress monitoring at work. In Proceedings of the Proceedings of the 26th IEEE International Symposium on Computer-Based Medical Systems. IEEE, 2013, pp. 53–58.
- Lee et al. (2021) Lee, T.; Natarajan, B.; Warren, S. Pen-type electrodermal activity sensing system for stress detection based on likelihood ratios. IEEE Transactions on Biomedical Circuits and Systems 2021, 15, 1467–1476.
- Al Khatib et al. (2007) Al Khatib, I.; Bertozzi, D.; Poletti, F.; Benini, L.; Jantsch, A.; Bechara, M.; Khalifeh, H.; Hajjar, M.; Nabiev, R.; Jonsson, S. Hardware/software architecture for real-time ECG monitoring and analysis leveraging MPSoC technology. In Transactions on High-Performance Embedded Architectures and Compilers I; Springer, 2007; pp. 239–258.
- Karthikeyan et al. (2011) Karthikeyan, P.; Murugappan, M.; Yaacob, S. ECG signals based mental stress assessment using wavelet transform. In Proceedings of the 2011 IEEE International Conference on Control System, Computing and Engineering. IEEE, 2011, pp. 258–262.
- Charbonnier et al. (2018) Charbonnier, S.; Vila, G.; Godin, C.; Labyt, E.; Sakri, O.; Campagne, A. A Multi-feature Fuzzy Index to Assess Stress Level from Bio-signals. In Proceedings of the 2018 40th Annual International Conference of the IEEE Engineering in Medicine and Biology Society (EMBC). IEEE, 2018, pp. 1086–1089.
- Liu and Ulrich (2014) Liu, D.; Ulrich, M. Listen to your heart: stress prediction using consumer heart rate sensors. Retrieved from the Internet 2014.
- Goldberger et al. (2000) Goldberger, A.L.; Amaral, L.A.; Glass, L.; Hausdorff, J.M.; Ivanov, P.C.; Mark, R.G.; Mietus, J.E.; Moody, G.B.; Peng, C.K.; Stanley, H.E. PhysioBank, PhysioToolkit, and PhysioNet: components of a new research resource for complex physiologic signals. circulation 2000, 101, e215–e220.
- Tanev et al. (2014) Tanev, G.; Saadi, D.B.; Hoppe, K.; Sorensen, H.B. Classification of acute stress using linear and non-linear heart rate variability analysis derived from sternal ECG. In Proceedings of the 2014 36th Annual International Conference of the IEEE Engineering in Medicine and Biology Society. IEEE, 2014, pp. 3386–3389.
- Karthikeyan et al. (2013) Karthikeyan, P.; Murugappan, M.; Yaacob, S. Detection of human stress using short-term ECG and HRV signals. Journal of Mechanics in Medicine and Biology 2013, 13, 1350038.
- Keshan et al. (2015) Keshan, N.; Parimi, P.; Bichindaritz, I. Machine learning for stress detection from ECG signals in automobile drivers. In Proceedings of the 2015 IEEE International Conference on Big Data (Big Data). IEEE, 2015, pp. 2661–2669.
- Castaldo et al. (2016) Castaldo, R.; Xu, W.; Melillo, P.; Pecchia, L.; Santamaria, L.; James, C. Detection of mental stress due to oral academic examination via ultra-short-term HRV analysis. In Proceedings of the 2016 38th Annual International Conference of the IEEE Engineering in Medicine and Biology Society (EMBC). IEEE, 2016, pp. 3805–3808.
- Finsen et al. (2001) Finsen, L.; Søgaard, K.; Jensen, C.; Borg, V.; Christensen, H. Muscle activity and cardiovascular response during computer-mouse work with and without memory demands. Ergonomics 2001, 44, 1312–1329.
- Acerbi et al. (2016) Acerbi, G.; Rovini, E.; Betti, S.; Tirri, A.; Rónai, J.F.; Sirianni, A.; Agrimi, J.; Eusebi, L.; Cavallo, F. A wearable system for stress detection through physiological data analysis. In Proceedings of the Italian Forum of Ambient Assisted Living. Springer, 2016, pp. 31–50.
- Moriguchi et al. (1992) Moriguchi, A.; Otsuka, A.; Kohara, K.; Mikami, H.; Katahira, K.; Tsunetoshi, T.; Higashimori, K.; Ohishi, M.; Yo, Y.; Ogihara, T. Spectral change in heart rate variability in response to mental arithmetic before and after the beta-adrenoceptor blocker, carteolol. Clinical Autonomic Research 1992, 2, 267–270.
- Steptoe et al. (2001) Steptoe, A.; Willemsen, G.; Owen, N.; Flower, L.; Mohamed-Ali, V. Acute mental stress elicits delayed increases in circulating inflammatory cytokine levels. Clinical Science 2001, 101, 185–192.
- Ring et al. (2002) Ring, C.; Burns, V.E.; Carroll, D. Shifting hemodynamics of blood pressure control during prolonged mental stress. Psychophysiology 2002, 39, 585–590.
- Tugade and Fredrickson (2004) Tugade, M.M.; Fredrickson, B.L. Resilient individuals use positive emotions to bounce back from negative emotional experiences. Journal of personality and social psychology 2004, 86, 320.
- Vuksanović and Gal (2007) Vuksanović, V.; Gal, V. Heart rate variability in mental stress aloud. Medical engineering & physics 2007, 29, 344–349.
- Schubert et al. (2009) Schubert, C.; Lambertz, M.; Nelesen, R.; Bardwell, W.; Choi, J.B.; Dimsdale, J. Effects of stress on heart rate complexity—a comparison between short-term and chronic stress. Biological psychology 2009, 80, 325–332.
- Clays et al. (2011) Clays, E.; De Bacquer, D.; Crasset, V.; Kittel, F.; De Smet, P.; Kornitzer, M.; Karasek, R.; De Backer, G. The perception of work stressors is related to reduced parasympathetic activity. International archives of occupational and environmental health 2011, 84, 185–191.
- Lackner et al. (2011) Lackner, H.K.; Papousek, I.; Batzel, J.J.; Roessler, A.; Scharfetter, H.; Hinghofer-Szalkay, H. Phase synchronization of hemodynamic variables and respiration during mental challenge. International journal of psychophysiology 2011, 79, 401–409.
- van Lien et al. (2015) van Lien, R.; Neijts, M.; Willemsen, G.; de Geus, E.J. Ambulatory measurement of the ECG T-wave amplitude. Psychophysiology 2015, 52, 225–237.
- McDuff et al. (2014) McDuff, D.; Gontarek, S.; Picard, R. Remote measurement of cognitive stress via heart rate variability. In Proceedings of the 2014 36th Annual International Conference of the IEEE Engineering in Medicine and Biology Society. IEEE, 2014, pp. 2957–2960.
- Hynynen et al. (2011) Hynynen, E.; Konttinen, N.; Kinnunen, U.; Kyröläinen, H.; Rusko, H. The incidence of stress symptoms and heart rate variability during sleep and orthostatic test. European journal of applied physiology 2011, 111, 733–741.
- Cinaz et al. (2013) Cinaz, B.; Arnrich, B.; La Marca, R.; Tröster, G. Monitoring of mental workload levels during an everyday life office-work scenario. Personal and ubiquitous computing 2013, 17, 229–239.
- McDuff et al. (2016) McDuff, D.J.; Hernandez, J.; Gontarek, S.; Picard, R.W. Cogcam: Contact-free measurement of cognitive stress during computer tasks with a digital camera. In Proceedings of the Proceedings of the 2016 CHI Conference on Human Factors in Computing Systems, 2016, pp. 4000–4004.
- McFarland (1985) McFarland, R.A. Relationship of skin temperature changes to the emotions accompanying music. Biofeedback and Self-regulation 1985, 10, 255–267.
- Reisman (1997) Reisman, S. Measurement of physiological stress. In Proceedings of the Proceedings of the IEEE 23rd Northeast Bioengineering Conference. IEEE, 1997, pp. 21–23.
- Yoon et al. (2016) Yoon, S.; Sim, J.K.; Cho, Y.H. A flexible and wearable human stress monitoring patch. Scientific reports 2016, 6, 23468.
- Lee et al. (2010) Lee, Y.; Lee, B.; Lee, M. Wearable sensor glove based on conducting fabric using electrodermal activity and pulse-wave sensors for e-health application. Telemedicine and e-Health 2010, 16, 209–217.
- Torii et al. (1992) Torii, M.; Yamasaki, M.; Sasaki, T.; Nakayama, H. Fall in skin temperature of exercising man. British journal of sports medicine 1992, 26, 29–32.
- Herborn et al. (2015) Herborn, K.A.; Graves, J.L.; Jerem, P.; Evans, N.P.; Nager, R.; McCafferty, D.J.; McKeegan, D.E. Skin temperature reveals the intensity of acute stress. Physiology & behavior 2015, 152, 225–230.
- Marazziti et al. (1992) Marazziti, D.; Di Muro, A.; Castrogiovanni, P. Psychological stress and body temperature changes in humans. Physiology & behavior 1992, 52, 393–395.
- Rimm-Kaufman and Kagan (1996) Rimm-Kaufman, S.E.; Kagan, J. The psychological significance of changes in skin temperature. Motivation and Emotion 1996, 20, 63–78.
- Barreto et al. (2007) Barreto, A.; Zhai, J.; Rishe, N.; Gao, Y. Significance of pupil diameter measurements for the assessment of affective state in computer users. In Advances and innovations in systems, computing sciences and software engineering; Springer, 2007; pp. 59–64.
- Simoes et al. (1991) Simoes, E.; Roark, R.; Berman, S.; Esler, L.; Murphy, J. Respiratory rate: measurement of variability over time and accuracy at different counting periods. Archives of disease in childhood 1991, 66, 1199–1203.
- Grossman (1983) Grossman, P. Respiration, stress, and cardiovascular function. Psychophysiology 1983, 20, 284–300.
- Singh and Queyam (2013) Singh, M.; Queyam, A.B. Stress detection in automobile drivers using physiological parameters: A review. International Journal of Electronics Engineering 2013, 5, 1–5.
- Ahmed et al. (2015) Ahmed, B.; Khan, H.M.; Choi, J.; Gutierrez-Osuna, R. ReBreathe: A calibration protocol that improves stress/relax classification by relabeling deep breathing relaxation exercises. IEEE Transactions on Affective Computing 2015, 7, 150–161.
- Kreibig (2010) Kreibig, S.D. Autonomic nervous system activity in emotion: A review. Biological psychology 2010, 84, 394–421.
- Stern et al. (2001) Stern, R.M.; Stern, R.M.; Ray, W.J.; Quigley, K.S. Psychophysiological recording; Oxford University Press, USA, 2001.
- Shin et al. (1998) Shin, J.; Seongo, H.; Cha, D.; Yoon, Y.; Yoon, H. Estimation of stress status using biosignal and fuzzy theory. In Proceedings of the Proceedings of the 20th Annual International Conference of the IEEE Engineering in Medicine and Biology Society. Vol. 20 Biomedical Engineering Towards the Year 2000 and Beyond (Cat. No. 98CH36286). IEEE, 1998, Vol. 3, pp. 1393–1394.
- Hosseini and Naghibi-Sistani (2011) Hosseini, S.A.; Naghibi-Sistani, M.B. Classification of emotional stress using brain activity. Applied Biomedical Engineering 2011, pp. 313–336.
- Seematter et al. (2002) Seematter, G.; Dirlewanger, M.; Rey, V.; Schneiter, P.; Tappy, L. Metabolic Effects of Mental Stress during Over-and Underfeeding in Healthy Women. Obesity research 2002, 10, 49–55.
- Fernández and Anishchenko (2018) Fernández, J.R.M.; Anishchenko, L. Mental stress detection using bioradar respiratory signals. Biomedical signal processing and control 2018, 43, 244–249.
- Shan et al. (2020) Shan, Y.; Li, S.; Chen, T. Respiratory signal and human stress: non-contact detection of stress with a low-cost depth sensing camera. International Journal of Machine Learning and Cybernetics 2020, pp. 1–13.
- Wijsman et al. (2013) Wijsman, J.; Grundlehner, B.; Liu, H.; Penders, J.; Hermens, H. Wearable physiological sensors reflect mental stress state in office-like situations. In Proceedings of the 2013 Humaine Association Conference on Affective Computing and Intelligent Interaction. IEEE, 2013, pp. 600–605.
- Rigas et al. (2011) Rigas, G.; Goletsis, Y.; Fotiadis, D.I. Real-time driver’s stress event detection. IEEE Transactions on intelligent transportation systems 2011, 13, 221–234.
- Singh and Queyam (2013) Singh, M.; Queyam, A.B. A novel method of stress detection using physiological measurements of automobile drivers. International Journal of Electronics Engineering 2013, 5, 13–20.
- Wijsman et al. (2011) Wijsman, J.; Grundlehner, B.; Liu, H.; Hermens, H.; Penders, J. Towards mental stress detection using wearable physiological sensors. In Proceedings of the 2011 Annual International Conference of the IEEE Engineering in Medicine and Biology Society. IEEE, 2011, pp. 1798–1801.
- Pflanzer (2013) Pflanzer, R. Galvanic skin response and the polygraph. BIOPAC Systems, 2013.
- Acharya et al. (2006) Acharya, U.R.; Joseph, K.P.; Kannathal, N.; Lim, C.M.; Suri, J.S. Heart rate variability: a review. Medical and biological engineering and computing 2006, 44, 1031–1051.
- Clifford (2002) Clifford, G.D. Signal processing methods for heart rate variability analysis; University of Oxford, 2002.
- Sloan et al. (1994) Sloan, R.; Shapiro, P.; Bagiella, E.; Boni, S.; Paik, M.; Bigger Jr, J.; Steinman, R.; Gorman, J. Effect of mental stress throughout the day on cardiac autonomic control. Biological psychology 1994, 37, 89–99.
- Jobbágy et al. (2017) Jobbágy, Á.; Majnár, M.; Tóth, L.K.; Nagy, P. HRV-based stress level assessment using very short recordings. Periodica Polytechnica Electrical Engineering and Computer Science 2017, 61, 238–245.
- Taelman et al. (2009) Taelman, J.; Vandeput, S.; Spaepen, A.; Van Huffel, S. Influence of mental stress on heart rate and heart rate variability. In Proceedings of the 4th European conference of the international federation for medical and biological engineering. Springer, 2009, pp. 1366–1369.
- Salahuddin et al. (2007) Salahuddin, L.; Jeong, M.G.; Kim, D.; Lim, S.K.; Won, K.; Woo, J.M. Dependence of heart rate variability on stress factors of stress response inventory. In Proceedings of the 2007 9th international conference on e-health networking, application and services. IEEE, 2007, pp. 236–239.
- Lombardo and Vick (2019) Lombardo, D.M.; Vick, R.S. Relationship Between Heart Rate Variability and Perceived Stress in Healthy College-Aged Adults. The FASEB Journal 2019, 33, 741–2.
- Oskooei et al. (2019) Oskooei, A.; Chau, S.M.; Weiss, J.; Sridhar, A.; Martínez, M.R.; Michel, B. DeStress: Deep Learning for Unsupervised Identification of Mental Stress in Firefighters from Heart-rate Variability (HRV) Data. arXiv preprint arXiv:1911.13213 2019.
- Hammoud et al. (2019) Hammoud, S.; Karam, R.; Mourad, R.; Saad, I.; Kurdi, M. Stress and heart rate variability during university final examination among Lebanese students. Behavioral Sciences 2019, 9, 3.
- Orsila et al. (2008) Orsila, R.; Virtanen, M.; Luukkaala, T.; Tarvainen, M.; Karjalainen, P.; Viik, J.; Savinainen, M.; Nygård, C.H. Perceived mental stress and reactions in heart rate variability—a pilot study among employees of an electronics company. International Journal of Occupational Safety and Ergonomics 2008, 14, 275–283.
- Malik (1996) Malik, M. Heart rate variability: Standards of measurement, physiological interpretation, and clinical use: Task force of the European Society of Cardiology and the North American Society for Pacing and Electrophysiology. Annals of Noninvasive Electrocardiology 1996, 1, 151–181.
- Hall et al. (2004) Hall, M.; Vasko, R.; Buysse, D.; Ombao, H.; Chen, Q.; Cashmere, J.D.; Kupfer, D.; Thayer, J.F. Acute stress affects heart rate variability during sleep. Psychosomatic medicine 2004, 66, 56–62.
- Salahuddin et al. (2007) Salahuddin, L.; Cho, J.; Jeong, M.G.; Kim, D. Ultra short term analysis of heart rate variability for monitoring mental stress in mobile settings. In Proceedings of the 2007 29th annual international conference of the ieee engineering in medicine and biology society. IEEE, 2007, pp. 4656–4659.
- Bernardi et al. (2000) Bernardi, L.; Wdowczyk-Szulc, J.; Valenti, C.; Castoldi, S.; Passino, C.; Spadacini, G.; Sleight, P. Effects of controlled breathing, mental activity and mental stress with or without verbalization on heart rate variability. Journal of the American College of Cardiology 2000, 35, 1462–1469.
- Taelman et al. (2011) Taelman, J.; Vandeput, S.; Vlemincx, E.; Spaepen, A.; Van Huffel, S. Instantaneous changes in heart rate regulation due to mental load in simulated office work. European journal of applied physiology 2011, 111, 1497–1505.
- Tharion et al. (2009) Tharion, E.; Parthasarathy, S.; Neelakantan, N. Short-term heart rate variability measures in students during examinations. Natl Med J India 2009, 22, 63–66.
- Visnovcova et al. (2014) Visnovcova, Z.; Mestanik, M.; Javorka, M.; Mokra, D.; Gala, M.; Jurko, A.; Calkovska, A.; Tonhajzerova, I. Complexity and time asymmetry of heart rate variability are altered in acute mental stress. Physiological measurement 2014, 35, 1319.
- Madden and Savard (1995) Madden, K.; Savard, G. Effects of mental state on heart rate and blood pressure variability in men and women. Clinical Physiology 1995, 15, 557–569.
- Li et al. (2009) Li, Z.; Snieder, H.; Su, S.; Ding, X.; Thayer, J.F.; Treiber, F.A.; Wang, X. A longitudinal study in youth of heart rate variability at rest and in response to stress. International Journal of Psychophysiology 2009, 73, 212–217.
- Lucini et al. (2002) Lucini, D.; Norbiato, G.; Clerici, M.; Pagani, M. Hemodynamic and autonomic adjustments to real life stress conditions in humans. Hypertension 2002, 39, 184–188.
- Hjortskov et al. (2004) Hjortskov, N.; Rissén, D.; Blangsted, A.K.; Fallentin, N.; Lundberg, U.; Søgaard, K. The effect of mental stress on heart rate variability and blood pressure during computer work. European journal of applied physiology 2004, 92, 84–89.
- Melillo et al. (2011) Melillo, P.; Bracale, M.; Pecchia, L. Nonlinear Heart Rate Variability features for real-life stress detection. Case study: students under stress due to university examination. Biomedical engineering online 2011, 10, 96.
- Bousefsaf et al. (2013) Bousefsaf, F.; Maaoui, C.; Pruski, A. Remote assessment of the heart rate variability to detect mental stress. In Proceedings of the 2013 7th International Conference on Pervasive Computing Technologies for Healthcare and Workshops. IEEE, 2013, pp. 348–351.
- Kim et al. (2008) Kim, D.; Seo, Y.; Cho, J.; Cho, C.H. Detection of subjects with higher self-reporting stress scores using heart rate variability patterns during the day. In Proceedings of the 2008 30th Annual International Conference of the IEEE Engineering in Medicine and Biology Society. IEEE, 2008, pp. 682–685.
- Boonnithi and Phongsuphap (2011) Boonnithi, S.; Phongsuphap, S. Comparison of heart rate variability measures for mental stress detection. In Proceedings of the 2011 Computing in Cardiology. IEEE, 2011, pp. 85–88.
- Melillo et al. (2013) Melillo, P.; Formisano, C.; Bracale, U.; Pecchia, L. Classification tree for real-life stress detection using linear Heart Rate Variability analysis. Case study: students under stress due to university examination. In Proceedings of the World Congress on Medical Physics and Biomedical Engineering May 26-31, 2012, Beijing, China. Springer, 2013, pp. 477–480.
- Vanitha and Suresh (2014) Vanitha, L.; Suresh, G. Hierarchical SVM to detect mental stress in human beings using Heart Rate Variability. In Proceedings of the 2014 2nd International Conference on Devices, Circuits and Systems (ICDCS). IEEE, 2014, pp. 1–5.
- Munla et al. (2015) Munla, N.; Khalil, M.; Shahin, A.; Mourad, A. Driver stress level detection using HRV analysis. In Proceedings of the 2015 International Conference on Advances in Biomedical Engineering (ICABME). IEEE, 2015, pp. 61–64.
- Wang et al. (2013) Wang, J.S.; Lin, C.W.; Yang, Y.T.C. A k-nearest-neighbor classifier with heart rate variability feature-based transformation algorithm for driving stress recognition. Neurocomputing 2013, 116, 136–143.
- Gasperin et al. (2009) Gasperin, D.; Netuveli, G.; Dias-da Costa, J.S.; Pattussi, M.P. Effect of psychological stress on blood pressure increase: a meta-analysis of cohort studies. Cadernos de saude publica 2009, 25, 715–726.
- Pickering et al. (1996) Pickering, T.G.; Devereux, R.B.; James, G.D.; Gerin, W.; Landsbergis, P.; Schnall, P.L.; Schwartz, J.E. Environmental influences on blood pressure and the role of job strain. Journal of hypertension. Supplement: official journal of the International Society of Hypertension 1996, 14, S179–85.
- Schnall et al. (1998) Schnall, P.L.; Schwartz, J.E.; Landsbergis, P.A.; Warren, K.; Pickering, T.G. A longitudinal study of job strain and ambulatory blood pressure: results from a three-year follow-up. Psychosomatic medicine 1998, 60, 697–706.
- Carroll et al. (2003) Carroll, D.; Ring, C.; Hunt, K.; Ford, G.; Macintyre, S. Blood pressure reactions to stress and the prediction of future blood pressure: effects of sex, age, and socioeconomic position. Psychosomatic Medicine 2003, 65, 1058–1064.
- Carroll et al. (2011) Carroll, D.; Phillips, A.C.; Der, G.; Hunt, K.; Benzeval, M. Blood pressure reactions to acute mental stress and future blood pressure status: data from the 12-year follow-up of the West of Scotland Study. Psychosomatic medicine 2011, 73, 737–742.
- Challoner (1979) Challoner, A. Photoelectric plethysmography for estimating cutaneous blood flow. Non-invasive physiological measurements 1979, 1, 125–151.
- Maeda et al. (2011) Maeda, Y.; Sekine, M.; Tamura, T. The advantages of wearable green reflected photoplethysmography. Journal of medical systems 2011, 35, 829–834.
- Kageyama et al. (2007) Kageyama, Y.; Odagaki, M.; Hosaka, H. Wavelet analysis for quantification of mental stress stage by finger-tip photo-plethysmography. In Proceedings of the 2007 29th Annual International Conference of the IEEE Engineering in Medicine and Biology Society. IEEE, 2007, pp. 1846–1849.
- Štula (2003) Štula, T. Evaluation of heart rate variability from ECG signal. IFAC Proceedings Volumes 2003, 36, 429–432.
- Chauhan et al. (2018) Chauhan, U.; Reithinger, N.; Mackey, J.R. Real-time stress assessment through PPG sensor for VR biofeedback. In Proceedings of the Proceedings of the 20th International Conference on Multimodal Interaction: Adjunct, 2018, pp. 1–5.
- Li et al. (2018) Li, F.; Xu, P.; Zheng, S.; Chen, W.; Yan, Y.; Lu, S.; Liu, Z. Photoplethysmography based psychological stress detection with pulse rate variability feature differences and elastic net. International Journal of Distributed Sensor Networks 2018, 14, 1550147718803298.
- Zangróniz et al. (2018) Zangróniz, R.; Martínez-Rodrigo, A.; López, M.T.; Pastor, J.M.; Fernández-Caballero, A. Estimation of mental distress from photoplethysmography. Applied Sciences 2018, 8, 69.
- Kirschbaum and Hellhammer (1989) Kirschbaum, C.; Hellhammer, D.H. Salivary cortisol in psychobiological research: an overview. Neuropsychobiology 1989, 22, 150–169.
- Fink (2000) Fink, G. Encyclopedia of stress; Academic press, 2000.
- Hellhammer et al. (2009) Hellhammer, D.H.; Wüst, S.; Kudielka, B.M. Salivary cortisol as a biomarker in stress research. Psychoneuroendocrinology 2009, 34, 163–171.
- Boucher and Plusquellec (2019) Boucher, P.; Plusquellec, P. Acute Stress Assessment from Excess of Cortisol Secretion, Fundamentals and Perspectives. Frontiers in endocrinology 2019, 10, 749.
- Tu et al. (2019) Tu, E.; Begdache, L.; Won, D.; Koh, A. Sweat cortisol response to stress, macronutrient consumption and birth control. In Proceedings of the 2019 IEEE Research and Applications of Photonics in Defense Conference (RAPID). IEEE, 2019, pp. 1–4.
- Luo et al. (2012) Luo, L.; Xiao, L.; Miao, D.; Luo, X. The relationship between mental stress induced changes in cortisol levels and vascular responses quantified by waveform analysis: Investigating stress-dependent indices of vascular changes. In Proceedings of the 2012 International Conference on Biomedical Engineering and Biotechnology. IEEE, 2012, pp. 929–933.
- Nath et al. (2020) Nath, R.K.; Thapliyal, H.; Caban-Holt, A. Validating Physiological Stress Detection Model Using Cortisol as Stress Bio Marker. In Proceedings of the 2020 IEEE International Conference on Consumer Electronics (ICCE). IEEE, 2020, pp. 1–5.
- Selvaraj (2015) Selvaraj, N. Psychological acute stress measurement using a wireless adhesive biosensor. In Proceedings of the 2015 37th Annual International Conference of the IEEE Engineering in Medicine and Biology Society (EMBC). IEEE, 2015, pp. 3137–3140.
- Rey et al. (2014) Rey, J.M.G.; Arza, A.; Aguilo, J. Towards an objective measurement of emotional stress. In Proceedings of the 2014 IEEE 9th IberoAmerican Congress on Sensors. IEEE, 2014, pp. 1–4.
- Nomura et al. (2009) Nomura, S.; Mizuno, T.; Nozawa, A.; Asano, H.; Ide, H. Salivary Cortisol as a new Biomarker for a mild Mental Workload. In Proceedings of the 2009 International Conference on Biometrics and Kansei Engineering. IEEE, 2009, pp. 127–131.
- Beatty et al. (2000) Beatty, J.; Lucero-Wagoner, B.; et al. The pupillary system. Handbook of psychophysiology 2000, 2.
- Bradley et al. (2008) Bradley, M.M.; Miccoli, L.; Escrig, M.A.; Lang, P.J. The pupil as a measure of emotional arousal and autonomic activation. Psychophysiology 2008, 45, 602–607.
- Partala and Surakka (2003) Partala, T.; Surakka, V. Pupil size variation as an indication of affective processing. International journal of human-computer studies 2003, 59, 185–198.
- Al-Omar et al. (2013) Al-Omar, D.; Al-Wabil, A.; Fawzi, M. Using pupil size variation during visual emotional stimulation in measuring affective states of non communicative individuals. In Proceedings of the International Conference on Universal Access in Human-Computer Interaction. Springer, 2013, pp. 253–258.
- Pedrotti et al. (2014) Pedrotti, M.; Mirzaei, M.A.; Tedesco, A.; Chardonnet, J.R.; Mérienne, F.; Benedetto, S.; Baccino, T. Automatic stress classification with pupil diameter analysis. International Journal of Human-Computer Interaction 2014, 30, 220–236.
- Honma (2013) Honma, M. Hyper-volume of eye-contact perception and social anxiety traits. Consciousness and cognition 2013, 22, 167–173.
- Simpson and Molloy (1971) Simpson, H.; Molloy, F. Effects of audience anxiety on pupil size. Psychophysiology 1971, 8, 491–496.
- De Berker et al. (2016) De Berker, A.O.; Tirole, M.; Rutledge, R.B.; Cross, G.F.; Dolan, R.J.; Bestmann, S. Acute stress selectively impairs learning to act. Scientific reports 2016, 6, 1–12.
- Barreto et al. (2007) Barreto, A.; Zhai, J.; Adjouadi, M. Non-intrusive physiological monitoring for automated stress detection in human-computer interaction. In Proceedings of the International Workshop on Human-Computer Interaction. Springer, 2007, pp. 29–38.
- Kimble et al. (2010) Kimble, M.O.; Fleming, K.; Bandy, C.; Kim, J.; Zambetti, A. Eye tracking and visual attention to threating stimuli in veterans of the Iraq war. Journal of anxiety disorders 2010, 24, 293–299.
- Wang and Yue (2011) Wang, L.s.; Yue, X. Attention bias during processing of facial expressions in trait anxiety: An eye-tracking study. In Proceedings of the Proceedings of 2011 International Conference on Electronics and Optoelectronics. IEEE, 2011, Vol. 1, pp. V1–347.
- Torres-Salomao et al. (2015) Torres-Salomao, L.; Mahfouf, M.; El-Samahy, E. Pupil diameter size marker for incremental mental stress detection. In Proceedings of the 2015 17th international conference on e-health networking, application & services (HealthCom). IEEE, 2015, pp. 286–291.
- Winn et al. (1994) Winn, B.; Whitaker, D.; Elliott, D.B.; Phillips, N.J. Factors affecting light-adapted pupil size in normal human subjects. Investigative ophthalmology & visual science 1994, 35, 1132–1137.
- Ellermeier and Westphal (1995) Ellermeier, W.; Westphal, W. Gender differences in pain ratings and pupil reactions to painful pressure stimuli. Pain 1995, 61, 435–439.
- Reeves (1920) Reeves, P. The response of the average pupil to various intensities of light. JOSA 1920, 4, 35–43.
- Murray et al. (1996) Murray, I.R.; Baber, C.; South, A. Towards a definition and working model of stress and its effects on speech. Speech Communication 1996, 20, 3–12.
- Womack and Hansen (1999) Womack, B.D.; Hansen, J.H. N-channel hidden Markov models for combined stressed speech classification and recognition. IEEE Transactions on Speech and Audio Processing 1999, 7, 668–677.
- Lefter et al. (2015) Lefter, I.; Burghouts, G.J.; Rothkrantz, L.J. Recognizing stress using semantics and modulation of speech and gestures. IEEE Transactions on Affective Computing 2015, 7, 162–175.
- Williams and Stevens (1972) Williams, C.E.; Stevens, K.N. Emotions and speech: Some acoustical correlates. The Journal of the Acoustical Society of America 1972, 52, 1238–1250.
- Hansen (1988) Hansen, J.H.L. Analysis and compensation of stressed and noisy speech with application to robust automatic recognition 1988.
- Cairns and Hansen (1994) Cairns, D.A.; Hansen, J.H. Nonlinear analysis and classification of speech under stressed conditions. The Journal of the Acoustical Society of America 1994, 96, 3392–3400.
- Junqua (1996) Junqua, J.C. The influence of acoustics on speech production: A noise-induced stress phenomenon known as the Lombard reflex. Speech communication 1996, 20, 13–22.
- Protopapas and Lieberman (1997) Protopapas, A.; Lieberman, P. Fundamental frequency of phonation and perceived emotional stress. The Journal of the Acoustical Society of America 1997, 101, 2267–2277.
- Hansen and Patil (2007) Hansen, J.H.; Patil, S. Speech under stress: Analysis, modeling and recognition. In Speaker classification I; Springer, 2007; pp. 108–137.
- Gharavian (2012) Gharavian, D. Statistical Variation Analysis of Formant and Pitch Frequencies in Anger and Happiness Emotional Sentences in Farsi Language. AUT Journal of Electrical Engineering 2012, 44, 33–45.
- Lu et al. (2012) Lu, H.; Frauendorfer, D.; Rabbi, M.; Mast, M.S.; Chittaranjan, G.T.; Campbell, A.T.; Gatica-Perez, D.; Choudhury, T. Stresssense: Detecting stress in unconstrained acoustic environments using smartphones. In Proceedings of the Proceedings of the 2012 ACM conference on ubiquitous computing, 2012, pp. 351–360.
- Sondhi et al. (2015) Sondhi, S.; Khan, M.; Vijay, R.; Salhan, A.K. Vocal indicators of emotional stress. International Journal of Computer Applications 2015, 122.
- Hansen et al. (2011) Hansen, J.H.; Kim, W.; Rahurkar, M.; Ruzanski, E.; Meyerhoff, J. Robust emotional stressed speech detection using weighted frequency subbands. EURASIP Journal on Advances in Signal Processing 2011, 2011, 1–10.
- Nwe et al. (2003) Nwe, T.L.; Foo, S.W.; De Silva, L.C. Speech emotion recognition using hidden Markov models. Speech communication 2003, 41, 603–623.
- Fernandez and Picard (2003) Fernandez, R.; Picard, R.W. Modeling drivers’ speech under stress. Speech communication 2003, 40, 145–159.
- Lefter et al. (2011) Lefter, I.; Rothkrantz, L.J.; Van Leeuwen, D.A.; Wiggers, P. Automatic stress detection in emergency(telephone) calls. International Journal of Intelligent Defence Support Systems 2011, 4, 148–168.
- Womak and Hansen (1996) Womak, B.; Hansen, J.H. Improved speech recognition via speaker stress directed classification. In Proceedings of the 1996 IEEE International Conference on Acoustics, Speech, and Signal Processing Conference Proceedings. IEEE, 1996, Vol. 1, pp. 53–56.
- Devillers and Vidrascu (2006) Devillers, L.; Vidrascu, L. Real-life emotions detection with lexical and paralinguistic cues on human-human call center dialogs. In Proceedings of the Ninth International Conference on Spoken Language Processing, 2006.
- Hollien (2002) Hollien, H.F. Forensic voice identification; Academic Press, 2002.
- Simantiraki et al. (2016) Simantiraki, O.; Giannakakis, G.; Pampouchidou, A.; Tsiknakis, M. Stress detection from speech using spectral slope measurements. In Pervasive Computing Paradigms for Mental Health; Springer, 2016; pp. 41–50.
- He et al. (2009) He, L.; Lech, M.; Maddage, N.; Allen, N. Stress and emotion recognition using log-Gabor filter analysis of speech spectrograms. In Proceedings of the 2009 3rd International Conference on Affective Computing and Intelligent Interaction and Workshops. IEEE, 2009, pp. 1–6.
- Hanson et al. (1993) Hanson, H.M.; Maragos, P.; Potamianos, A. Finding speech formants and modulations via energy separation: With application to a vocoder. In Proceedings of the 1993 IEEE International Conference on Acoustics, Speech, and Signal Processing. IEEE, 1993, Vol. 2, pp. 716–719.
- Sarikaya and Gowdy (1998) Sarikaya, R.; Gowdy, J.N. Subband based classification of speech under stress. In Proceedings of the Proceedings of the 1998 IEEE International Conference on Acoustics, Speech and Signal Processing, ICASSP’98 (Cat. No. 98CH36181). IEEE, 1998, Vol. 1, pp. 569–572.
- Yao et al. (2012) Yao, X.; Jitsuhiro, T.; Miyajima, C.; Kitaoka, N.; Takeda, K. Physical characteristics of vocal folds during speech under stress. In Proceedings of the 2012 IEEE International Conference on Acoustics, Speech and Signal Processing (ICASSP). IEEE, 2012, pp. 4609–4612.
- Kadambe (2007) Kadambe, S. Study on Effect of Speaker Variability and Driving Conditions on the Performance of an ASR Engine Inside a Vehicle. In Advances for In-Vehicle and Mobile Systems; Springer, 2007; pp. 201–210.
- Soury and Devillers (2013) Soury, M.; Devillers, L. Stress detection from audio on multiple window analysis size in a public speaking task. In Proceedings of the 2013 Humaine Association Conference on Affective Computing and Intelligent Interaction. IEEE, 2013, pp. 529–533.
- Haak et al. (2009) Haak, M.; Bos, S.; Panic, S.; Rothkrantz, L. Detecting stress using eye blinks and brain activity from EEG signals. Proceeding of the 1st driver car interaction and interface (DCII 2008) 2009, pp. 35–60.
- Pavlidis et al. (2000) Pavlidis, I.; Levine, J.; Baukol, P. Thermal imaging for anxiety detection. In Proceedings of the Proceedings IEEE Workshop on Computer Vision Beyond the Visible Spectrum: Methods and Applications (Cat. No. PR00640). IEEE, 2000, pp. 104–109.
- Laretzaki et al. (2011) Laretzaki, G.; Plainis, S.; Vrettos, I.; Chrisoulakis, A.; Pallikaris, I.; Bitsios, P. Threat and trait anxiety affect stability of gaze fixation. Biological psychology 2011, 86, 330–336.
- Fox et al. (2007) Fox, E.; Mathews, A.; Calder, A.J.; Yiend, J. Anxiety and sensitivity to gaze direction in emotionally expressive faces. Emotion 2007, 7, 478.
- Staab (2014) Staab, J.P. The influence of anxiety on ocular motor control and gaze. Current opinion in neurology 2014, 27, 118–124.
- Mokhayeri and Akbarzadeh-T (2011) Mokhayeri, F.; Akbarzadeh-T, M. Mental stress detection based on soft computing techniques. In Proceedings of the 2011 IEEE International Conference on Bioinformatics and Biomedicine. IEEE, 2011, pp. 430–433.
- Aigrain et al. (2015) Aigrain, J.; Dubuisson, S.; Detyniecki, M.; Chetouani, M. Person-specific behavioural features for automatic stress detection. In Proceedings of the 2015 11th IEEE International Conference and Workshops on Automatic Face and Gesture Recognition (FG). IEEE, 2015, Vol. 3, pp. 1–6.
- Carneiro et al. (2012) Carneiro, D.; Castillo, J.C.; Novais, P.; Fernández-Caballero, A.; Neves, J. Multimodal behavioral analysis for non-invasive stress detection. Expert Systems with Applications 2012, 39, 13376–13389.
- Gunes and Piccardi (2007) Gunes, H.; Piccardi, M. Bi-modal emotion recognition from expressive face and body gestures. Journal of Network and Computer Applications 2007, 30, 1334–1345.
- Bevilacqua et al. (2018) Bevilacqua, F.; Engström, H.; Backlund, P. Automated analysis of facial cues from videos as a potential method for differentiating stress and boredom of players in games. International Journal of Computer Games Technology 2018, 2018.
- Dinges et al. (2005) Dinges, D.F.; Rider, R.L.; Dorrian, J.; McGlinchey, E.L.; Rogers, N.L.; Cizman, Z.; Goldenstein, S.K.; Vogler, C.; Venkataraman, S.; Metaxas, D.N. Optical computer recognition of facial expressions associated with stress induced by performance demands. Aviation, space, and environmental medicine 2005, 76, B172–B182.
- Giannakakis et al. (2018) Giannakakis, G.; Manousos, D.; Chaniotakis, V.; Tsiknakis, M. Evaluation of head pose features for stress detection and classification. In Proceedings of the 2018 IEEE EMBS International Conference on Biomedical & Health Informatics (BHI). IEEE, 2018, pp. 406–409.
- Hadar et al. (1983) Hadar, U.; Steiner, T.J.; Grant, E.C.; Clifford Rose, F. Head movement correlates of juncture and stress at sentence level. Language and speech 1983, 26, 117–129.
- Giannakakis et al. (2018) Giannakakis, G.; Manousos, D.; Simos, P.; Tsiknakis, M. Head movements in context of speech during stress induction. In Proceedings of the 2018 13th IEEE International Conference on Automatic Face & Gesture Recognition (FG 2018). IEEE, 2018, pp. 710–714.
- Adams et al. (2015) Adams, A.; Mahmoud, M.; Baltrušaitis, T.; Robinson, P. Decoupling facial expressions and head motions in complex emotions. In Proceedings of the 2015 International Conference on Affective Computing and Intelligent Interaction (ACII). IEEE, 2015, pp. 274–280.
- Arnrich et al. (2009) Arnrich, B.; Setz, C.; La Marca, R.; Tröster, G.; Ehlert, U. What does your chair know about your stress level? IEEE Transactions on Information Technology in Biomedicine 2009, 14, 207–214.
- Hernandez et al. (2014) Hernandez, J.; Paredes, P.; Roseway, A.; Czerwinski, M. Under pressure: sensing stress of computer users. In Proceedings of the Proceedings of the SIGCHI conference on Human factors in computing systems, 2014, pp. 51–60.
- Sun et al. (2014) Sun, D.; Paredes, P.; Canny, J. MouStress: detecting stress from mouse motion. In Proceedings of the Proceedings of the SIGCHI conference on Human factors in computing systems, 2014, pp. 61–70.
- Lim et al. (2014) Lim, Y.M.; Ayesh, A.; Stacey, M. Detecting cognitive stress from keyboard and mouse dynamics during mental arithmetic. In Proceedings of the 2014 Science and Information Conference. IEEE, 2014, pp. 146–152.
- Carneiro et al. (2015) Carneiro, D.; Novais, P.; Pêgo, J.M.; Sousa, N.; Neves, J. Using mouse dynamics to assess stress during online exams. In Proceedings of the International Conference on Hybrid Artificial Intelligence Systems. Springer, 2015, pp. 345–356.
- Rodrigues et al. (2013) Rodrigues, M.; Gonçalves, S.; Carneiro, D.; Novais, P.; Fdez-Riverola, F. Keystrokes and clicks: Measuring stress on e-learning students. In Management Intelligent Systems; Springer, 2013; pp. 119–126.
- Andrén and Funk (2005) Andrén, J.; Funk, P. A Case-Based Approach Using Behavioural Biometrics to Determine a User’s Stress Level. In Proceedings of the ICCBR Workshops, 2005, pp. 9–17.
- Gunawardhane et al. (2013) Gunawardhane, S.D.; De Silva, P.M.; Kulathunga, D.S.; Arunatileka, S.M. Non invasive human stress detection using key stroke dynamics and pattern variations. In Proceedings of the 2013 International Conference on Advances in ICT for Emerging Regions (ICTer). IEEE, 2013, pp. 240–247.
- Kailas et al. (2010) Kailas, A.; Chong, C.C.; Watanabe, F. From mobile phones to personal wellness dashboards. IEEE pulse 2010, 1, 57–63.
- Lee and Jung (2018) Lee, R.A.; Jung, M.E. Evaluation of an mHealth App (DeStressify) on university students’ mental health: pilot trial. JMIR mental health 2018, 5, e2.
- Dillon et al. (2016) Dillon, A.; Kelly, M.; Robertson, I.H.; Robertson, D.A. Smartphone applications utilizing biofeedback can aid stress reduction. Frontiers in psychology 2016, 7, 832.
- Colunas et al. (2011) Colunas, M.F.; Fernandes, J.M.A.; Oliveira, I.C.; Cunha, J.P.S. Droid jacket: Using an android based smartphone for team monitoring. In Proceedings of the 2011 7th International Wireless Communications and Mobile Computing Conference. IEEE, 2011, pp. 2157–2161.
- Gaggioli et al. (2012) Gaggioli, A.; Pioggia, G.; Tartarisco, G.; Baldus, G.; Ferro, M.; Cipresso, P.; Serino, S.; Popleteev, A.; Gabrielli, S.; Maimone, R.; et al. A system for automatic detection of momentary stress in naturalistic settings., 2012.
- Bauer and Lukowicz (2012) Bauer, G.; Lukowicz, P. Can smartphones detect stress-related changes in the behaviour of individuals? In Proceedings of the 2012 IEEE International Conference on Pervasive Computing and Communications Workshops. IEEE, 2012, pp. 423–426.
- Muaremi et al. (2013) Muaremi, A.; Arnrich, B.; Tröster, G. Towards measuring stress with smartphones and wearable devices during workday and sleep. BioNanoScience 2013, 3, 172–183.
- Chang et al. (2011) Chang, K.h.; Fisher, D.; Canny, J.; Hartmann, B. How’s my mood and stress? an efficient speech analysis library for unobtrusive monitoring on mobile phones. In Proceedings of the Proceedings of the 6th International Conference on Body Area Networks, 2011, pp. 71–77.
- Lee and Chung (2016) Lee, B.G.; Chung, W.Y. Wearable glove-type driver stress detection using a motion sensor. IEEE Transactions on Intelligent Transportation Systems 2016, 18, 1835–1844.
- Gjoreski et al. (2015) Gjoreski, M.; Gjoreski, H.; Lutrek, M.; Gams, M. Automatic detection of perceived stress in campus students using smartphones. In Proceedings of the 2015 International Conference on Intelligent Environments. IEEE, 2015, pp. 132–135.
- Bogomolov et al. (2014a) Bogomolov, A.; Lepri, B.; Ferron, M.; Pianesi, F.; Pentland, A.S. Pervasive stress recognition for sustainable living. In Proceedings of the 2014 IEEE International Conference on Pervasive Computing and Communication Workshops (PERCOM WORKSHOPS). IEEE, 2014, pp. 345–350.
- Bogomolov et al. (2014b) Bogomolov, A.; Lepri, B.; Ferron, M.; Pianesi, F.; Pentland, A. Daily stress recognition from mobile phone data, weather conditions and individual traits. In Proceedings of the Proceedings of the 22nd ACM international conference on Multimedia, 2014, pp. 477–486.
- Ciman and Wac (2016) Ciman, M.; Wac, K. Individuals’ stress assessment using human-smartphone interaction analysis. IEEE Transactions on Affective Computing 2016, 9, 51–65.
- Gimpel et al. (2015) Gimpel, H.; Regal, C.; Schmidt, M. myStress: Unobtrusive smartphone-based stress detection 2015.
- Sysoev et al. (2015) Sysoev, M.; Kos, A.; Pogačnik, M. Noninvasive stress recognition considering the current activity. Personal and Ubiquitous Computing 2015, 19, 1045–1052.
- Kostopoulos et al. (2017) Kostopoulos, P.; Kyritsis, A.I.; Deriaz, M.; Konstantas, D. Stress detection using smart phone data. In eHealth 360; Springer, 2017; pp. 340–351.
- Vildjiounaite et al. (2018) Vildjiounaite, E.; Kallio, J.; Kyllönen, V.; Nieminen, M.; Määttänen, I.; Lindholm, M.; Mäntyjärvi, J.; Gimel’farb, G. Unobtrusive stress detection on the basis of smartphone usage data. Personal and Ubiquitous Computing 2018, 22, 671–688.
- Levine et al. (2001) Levine, J.A.; Pavlidis, I.; Cooper, M. The face of fear. The Lancet 2001, 357, 1757.
- Nozawa and Tacano (2009) Nozawa, A.; Tacano, M. Correlation analysis on alpha attenuation and nasal skin temperature. Journal of Statistical Mechanics: Theory and Experiment 2009, 2009, P01007.
- Ioannou et al. (2014) Ioannou, S.; Gallese, V.; Merla, A. Thermal infrared imaging in psychophysiology: potentialities and limits. Psychophysiology 2014, 51, 951–963.
- Shastri et al. (2008) Shastri, D.; Merla, A.; Tsiamyrtzis, P.; Pavlidis, I. Imaging facial signs of neurophysiological responses. IEEE Transactions on Biomedical Engineering 2008, 56, 477–484.
- Hong and Hong (2016) Hong, K.; Hong, S. Real-time stress assessment using thermal imaging. The Visual Computer 2016, 32, 1369–1377.
- Puri et al. (2005) Puri, C.; Olson, L.; Pavlidis, I.; Levine, J.; Starren, J. StressCam: non-contact measurement of users’ emotional states through thermal imaging. In Proceedings of the CHI’05 extended abstracts on Human factors in computing systems, 2005, pp. 1725–1728.
- Chen et al. (2014) Chen, T.; Yuen, P.; Richardson, M.; Liu, G.; She, Z. Detection of psychological stress using a hyperspectral imaging technique. IEEE Transactions on Affective Computing 2014, 5, 391–405.
- Pavlidis and Levine (2002) Pavlidis, I.; Levine, J. Thermal image analysis for polygraph testing. IEEE Engineering in Medicine and Biology Magazine 2002, 21, 56–64.
- Kang et al. (2006) Kang, J.; McGinley, J.; McFadyen, G.; Babski-Reeves, K. Determining learning level and effective training times using thermography. In Proceedings of the Proceedings of Army Science Conference, Orlando, Florida, USA, 2006.
- Pavlidis et al. (2012) Pavlidis, I.; Tsiamyrtzis, P.; Shastri, D.; Wesley, A.; Zhou, Y.; Lindner, P.; Buddharaju, P.; Joseph, R.; Mandapati, A.; Dunkin, B.; et al. Fast by nature-how stress patterns define human experience and performance in dexterous tasks. Scientific Reports 2012, 2, 305.
- Shastri et al. (2012) Shastri, D.; Papadakis, M.; Tsiamyrtzis, P.; Bass, B.; Pavlidis, I. Perinasal imaging of physiological stress and its affective potential. IEEE Transactions on Affective Computing 2012, 3, 366–378.
- Cho et al. (2017a) Cho, Y.; Bianchi-Berthouze, N.; Julier, S.J. DeepBreath: Deep learning of breathing patterns for automatic stress recognition using low-cost thermal imaging in unconstrained settings. In Proceedings of the 2017 Seventh International Conference on Affective Computing and Intelligent Interaction (ACII). IEEE, 2017, pp. 456–463.
- Cho et al. (2017b) Cho, Y.; Bianchi-Berthouze, N.; Julier, S.J.; Marquardt, N. ThermSense: smartphone-based breathing sensing platform using noncontact low-cost thermal camera. In Proceedings of the 2017 Seventh International Conference on Affective Computing and Intelligent Interaction Workshops and Demos (ACIIW). IEEE, 2017, pp. 83–84.
- Gao et al. (2014) Gao, H.; Yüce, A.; Thiran, J.P. Detecting emotional stress from facial expressions for driving safety. In Proceedings of the 2014 IEEE International Conference on Image Processing (ICIP). IEEE, 2014, pp. 5961–5965.
- Derakhshan et al. (2014) Derakhshan, A.; Mikaeili, M.; Khalilzadeh, M.A.; Mohammadian, A. Preliminary study on facial thermal imaging for stress recognition. In Proceedings of the Intelligent Environments (Workshops), 2014, pp. 66–73.
- Sharma et al. (2014) Sharma, N.; Dhall, A.; Gedeon, T.; Goecke, R. Thermal spatio-temporal data for stress recognition. EURASIP Journal on Image and Video Processing 2014, 2014, 28.
- Mohd et al. (2015) Mohd, M.N.H.; Kashima, M.; Sato, K.; Watanabe, M. Mental stress recognition based on non-invasive and non-contact measurement from stereo thermal and visible sensors. International Journal of Affective Engineering 2015, 14, 9–17.
- Kyriakou et al. (2019) Kyriakou, K.; Resch, B.; Sagl, G.; Petutschnig, A.; Werner, C.; Niederseer, D.; Liedlgruber, M.; Wilhelm, F.H.; Osborne, T.; Pykett, J. Detecting moments of stress from measurements of wearable physiological sensors. Sensors 2019, 19, 3805.
- Lee et al. (2016) Lee, D.S.; Chong, T.W.; Lee, B.G. Stress events detection of driver by wearable glove system. IEEE Sensors Journal 2016, 17, 194–204.
- Chen et al. (2017) Chen, L.l.; Zhao, Y.; Ye, P.f.; Zhang, J.; Zou, J.z. Detecting driving stress in physiological signals based on multimodal feature analysis and kernel classifiers. Expert Systems with Applications 2017, 85, 279–291.
- Ghaderi et al. (2015) Ghaderi, A.; Frounchi, J.; Farnam, A. Machine learning-based signal processing using physiological signals for stress detection. In Proceedings of the 2015 22nd Iranian Conference on Biomedical Engineering (ICBME). IEEE, 2015, pp. 93–98.
- Gjoreski et al. (2016) Gjoreski, M.; Gjoreski, H.; Luštrek, M.; Gams, M. Continuous stress detection using a wrist device: in laboratory and real life. In Proceedings of the Proceedings of the 2016 ACM International Joint Conference on Pervasive and Ubiquitous Computing: Adjunct, 2016, pp. 1185–1193.
- Maier et al. (2014) Maier, E.; Reimer, U.; Laurenzi, E.; Ridinger, M.; Ulmer, T. A mobile solution for stress recognition and prevention. In Proceedings of the Proc. Int’l Conf. Health Informatics (HealthInf), 2014, pp. 428–433.
- Zubair et al. (2015) Zubair, M.; Yoon, C.; Kim, H.; Kim, J.; Kim, J. Smart wearable band for stress detection. In Proceedings of the 2015 5th International Conference on IT Convergence and Security (ICITCS). IEEE, 2015, pp. 1–4.
- de Santos Sierra et al. (2010) de Santos Sierra, A.; Avila, C.S.; Casanova, J.G.; del Pozo, G.B.; Vera, V.J. Two stress detection schemes based on physiological signals for real-time applications. In Proceedings of the 2010 Sixth International Conference on Intelligent Information Hiding and Multimedia Signal Processing. IEEE, 2010, pp. 364–367.
- Sandulescu et al. (2015) Sandulescu, V.; Andrews, S.; Ellis, D.; Bellotto, N.; Mozos, O.M. Stress detection using wearable physiological sensors. In Proceedings of the International Work-Conference on the Interplay Between Natural and Artificial Computation. Springer, 2015, pp. 526–532.
- Martinez et al. (2017) Martinez, R.; Irigoyen, E.; Arruti, A.; Martín, J.I.; Muguerza, J. A real-time stress classification system based on arousal analysis of the nervous system by an F-state machine. Computer methods and programs in biomedicine 2017, 148, 81–90.
- Aigrain et al. (2016) Aigrain, J.; Spodenkiewicz, M.; Dubuiss, S.; Detyniecki, M.; Cohen, D.; Chetouani, M. Multimodal stress detection from multiple assessments. IEEE Transactions on Affective Computing 2016, 9, 491–506.
- Baltacı and Gökçay (2014) Baltacı, S.; Gökçay, D. Role of pupil dilation and facial temperature features in stress detection. In Proceedings of the 2014 22nd Signal Processing and Communications Applications Conference (SIU). IEEE, 2014, pp. 1259–1262.
- Huang et al. (2016) Huang, M.X.; Li, J.; Ngai, G.; Leong, H.V. Stressclick: Sensing stress from gaze-click patterns. In Proceedings of the Proceedings of the 24th ACM international conference on Multimedia, 2016, pp. 1395–1404.
- Akhonda et al. (2014) Akhonda, M.A.B.S.; Islam, S.M.F.; Khan, A.S.; Ahmed, F.; Rahman, M.M. Stress detection of computer user in office like working environment using neural network. In Proceedings of the 2014 17th International Conference on Computer and Information Technology (ICCIT). IEEE, 2014, pp. 174–179.
- Muaremi et al. (2014) Muaremi, A.; Bexheti, A.; Gravenhorst, F.; Arnrich, B.; Tröster, G. Monitoring the impact of stress on the sleep patterns of pilgrims using wearable sensors. In Proceedings of the IEEE-EMBS international conference on biomedical and health informatics (BHI). IEEE, 2014, pp. 185–188.
- Xu et al. (2014) Xu, Q.; Nwe, T.L.; Guan, C. Cluster-based analysis for personalized stress evaluation using physiological signals. IEEE journal of biomedical and health informatics 2014, 19, 275–281.
- Sriramprakash et al. (2017) Sriramprakash, S.; Prasanna, V.D.; Murthy, O.R. Stress detection in working people. Procedia computer science 2017, 115, 359–366.
- Hosseini and Khalilzadeh (2010) Hosseini, S.A.; Khalilzadeh, M.A. Emotional stress recognition system using EEG and psychophysiological signals: Using new labelling process of EEG signals in emotional stress state. In Proceedings of the 2010 international conference on biomedical engineering and computer science. IEEE, 2010, pp. 1–6.
- Picard et al. (2001) Picard, R.W.; Vyzas, E.; Healey, J. Toward machine emotional intelligence: Analysis of affective physiological state. IEEE transactions on pattern analysis and machine intelligence 2001, 23, 1175–1191.
- Choi (2011) Choi, J. Minimally-invasive wearable sensors and data processing methods for mental stress detection; Texas A&M University, 2011.
- Betti et al. (2017) Betti, S.; Lova, R.M.; Rovini, E.; Acerbi, G.; Santarelli, L.; Cabiati, M.; Del Ry, S.; Cavallo, F. Evaluation of an integrated system of wearable physiological sensors for stress monitoring in working environments by using biological markers. IEEE Transactions on Biomedical Engineering 2017, 65, 1748–1758.
- Aimie-Salleh et al. (2018) Aimie-Salleh, N.; Malarvili, M.; Whitttaker, A.C. Stress Response Index for Adverse Childhood Experience Based on Fusion of Biomarkers. In Proceedings of the 2018 IEEE-EMBS Conference on Biomedical Engineering and Sciences (IECBES). IEEE, 2018, pp. 140–145.
- Vizer et al. (2009) Vizer, L.M.; Zhou, L.; Sears, A. Automated stress detection using keystroke and linguistic features: An exploratory study. International Journal of Human-Computer Studies 2009, 67, 870–886.
- Zhai and Barreto (2008) Zhai, J.; Barreto, A. Stress detection in computer users through non-invasive monitoring of physiological signals. Blood 2008, 5.
- Qi et al. (2023) Qi, P.; Chiaro, D.; Giampaolo, F.; Piccialli, F. A blockchain-based secure Internet of medical things framework for stress detection. Information Sciences 2023, 628, 377–390.
- Khan et al. (2022) Khan, H.A.; Nguyen, T.N.; Shafiq, G.; Mirza, J.; Javed, M.A. A Secure Wearable Framework for Stress Detection in Patients Affected by Communicable Diseases. IEEE Sensors Journal 2022, 23, 981–988.
- Rescio et al. (2023) Rescio, G.; Manni, A.; Caroppo, A.; Ciccarelli, M.; Papetti, A.; Leone, A. Ambient and wearable system for workers’ stress evaluation. Computers in Industry 2023, 148, 103905.
- Mohammadi et al. (2022) Mohammadi, A.; Fakharzadeh, M.; Baraeinejad, B. An integrated human stress detection sensor using supervised algorithms. IEEE Sensors Journal 2022, 22, 8216–8223.
- Seo et al. (2022) Seo, W.; Kim, N.; Park, C.; Park, S.M. Deep Learning Approach for Detecting Work-Related Stress Using Multimodal Signals. IEEE Sensors Journal 2022, 22, 11892–11902.
- Kuttala et al. (2023) Kuttala, R.; Subramanian, R.; Oruganti, V.R.M. Multimodal Hierarchical CNN Feature Fusion for Stress Detection. IEEE Access 2023.
- Nath and Thapliyal (2021) Nath, R.K.; Thapliyal, H. Smart wristband-based stress detection framework for older adults with cortisol as stress biomarker. IEEE Transactions on Consumer Electronics 2021, 67, 30–39.
- Orozco-Mora et al. (2022) Orozco-Mora, C.; Oceguera-Cuevas, D.; Fuentes-Aguilar, R.Q.; Hernández-Melgarejo, G. Stress Level Estimation Based on Physiological Signals for Virtual Reality Applications. IEEE Access 2022, 10, 68755–68767.
- Vaitheeshwari et al. (2022) Vaitheeshwari, R.; Yeh, S.C.; Wu, E.H.K.; Chen, J.Y.; Chung, C.R. Stress Recognition Based on Multiphysiological Data in High-Pressure Driving VR Scene. IEEE Sensors Journal 2022, 22, 19897–19907.
- Arsalan and Majid (2021) Arsalan, A.; Majid, M. Human stress classification during public speaking using physiological signals. Computers in Biology and Medicine 2021, 133, 104377.
- Mehmood et al. (2022) Mehmood, I.; Li, H.; Umer, W.; Arsalan, A.; Shakeel, M.S.; Anwer, S. Validity of facial features’ geometric measurements for real-time assessment of mental fatigue in construction equipment operators. Advanced Engineering Informatics 2022, 54, 101777.
- Liapis et al. (2015) Liapis, A.; Katsanos, C.; Sotiropoulos, D.; Xenos, M.; Karousos, N. Stress recognition in human-computer interaction using physiological and self-reported data: a study of gender differences. In Proceedings of the Proceedings of the 19th Panhellenic Conference on Informatics, 2015, pp. 323–328.
- Gottlieb (2013) Gottlieb, B.H. Coping with chronic stress; Springer Science & Business Media, 2013.
- Koelstra et al. (2011) Koelstra, S.; Muhl, C.; Soleymani, M.; Lee, J.S.; Yazdani, A.; Ebrahimi, T.; Pun, T.; Nijholt, A.; Patras, I. Deap: A database for emotion analysis; using physiological signals. IEEE transactions on affective computing 2011, 3, 18–31.