1Aryabhatta Research Institute of Observational Sciences (ARIES), Manora Peak, Nainital-263002, India.
\affilTwo2Department of Physics, Deen Dayal Upadhyaya Gorakhpur University, Gorakhpur-273009, India.
\affilThree3School of Studies in Physics and Astrophysics, Pt. Ravishankar Shukla University, Chattisgarh 492010, India.
\affilFour4Chennai Mathematical Institute, Siruseri, 603103 Tamilnadu, India.
\affilFive5Indian Institute of Space Science and Technology, Trivandrum 695 547, India.
GRB 210217A: A short or a long GRB?
Abstract
Gamma-ray bursts are traditionally classified as short and long bursts based on their value (the time interval during which an instrument observes to of gamma-ray/hard X-ray fluence). However, is dependent on the detector sensitivity and the energy range in which the instrument operates. As a result, different instruments provide different values of for a burst. GRB 210217A is detected with different duration by Swift and Fermi. It is classified as a long/soft GRB by Swift-BAT with a value of 3.76 sec. On the other hand, the sub-threshold detection by Fermi-GBM classified GRB 210217A as a short/hard burst with a duration of 1.024 sec. We present the multi-wavelength analysis of GRB 210217A (lying in the overlapping regime of long and short GRBs) to identify its actual class using multi-wavelength data. We utilized the -hardness ratio, -, and - distributions of the GRBs to find the probability of GRB 210217A being a short GRB. Further, we estimated the photometric redshift of the burst by fitting the joint XRT/UVOT SED and place the burst in the Amati plane. We found that GRB 210217A is an ambiguous burst showing properties of both short and long class of GRBs.
keywords:
gamma-ray burst: general, gamma-ray burst: individual: GRB 210217A, methods: data analysisdimple@aries.res.in
2021—
#### \volnum000 0000 \pgrange1– \lp11
1 Introduction
Gamma-ray bursts (GRBs) are the short and intense pulses of -rays, occurring randomly at a rate of 1 event per day. The bi-modality in distribution of GRBs is used to divide these energetic events into two classes: short and long bursts with a boundary at 2 sec (Kouveliotou et al., 1993). However, the value relies on the energy range in which the instrument operates and its trigger method. In general, bursts have a lower value of in higher energy channels (Qin & Chen, 2013; Fenimore et al., 1995). The value also depends on the sensitivity of the detector and background variations. Further, the observed depends on the redshift; the rest frame duration (/(1+)) will be lower than the observed. It is challenging to decide the class of the GRB without any redshift information. It is also observed that some GRBs with values favourable to long GRBs have afterglow and host properties similar to the short GRBs (Gal-Yam et al., 2006). On the other hand, other GRBs with less than 2 sec show properties identical to long GRBs (Antonelli et al., 2009; Ahumada et al., 2021).
Therefore, it is difficult to classify the GRBs based on alone, particularly for GRBs lying close to the boundary. It is also essential to look for other observational characteristics apart from their information that can distinguish the two classes.
Hardness ratio (HR), the fluence ratio in harder to softer energy bands, can be used to classify GRBs. Short GRBs are found to be harder with large values of HR compared to their long companions (Tavani, 1998; Fishman & Meegan, 1995). Furthermore, HR is found to be correlated with for the complete sample of GRBs. However, no correlation is noticed between the two for an individual class (Qin et al., 2000).
Another characteristic is the spectral lag (i.e., the delay in the arrival times of low-energy photons to high-energy photons) which can differentiate the two classes. Long GRBs have significant lags (up to a few seconds for some of them) in their light curves in different energy channels. On the other hand, no lag (nearly zero) is observed for short GRBs (Cheng et al., 1995; Yi et al., 2006; Kaneko et al., 2015).
The two classes can also be compared concerning their energetics () and luminosities (). Short GRBs have, on average, energies that are smaller than that of long bursts (Ghirlanda et al., 2009). They are located at two different places in - plane (Amati plane), following a correlation that is parallel to each other (Amati et al., 2002; Amati, 2006). Additionally, the host galaxy properties such as stellar population, star formation rate (SFR), morphology, offset, etc., are different for short and long bursts in general and can provide a clue about the burst progenitor system and hence the class of the GRB (Li et al., 2016).
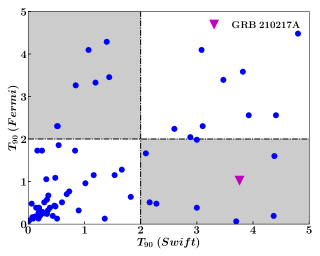
The sensitivity of detectors affects the duration timescales of the bursts. As a result, GRBs detected by Swift and Fermi have different values of duration reported. Figure 1 represents the values as measured by Swift (15-350 keV) and Fermi (50-300 keV). The bursts have different values of reported by Swift and Fermi. Most of them are lying in the same class, either short or long burst (first and third quadrant). There are 16 GRBs detected by Swift and Fermi between 2008 to February 2021, including GRB 210217A (second and fourth quadrant, the shaded grey regions), having different classification provided by two satellites.
GRB 210217A is one of the recent bursts lying at the boundary of short and long GRBs divide with different burst duration values reported by Swift and Fermi. GRB 210217A was detected by Swift-BAT (Simpson et al., 2021) and Fermi-GBM (Fletcher & Fermi-GBM Team, 2021). Swift Burst alert telescope (BAT) reported a of sec (15-350 keV), suggesting it to be a long GRB (Sakamoto et al., 2021). The sub-threshold detection by Fermi-GBM with a duration of 1.024 sec (25-294 keV) suggests that the burst might belong to the short population of GRBs111https://gcn.gsfc.nasa.gov/notices_gbm_sub/635297147.fermi. This burst was well within the observational capabilities of moderate-sized Indian telescopes. Therefore, we observed the optical afterglow of this burst with the 1.3m Devasthal Fast Optical Telescope (DFOT) and 3.6m Devasthal Optical Telescope (DOT) located in Aryabhatta Research Institute of Observational Sciences (ARIES), Nainital. The study of prompt and afterglow emission of a GRB provides a complete picture of the nature of the GRB.
We performed a detailed analysis to classify GRB 210217A. This paper presents the multi-wavelength analysis of GRB 210217A and discusses various methods for classification. Further, we estimated the burst’s redshift using joint fitting of the spectral energy distribution (SED) obtained from UVOT/XRT afterglow. In section 2, we describe the discovery and follow-up observations of GRB 210217A. The data acquisition and reduction procedures are explained in section 3. Section 4 presents the results obtained and a discussion on the possible classification of GRB 210217A. Finally, we summarise the conclusions of this work in Section 5. We used the Hubble parameter = 70 km , density parameters , and (Jarosik et al., 2011).
| Characteristics | GRB 210217A | Detector |
|---|---|---|
| (15-350 keV) | sec | Swift-BAT |
| (25-294 keV) | 1.024 | Fermi-GBM |
| HR | Swift-BAT | |
| (sec) | 0.512 | Swift-BAT |
| Spectral lag (ms) | 186 | Swift-BAT |
| Fermi-GBM | ||
| Redshift | Swift-XRT +UVOT | |
| () | ( | Swift-BAT |
| Energy range | |
|---|---|
| (keV) | (sec) |
| 15 – 350 | |
| 15 – 25 | |
| 25 – 50 | |
| 50 – 100 | |
| 100 – 350 |
2 GRB 210217A
BAT on-board NASA’s Swift space mission (Barthelmy et al., 2005) triggered GRB 210217A on 17th February 2021 at 23:25:42 UT and provided the location of the source with coordinates RA, and DEC = 06h 30m 26s, +68d 42’ 53” (J2000) respectively with an uncertainty of 3 arcmin (Simpson et al., 2021). The Swift X-Ray Telescope (XRT) observations 97.8 seconds after the BAT trigger located an uncatalogued X-ray source at RA, and Dec = 06h 30m 20.82s, +68d 43’ 29.9” (J2000) with an uncertainty of 3.7 arcseconds. Swift Ultra-Violet and Optical telescope (UVOT) observations at 103 seconds after the BAT trigger detected a transient in white and U filters.
Several ground-based optical/NIR telescopes started observing the field of GRB 210217A and reported the optical afterglow magnitudes222https://gcn.gsfc.nasa.gov/other/210217A.gcn3. Fermi-GBM did not trigger the event automatically (Fletcher & Fermi-GBM Team, 2021). Still, an automated, blind search for short GRBs (below the onboard triggering threshold) in Fermi-GBM identified a short GRB consistent with the Swift-BAT event in both time and location with a high significance value with a duration of 1.024 sec (Fletcher & Fermi-GBM Team, 2021).
We also carried out the observations of the optical afterglow of GRB 210217A with 1.3m DFOT located in ARIES at the earliest available opportunity (Kumar et al., 2021). Once the afterglow crosses the limit of 1.3m DFOT, we carried out deep observations with the 3.6m DOT (Dimple et al., 2021). The characteristics of the burst are presented in Table 1.
| t (days) | Filter | Magnitude | Telescope | Reference |
|---|---|---|---|---|
| 0.0021 | White | Swift-UVOT | This Work | |
| 2.2396 | White | Swift-UVOT | This Work | |
| 0.0048 | U | Swift-UVOT | This Work | |
| 0.75375 | R | 1.3m DFOT | This Work | |
| 0.8220 | I | 1.3m DFOT | This Work | |
| 1.7010 | r | 3.6m DOT | This Work | |
| 2.7401 | r | 3.6m DOT | This Work | |
| 0.17791 | R | KAIT | Zheng et al. (2021) | |
| 0.0100 | z | 2.0m Liverpool | Shrestha et al. (2021) | |
| 0.00120 | r | 2.0m Liverpool | Shrestha et al. (2021) | |
| 0.0080 | i | 2.0m Liverpool | Shrestha et al. (2021) |
3 Data Acquisition and Reduction
This section narrates the data acquisition and analysis from different space missions and ground-based telescopes as part of the present work. The Fermi-GBM data is not publicly available for GRB 210217A as this burst was detected below the onboard triggering threshold333 https://gcn.gsfc.nasa.gov/fermi_gbm_subthresh_archive.html. For the rest of the work we used the parameters provided by the Fermi-GBM team444 https://gcn.gsfc.nasa.gov/fermi_gbm_subthreshold.html,555https://gcn.gsfc.nasa.gov/notices_gbm_sub/635297147.fermi.
3.1 Swift-BAT
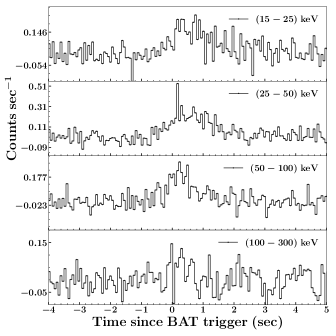
To extract the temporal and spectral properties of GRB 210217A in high energy bands, the raw data of Swift-BAT (Observation Id: 01033264000) is obtained from the online portal of Swift Archive666https://www.swift.ac.uk/swift_portal/. We reduced the data utilising the HEASOFT (version-6.25). The inbuilt pipelines batbinevt, bathotpix, and batmaskwtevt are used to create detector plane image (DPI) followed by removal of hot pixels and mask weighting. Later, the mask-weighted BAT light curves are extracted using batbinevt pipeline for different energy channels. The light curves in different energy channels are shown in Figure 2. Further, we estimated the duration of light curves in different energy channels and are tabulated in Table 2. The value in the energy range 15-350 keV is which is consistent with the value reported in Sakamoto et al. (2021).
To examine the spectral properties of the burst, we extracted the time-averaged BAT spectrum for the total duration of the burst starting from T0 to T0+0.489 sec (the start and end time of the pulse are identified using Bayesian binning of the light curve in the energy range 15-350 keV).
We used the batbinevt and batdrmgen pipelines to produce the spectrum and detector response matrix (DRM), respectively. The resultant spectrum is fitted with the power-law and the cutoff power-law using the Multi-Mission Maximum Likelihood framework (3ML) package (Vianello et al., 2015). Maximum likelihood estimation technique was used for choosing the best fit model. We got the maximum value for likelihood for a single power-law model with photon index () of 1.99 0.09. The fluence is in the 15-150 keV band, which is consistent with the value reported by (Sakamoto et al., 2021).
3.2 Swift-XRT & UVOT
We obtained the X-ray flux light curve data in the 0.3-10 keV energy band from Swift-XRT Burst Analyser repository777https://www.swift.ac.uk/ hosted by the University of Leicester (Evans et al., 2009). The flux light curve is then converted to flux density at 5 keV using the relations given by Gehrels et al. (2008) for further analysis.
| (1) |
where, and are lower and upper bounds of band pass in keV, is the energy in keV at which flux density is calculated, is the X-ray photon index. is the measured flux in erg cm-2 sec-1.
We downloaded the Swift-UVOT data from the online Swift data archive page888http://swift.gsfc.nasa.gov/docs/swift/archive/. We analyzed the UVOT data using standard pipeline uvotproduct of heasoft software version 6.25 with the latest calibration database. A source region of 5 arcsec and a background region of 25 arcsec aperture radius are extracted for the photometric analysis of the burst. We detected a source in white and U filter. Table 3 shows the magnitudes of the source in these filters.
3.3 1.3m DFOT and 3.6m DOT
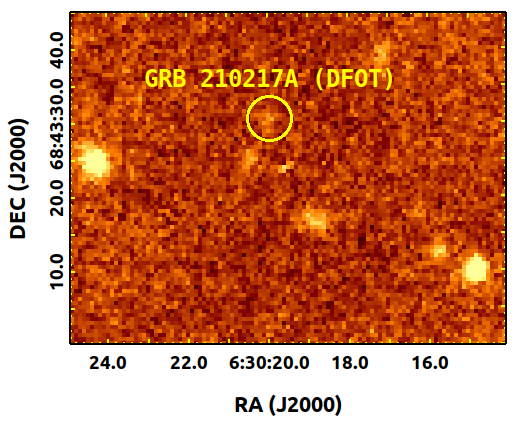
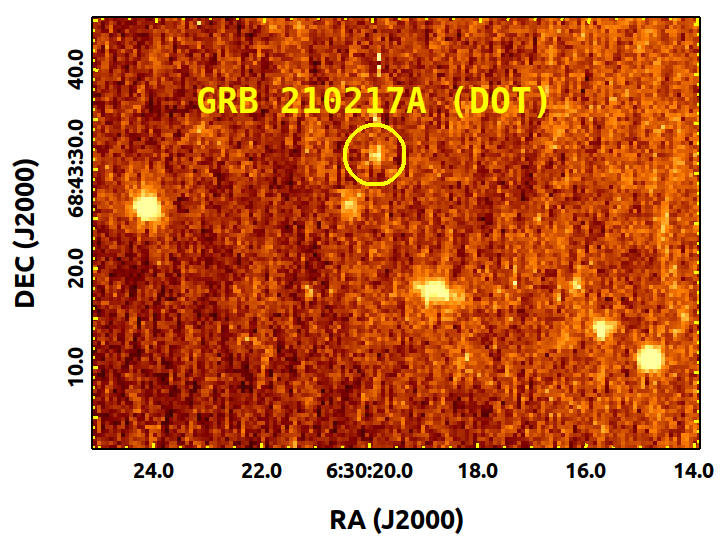
We started observations with 1.3 DFOT on 2021-02-18 at 17:31:22 UT located at Devasthal observatory of ARIES, India, for the follow-up observations of the optical afterglow of GRB 210217A. We observed a set of images with an exposure of 120s each in the Bessel R filter and a set of 20 images (120s exposure) in the Bessel I filter. We detected the optical afterglow of GRB 210217A in the stacked frames within the Swift XRT error circle (left panel of Figure 3). Later, for deep observations, we observed the field with Aries Devasthal Faint Object Spectrograph and Camera (ADFOSC) mounted on the 3.6m DOT around days after the burst. We took four consecutive images in r-band with an exposure of 900 sec each. We corrected the science images acquired from these telescopes for bias, flat and cosmic rays using Astropy module of Python.
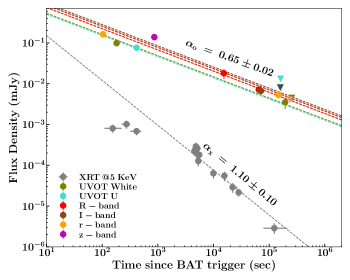
We stacked the images to enhance the signal-to-noise ratio. The source is visible in stacked image (Dimple et al., 2021). The finding chart for the same is shown in the right panel of Figure 3. We used the DAOPHOT package to perform point spread function (PSF) photometry which was calibrated against the Panstarrs catalog resulting in apparent magnitudes listed in Table 3. The magnitudes are converted to flux density after correcting for galactic extinction. Figure 4 shows the multi-band light curve of GRB 210217A constructed using our data and those reported in GCN circulars.
Further, we fitted the X-ray and optical R band light curves of GRB 210217A using a single power law of the form , where t corresponds to time, and is the decay index. Due to the limited number of data points in other optical bands, it is not possible to fit these. Therefore, We overplotted the light curves in other bands using the R band decay index. The light curves with power laws are shown in Figure 4.
4 Results and Discussions
This section presents the results obtained from the multi-band analysis and possible classification scenario of GRB 210217A.
4.1 Photometric Redshift
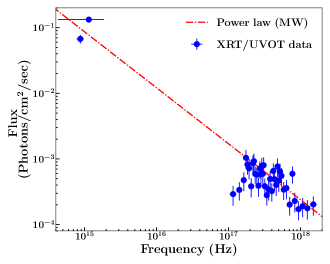
To estimate the photometric redshift of GRB 210217A, we analyzed the joint XRT and UVOT SED in the time interval of 100-200 sec. We didn’t observe any spectral evolution during this time interval. Using the XRT data and UVOT magnitudes, we created the SED following the methodology described in Chand et al. (2020); Gupta et al. (2021). We fitted the SED using power-law and broken power-law models using XSPEC (Arnaud, 1996). The Galactic and intrinsic absorber components (phabs and zphabs) are also included from XSPEC models . The Galactic absorption is fixed to (Willingale et al., 2013). We further included two dust components using the XSPEC model zdust, one at redshift = 0 for galactic dust component, and the other for the intrinsic dust component with varying redshift which provided the redshift information. The Galactic reddening is fixed at 0.0847 (E(B-V)) conforming to the map of Schlafly & Finkbeiner (2011). The SED is fitted with Milky Way, Large and Small Magellanic Clouds (MW, LMC, and SMC) extinction laws (Pei, 1992) at the redshift of the burst. Although all these models well explain the SED, a minimum value is obtained for Milky way extinction law with a power-law model. The value of the spectral index is 1.85 0.13, and that of photometric redshift is for GRB 210217A. The SED is shown in Figure 5.
4.2 Hardness Ratio and Peak Energy
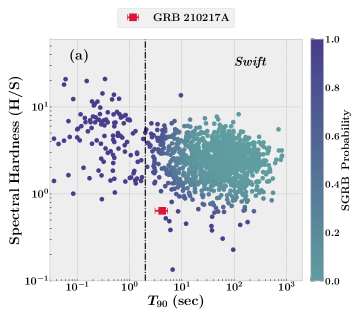
We estimated the HR using fluence ratio in two different energy channels: 15-25 keV and 50-100 keV energy bands of Swift-BAT and used it for the classification of GRB 210217A. The HR during is found to be 0.64 0.005. We collected the sample of GRBs from Swift-BAT catalog999https://swift.gsfc.nasa.gov/results/batgrbcat/summary_cflux/summary_T100/summary_pow_energy_fluence.txt and estimated the hardness ratio using the fluence in the same energy window as used for GRB 210217A. We fitted this sample with the Bayesian Gaussian mixture model (BGMM), which is a machine learning algorithm supported by scikit-learn (Pedregosa et al., 2011). Using this algorithm, we estimated the probability of GRB 210217A being a short GRB as 98.2%. The probabilities of the whole sample being a short GRB along with GRB 210217A are shown in Figure 6 (a).
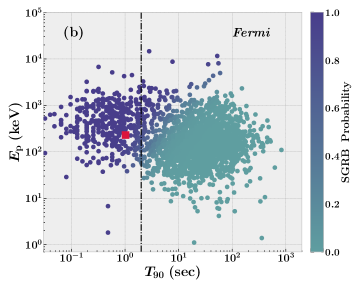
As Swift BAT has narrow spectral coverage, we could not determine using spectral fitting. Therefore, we used the , peak energy and values provided by Fermi-GBM along with the - values from the Fermi-GBM catalog to identify the class of GRB 210217A. We again fitted the distribution with BGMM and found a probability of 96% for GRB 210217A being a short GRB. The probability map is shown in Figure 6 (b).
4.3 Minimum variability time scale
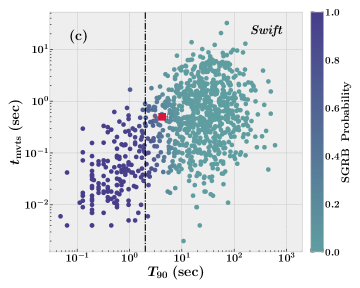
High energy light curves of GRBs are highly variable and can be explained with the GRB central engine resulting from internal shocks. Hence, minimum variability time scale (MacLachlan et al., 2013, ) gives an idea about the central engine, the source emission radius (), and the minimum Lorentz factor (Sonbas et al., 2015, ) of GRBs. In general, the value for long bursts is larger with an average value of 200 ms than their short counterparts having a mean value of 10 ms, indicating that short GRBs have a more compact central engine (MacLachlan et al., 2012, 2013). We measured the for GRB 210217A using the method described in Golkhou et al. (2015). The estimated value of is 0.512 sec for GRB 210217A, which we further used for its classification. We collected values for short and long GRB samples from Golkhou et al. (2015). Using BGMM, we found the probability of GRB 210217A being a short GRB equal to 28% (Figure 6 (c)).
4.4 Spectral lag
We calculated the spectral lag using bat light curves in energy channels; 15-25 keV and 50-100 keV. We estimated the using the cross-correlation function (CCF) and uncertainties in the CCF following the method described in Bernardini et al. (2015). We fitted the CCF with an asymmetric Gaussian function using emcee (Foreman-Mackey et al., 2013) to find its global maximum, which represents the lag in two light curves. We found a positive lag 86 ms for the burst. The average value of lag for short and long GRBs are and ms, respectively (Bernardini et al., 2015). The value is lying more close to the mean value of short GRBs within the errorbar. With the intermediate value of spectral lag lying between the mean value of two classes, it is hard to classify the burst.
4.5 Amati correlation
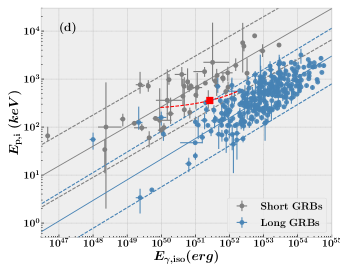
We also used the well-known correlation between the isotropic equivalent energy emitted in the high energy regime, and (the energy at which is maximum) to classify GRB 210217A (Amati et al., 2002; Amati, 2006; Minaev & Pozanenko, 2020). A power-law well fits this correlation with an index of ; however, the correlation regions are well separated for different classes (Minaev & Pozanenko, 2020).
For the redshift range (0.15-1.45) obtained from SED (section 4.1), we estimated the using the following equation 2
| (2) |
where, is the bolometric correction factor, is the luminosity distance and is the fluence (erg ). For Swift-BAT energy range (15-150 keV) we used = 5 (Fong et al., 2015) and the fluence value calculated in section 3.1. We also estimated the (peak energy in the source frame) for the estimated redshift range. As Swift-BAT covers only a small energy range, we used the and burst duration as reported by Fermi-GBM team (Fletcher & Fermi-GBM Team, 2021). The red dashed line in the Figure 6 (d) shows the - for the redshift range of GRB 210217A. GRB 210217A lies in the region in between long and short GRBs.
5 Summary
We report a detailed analysis of GRB 210217A using publicly available multi-wavelength observations, including our observations from our ARIES telescopes. We try to find the true class of GRB 210217A using various methods described in the literature. We calculated the photometric redshift using Swift-XRT/UVOT data. Using this estimated redshift, we calculated the isotropic equivalent energy and peak energy in the source frame. GRB 210217A lies at the boundary between short and long class in the Amati plane.
We also calculated the HR, minimum variability timescale, spectral lag and fitted the -HR, -Ep, -mvts distribution using BGMM. We found a probability of GRB 210217A being a short GRB equal to 98.2%, 96%, and 28% in these cases, respectively. It is hard to conclude if GRB 210217A belongs to the long or the short class as some of the properties belong to long GRBs and others to short.
The host studies can clarify the true class of this burst. The fact that two categories have different progenitors, they are originated in different kinds of host galaxies. Long GRBs are located in the star-forming young population of galaxies; the short GRBs belongs to the old population of galaxies (Li et al., 2016). Long GRBs are generally located in bright star-forming regions with minimal offsets from the centre of the host galaxy on a galactic scale. In contrast, due to significant merger scale times, short GRBs have large offsets from the centre of their galaxies (Bloom et al., 2002; Fong et al., 2013). The host observations are not available for GRB 210217A. However, the host observations can give a clue about the class of GRB 210217A.
Acknowledgements
KM, RG, and SBP acknowledge BRICS grant DST/IMRCD/BRICS/PilotCall1/ProFCheap/2017(G) for the financial support. KGA is partially supported by the Swarnajayanti Fellowship Grant No.DST/SJF/PSA-01/2017-18, MATRICS grant MTR/2020/000177 of SERB, and a grant from the Infosys Foundation. This research is based on observations obtained at the 3.6m Devasthal Optical Telescope (DOT) during observing cycles DOT-2021-C1, a National Facility runs and managed by Aryabhatta Research Institute Observational Sciences (ARIES), an autonomous Institute under the Department of Science and Technology, Government of India. This research has used data obtained from the High Energy Astrophysics Science Archive Research Center (HEASARC) and the Leicester Database and Archive Service (LEDAS), provided by NASA’s Goddard Space Flight Flight Flight Center and the Department of Physics and Astronomy, Leicester University, UK, respectively.
References
- Ahumada et al. (2021) Ahumada, T., Singer, L. P., Anand, S., et al. 2021, Nature Astronomy. doi:10.1038/s41550-021-01428-7
- Amati et al. (2002) Amati, L., Frontera, F., Tavani, M., et al. 2002, A&A, 390, 81. doi:10.1051/0004-6361:20020722
- Amati (2006) Amati, L. 2006, MNRAS, 372, 233. doi:10.1111/j.1365-2966.2006.10840.x
- Antonelli et al. (2009) Antonelli, L. A., D’Avanzo, P., Perna, R., et al. 2009, A&A, 507, L45. doi:10.1051/0004-6361/200913062
- Arnaud (1996) Arnaud, K. A. 1996, Astronomical Data Analysis Software and Systems V, 101, 17
- Barthelmy et al. (2005) Barthelmy, S. D., Barbier, L. M., Cummings, J. R., et al. 2005, Space Sci. Rev., 120, 143. doi:10.1007/s11214-005-5096-3
- Bernardini et al. (2015) Bernardini, M. G., Ghirlanda, G., Campana, S., et al. 2015, MNRAS, 446, 1129. doi:10.1093/mnras/stu2153
- Bloom et al. (2002) Bloom, J. S., Kulkarni, S. R., & Djorgovski, S. G. 2002, AJ, 123, 1111. doi:10.1086/338893
- Breeveld et al. (2011) Breeveld, A. A., Landsman, W., Holland, S. T., et al. 2011, Gamma Ray Bursts 2010, 1358, 373. doi:10.1063/1.3621807
- Chand et al. (2020) Chand, V., Banerjee, A., Gupta, R., et al. 2020, ApJ, 898, 42. doi:10.3847/1538-4357/ab9606
- Cheng et al. (1995) Cheng, L. X., Ma, Y. Q., Cheng, K. S., et al. 1995, A&A, 300, 746
- Dimple et al. (2021) Dimple, Misra, K., Ghosh, A., et al. 2021, GRB Coordinates Network, Circular Service, No. 29591, 29591
- Evans et al. (2009) Evans, P. A., Beardmore, A. P., Page, K. L., et al. 2009, MNRAS, 397, 1177. doi:10.1111/j.1365-2966.2009.14913.x
- Fenimore et al. (1995) Fenimore, E. E., in ’t Zand, J. J. M., Norris, J. P., et al. 1995, ApJ, 448, L101. doi:10.1086/309603
- Fishman & Meegan (1995) Fishman, G. J. & Meegan, C. A. 1995, ARAA, 33, 415. doi:10.1146/annurev.aa.33.090195.002215
- Fletcher & Fermi-GBM Team (2021) Fletcher, C. & Fermi-GBM Team 2021, GRB Coordinates Network, Circular Service, No. 29536, 29536
- Fong et al. (2013) Fong, W., Berger, E. and Chornock, R.et al. 2013, ApJ, 769, 1.
- Fong et al. (2015) Fong, W. and Berger, E. and Margutti, R. et al. 2015, ApJ, 102. doi:10.1088/0004-637x/815/2/102
- Foreman-Mackey et al. (2013) Foreman-Mackey, D., Hogg, D. W., Lang, D., et al. 2013, pasp, 125, 306. doi:10.1086/670067
- Gal-Yam et al. (2006) Gal-Yam, A., Fox, D. B., Price, P. A., et al. 2006, Nature, 444, 1053. doi:10.1038/nature05373
- Gehrels et al. (2008) Gehrels, N., Barthelmy, S. D. and Burrows, D. N. et al. 2008, ApJ, 689, 2. doi: 10.1086/592766.
- Ghirlanda et al. (2009) Ghirlanda, G., Nava, L., Ghisellini, G., et al. 2009, A&A, 496, 585. doi:10.1051/0004-6361/200811209
- Goldstein et al. (2017) Goldstein, A., Veres, P., Burns, E., et al. 2017, ApJ, 848, L14. doi:10.3847/2041-8213/aa8f41
- Golkhou et al. (2015) Golkhou, V. Z., Butler, N. R., & Littlejohns, O. M. 2015, ApJ, 811, 93. doi:10.1088/0004-637X/811/2/93
- Gupta et al. (2021) Gupta, R., Oates, S. R., Pandey, S. B., et al. 2021, MNRAS, 505, 4086. doi:10.1093/mnras/stab1573
- Jarosik et al. (2011) Jarosik, N., Bennett, C. L., Dunkley, J., et al. 2011, ApJS, 192, 14. doi:10.1088/0067-0049/192/2/14
- Kaneko et al. (2015) Kaneko, Y., Bostancı, Z. F., Göğüş, E., et al. 2015, MNRAS, 452, 824. doi:10.1093/mnras/stv1286
- Kouveliotou et al. (1993) Kouveliotou, C., Meegan, C. A., Fishman, G. J., et al. 1993, ApJ, 413, L101. doi:10.1086/186969
- Qin & Chen (2013) Qin, Y.-P. & Chen, Z.-F. 2013, MNRAS, 430, 163. doi:10.1093/mnras/sts547
- Kumar et al. (2021) Kumar, A., Gupta, R., Ghosh, A., et al. 2021, GRB Coordinates Network, Circular Service, No. 29539, 29539
- Li et al. (2016) Li, Y., Zhang, B., & Lü, H.-J. 2016, ApJS, 227, 7. doi:10.3847/0067-0049/227/1/7
- MacLachlan et al. (2012) MacLachlan, G. A., Shenoy, A., Sonbas, E. et al. 2012, MNRAS, 425, L32-L35. doi: 10.1111/j.1745-3933.2012.01295.x
- MacLachlan et al. (2013) MacLachlan, G. A., Shenoy, A., Sonbas, E., et al. 2013, MNRAS, 432, 857. doi:10.1093/mnras/stt241
- Minaev & Pozanenko (2020) Minaev, P. Y. & Pozanenko, A. S. 2020, MNRAS, 492, 1919. doi:10.1093/mnras/stz3611
- Minaev & Pozanenko (2020) Minaev, P. Y. & Pozanenko, A. S. 2020, Astronomy Letters, 46, 573. doi:10.1134/S1063773720090042
- Norris (2002) Norris, J. P. 2002, ApJ, 579, 386. doi:10.1086/342747
- Pedregosa et al. (2011) Pedregosa, F. and Varoquaux, G. et al. 2011, JMLR, 12, 2825–2830.
- Pei (1992) Pei, Y. C. 1992, ApJ, 395, 130. doi:10.1086/171637
- Piran (1999) Piran, T. 1999, Phys. Rep., 314, 575. doi:10.1016/S0370-1573(98)00127-6
- Piran (2004) Piran, T. 2004, Reviews of Modern Physics, 76, 1143. doi:10.1103/RevModPhys.76.1143
- Qin et al. (2000) Qin, Y.-P., Xie, G.-Z., Xue, S.-J., et al. 2000, PASJ, 52, 759. doi:10.1093/pasj/52.5.759
- Sakamoto et al. (2021) Sakamoto, T., Barthelmy, S. D., Cummings, J. R., et al. 2021, GRB Coordinates Network, Circular Service, No. 29534, 29534
- Sari et al. (1998) Sari, R., Piran, T., & Narayan, R. 1998, ApJ, 497, L17. doi:10.1086/311269
- Schlafly & Finkbeiner (2011) Schlafly, E. F. & Finkbeiner, D. P. 2011, ApJ, 737, 103. doi:10.1088/0004-637X/737/2/103
- Shrestha et al. (2021) Shrestha, M., Smith, R., Melandri, A., et al. 2021, GRB Coordinates Network, Circular Service, No. 29535, 29535
- Simpson et al. (2021) Simpson, K. K., Gropp, J. D., Kennea, J. A., et al. 2021, GRB Coordinates Network, Circular Service, No. 29521, 29521
- Sonbas et al. (2015) Sonbas, E., MacLachlan, G. A., Dhuga, K. S., et al. 2015, ApJ, 805, 86. doi:10.1088/0004-637X/805/2/86
- Tavani (1998) Tavani, M. 1998, ApJ, 497, L21. doi:10.1086/311276
- Vianello et al. (2015) Vianello, G., Lauer, R. J., Younk, P., et al. 2015, arXiv:1507.08343
- Willingale et al. (2013) Willingale, R., Starling, R. L. C. and Beardmore, A. P., et al. 2013, MNRAS, 431, 394-404. doi: 10.1093/mnras/stt175
- Yi et al. (2006) Yi, T., Liang, E., Qin, Y., et al. 2006, MNRAS, 367, 1751. doi:10.1111/j.1365-2966.2006.10083.x
- Zheng et al. (2021) Zheng, W., Filippenko, A. V., & KAIT GRB Team 2021, GRB Coordinates Network, Circular Service, No. 29533, 29533
6 Appendix
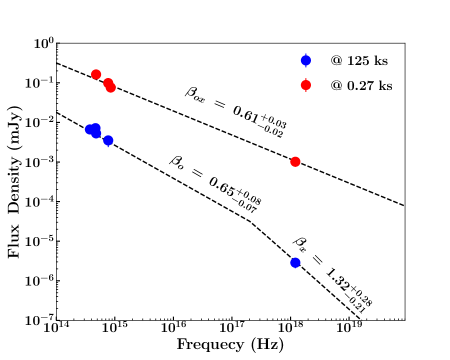
6.1 Afterglow Properties
| Time interval (s) |
|
||||
|---|---|---|---|---|---|
| 0.5-5 | 0.61 | 0.89 |
|
||
| 6.5-19.3 | 0.65 | 1.32 |
|
The afterglow of the GRB can be well explained by the synchrotron fireball model (Piran, 1999). The spectra, as well as the light curves, consist of a combination of power-law and broken power-law characterized by electron distribution index (Piran, 2004; Sari et al., 1998). We used the spectral and temporal indices to constrain and the break frequencies using well-known closure relations (Sari et al., 1998). For this purpose, we fitted the X-ray and optical light curves/spectra at different epochs with single and broken power-law models. Both X-ray and optical light curves are well explained with a single power with indices value of and , respectively. The values of spectral indices at different epochs are given in Table 4. At around 0.3 ks, the spectral index is almost the same for optical and X-ray within the errorbar, suggesting no cooling break between X-ray to optical data. However, we found that the X-ray spectral index is almost two times the optical index at later epochs, indicating some break. So, we further created the spectral energy distributions using optical and X-ray data at two epochs centred at ks and ks. We fitted the SEDs with power-law and broken power-law models. The SED at the early epoch is best fitted with a single power-law with an index of . However, the SED at the later epoch is best fitted with a broken power-law with indices (pre-break) and (post-break) and a break at Hz, which we identify as a cooling break. The best-fitted SEDs are shown in Figure 7.