Statistical Properties of the Population of the Galactic Center Filaments:
The Spectral Index and Equipartition Magnetic Field
Abstract
We present high-pass filtered continuum images of the inner of the Galactic center at 20 cm with resolution. These mosaic images are taken with MeerKAT and reveal a large number of narrow filaments, roughly an order of magnitude increase in their numbers compared to past measurements. For the first time, we carry out population studies of the spectral index and magnetic field of the entire region. The mean spectral indices of the filaments are steeper than supernova remnants (SNRs) (-0.62) with a value of . The variation in is much larger than for the SNRs, suggesting that these characteristics have a different origin. A large-scale cosmic-ray driven wind has recently been proposed to explain the origin of filaments and the large-scale 430 pc bipolar radio and X-ray structure. This favors the possibility that the large-scale bipolar radio/X-ray structure is produced by past activity of Sgr A* rather than coordinated burst of supernovae. A trend of steeper indices is also noted with increasing distance from the Galactic plane. This could be explained either by synchrotron cooling or weak shocks accelerating cosmic-ray particles in the context of the cosmic-ray driven wind. The mean magnetic field strengths along the filaments ranges from to 400 G depending on the assumed ratio of cosmic-ray protons to electrons. Given that there is a high cosmic ray pressure in the Galactic center, the large equipartition magnetic field implies that the magnetic filed is weak in most of the interstellar volume of the Galactic center.
1 Introduction
More than 35 years have passed since the discovery of the magnetized radio filaments associated with the Galactic center Radio Arc near (Yusef-Zadeh, Morris & Chance, 1984). These observations showed linear, magnetized features running mainly perpendicular to the Galactic plane. Their morphology was unique and different than shell-like or jet-like nonthermal radio continuum sources that had been observed. This was the first indication that the nucleus of our Galaxy harbors energetic activity that produces relativistic particles along straight filaments with no obvious source of acceleration. Dozens of nonthermal radio filaments with similar characteristics to the prototype filaments in the Radio Arc have been discovered in the intervening years indicating narrow synchrotron structures and are confirmed by polarization measurements (Liszt, 1985; Yusef-Zadeh et al., 1986; Gray, et al., 1991; Haynes, et al., 1992; Staguhn, et al., 1998; Lang et al., 1999; Lang, Morris & Echevarria, 1999; LaRosa, Lazio & Kassim, 2001; LaRosa, et al., 2004; Yusef-Zadeh et al., 2004; Nord et al., 2004; Law, Yusef-Zadeh & Cotton, 2008; Pound & Yusef-Zadeh, 2018; Staguhn et al., 2019; Arendt et al., 2019).
Past radio continuum surveys have generally focused on the morphology and characteristics of individual filaments. Spectral index and polarization characteristics of limited number of filaments have been studied (Inoue, et al., 1984; Yusef-Zadeh et al., 1986; Yusef-Zadeh & Morris, 1987; Gray, et al., 1995; Tsuboi, et al., 1995; Yusef-Zadeh, Wardle & Parastaran, 1997; Lang et al., 1999; Lang, Morris & Echevarria, 1999; Wang, Lu, & Lang, 2002; Law, Yusef-Zadeh & Cotton, 2008; Paré et al., 2019). The spectral indices of a dozen filaments indicate a wide range of values between +0.2 and -1.3 (Law, Yusef-Zadeh & Cotton, 2008). Given the evidence for an abundance of clusters of filaments throughout the Galactic center (Heywood et al. 2019), we carried out a study that statistically characterizes the properties of the population of filaments based on data presented in Heywood et al. (2022, in press). Unlike previous studies that have focused on individual filaments with the exception of survey works by Law, Yusef-Zadeh & Cotton (2008); Nord et al. (2004), here we determine the distribution of the spectral index and the equipartition magnetic field of the entire population of radio filaments using 1.28 GHz in-band analysis of filtered data. A more detailed account of geometrical properties of the filaments such as position, length, position angle, and curvature, as well as the median brightness of each filament are given elsewhere (Yusef-Zadeh et al. 2022, in preparation).
2 Data Reduction
Details of the MeerKAT observations can be found in Heywood et al. (2022, in press). Here we briefly describe the observations and the data processing. The mosaic is constructed from 20 MeerKAT pointings of 7.2 hours each (excluding calibration scans) for a total of 144 hours on-source. The L-band (8561712 MHz) system was used, with the correlator configured to deliver 4,096 frequency channels, which were averaged by a factor of 4 prior to processing. The 1.28 GHz mosaic covers the inner 3.5∘ 2.5∘ ( ) of the Galactic center, with some aggressive tapering of the data delivering an angular resolution of 4′′, with a map pixel extent of 1.1′′. The data were also imaged in 16 sub-bands, with Gaussian tapering applied to the visibilities in order to try to match the angular resolution across the band. An inner cut to remove spacings shorter than 164 wavelengths was also applied when imaging the sub-bands, in order to prevent the lower frequencies detecting large angular-scale structures that are invisible to the interferometers at higher frequencies. The 320 individual images (16 sub-bands times 20 pointings) were visually examined, with images that were significantly affected by radio frequency interference being discarded, resulting in 269 images in total. Prior to production of a mosaicked cube, we convolved the model images with a circular 8′′ Gaussian restoring beam, and summed the result with the residual images convolved with an appropriate homogenization kernel. A spectral index mosaic was then produced by fitting for the slope of the log-frequency, log-brightness spectrum for every sight line through the mosaicked cube. To ensure we are producing robust spectral index values we enforce the criterion that more than 8 frequency bands must be present for a fit to be performed, as well as masking the resulting spectral index mosaic in regions where the total intensity brightness was less than 1 mJy beam-1. Lastly, VLA images at 20cm based on two pointings, centered on Sgr A* and Sgr C G359.5+0.0, were used to make astrometric corrections, as discussed in detail in Heywood et al. (2022).
2.1 High-pass Filtering
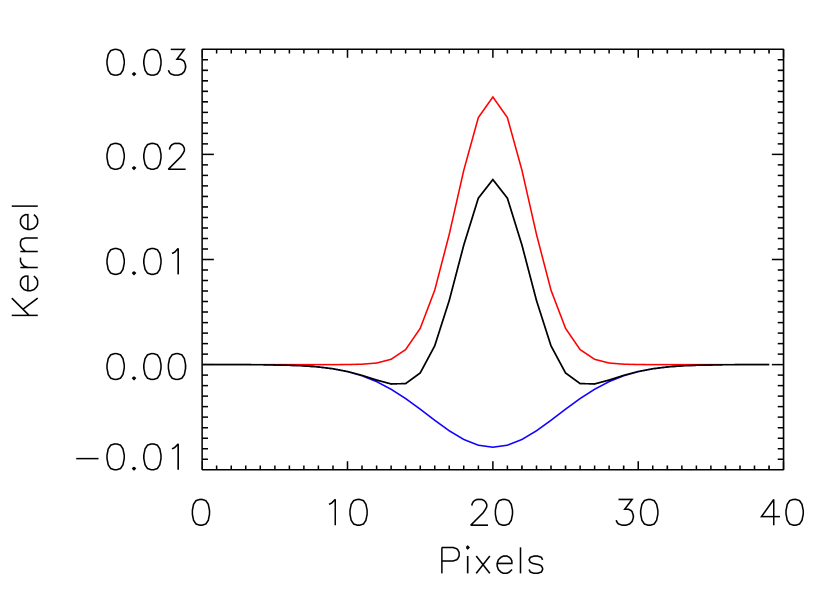
One of the challenging issues in high dynamic range radio imaging of the Galactic center is the non-uniform background on a wide range of angular sizes across the large-scale mosaic image. This creates difficulties in characterizing the properties of linear filaments in a standardized manner, in particular measuring the spectral index along the length of long filaments. The angular scales and amplitude variations of the background make it important to subtract it before measuring brightnesses and spectral indices of the filaments. However, the general complexity and size of the field make it impractical to select and subtract backgrounds in a means that involves user defined selection of background. To enhance the visibility of the filaments, the mosaic image is filtered using a difference of Gaussians to smooth noise and remove large scale backgrounds. The original images are convolved with large and small Gaussian beams before they were subtracted from each other. This is essentially a spatial frequency filtering of the image, which is commonly used as an edge-enhancement technique. The process was implemented as a single convolution using the kernel shown in Figure 1. The narrower, smoothing Gaussian function (red curve in Fig. 1) has pixels with pixel size of 1.1′′. The wider, background-subtracting Gaussian function (inverted blue curve in Fig. 1) has pixels. These values were subjectively determined as ones that helped highlight the filamentary features in the image as well as their spectral index distribution. Point sources in the final filtered image have FWHM . Together the two Gaussians form the black kernel in Figure 1, which was convolved with the original image. The units of the resulting map are still reported in Jy beam-1, where the beam area is that of the original beam. The process reduces the numerical value of the brightness in filament pixels by a factor of 0.13, with large variations due to the effect of the background removal. This factor is not applied to the filtered image intensities and does not effect the calculation of spectral indices, but it is applied in estimating magnetic field strengths (Section 3.2). This filtering is applied not only to the mosaic image but also to the cube of 16 frequency channels before the spectral index image is constructed following the prescription that is described in the previous section.
3 Results
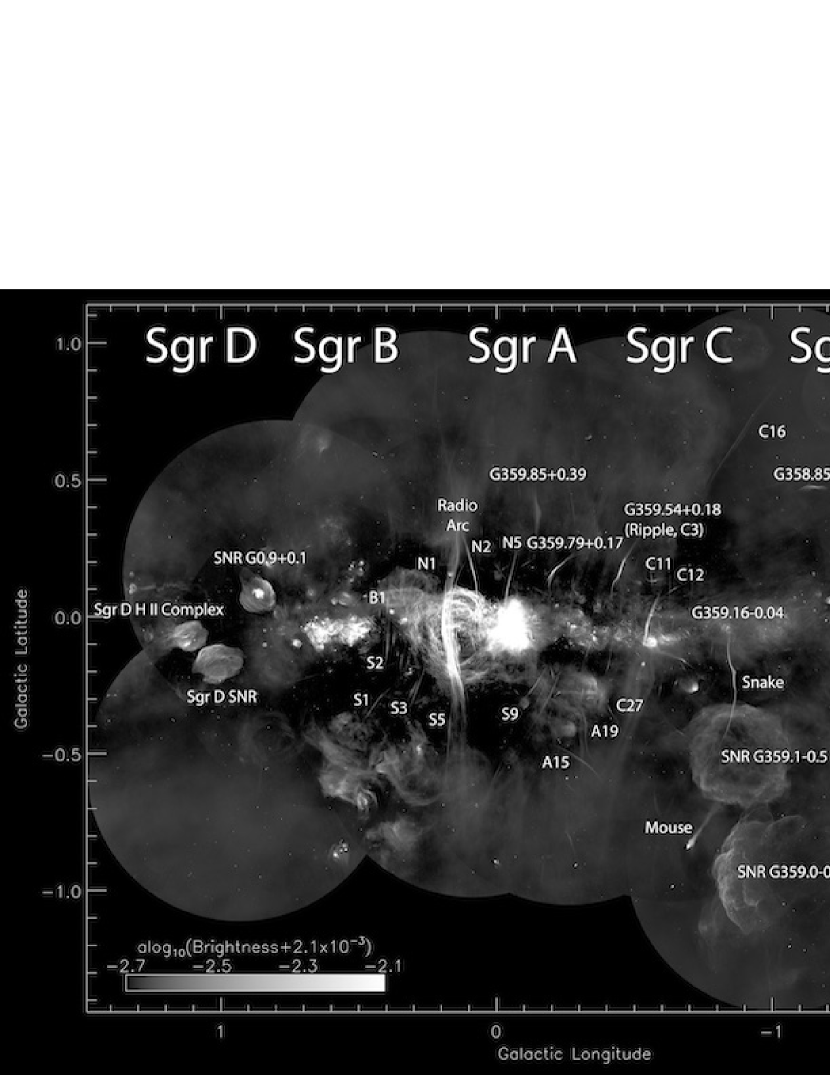
For general orientation, Figure 2a shows the original mosaic image at a resolution of 4 with prominent features (Sgr A to Sgr E) labeled. A number of previously studied individual filaments, HII regions, SNRs, and other well-known radio sources such as the Mouse toward this region have also been labeled (see Yusef-Zadeh & Bally (1987); LaRosa, Lazio & Kassim (2001); Yusef-Zadeh et al. (2004); Nord et al. (2004); Law, Yusef-Zadeh & Cotton (2008) and references therein). Figure 2b shows the corresponding filtered image where spatially varying diffuse background emission has been subtracted, leaving a background with a standard deviation of Jy beam-1 across the roughly 60% source-free portions of the field. For this reason, numerous fainter filaments are uncovered and stand out in the filtered image. The identification of faint features is more difficult in the unfiltered image because of the contamination by diffuse and varying background emission. However, to confirm the reality of faint filaments in the filtered image, we compared and found their counterparts in the unfiltered image. There are a large number of twisted short “spaghetti-like” features noted along the Galactic plane. These are associated mainly with HII regions and SNRs and have not been used in the study of filaments having different morphology, lengths, and distributions away from the Galactic plane.
The filaments appear to be pervasive throughout this region. Given the abundance of new radio filaments in a relatively small volume, it is difficult to manually localize the individual filaments. Results presented here are independent of the identification and properties of individual filaments. However, we have used filtered images to automatically construct a catalog of individual filaments with their characteristics which will be published elsewhere.
3.1 Spectral Index Distribution
Figure 3a shows the spectral index image of the entire filtered image whereas Figure 3b selects filaments that are longer than 132′′. These images show three distinct classes of objects with different spectral indices. There are HII regions showing flat spectra between –0.2 to –0.3 (yellow to red) such as the Sgr B complex, the Arches, and diffuse extended emission along the Galactic plane. SNRs such as the Sgr A East SNR G0.0+0.0, SNR G359.1-0.5, SNR G359.0-0.9, SNR 0.33+0.04, SNR G0.9+0.1 and Sgr D SNR (e.g., Green, 1988; Kassim & Frail, 1996), have a typical spectral index to (green to blue). Lastly, there are nonthermal radio filaments that have broad spectral index distribution as well as the steepest spectral index that can readily be discerned at high latitudes (green to blue) with typical . There are exceptions such as the flat spectral index of the Radio Arc with ranging between to . The flat spectrum of the Radio Arc is consistent with numerous past measurements (Anantharamaiah et al., 1991; Sofue, Murata, & Reich, 1992; Pohl, Reich, & Schlickeiser, 1992; Reich et al., 2000; Wang, Lu, & Lang, 2002; Nord et al., 2004; Law, Yusef-Zadeh & Cotton, 2008; Ludovici et al., 2016; Pound & Yusef-Zadeh, 2018; Staguhn et al., 2019).
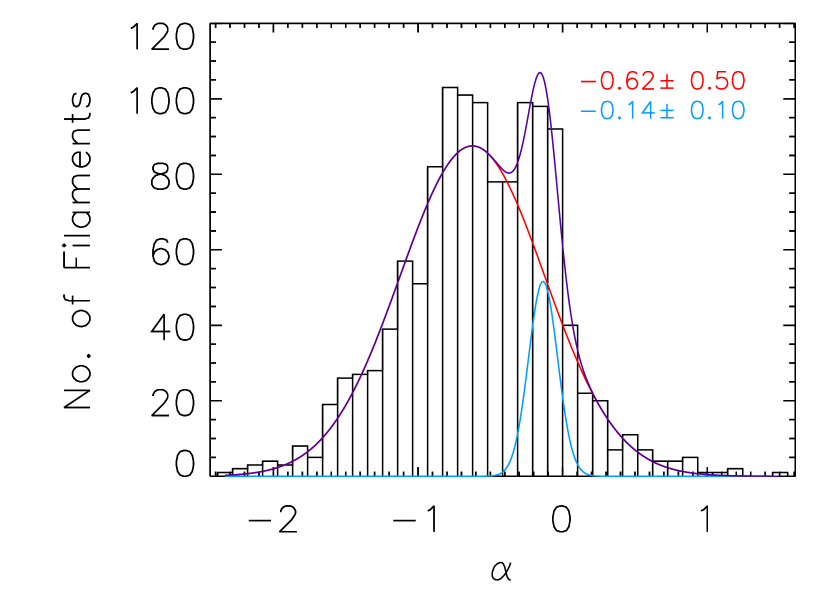
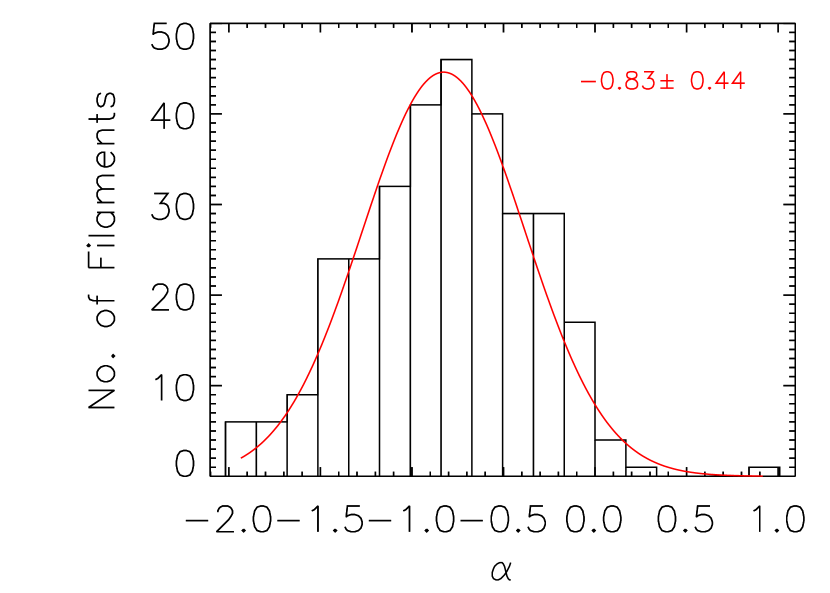
Figure 4 presents the histograms of the spectral index of filaments longer than 66′′ and 132′′, respectively. In Figure 4a, there is a strong narrow peak at , which represents the remaining thermal emission features. The much broader peak with represents nonthermal synchrotron emission from SNRs (with some contribution from the filaments). The selection criterion of excludes essentially all thermal features and many of the filaments associated with SNRs. This histogram in Figure 4b is dominated by the nonthermal filaments and indicates a mean spectral index of which is generally steeper than the typical spectral index of SNRs (above). The fitted mean spectral index values are consistent with trends expected from SNRs, HII regions and nonthermal filaments. The standard deviations of the spectral indices of these different components reflect intrinsic dispersion in the emission from these sources, rather than measurement errors.
The lengths () of the filaments that are selected in Figures 3 and 4 are measured by application of the procedure (Aschwanden, 2010); (Yusef-Zadeh et al. 2022). Length criteria are applied to reject shorter structures of HII regions and SNRs throughout the Galactic plane. The selection criterion excludes features that are essentially background.
(Yusef-Zadeh et al. 2022). Length criteria are chosen to increasingly reject
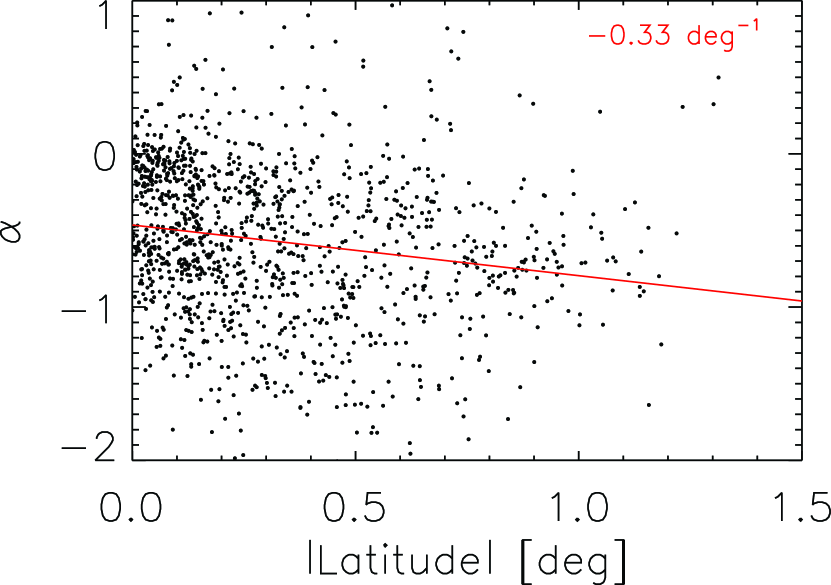
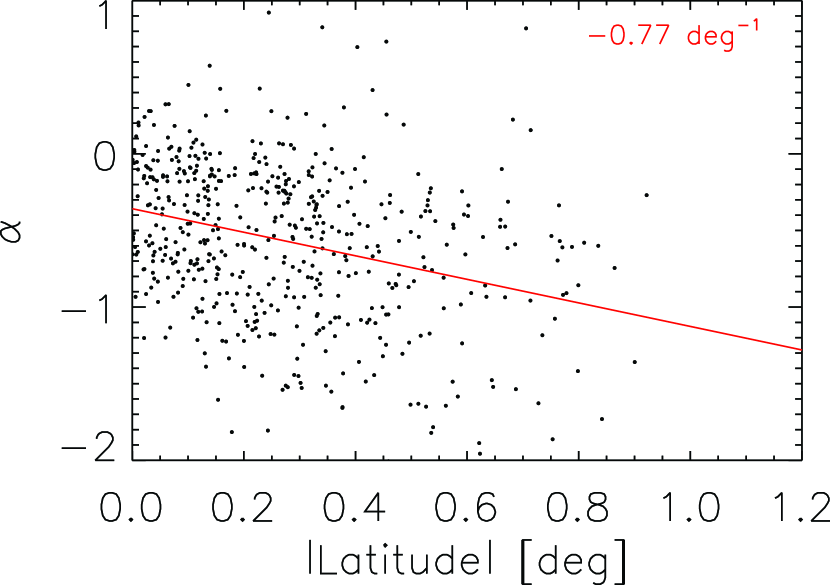
Another notable trend is a steepening of the spectral index as a function of absolute Galactic latitude. Figures 5a and 5b show this trend for lengths of filaments longer than 66′′ and , respectively. In the former plot, a large number of thermal sources with flat spectral indices obscure the trend, but selecting only the longest filaments (i.e., mostly nonthermal filaments) the trend is clearer despite a large intrinsic scatter.
3.2 Equipartition Magnetic Field
The magnetic field for each pixel is determined by using the filtered synchrotron intensity. Assuming a spectral index of produced by an electron spectrum running from 10 MeV to 10 GeV, and neglecting the presence of relativistic protons and nuclei, the estimated equipartition magnetic field scales as
| (1) |
where the synchrotron emissivity is related to intensity by and is the depth of the source. Here we have adopted a Galactic center distance of 8 kpc in converting between length and angular scale (i.e. pc/arcsec). The filament width is typically unresolved in the filtered image and is assumed to be ; the depth of a typical filament along the line of sight is also taken to be the same as its width, .
We also calculated the equipartition magnetic field accounting for the observed spectral index. We first computed the synchrotron emissivity at 1.18 and 1.38 GHz for a grid of assumed field strengths Brmeq and electron power-law indices (where between 10 MeV and 100 GeV). We averaged the fluxes to obtain an effective 1.28 GHz flux density and used their ratio to compute the spectral index. We then fit the results to obtain an empirical expression for the equipartition field given the observed flux and spectral index:
| (2) |
where , and = 125.4 Jy/arcsec3.
As expected, the above two estimates of the equipartition magnetic field almost coincide when . Figure 6 shows as a function of spectral index for different adopted ranges of relativistic electron energies. The estimated field strength is sensitive to the adopted lower cutoff for steep spectra, and the upper cutoff for flat spectra. This behavior is driven by the electron energy density implied by the assumed spectra. A related uncertainty is the ratio of the proton to electron energy densities: the estimates above assume that this is zero but increases by almost a factor of 4 if p/e.
Figure 7a shows the equipartition magnetic field strength across the entire field, assuming (Eq. (1)). Figure 7b is similar to 7a except that the more detailed estimate of Eq. (2) is applied, and thermal sources are masked by choosing spectral indices that are steeper than . This is effective at removing background thermal emission and H II regions (e.g. Sgr B), but also does exclude some flat spectrum filaments, most notably in the Radio Arc at . Figure 7b shows that many identified filaments have estimated fields of the order of 100 G (blue color) and a maximum value of G. Figure 8a and 8b show the histograms of the equipartition magnetic field values for long and the longest filaments estimated from the filtered and masked image of Figure 7b. The peak for and filaments is mG.
4 Discussion
Our statistical study described in the previous section estimated typical values that characterize the spectral index and the equipartition magnetic field distributions of the population of Galactic center radio filaments. The in-band spectral index values are measured simultaneously over 800 MHz bandwidth centered at 1.28 GHz. The equipartition magnetic field values are derived by incorporating the dependence of on the spectral index. These derivations and measurements focus on global mean values over a large region of the Galactic center.
Previous studies have used widely separated radio bands and focused on individual spectral indices and equipartition magnetic fields of individual filaments (Lang et al., 1999; Lang, Morris & Echevarria, 1999; Sofue, Murata, & Reich, 1992; Liszt & Spiker, 1995; Pohl, Reich, & Schlickeiser, 1992; Wang, Lu, & Lang, 2002; LaRosa, et al., 2004; Nord et al., 2004; Law, Yusef-Zadeh & Cotton, 2008; Gray, et al., 1991, 1995). The largest number of spectral indices were given by (Law, Yusef-Zadeh & Cotton, 2008) using 6 and 20 cm wavelengths. Our spectral indices of individual filaments generally agree with previous measurements in spite of different spectral windows, sensitivities, and techniques of background subtraction. For example, the spectral index of the Snake filament G359.1-0.2 as a function of latitude is estimated in Figure 3b and (Gray, et al., 1995). We note that the northern half of the G359.1-0.15, north of , has a flatter spectrum than the rest of the filament. The spectral index at agrees with that estimated by (Gray, et al., 1995), though their spectral index gradient values do not agree with our work because of their limited 20cm beam size, as pointed out by (Gray, et al., 1995). In another example, the steepening of the spectral index away from the Radio Arc is consistent with one group of filaments noted by (Pohl, Reich, & Schlickeiser, 1992). Previous estimates of the equipartition magnetic field as a function of the spectral index give values that are consistent with our derivations. The magnetic field of the Snake filament is estimated to be 88 G (Gray, et al., 1995) which is similar to that shown in Figure 7b.
4.1 The Spectral Index of the Filaments and SNRs: The Origin of the Bipolar Radio Bubble
We determined the mean spectral index of the population of filaments indicating a steeper spectrum on average () than SNRs (). The quoted uncertainties are the standard deviations of the histogram components in Figure 4 and do not include systematic errors such as those introduced by the automated global procedures applied here, which introduce a degree of contamination in the samples (see Yusef-Zadeh et al. 2022). The comparison between these two populations of nonthermal sources in the Galactic center is relevant because of their potential role in explaining the origin of large-scale bipolar radio and X-ray structures. The triggering event that has been proposed to explain the origin of the radio bubble and the hot X-ray emitting coronal gas is either enhanced accretion onto the 4 black hole, Sgr A*, or a burst of star formation activity a few times years ago (e.g. Heywood, et al., 2019; Ponti et al., 2019). However, the fact that the number of filaments declines with latitude and that the filament population is mainly bounded by the radio structure, suggests a causal connection between the filaments and the radio bubble (Heywood, et al., 2019). If so, scenarios for the radio bubble must also explain the origin of the filaments. The distinction between the spectral indices of SNRs and filaments disfavors synchronized SNe and implies an outburst from Sgr A* is a more likely explanation of the origin of the radio bubble, the filaments, and the X-ray chimney (Ponti et al., 2019; Heywood, et al., 2019).
Another property of the spectral index distribution is its trend of steepening with increasing absolute Galactic latitude. There are two possible explanations. On one hand, the trend could result from synchrotron cooling, which steepens the synchrotron spectrum as the underlying electron population ages. In this picture the relativistic populations of electrons illuminating the filaments at extreme latitudes are older than those closer to the Galactic plane. If the filaments arise as a consequence of interacting cosmic-ray driven winds emerging from the Galactic plane, the filaments at higher latitudes are produced when cosmic-ray particles in the winds have aged more than those particles closer to the Galactic plane. The energy loss rate depends on the magnetic field along the filaments. If we assume the magnetic field is 30 or 100 G, the synchrotron cooling time scale is 5.5 or 0.9 Myr, respectively, at the observed frequency GHz. These time scales are consistent with the inferred age of the outburst that created the radio bubble and X-ray Chimney. On the other hand, if shocks driven by a large scale cosmic-ray driven wind as it flows around obstacles (such as stellar wind bubbles) are responsible for the production of individual filaments, then the shocks produced at higher latitudes must be weaker, thus resulting a steeper energy spectrum of particles.
4.2 The Magnetic Field Strengths of the Filaments and the Galactic Center ISM
We estimated the mean magnetic field of the population of filaments to be in the range 100-400 G, possibly larger, depending on the proton to electron ratio. This is significantly larger than estimates of the weak magnetic field permeating the central 100 pc of the Galaxy, which range from 10 G to G (LaRosa et al., 2005; Yusef-Zadeh, et al., 2013). The amplification of the magnetic field occurs along string-like filaments, implying that most of the interstellar volume of the Galactic center has to have lower magnetic field than that of the filaments, implying lower magnetic energy densities than the observed high cosmic ray pressure in this region, as discussed in the next section. We assumed equipartition between particles and the magnetic field along the filaments. The high cosmic ray pressure observed throughout the Galactic center suggests that it is unlikely that the diffuse magnetic field is in equipartition with the field along the filaments. Diffuse nonthermal structure in the Galactic center imposes other limitations on the large-scale magnetic field strength, suggesting that the pervasive magnetic field is also weak, on the order of 10G (LaRosa et al., 2005) and not of the order of 1 mG as suggested by Morris (1994); Chandran, Cowley, & Morris (2000). Additional support comes from earlier measurements of the rotation measure distribution of extragalactic radio sources projected toward the Galactic center (Roy, 2004), and with observations of the Snake filament (Gray, et al., 1995), which indicates a weak magnetic field strength in the Faraday screen toward the Galactic center. Lastly, the weak diffuse field is also consistent with a turbulent model of the Galactic center in which the magnetic field originates from turbulent activity. In this picture, the spatial distribution of the magnetic field energy is highly intermittent, and the regions of strong field have filamentary structure whereas the large-scale diffuse magnetic field is weak (Boldyrev & Yusef-Zadeh, 2006).
4.3 The Origin of Excess Cosmic-ray Particles in the Galactic Center Region
One of the key questions that remains is the origin of the elevated cosmic ray ionization rate in the Galactic center ISM. The evidence for this comes from the H absorption line, the heating rate of warm molecular gas, ionization by nonthermal emission, and 6.4 keV line studies. The mid-infrared H absorption line measurements imply that the central 100 pc of the Galaxy is permeated by low-density molecular medium with density cm-3 subject to a cosmic ray ionization rate s-1 H-1, a value that is consistent with other indicators, such as the temperature of Galactic center molecular clouds. Estimates of the cosmic ray ionization rate from these studies are two to three orders of magnitudes greater than elsewhere in the Galaxy (e.g. Geballe, et al., 1999; Oka, et al., 2005; Indriolo & McCall, 2012; Le Petit et al., 2016; Yusef-Zadeh, et al., 2007; Yusef-Zadeh, Wardle & Roy, 2007; Yusef-Zadeh, et al., 2013; Goto, et al., 2014; Oka, et al., 2019).
The high cosmic ray pressure was recently suggested to drive a large-scale wind away from the Galactic plane creating the bipolar X-ray and radio emission. In this picture, the non-thermal radio filaments result from the interaction of the large-scale wind and stellar wind bubbles (Yusef-Zadeh & Wardle, 2019). The correlation of nonthermal radio filaments and the radio bubble was first noted in Heywood et al. (2019). The nonthermal filaments are magnetized streamers created by the wrapping of the wind’s magnetic field around an obstacle such as a source of stellar wind blowing in the ISM, by analogy with the magnetized ion tails of comets embedded in the solar wind. Recent MHD simulations of the propagation of cosmic rays along harp-like systems of filaments is consistent with the suggestion that cosmic ray streaming is preferred over diffusion along the filaments (Thomas, Pfrommer, & Enßlin, 2020).
What is the mechanism that injects excess cosmic ray particles and produces diffuse nonthermal emission from the inner few hundred parsecs of the Galactic center? One possibility is that the enhanced global ionization rate is a relic of past outburst activity, either of correlated supernovae associated with a burst of star formation, or of the central supermassive black hole Sgr A*. These scenarios can explain the origin of the radio bubble, the hot X-ray emitting gas and the filaments (Heywood, et al., 2019; Yusef-Zadeh & Wardle, 2019).
Alternatively, the enhanced cosmic-ray population in the Galactic center region might be supplied by leakage or escape from the radio filaments. In this scenario, the power in energetic particles accelerated and subsequently leaked by the filaments into their surrounds must be sufficient to compensate for the energy losses associated with ionization throughout the Galactic center, as well as the losses by outward advection in a Galactic nuclear wind.
To explore this we first estimate the power required to maintain the cosmic-ray population at the Galactic center. The inferred ionization rate implies a cosmic ray energy density eV cm-3 – a thousand times that at the solar neighborhood. This population is subject to ionization losses of eV per ionization, yielding a net loss rate per unit volume eV cm-3 s-1. In turn, this implies a lifetime against ionization losses Myr. This is comparable to estimates of the loss time by advection in a Galactic center wind that has been invoked to explain the X-ray and radio bubbles extending above and below the Galactic plane. This would advect particles out of the plane at speeds of order 400 km s-1, yielding a loss time on 100 pc scales of order 0.25 Myr. In total, the loss rate is eV cm-3 s-1.
Now we determine whether the filaments can supply this power. First, the relativistic particle energy density in the filaments is of order the magnetic field energy density, which for our estimated mean field in the filaments mG, is eV cm-3. For a particle leakage time scale and a volume filling factor , the volume-averaged energy loss rate from the filaments is eV cm-3, implying a requirement that the leakage time scale Myr, i.e. a few times yr for of a few percent.
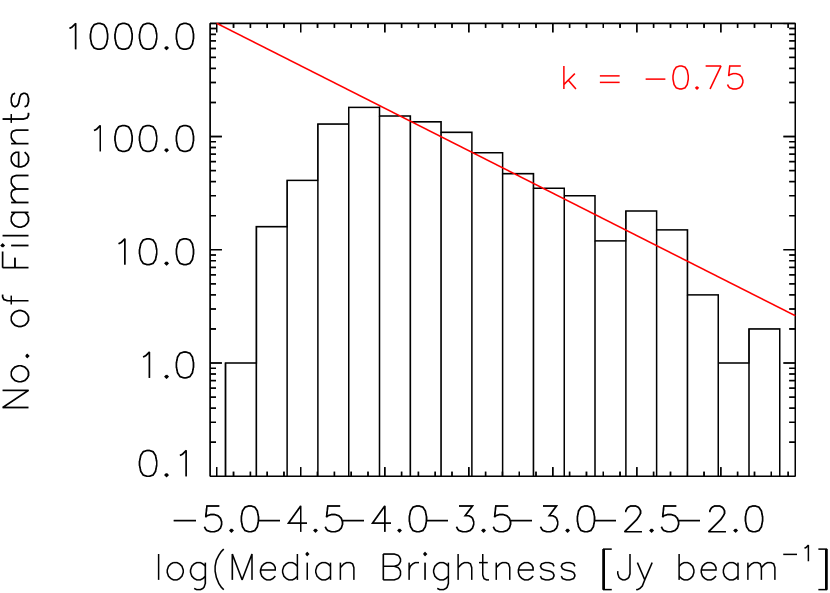
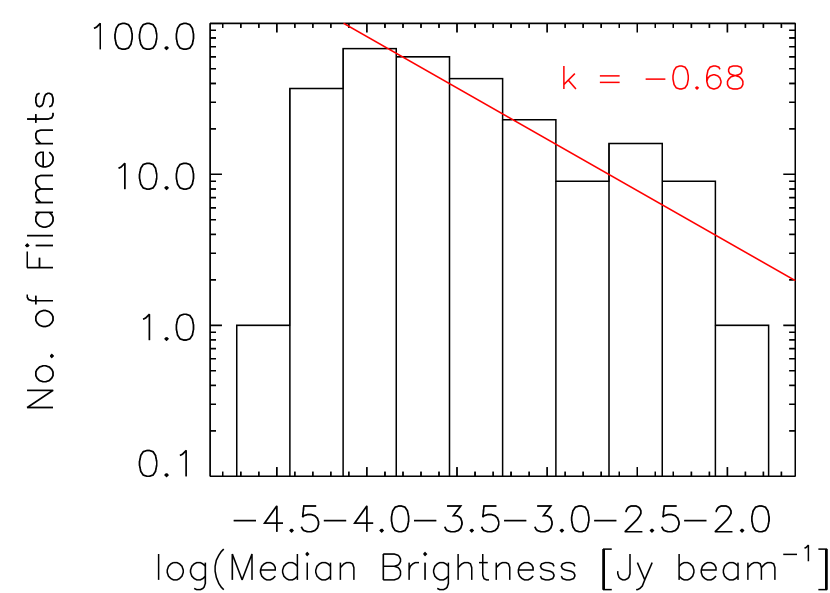
To explore if the filaments are able to supply the cosmic rays responsible for the high ionization rate found in the diffuse ISM of the Galactic center, Figure 9a and 9b show histograms of the number of filaments as a function of median surface brightness for linear features longer than and , respectively. The red lines indicate power law fits to the bright portion of the histograms, indicating power law indices of of and , respectively. Using these power law distributions of the brightness of the filaments to extrapolate to much fainter filaments, the effective filling factor is estimated to be less than a percent, thus we expect short leakage time scale. This implies that the filament population may not be powerful enough to flood the Galactic center region with cosmic rays (Yusef-Zadeh et al. 2022).
4.4 Conclusion
In summary, we present an analysis of the entire system of non-thermal radio filaments in the Galactic center and determine the mean values of important physical quantities in this region. In particular, we use filtered images to statistically determine the spectral index and the equipartition magnetic field of the population of nonthermal radio filaments. The steep spectral indices of the filaments compared to SNRs and their steepening away from the Galactic plane support a picture of an outburst from Sgr A* than correlated supernovae associated with a burst of star formation. We also estimated that the mean equipartition value of the magnetic field of the population of filaments is strong. An argument was made that the amplification of the magnetic field occurs along the filaments, which implies that most of the interstellar volume of the Galactic center where the CMZ resides must have weak magnetic fields. We also suggested that one mechanism for the leakage of energetic particles from filaments may not able to explain the high cosmic ray ionization rate noted in the Galactic center region. In this picture, the leakage results from the interaction of filaments with low density diffuse gas throughout the Galactic center. Alternately, the interaction of nonthermal filaments with denser clouds has been argued in the past to explain: the origin of the warm temperature of molecular clouds, and the 6.4 keV line emission from neutral FeI from dense clouds, as well as diffuse -ray emission from diffuse gas (Yusef-Zadeh, et al., 2013). In this picture, diffusion of cosmic ray particles will be different for low and high energy cosmic ray particles. While low energy cosmic-ray electrons loss is significant, high energy particles can penetrate deep into dense molecular clouds without any losses.
References
- Anantharamaiah et al. (1991) Anantharamaiah, K. R., Pedlar, A., Ekers, R. D., et al. 1991, MNRAS, 249, 262. doi:10.1093/mnras/249.2.262
- Arendt et al. (2019) Arendt R. G., Staguhn J., Dwek E., Morris M. R., Yusef-Zad eh F., Benford D. J., Kovács A., et al., 2019, ApJ, 885, 71. doi:10.3847/1538-4357/ab451c
- Aschwanden (2010) Aschwanden M. J., 2010, SoPh, 262, 399
- Banda-Barragán, et al. (2016) Banda-Barragán W. E., Parkin E. R., Federrath C., Croc ker R. M., Bicknell G. V., 2016, MNRAS, 455, 1309
- Bicknell & Li (2001) Bicknell G. V., Li J., 2001, ApJ, 548, L69
- Boldyrev & Yusef-Zadeh (2006) Boldyrev S., Yusef-Zadeh F., 2006, ApJL, 637, L101. doi:10.1086/500411
- Chandran, Cowley, & Morris (2000) Chandran B. D. G., Cowley S. C., Morris M., 2000, ApJ, 528, 723. doi:10.1086/308184
- Coughlin, Nixon, & Ginsburg (2021) Coughlin E. R., Nixon C. J., Ginsburg A., 2021, MNRAS, 501, 1868. doi:10.1093/mnras/staa3771
- Dahlburg, et al. (2002) Dahlburg R. B., Einaudi G., LaRosa T. N., Shore S. N., 2002, ApJ, 568, 220
- Ferrière (2009) Ferrière K., 2009, A&A, 505, 1183
- Geballe, et al. (1999) Geballe T. R., McCall B. J., Hinkle K. H., Oka T., 1999, ApJ, 510, 251
- Goto, et al. (2014) Goto M., Geballe T. R., Indriolo N., Yusef-Zadeh F., Usuda T., Henning T., Oka T., 2014, ApJ, 786, 96
- Gray, et al. (1991) Gray A. D., Cram L. E., Ekers R. D., Goss W. M., 1991, Natur, 353, 237
- Gray, et al. (1995) Gray A. D., Nicholls J., Ekers R. D., Cram L. E., 1995, ApJ, 448, 164
- Green (1988) Green D. A., 1988, Ap&SS, 148, 3. doi:10.1007/BF00646462
- Haynes, et al. (1992) Haynes R. F., Stewart R. T., Gray A. D., Reich W., Reich P., Mebold U., 1992, A&A, 264, 500
- Heywood, et al. (2019) Heywood I. et al. 2019, Nature, 10.1038
- Indriolo & McCall (2012) Indriolo N., McCall B. J., 2012, ApJ, 745, 91
- Inoue, et al. (1984) Inoue M., Takahashi T., Tabara H., Kato T., Tsuboi M., 1984, PASJ, 36, 633
- Kassim & Frail (1996) Kassim N. E., Frail D. A., 1996, MNRAS, 283, L51. doi:10.1093/mnras/283.3.L51
- Lang et al. (1999) Lang C. C., Anantharamaiah K. R., Kassim N. E., Lazio T. J. W., 1999, ApJL, 521, L41. doi:10.1086/312180
- Lang, Morris & Echevarria (1999) Lang C. C., Morris M., Echevarria L., 1999, ApJ, 526, 727
- LaRosa et al. (2005) LaRosa T. N., Brogan C. L., Shore S. N., Lazio T. J., Kassim N. E., Nord M. E., 2005, ApJL, 626, L23. doi:10.1086/431647
- LaRosa, Lazio & Kassim (2001) LaRosa T. N., Lazio T. J. W., Kassim N. E., 2001, ApJ, 563, 163
- LaRosa, et al. (2004) LaRosa T. N., Nord M. E., Lazio T. J. W., Kassim N. E., 2004, ApJ, 607, 302
- Law, Yusef-Zadeh & Cotton (2008) Law C. J., Yusef-Zadeh F., Cotton W. D., 2008, ApJS, 177, 515
- Le Petit et al. (2016) Le Petit, F., Ruaud, M., Bron, E., et al. 2016, A&A, 585, A105
- Liszt (1985) Liszt H. S., 1985, ApJ, 293, L65
- Liszt & Spiker (1995) Liszt H. S., Spiker R. W., 1995, ApJS, 98, 259. doi:10.1086/192160
- Ludovici et al. (2016) Ludovici, D. A., Lang, C. C., Morris, M. R., et al. 2016, ApJ, 826, 218. doi:10.3847/0004-637X/826/2/218
- Morris (2006) Morris, M. 2006, Journal of Physics Conference Series, 54, 1. doi:10.1088/1742-6596/54/1/001
- Morris (1994) Morris M., 1994, ASIC, 445, 185
- Morris (2007) Morris, M. 2007, astro-ph/0701050
- Nord et al. (2004) Nord M. E., Lazio T. J. W., Kassim N. E., Hyman S. D., LaRosa T. N., Brogan C. L., Duric N., 2004, AJ, 128, 1646.
- Nicholls & Le Strange (1995) Nicholls J., Le Strange E. T., 1995, ApJ, 443, 638
- Oka, et al. (2005) Oka T., Geballe T. R., Goto M., Usuda T., McCall B. J., 2005, ApJ, 632, 882
- Oka, et al. (2019) Oka T., Geballe T. R., Goto M., Usuda T., McCall B. J., 2019, ApJ, in press
- Paré et al. (2019) Paré D. M., Lang C. C., Morris M. R., Moore H., Mao S. A., 2019, ApJ, 884, 170. doi:10.3847/1538-4357/ab45ed
- Pohl, Reich, & Schlickeiser (1992) Pohl M., Reich W., Schlickeiser R., 1992, A&A, 262, 441
- Ponti et al. (2019) Ponti, G., Hofmann, F., Churazov, E., et al. 2019, Nature, 567, 347
- Pound & Yusef-Zadeh (2018) Pound M. W., Yusef-Zadeh F., 2018, MNRAS, 473, 2899. doi:10.1093/mnras/stx2490
- Reich et al. (2000) Reich, W., Sofue, Y., & Matsuo, H. 2000, PASJ, 52, 355. doi:10.1093/pasj/52.2.355
- Rosner & Bodo (1996) Rosner R., Bodo G., 1996, ApJ, 470, L49
- Roy (2004) Roy S., 2004, BASI, 32, 205
- Shore & LaRosa (1999) Shore S. N., LaRosa T. N., 1999, ApJ, 521, 587
- Staguhn et al. (2019) Staguhn J., Arendt R. G., Dwek E., Morris M. R., Yusef-Z adeh F., Benford D. J., Kovács A., et al., 2019, ApJ, 885, 72. doi:10.3847/1538-4357/ab451b
- Staguhn, et al. (1998) Staguhn J., Stutzki J., Uchida K. I., Yusef-Zadeh F., 1998, A&A, 336, 290
- Sofue, Murata, & Reich (1992) Sofue Y., Murata Y., Reich W., 1992, PASJ, 44, 367
- Sofue (2020) Sofue Y., 2020, PASJ, 72, L4. doi:10.1093/pasj/psaa011
- Su et al. (2010) Su, M., Slatyer, T. R., & Finkbeiner, D. P. 2010, ApJ, 724, 1044
- Thomas, Pfrommer, & Enßlin (2020) Thomas T., Pfrommer C., Enßlin T., 2020, ApJL, 890, L18. doi:10.3847/2041-8213/ab7237
- Tsuboi, et al. (1995) Tsuboi M., Kawabata T., Kasuga T., Handa T., Kato T., 1995, PASJ, 47, 829
- Wang, Lu, & Lang (2002) Wang Q. D., Lu F., Lang C. C., 2002, ApJ, 581, 1148.
- Yusef-Zadeh & Bally (1987) Yusef-Zadeh F., Bally J., 1987, Natur, 330, 455. doi:10.1038/330455a0
- Yusef-Zadeh et al. (2021) Yusef-Zadeh F., Wardle M., Heinke C., Heywood I., Arendt R., Royster M., Cotton W., et al., 2021, MNRAS, 500, 3142. doi:10.1093/mnras/staa3257
- Yusef-Zadeh (2003) Yusef-Zadeh, F. 2003, ApJ, 598, 325.
- Yusef-Zadeh & Wardle (2019) Yusef-Zadeh F., Wardle M., 2019, MNRAS, 490, L1
- Yusef-Zadeh, Morris & Chance (1984) Yusef-Zadeh F., Morris M., Chance D., 1984, Natur, 310, 557
- Yusef-Zadeh, et al. (1986) Yusef-Zadeh F., Morris M., Slee O. B., Nelson G. J.,1986, ApJ, 310, 689
- Yusef-Zadeh, Wardle & Parastaran (1997) Yusef-Zadeh F., Wardle M., Parastaran P., 1997, ApJ, 475, L119
- Yusef-Zadeh et al. (2004) Yusef-Zadeh, F., Hewitt, J. W., & Cotton, W. 2004, ApJS, 155, 421.
- Yusef-Zadeh, et al. (2007) Yusef-Zadeh F., Muno M., Wardle M., Lis D. C., 2007, ApJ, 656, 847
- Yusef-Zadeh, Wardle & Roy (2007) Yusef-Zadeh F., Wardle M., Roy S., 2007, ApJ, 665, L123
- Yusef-Zadeh, et al. (2013) Yusef-Zadeh F., et al., 2013, ApJ, 762, 33
- Yusef-Zadeh, et al. (2005) Yusef-Zadeh F., Wardle M., Muno M., Law C., Pound M., 2005, AdSpR, 35, 1074
- Yusef-Zadeh & Wardle (2019) Yusef-Zadeh F., Wardle M., 2019, MNRAS, 490, L1
- Yusef-Zadeh et al. (1986) Yusef-Zadeh F., Morris M., Slee O. B., Nelson G. J., 1986, ApJ, 310, 689. doi:10.1086/164719
- Yusef-Zadeh & Morris (1987) Yusef-Zadeh F., Morris M., 1987, ApJ, 322, 721. doi:10.1086/165767
- Yusef-Zadeh (2003) Yusef-Zadeh F., 2003, ApJ, 598, 325. doi:10.1086/378715