SMethods references
A dusty veil shading Betelgeuse during its Great Dimming
Abstract
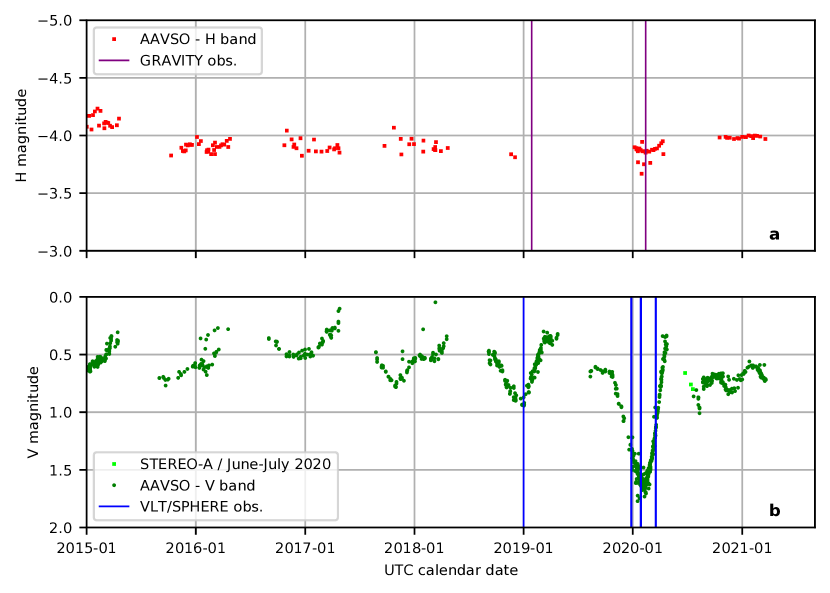
Red supergiants represent the most common final stage of the evolution of stars with initial masses between 8 and 30-35 times the mass of the Sun[1]. During this phase of lifetime lasting 105 yrs[1], they experience substantial mass loss of unknown mechanism[2]. This mass loss can affect their evolutionary path, collapse, future supernova light curve[3], and ultimate fate as a neutron star or a black hole[4]. From November 2019 to March 2020, the second closest red supergiant (RSG, pc[5, 6]) Betelgeuse experienced a historic dimming of its visible brightness, witnessed worldwide. Usually between 0.1 and 1.0 mag, it went down to mag around 7-13 February 2020 [7]. Here we report high angular resolution observations showing that the southern hemisphere of the star was ten times darker than usual in the visible. Observations and modeling support the scenario of a dust clump recently formed in the vicinity of the star due to a local temperature decrease in a cool patch appearing on the photosphere. The directly imaged brightness variations of Betelgeuse evolved on a timescale of weeks. This event suggests that an inhomogeneous component of red supergiant mass loss[8] is linked to a very contrasted and rapidly changing photosphere.
Received 6 November 2020; accepted 13 April 2021
Main paper
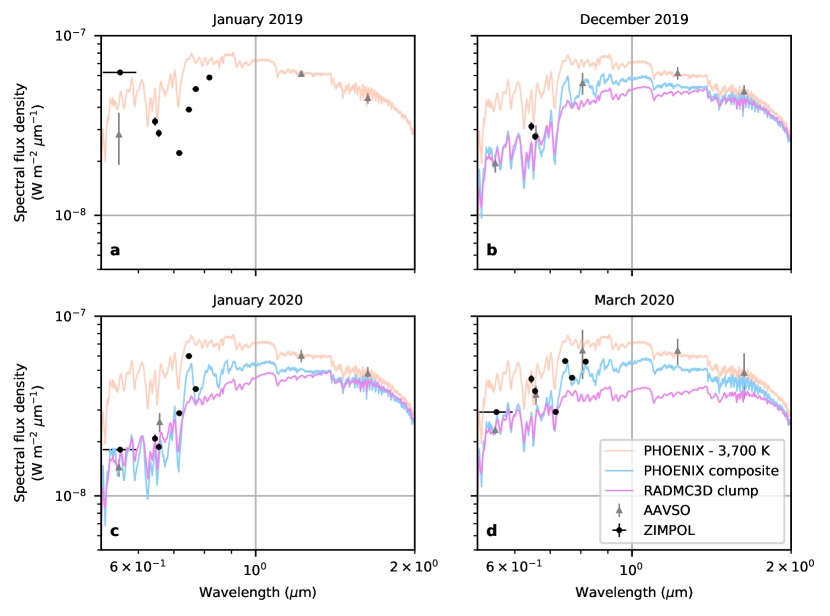
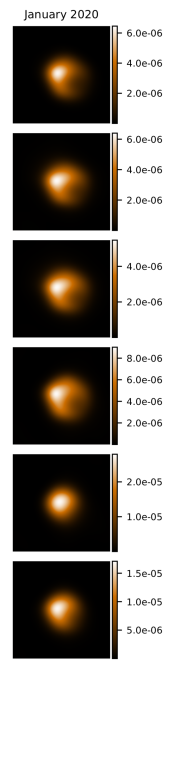
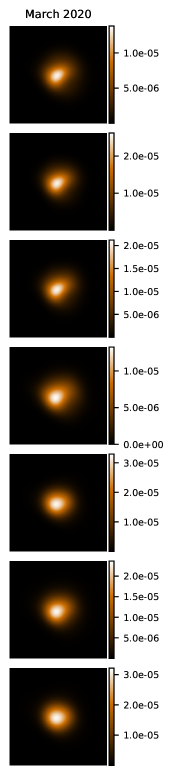
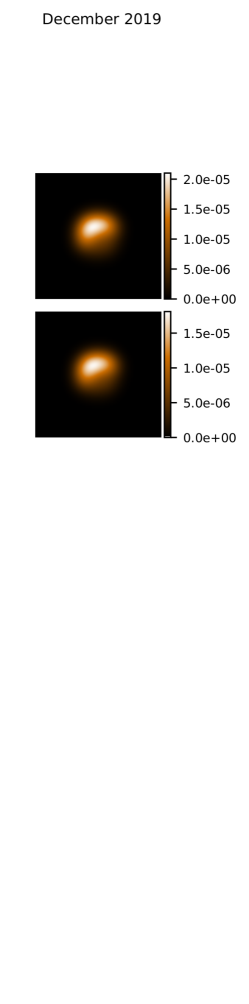
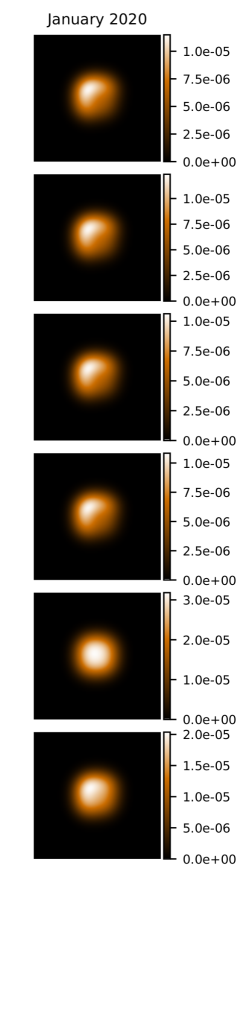
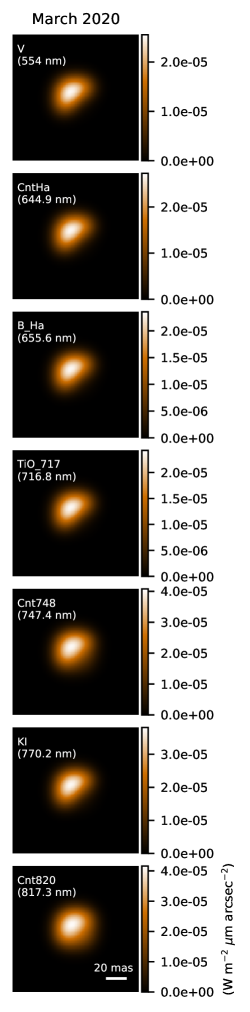
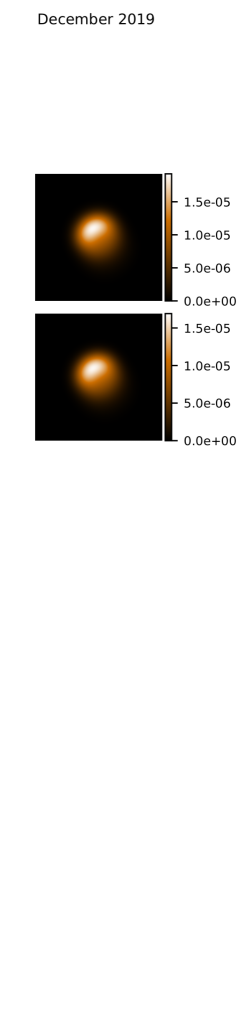
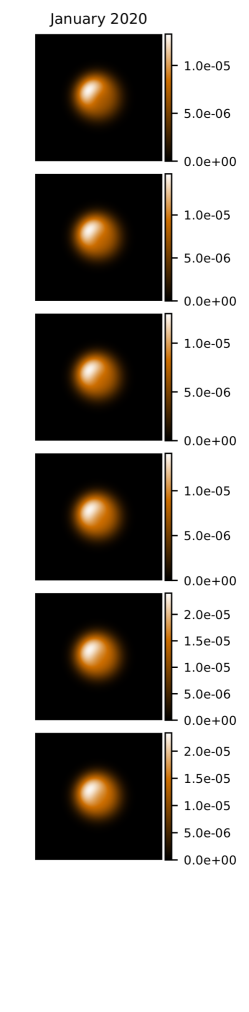
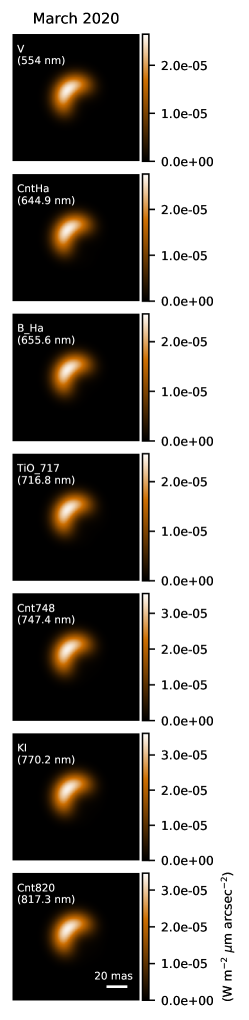
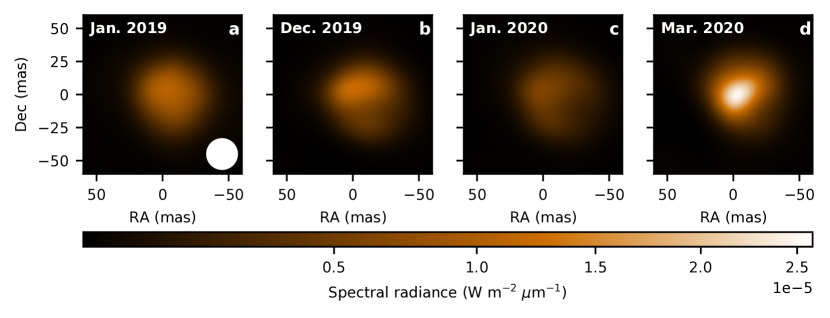
We obtained direct high spatial resolution observations using VLTI/GRAVITY and VLT/SPHERE. Details on the data aquisition and reduction are available in the Methods section. The SPHERE-ZIMPOL images provide the only resolved reconnaissance of the stellar disk and its nearby surroundings a year before and through this Great Dimming event. Observations were secured before (January 2019) and during the dimming (December 2019, January and March 2020, see also Fig. 1).
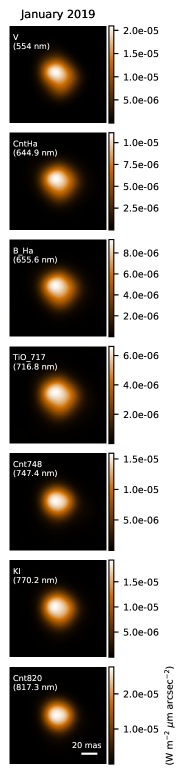
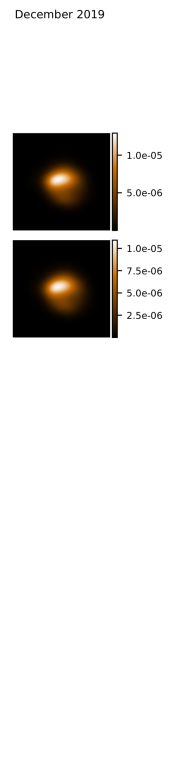
The deconvolved ZIMPOL images of Betelgeuse for the four epochs are presented in Fig. 2. The photosphere of Betelgeuse is clearly resolved in each image, with deviations from circular symmetry. Earlier imaging in March 2015, published in 2016[9], showed an elongation along the North-East to South-West axis. The same shape is apparent in our January 2019 image (Fig. 2a) but less pronounced. In both December 2019 and January 2020 (Fig. 2 b and c), in all filters, the Southern hemisphere of the star has a peak brightness over 10 times less than the Northern hemisphere.
Four scenarios could explain the Great Dimming of Betelgeuse: (1) a (potentially local) decrease of the effective temperature of the star, making it fainter; an occultation by dust (2) either newly formed or (3) transiting in front of the star, or (4) a change of the angular diameter. Each scenario is checked against our observations.
A transiting dusty clump scenario is rejected as such a clump should change quadrant before and after the deepest dimming, while our observations in January and March 2020 show the dark area remained in the South-Western quadrant. A change in diameter is ruled out by our VLTI/GRAVITY and VLT/SPHERE-IRDIS observations. We measured uniform disk (UD) angular diameters of mas in January 2019, and mas in February 2020, well within the range explored during the past 30 years[10], and far from the 30% variation that would have been required to reproduce the visible dimming.
Dust has been inferred from spectrophotometric observations[11]. However, later sub-millimeter observations and TiO photometry[12] have favored a singular or multiple dark and cool photospheric spots to explain the event[13] while preserving compatability with optical spectrophotometry, arguing in favor of a molecular opacity increase. A similar conclusion is reached by tomography from high resolution spectroscopy, which suggests that the propagation of two shock waves in the upper atmosphere, aided by underlying convection or outward gas motion altered the molecular opacity in the line of sight[14]. This scenario would be compatible with both anterior spectropolarimetric imaging[15], and 3D simulations of stellar convection in evolved stars carried out with the CO5BOLD code[16, 17, 18, 19]. Here, convection is expected to trigger the formation of gas clumps capable of causing dimming events. In the present study, we explore both hypotheses: the formation of dust and photospheric cooling.
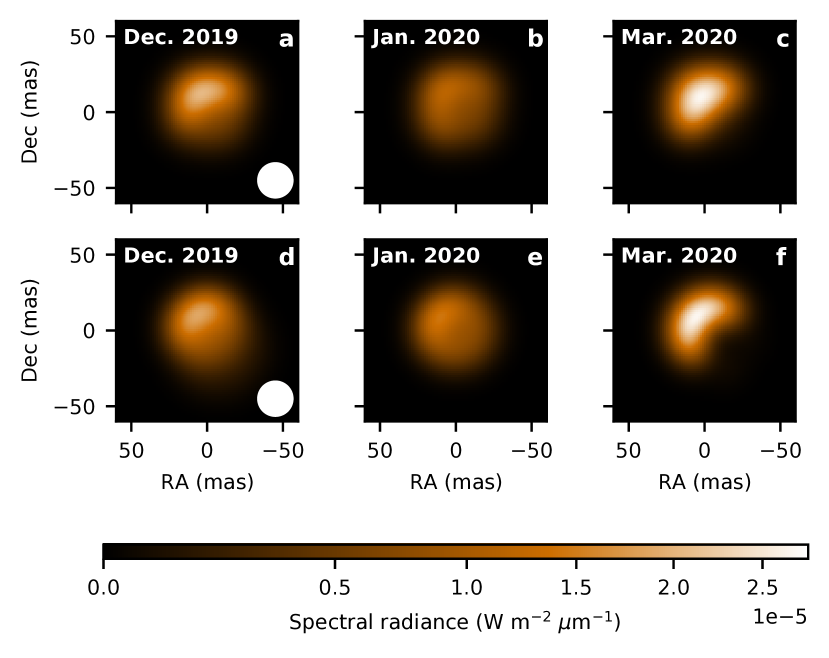
The cool patch hypothesis is explored by building a composite Phoenix model[20] of the stellar photosphere. The composite model images are then convolved with the ZIMPOL beam and compared to our observations. With the unperturbed photospheric temperature[11] set to 3,700 K, we determine the best cool patch temperatures to be 3,400 K in December 2019 and January 2020, down to 3,200 K in March 2020. The cool region has a best-fit extent of 62 %, 79 % and 43 % of the apparent disk, respectively, for the three epochs. All temperatures are given with a 50 K uncertainty corresponding to the Phoenix grid spacing.
The dust clump hypothesis is investigated through Radmc3D[21] dust radiative transfer simulations. By exploring a grid of input parameters for a spherical dusty clump of constant density illuminated and heated by the RSG, we acquired optimized values for December 2019. For January and March 2020, the parameters were tuned manually to reproduce the peculiar shape of the images that proved very sensitive to the inputs. We retrieve clump radii of 4.5-6 astronomical unit (au), or 1 R⋆, and total dust masses of 10-10 M⊙. Considering the gas-to-dust ratio in the environment of RSG[22] to be , this would mean a total mass of the clump of 10-7 M⊙ (i.e., 10-2 MEarth). This represents 35 to 128 % of the average annual mass loss of Betelgeuse for a low mass-loss rate estimation ( M⊙ yr-1, see [[23]]), or 3 to 12 % in the high range ( M⊙ yr-1, see [[24]]).
The images of both types of models for the three dimmed observed epochs are plotted on Fig. 3, showing a qualitative morphological agreement. Both the cool patch and dusty clump models capture the essential behavior during the Great Dimming, i.e. they both recover the level of optical dimming and the first-order atmospheric structure seen during the event. However, both models predict a J band near-infrared brightness decrease by a factor while a factor of just 1.02 is observed (Fig. 1 and Extended Data Figure 1). Variations in the chemical composition, shape and properties of solid species in the dust occultation model, or a temporary change in photospheric molecular opacities, likely can reconcile the H-band flux and reproduce the American Association of Variable Star Observers (AAVSO) photometry in this spectral domain.
Some observations of the Great Dimming clearly identify the presence of newly formed dust close to the photosphere[25, 26], while other studies identify a cooling of the photosphere[13]. The Great Dimming occurred days after the star’s previous minimum[7]. The primary pulsational period being days[27], the scenario explaining the event must account for the alignment with the star’s pulsational behavior. We propose that some time before the Great Dimming the star ejected a bubble of gas, likely at a favorable incidence in the pulsation cycle and potentially aided by the surfacing of a giant convective cell[28]. The critical parameter to allow for dust condensation in the ambient environment of cool evolved stars is the temperature[29]. The gas cloud may have been present in the near circumstellar environment but it would have been still too warm to trigger dust nucleation, until the star decreased in brightness in late 2019 in accordance with its pulsation phase. According to the Radmc3D modelling, with a local decrease of surface temperature from 3,700 to 3,400 K in December 2019, the clump must have seen its environment temperature decrease from to K at 12.5 au which may have initiated a rapid dust formation[30]. After the initial dust nucleation and obscuration, the gas further out is screened from the star, which can trigger a dust nucleation cascade causing the Great Dimming. Although a fully consistent ab-initio 3D hydro-chemical model for such a scenario is not yet developed for an M-type RSG[29], its outline resembles remarkably the scenario proposed for R Coronae Borealis stars, including the coincidence of the dimming with the pulsational minimum[31].
Our observations from December 2019 through March 2020 for the first time disclose in real-time a discrete mass-loss event from a RSG star. This mass loss is non-uniform and episodic, unambiguously linking the initiation mechanism to local surface behavior, i.e., a contrasted and rapidly changing photosphere. The released gas cloud experiences dust-nucleation within a few stellar radii, which may play an essential role in letting the ejected material escape from the system altogether.
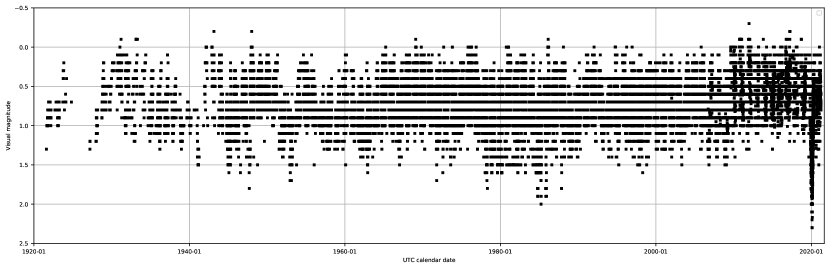
If such dusty-cloud ejections are a recurrent phenomenon, and observations of other RSGs suggest this may be the case[32, 33], then only a fraction of these events may happen in the line of sight toward Earth and would lead to obscuration of stellar light. Betelgeuse’s AAVSO light curve (Extended Data Figure 2) shows another possible dimming in 1984-1986, when some visual magnitude measurements dropped down to 2 mag. However, only two observers out of several tens saw it. And while these two visual observers saw Betelgeuse at a visual magnitude of 1.8-2, photoelectric measurements in the V band were at 0.7 mag. The 2019-2020 extreme dimming of Betelgeuse seems the only confirmed example for this star over the previous century.
Previous observations of the circumstellar environment of Betelgeuse[34, 8, 35, 36, 37] show a very inhomogeneous environment embedded in a smoother matrix. This may confirm that Betelgeuse and possibly other RSG experience two modes of mass loss[38, 39, 8]: a smooth homogeneous radial outflow mainly consisting of gas with at most partial dust nucleation farther away from the star; and an episodic localised ejection of clumps of gas where conditions are favorable for efficient dust formation while still close to the photosphere.
Photometric observations of the star have continued after the Great Dimming. Measurements[40] obtained in June-July 2020 showed that Betelgeuse experienced another dimming not corresponding to the 400 days period, but it has recovered since[41]. These successive dimmings fall within the irregular pattern of light curve variability of the star, and can be attributed to pulsation/convective activity[6].
Our results confirm that the Great Dimming is not an indication of Betelgeuse’s imminent explosion as a supernova[24, 6] (SN). Interpretation of the early behavior of core-collapse SNe light curves and post collapse spectral line variation point to enhanced pre-SN mass loss in the final weeks to centuries of the stars’ life[42], in at least part of the progenitor population. For the longest timescale these enhanced rates may amount to M⊙ yr-1; for the shorter timescales they may be as high as 1 M⊙ yr-1 [[43]]. With a current mass-loss rate[23, 24] between and M⊙ yr-1 Betelgeuse does not (yet) seem to have entered such a phase. Pre-SN activity possibly related to instabilities in nuclear burning[44, 45] or to waves driven by vigorous core convection[46, 42] is reported for several Type IIP progenitors in the last few years before explosion[47, 48]. A minority of the type IIP/L progenitor population may, however, show visual variability of no more than 510 percent in these final years, with the possible exception of short outbursts on the time scale of months[49]. This means that some RSGs may show little or no sign of their impending core-collapse, years to weeks before it happens. Therefore, although the current mass loss behavior of Betelgeuse does not appear to forebode its demise, it remains possible that it may explode without prior warning.
References
- [1] Ekström, S. et al. Grids of stellar models with rotation. I. Models from 0.8 to 120 M&sun; at solar metallicity (Z = 0.014). \JournalTitleA&A 537, A146 (2012).
- [2] Arroyo-Torres, B. et al. What causes the large extensions of red supergiant atmospheres?. Comparisons of interferometric observations with 1D hydrostatic, 3D convection, and 1D pulsating model atmospheres. \JournalTitleA&A 575, A50 (2015).
- [3] Moriya, T. J., Förster, F., Yoon, S.-C., Gräfener, G. & Blinnikov, S. I. Type IIP supernova light curves affected by the acceleration of red supergiant winds. \JournalTitleMNRAS 476, 2840–2851 (2018).
- [4] Meynet, G. et al. Impact of mass-loss on the evolution and pre-supernova properties of red supergiants. \JournalTitleA&A 575, A60 (2015).
- [5] Harper, G. M. et al. An Updated 2017 Astrometric Solution for Betelgeuse. \JournalTitleAJ 154, 11 (2017).
- [6] Joyce, M. et al. Standing on the Shoulders of Giants: New Mass and Distance Estimates for Betelgeuse through Combined Evolutionary, Asteroseismic, and Hydrodynamic Simulations with MESA. \JournalTitleApJ 902, 63 (2020).
- [7] Guinan, E., Wasatonic, R., Calderwood, T. & Carona, D. The Fall and Rise in Brightness of Betelgeuse. \JournalTitleThe Astronomer’s Telegram 13512, 1 (2020).
- [8] Kervella, P. et al. The close circumstellar environment of Betelgeuse. II. Diffraction-limited spectro-imaging from 7.76 to 19.50 m with VLT/VISIR. \JournalTitleA&A 531, A117 (2011).
- [9] Kervella, P. et al. The close circumstellar environment of Betelgeuse. III. SPHERE/ZIMPOL imaging polarimetry in the visible. \JournalTitleA&A 585, A28 (2016).
- [10] Ohnaka, K. et al. Imaging the dynamical atmosphere of the red supergiant Betelgeuse in the CO first overtone lines with VLTI/AMBER. \JournalTitleA&A 529, A163 (2011).
- [11] Levesque, E. M. & Massey, P. Betelgeuse Just Is Not That Cool: Effective Temperature Alone Cannot Explain the Recent Dimming of Betelgeuse. \JournalTitleApJ 891, L37 (2020).
- [12] Harper, G. M., Guinan, E. F., Wasatonic, R. & Ryde, N. The Photospheric Temperatures of Betelgeuse during the Great Dimming of 2019/2020: No New Dust Required. \JournalTitleApJ 905, 34 (2020).
- [13] Dharmawardena, T. E. et al. Betelgeuse Fainter in the Submillimeter Too: An Analysis of JCMT and APEX Monitoring during the Recent Optical Minimum. \JournalTitleApJ 897, L9 (2020).
- [14] Kravchenko, K. et al. Atmosphere of Betelgeuse before and during the great dimming revealed by tomography. \JournalTitleA&A (subm.).
- [15] López Ariste, A. et al. Convective cells in Betelgeuse: imaging through spectropolarimetry. \JournalTitleA&A 620, A199 (2018).
- [16] Freytag, B., Steffen, M. & Dorch, B. Spots on the surface of Betelgeuse – Results from new 3D stellar convection models. \JournalTitleAstronomische Nachrichten 323, 213–219 (2002).
- [17] Freytag, B. et al. Simulations of stellar convection with CO5BOLD. \JournalTitleJournal of Computational Physics 231, 919–959 (2012).
- [18] Chiavassa, A., Freytag, B., Masseron, T. & Plez, B. Radiative hydrodynamics simulations of red supergiant stars. IV. Gray versus non-gray opacities. \JournalTitleA&A 535, A22 (2011).
- [19] Freytag, B., Liljegren, S. & Höfner, S. Global 3D radiation-hydrodynamics models of AGB stars. Effects of convection and radial pulsations on atmospheric structures. \JournalTitleA&A 600, A137 (2017).
- [20] Lançon, A., Hauschildt, P. H., Ladjal, D. & Mouhcine, M. Near-IR spectra of red supergiants and giants. I. Models with solar and with mixing-induced surface abundance ratios. \JournalTitleA&A 468, 205–220 (2007).
- [21] Dullemond, C. P. et al. RADMC-3D: A multi-purpose radiative transfer tool (2012). 1202.015.
- [22] Mauron, N. & Josselin, E. The mass-loss rates of red supergiants and the de Jager prescription. \JournalTitleA&A 526, A156 (2011).
- [23] De Beck, E. et al. Probing the mass-loss history of AGB and red supergiant stars from CO rotational line profiles. II. CO line survey of evolved stars: derivation of mass-loss rate formulae. \JournalTitleA&A 523, A18 (2010).
- [24] Dolan, M. M. et al. Evolutionary Tracks for Betelgeuse. \JournalTitleApJ 819, 7 (2016).
- [25] Cotton, D. V., Bailey, J., Horta, A. D., Norris, B. R. M. & Lomax, J. R. Multi-band Aperture Polarimetry of Betelgeuse during the 2019-20 Dimming. \JournalTitleResearch Notes of the American Astronomical Society 4, 39 (2020).
- [26] Safonov, B. et al. Differential Speckle Polarimetry of Betelgeuse in 2019-2020: the rise is different from the fall. \JournalTitlearXiv e-prints arXiv:2005.05215 (2020).
- [27] Stothers, R. B. Giant Convection Cell Turnover as an Explanation of the Long Secondary Periods in Semiregular Red Variable Stars. \JournalTitleApJ 725, 1170–1174 (2010).
- [28] Dupree, A. K. et al. Spatially Resolved Ultraviolet Spectroscopy of the Great Dimming of Betelgeuse. \JournalTitleApJ 899, 68 (2020).
- [29] Höfner, S. & Freytag, B. Exploring the origin of clumpy dust clouds around cool giants. A global 3D RHD model of a dust-forming M-type AGB star. \JournalTitleA&A 623, A158 (2019).
- [30] Boulangier, J., Gobrecht, D., Decin, L., de Koter, A. & Yates, J. Developing a self-consistent AGB wind model - II. Non-classical, non-equilibrium polymer nucleation in a chemical mixture. \JournalTitleMNRAS 489, 4890–4911 (2019).
- [31] Fadeev, I. A. Carbon dust formation in R Coronae Borealis stars. \JournalTitleMNRAS 233, 65–78 (1988).
- [32] Ohnaka, K. Imaging the outward motions of clumpy dust clouds around the red supergiant Antares with VLT/VISIR. \JournalTitleA&A 568, A17 (2014).
- [33] Scicluna, P. et al. Large dust grains in the wind of VY Canis Majoris. \JournalTitleA&A 584, L10 (2015).
- [34] Kervella, P. et al. The close circumstellar environment of Betelgeuse. Adaptive optics spectro-imaging in the near-IR with VLT/NACO. \JournalTitleA&A 504, 115–125 (2009).
- [35] O’Gorman, E. et al. CARMA CO(J = 2 - 1) Observations of the Circumstellar Envelope of Betelgeuse. \JournalTitleAJ 144, 36 (2012).
- [36] Decin, L. et al. The enigmatic nature of the circumstellar envelope and bow shock surrounding Betelgeuse as revealed by Herschel. I. Evidence of clumps, multiple arcs, and a linear bar-like structure. \JournalTitleA&A 548, A113 (2012).
- [37] Kervella, P. et al. The close circumstellar environment of Betelgeuse. V. Rotation velocity and molecular envelope properties from ALMA. \JournalTitleA&A 609, A67 (2018).
- [38] Humphreys, R. M., Helton, L. A. & Jones, T. J. The Three-Dimensional Morphology of VY Canis Majoris. I. The Kinematics of the Ejecta. \JournalTitleAJ 133, 2716–2729 (2007).
- [39] Smith, N., Hinkle, K. H. & Ryde, N. Red Supergiants as Potential Type IIn Supernova Progenitors: Spatially Resolved 4.6 m CO Emission Around VY CMa and Betelgeuse. \JournalTitleAJ 137, 3558–3573 (2009).
- [40] Dupree, A., Guinan, E., Thompson, W. T. & STEREO/SECCHI/HI Consortium. Photometry of Betelgeuse with the STEREO Mission While in the Glare of the Sun from Earth. \JournalTitleThe Astronomer’s Telegram 13901, 1 (2020).
- [41] Sigismondi, C. et al. Second dust cloud on Betelgeuse. \JournalTitleThe Astronomer’s Telegram 13982, 1 (2020).
- [42] Fuller, J. Pre-supernova outbursts via wave heating in massive stars - I. Red supergiants. \JournalTitleMNRAS 470, 1642–1656 (2017).
- [43] Smith, N. et al. Endurance of SN 2005ip after a decade: X-rays, radio and H like SN 1988Z require long-lived pre-supernova mass-loss. \JournalTitleMNRAS 466, 3021–3034 (2017).
- [44] Smith, N. & Arnett, W. D. Preparing for an Explosion: Hydrodynamic Instabilities and Turbulence in Presupernovae. \JournalTitleApJ 785, 82 (2014).
- [45] Woosley, S. E. & Heger, A. The Remarkable Deaths of 9-11 Solar Mass Stars. \JournalTitleApJ 810, 34 (2015).
- [46] Quataert, E. & Shiode, J. Wave-driven mass loss in the last year of stellar evolution: setting the stage for the most luminous core-collapse supernovae. \JournalTitleMNRAS 423, L92–L96 (2012).
- [47] Yaron, O. et al. Confined dense circumstellar material surrounding a regular type II supernova. \JournalTitleNature Physics 13, 510–517 (2017).
- [48] Andrews, J. E. et al. SN 2007od: A Type IIP Supernova with Circumstellar Interaction. \JournalTitleApJ 715, 541–549 (2010).
- [49] Johnson, S. A., Kochanek, C. S. & Adams, S. M. The quiescent progenitors of four Type II-P/L supernovae. \JournalTitleMNRAS 480, 1696–1704 (2018).
Methods
VLT/SPHERE-ZIMPOL observations
The resolved images were obtained through the Spectro-Polarimetric High-contrast Exoplanet REsearch (SPHERE\citeS2019A&A…631A.155B) instrument, mounted on the third unit telescope of ESO’s Very Large Telescope (VLT). More precisely, we used one of its sub-systems: the Zurich IMaging POLarimeter (ZIMPOL\citeS2014SPIE.9147E..3WR). We observed Betelgeuse and a point spread function (PSF) calibrator, Rigel in the polarimetric P2 mode of ZIMPOL on December 31st 2018, December 26th 2019, January 27th 2020, March 18th and 20th 2020. With an angular diameter of mas, Rigel\citeS2010A&A…521A…5C is well below the resolving power of ZIMPOL (24 mas). Both stars were observed with several filters. The log of the observations is presented in Extended Data Table 1. We used the publicly available ESOreflex/SPHERE pipeline (v 0.38.0) to reduce the data and custom python routines\citeS2015A&A…578A..77K to produce the observables. This enabled us to derive the total intensity I, the polarized flux P, the degree of linear polarization DoLP, and the polarization electric-vector position angle . The plate scale was mas per pixel. The averaged beam size of the ZIMPOL observations was 24 milliarcseconds (mas) or 1.14 times Betelgeuse’s radius. We performed a flux calibration of the ZIMPOL data using Rigel as a flux reference. However, the result showed discrepancies between the different filters and with the AAVSO measurements for the V filter (Extended Data Figure 1). We suspect that the issue results from the uncertainty on the transmission of the neutral densities used for the observations. Images at each epoch were deconvolved using the PyRAF111Available at https://astroconda.readthedocs.io/en/latest/ implemented Richardson-Lucy deconvolution algorithm, with Rigel as a measurement of the PSF. To avoid producing deconvolution artifacts, only 10 iterations were used on each frame. The result is visible on Fig. 2 and Extended Data Figure 3.
VLT/SPHERE-IRDIS observations
We used the sparse aperture masking (SAM) mode\citeS2016SPIE.9907E..2TC available on the Infrared Dual-band Imager and Spectrograph (IRDIS\citeS2008SPIE.7014E..3LD), another subsystem of SPHERE, to complement the GRAVITY observations. SAM uses a pupil mask with holes placed in a non-redundant configuration, designed to turn the single dish telescope to an array of seven diameter circular sub-apertures. Here the goal was to obtain interferometric measurements well within the first lobe of the visibility function to complement the VLTI/GRAVITY observations. Observations were taken in pupil tracking mode, with the SPHERE 7 holes masks, using two filters: NB_CO and NB_CntK2 ( 2,290 and 2,266 nm respectively, with FWHM of 33 and 33 nm). The log of the observations is presented in Extended Data Table 1. The data were reduced through the SPHERE data center\citeS2017sf2a.conf..347D applying the appropriate calibrations following the data reduction and handling pipeline\citeS2008SPIE.7019E..39P to correct for bad pixels, dark current, flat field, and sky background. Each frame is normalized in flux and the corresponding parallactic angle is calculated. We then centered each image at the central lobe of the interferogram (using a 2D-Gaussian fit), cropped the images around this center, and manually sorted out the images of the cube to remove the bad frames with notable smearing or other source of error such as residual bad pixels.
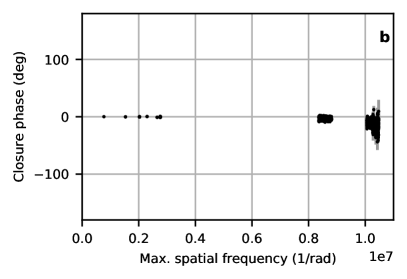
From the temporal cube of interferograms, the observables were extracted using a dedicated aperture masking data reduction software. The interferometric fringes created by each baseline of the non-redundant mask were fitted directly on the image plane \citeS2011A&A…532A..72L, 2015ApJ…798…68G. Our pipeline does the model fitting of the fringes using Single Value Decomposition (SVD), only the core of the interferogram is fitted, and the software includes a bandwidth smearing correction. From the amplitude and phase of the fringes squared visibilities and closure phases were obtained. Each frame in the data cubes were analyzed independently. Subsequently, the mean and standard deviation (s.d.) of the observables per data cube were computed. The mean observables were calibrated using the aperture masking observations of the point-like reference stars reported in Extended Data Table 1. Finally, the different data sets per wavelengths were averaged into a unique OIFITS file that is used for the scientific analysis.
VLTI/GRAVITY observations
Betelgeuse and its interferometric calibrators were observed with GRAVITY\citeS2017A&A…602A..94G using the compact configuration (stations A0-B2-D0-C1) of the auxiliary telescopes (AT) of the VLT Interferometer (VLTI). We used the high spectral resolution ( = 4,000) and dual polarization mode in order to accommodate for the brightness of Betelgeuse in the K band. The angular resolution reached was 14 mas. The log of the observations is given in Extended Data Table 2. The data were reduced and calibrated through the ESOreflex pipeline in its version 1.2.4. We adopted the angular diameters of mas for 56 Ori, and mas for HD 44945 from the JMMC catalog\citeS2016yCat.2345….0D. After the initial calibration, the two polarizations were averaged.
Angular diameter determination
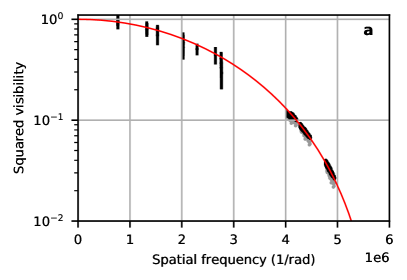
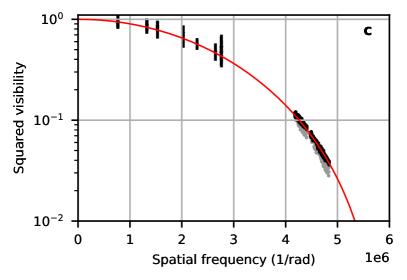
The VLTI/GRAVITY and VLT/SPHERE-IRDIS SAM observations give us the squared visibility and closure phase as a function of the spatial frequency (sf = B/ with B the baseline length and the wavelength). To estimate the angular diameter of the star, we built two datasets. The first one contains the data before the dimming (IRDIS of 2019-01-01 and GRAVITY of 2019-01-29), and the second one during the Great Dimming (IRDIS of 2019-12-27 and GRAVITY of 2020-02-14). As we do not expect the angular size of the star to change significantly on a scale of weeks, the time difference between the IRDIS and GRAVITY data of each set is negligible. We selected continuum data (CntK2 filter of the IRDIS observations and the range m for the GRAVITY data), thus excluding CO and water vapor absorption bands. Additionally we excluded some weak atomic and molecular absorption lines in the K band pseudo-continuum\citeS2019A&A…621A…6O. The angular diameter determination was done by fitting a uniform disk (UD) model to the squared visibility data only. This model seems initially justified by the limited deviation from a centro-symmetric model in the closure phase (Extended Data Figure 4) at low spatial frequency (for a centro-symmetric model, the closure phase should remain at 0∘ or 180∘). To avoid contamination by small scale structures, we limited the fit to the first lobe of visibility only (sf rad-1). We estimated the angular diameter of Betelgeuse to be: before its dimming (January 2019) mas (reduced ), and during the dimming (December 2019 and February 2020) to mas (reduced ). Fitting a limb-darkened disk does not provide any further improvement and does not change significantly the angular diameter value. Therefore, since we are only interested in the angular diameter variation between the two epochs, we retain the UD fit reasonable for the first lobe of the data in the continuum.
Pre-existing dust extinction
From previous studies[8],\citeS2009A&A…498..127V, it is known that the circumstellar environment of Betelgeuse contains dust in an envelope around the star itself; this does not imply, however, that the dust is present in a homogeneous way. Before looking at the extinction caused by the Great Dimming, we need to assess the amount of dust that was already in the line of sight, whether from circumstellar or interstellar origin. Therefore, we took into account the AAVSO V, J and H band magnitude measurements obtained before the Dimming started, simultaneously with our January 2019 SPHERE observations. The AAVSO errorbars have been re-estimated from 0.01 mag mostly to 0.1 mag to take into account the uncertainty on the calibrator star magnitudes. A possibility to model the already present circumstellar dust extinction is to include a spherical envelope around the star in a radiative transfer simulation. However, in order to limit the number of parameters, we decided instead to fit the AV (extinction in the V band) that was required for the Cardelli\citeS1989ApJ…345..245C extinction law to reproduce a Phoenix[20] spectral energy distribution (SED) of a 15 M⊙ RSG. We adopted T K (following spectrophotometric measurements[11]), and (according to the literature\citeS2019A&A…627A.138A for Betelgeuse ranges from -0.32 to 0.43 with error bars up to 0.3). Since the ZIMPOL observations are performed through relatively broadband filters, we do not expect to be a sensitive parameter. Therefore, the dominant parameter in the selected SED is Teff, which is well constrained from the spectrophotometry. We adopted R following RSG prescriptions\citeS2005ApJ…634.1286M (with R AV/EB-V, EB-V being the color excess AB - AV). The result gives A.
Local photospheric cooling hypothesis
Considering the ZIMPOL images, if a dark cool spot is indeed at the origin of the Great Dimming, one cannot use a simple photospheric model to reproduce it since surfaces with different effective temperatures must coexist. To reproduce both our observations, we built a composite Phoenix model: we filled a stellar disk with a warm (normal photosphere) and a cool (anomalous patch) Phoenix photosphere[20]. The patch of cool temperature was circular with four parameters : its temperature, its radius and the coordinates (x, y) of its center. It is not allowed to expand outside the stellar disk. For each of the three epochs of the Dimming, we explored a grid of positions in the South-Western quadrant by steps of 0.5 mas. We used the same step size for the radius in the range 0 to 10 mas. We explored the temperature pairs (3,200; 3,700)K, (3,300; 3,700)K, and (3,400; 3,700)K for December 2019 and January 2020. For March 2020 we used the couples (3,200; 3700)K and (3,300; 3,800)K owing to the higher contrast between the bright and dark areas. Note that here the warm photosphere was set at 3,700 K instead of the 3,600 K measured from spectrophotometric measurements[11], since we estimated that the later value represents an average on patches with various temperature. For each point of the grid, we computed the log-likelihood () of the model image with respect to the ZIMPOL observations. The goal here was not to obtain a precise estimation of the Teff, but to assess the compatibility of such model with our images. Extended Data Figure 5 shows the best images at each wavelength for each epoch. The best parameters are summarized in Extended Data Table 3. Finally, the corresponding SEDs are plotted in Extended Data Figure 1 together with the AAVSO and ZIMPOL photometry.
Dust clump hypothesis
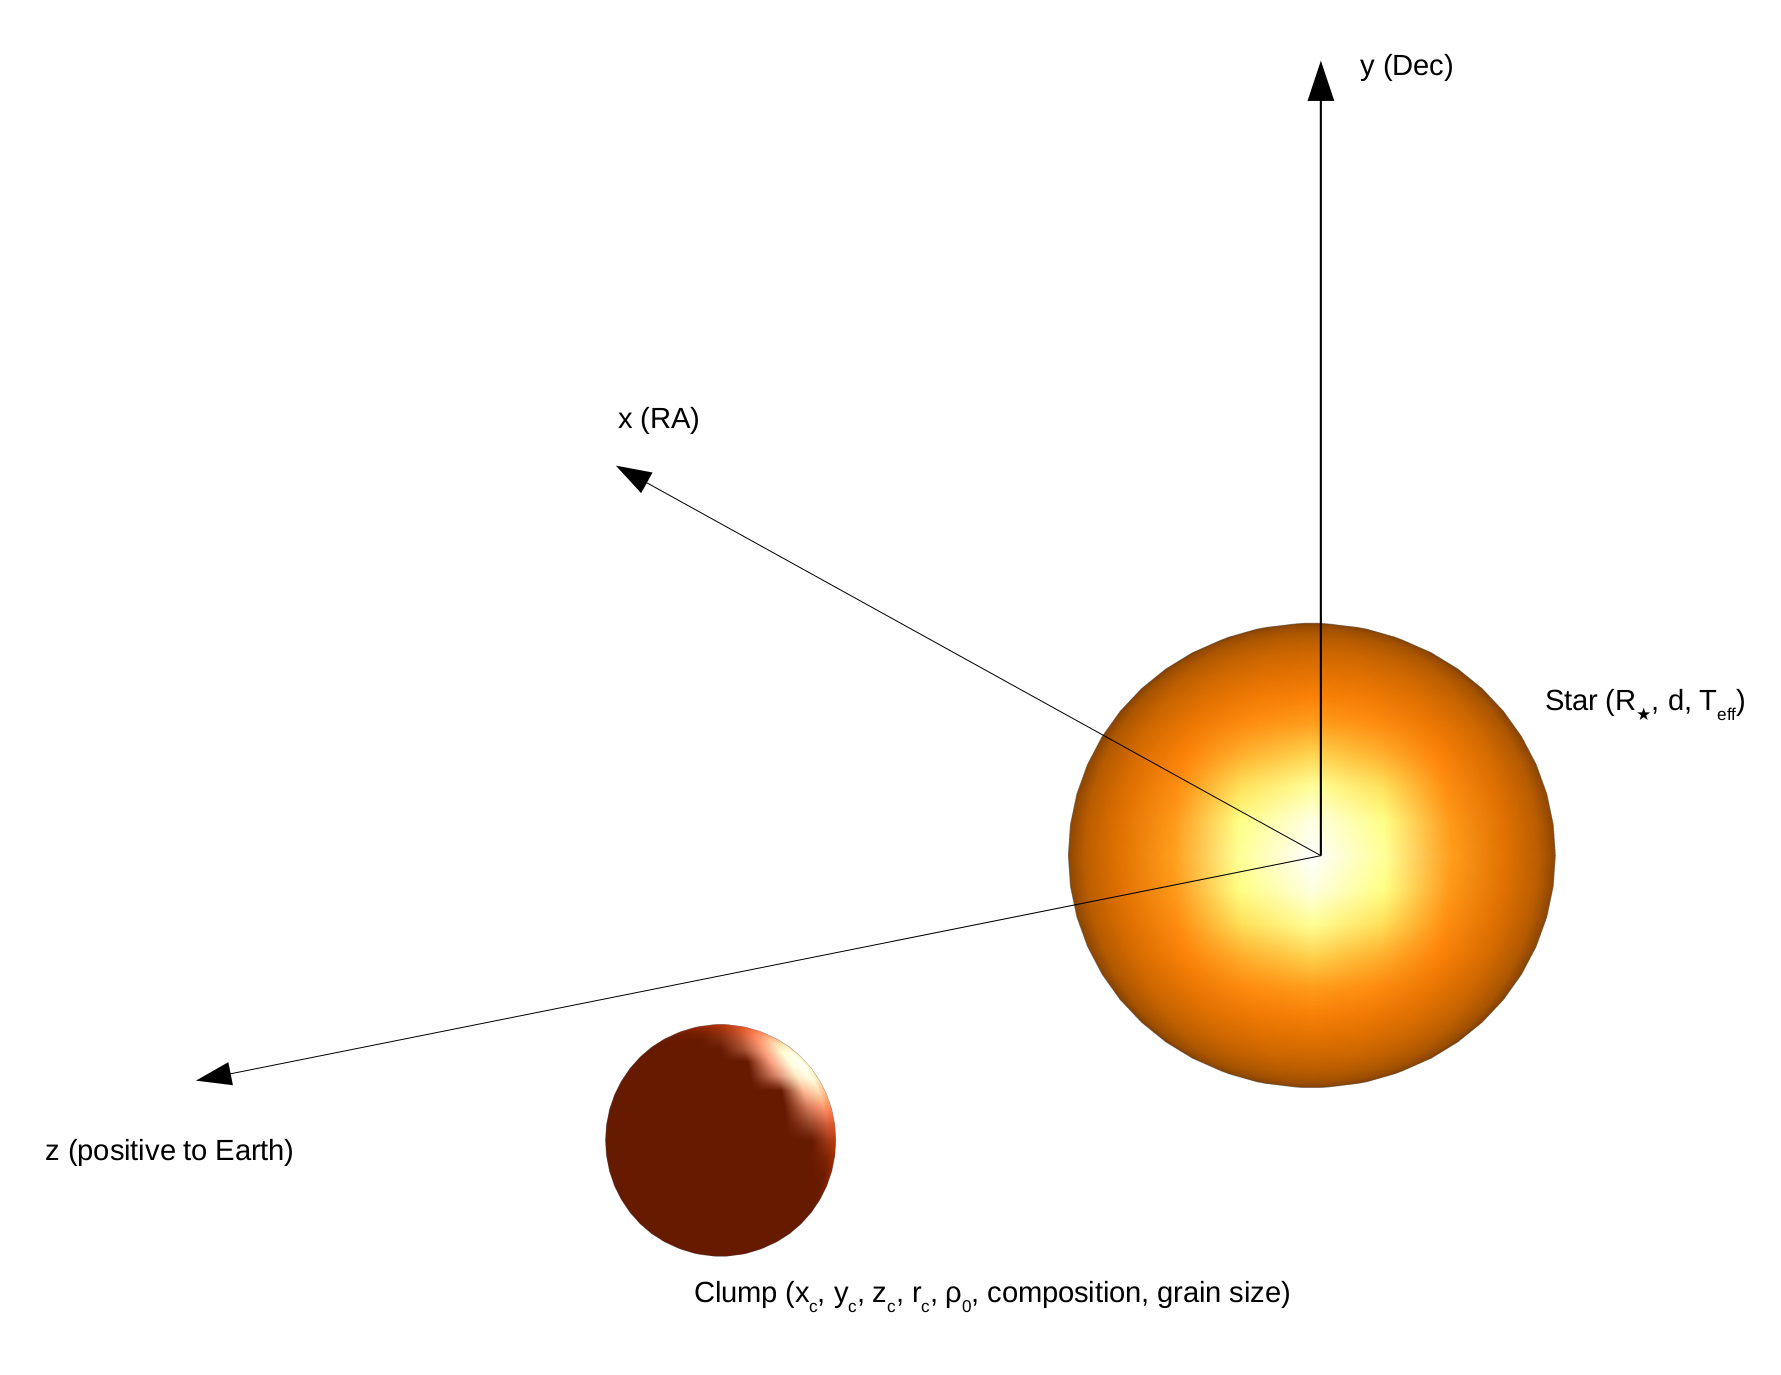
To test if the ZIMPOL images and AAVSO photometry can be reproduced by the presence of a dust clump in the line of sight to Betelgeuse, we used a simulation based on the radiative transfer code Radmc3D[21]. The general scheme (coordinate system, physical parameters) of the simulation are illustrated in Extended Data Figure 6. We used a spherical grid of points sampling radii from 5 to 50 au, longitudinal angles from 0 to and azimuthal angles from 0 to . We used five levels of adaptive mesh refinement to properly resolve the clump. For clarity, all the coordinates below will be given in the coordinate system described in Extended Data Figure 6. The star was modeled as a Phoenix photosphere[20] for a 15 M⊙ RSG of T K (3,800 K for March 2020), and according to parameters derived from spectrophotometric measurements[11]. We adopted the stellar size corresponding to the angular diameter measured with the VLT/SPHERE-IRDIS SAM and VLT/GRAVITY observations in December 2019 and January 2020, taking into account the distance[5] to the star. The dust clump was modeled as a spherical dust density centered at the coordinates (, , ), whose radius was . The dust density was constant, . To converge on the best parameters we ran a grid of Radmc3D models exploring the range of parameters for and (0 to -3 au offset, with 5 steps), (5 to 20 au offset, with 5 steps), (4 to 8 au offset, with 5 steps), and (10-19 to 10-17 g cm-3, with 5 steps logarithmically spaced). We adopted a canonical silicate composition for the dust (MgFeSiO4)\citeS1994A&A…292..641J,1995AA…300..503D. The sublimation temperature of this species is at about 1,500 K, implying that for solutions that place the center of the clump at about 11 au part of the spherical clump volume that is closest to the star is devoid of this species. However, in at least the outer half of the dusty sphere silicates can exist already at a clump center distance of 11 au. This differentiation of the chemical composition inside of the clump does not impact our results (other than the actual dust distribution inside of the dusty clump). The grain size distribution is centered at 0.21 m (ranging from 0.18 to 0.24 m), chosen to have the maximum dimming effect in the visible range (among distributions centered at 0.1, 0.21, 0.5, and 1 m, using comparisons with spectra and images). The dust opacity parameters were computed using RADMC3D’s dedicated python module based on Mie theory. The shape of the dust particles is assumed to be spherical since we are not interested in reproducing the polarized signal, the Gaussian grain size distribution was smeared out by 5 % to avoid resonant effects. We refined these 3,125 models after a first iteration by adding two points to each parameter, surrounding the initial optimization. This lead to a total of 6,250 models. The best model was found by computing the log-likelihood for each point of the grid with respect to the ZIMPOL images. For January and March 2020 such a grid proved inefficient in finding a good enough combination of the parameters. Both January 2020 and March 2020 models are not optimized and are only best guesses. The best parameters are summarized in Extended Data Table 3, the best images in each ZIMPOL filters are presented in Extended Data Figure 7 and the best SED is plotted on Extended Data Figure 1.
References
- [1]
- [2] Beuzit, J. L. et al. SPHERE: the exoplanet imager for the Very Large Telescope. \JournalTitleA&A 631, A155 (2019).
- [3] Roelfsema, R. et al. The ZIMPOL high contrast imaging polarimeter for SPHERE: system test results, vol. 9147 of Society of Photo-Optical Instrumentation Engineers (SPIE) Conference Series, 91473W (2014).
- [4] Chesneau, O. et al. Time, spatial, and spectral resolution of the H line-formation region of Deneb and Rigel with the VEGA/CHARA interferometer. \JournalTitleA&A 521, A5 (2010).
- [5] Kervella, P. et al. The dust disk and companion of the nearby AGB star L2 Puppis. SPHERE/ZIMPOL polarimetric imaging at visible wavelengths. \JournalTitleA&A 578, A77 (2015).
- [6] Cheetham, A. C. et al. Sparse aperture masking with SPHERE. In Optical and Infrared Interferometry and Imaging V, vol. 9907 of Society of Photo-Optical Instrumentation Engineers (SPIE) Conference Series, 99072T (2016).
- [7] Dohlen, K. et al. The infra-red dual imaging and spectrograph for SPHERE: design and performance, vol. 7014 of Society of Photo-Optical Instrumentation Engineers (SPIE) Conference Series, 70143L (2008).
- [8] Delorme, P. et al. The SPHERE Data Center: a reference for high contrast imaging processing. In Reylé, C. et al. (eds.) SF2A-2017: Proceedings of the Annual meeting of the French Society of Astronomy and Astrophysics, Di (2017). 1712.06948.
- [9] Pavlov, A. et al. SPHERE data reduction and handling system: overview, project status, and development, vol. 7019 of Society of Photo-Optical Instrumentation Engineers (SPIE) Conference Series, 701939 (2008).
- [10] Lacour, S. et al. Sparse aperture masking at the VLT. I. Faint companion detection limits for the two debris disk stars HD 92945 and HD 141569. \JournalTitleA&A 532, A72 (2011).
- [11] Greenbaum, A. Z., Pueyo, L., Sivaramakrishnan, A. & Lacour, S. An Image-plane Algorithm for JWST’s Non-redundant Aperture Mask Data. \JournalTitleApJ 798, 68 (2015).
- [12] Gravity Collaboration et al. First light for GRAVITY: Phase referencing optical interferometry for the Very Large Telescope Interferometer. \JournalTitleA&A 602, A94 (2017).
- [13] Duvert, G. VizieR Online Data Catalog: JMDC : JMMC Measured Stellar Diameters Catalogue (Duvert, 2016). \JournalTitleVizieR Online Data Catalog II/345 (2016).
- [14] Ohnaka, K., Hadjara, M. & Maluenda Berna, M. Y. L. Spatially resolving the atmosphere of the non-Mira-type AGB star SW Vir in near-infrared molecular and atomic lines with VLTI/AMBER. \JournalTitleA&A 621, A6 (2019).
- [15] Verhoelst, T. et al. The dust condensation sequence in red supergiant stars. \JournalTitleA&A 498, 127–138 (2009).
- [16] Cardelli, J. A., Clayton, G. C. & Mathis, J. S. The Relationship between Infrared, Optical, and Ultraviolet Extinction. \JournalTitleApJ 345, 245 (1989).
- [17] Arentsen, A. et al. Stellar atmospheric parameters for 754 spectra from the X-shooter Spectral Library. \JournalTitleA&A 627, A138 (2019).
- [18] Massey, P. et al. The Reddening of Red Supergiants: When Smoke Gets in Your Eyes. \JournalTitleApJ 634, 1286–1292 (2005).
- [19] Jaeger, C., Mutschke, H., Begemann, B., Dorschner, J. & Henning, T. Steps toward interstellar silicate mineralogy. 1: Laboratory results of a silicate glass of mean cosmic composition. \JournalTitleA&A 292, 641–655 (1994).
- [20] Dorschner, J., Begemann, B., Henning, T., Jaeger, C. & Mutschke, H. Steps toward interstellar silicate mineralogy. II. Study of Mg-Fe-silicate glasses of variable composition. \JournalTitleA&A 300, 503 (1995).
- [21] Tange, O. GNU Parallel 2018 (Ole Tange, 2018).
- [22] Pérez, F. & Granger, B. E. IPython: a System for Interactive Scientific Computing. \JournalTitleComputing in Science and Engineering 9, 21–29 (2007).
- [23] van der Walt, S., Colbert, S. C. & Varoquaux, G. The NumPy Array: A Structure for Efficient Numerical Computation. \JournalTitleComputing in Science Engineering 13, 22–30 (2011).
- [24] Hunter, J. D. Matplotlib: A 2D graphics environment. \JournalTitleComputing In Science & Engineering 9, 90–95 (2007).
- [25] Virtanen, P. et al. SciPy 1.0: Fundamental Algorithms for Scientific Computing in Python. \JournalTitleNature Methods 17, 261–272 (2020).
- [26] pandas development team, T. pandas-dev/pandas: Pandas (2020).
- [27] Wes McKinney. Data Structures for Statistical Computing in Python. In Stéfan van der Walt & Jarrod Millman (eds.) Proceedings of the 9th Python in Science Conference, 56 – 61 (2010).
- [28] Astropy Collaboration et al. Astropy: A community Python package for astronomy. \JournalTitleA&A 558, A33 (2013).
Data availability
Raw data were generated at the European Southern Observatory under ESO programs 0102.D-0240(A), 0102.D-0240(D), 104.20UZ, and 104.20V6.004. Derived data supporting the findings of this study are available at CDS via anonymous ftp to cdsarc.u-strasbg.fr (130.79.128.5) or via http://cdsarc.u-strasbg.fr/viz-bin/qcat?J/other/Nat (for the VLT/SPHERE-ZIMPOL images), and at the OiDB (for the VLTI/GRAVITY and VLT/SPHERE-IRDIS SAM observations)
Code availability
The SPHERE and GRAVITY pipelines are available on the ESO website: http://www.eso.org/sci/software/pipelines/index.html. The Radmc3D code is publicly available online: https://github.com/dullemond/radmc3d-2.0.
Acknowledgments
We acknowledge with thanks the variable star observations from the AAVSO International Database contributed by observers worldwide and used in this research.
This project has received funding from the European Union’s Horizon 2020 research and innovation program under the Marie Skłodowska-Curie Grant agreement No. 665501 with the research Foundation Flanders (FWO) ([PEGASUS]2 Marie Curie fellowship 12U2717N awarded to M.M.).
EC acknowledges funding from the KU Leuven C1 grant MAESTRO C16/17/007.
LD and MM acknowledge support from the ERC consolidator grant 646758 AEROSOL.
SK acknowledges support from the ERC starting grant 639889 ImagePlanetFormDiscs.
The material is based upon work supported by NASA under award number 80GSFC17M0002.
We are grateful to the ESO staff for their fast response in accepting the DDT proposal and carrying out the observations.
The authors would like to thank Betelgeuse for having undergone this peculiar event more than 700 years ago in the appropriate solid angle.
This work has made use of the SPHERE Data Center, jointly operated by OSUG/IPAG (Grenoble), PYTHEAS/LAM/CeSAM (Marseille), OCA/Lagrange (Nice) and Observatoire de Paris/LESIA (Paris).
This research has made use of the Jean-Marie Mariotti Center Aspro and SearchCal services222Available at http://www.jmmc.fr.
We used the SIMBAD and VIZIER databases at the CDS, Strasbourg (France)333Available at http://cdsweb.u-strasbg.fr/, and NASA’s Astrophysics Data System Bibliographic Services.
This research made use of GNU Parallel\citeStange_ole_2018_1146014, IPython\citeSPER-GRA:2007, Numpy\citeS5725236, Matplotlib\citeSHunter:2007, SciPy\citeS2020SciPy-NMeth, Pandas\citeSreback2020pandas,mckinney-proc-scipy-2010, Astropy444Available at http://www.astropy.org/, a community-developed core Python package for Astronomy\citeS2013A&A…558A..33A, and Uncertainties555Available at http://pythonhosted.org/uncertainties/: a Python package for calculations with uncertainties.
Author contributions
MM wrote the observing proposals, prepared all the observations, reduced and calibrated the ZIMPOL and GRAVITY data, ran the Phoenix and Radmc3D simulations, made all the figures of the article and is the main contributor to the text. EC cross checked the Radmc3D modeling. EL, JSB, and FC reduced the SPHERE-IRDIS data. AdK and LD wrote the discussion and conclusion of the main paper. All co-authors substantially contributed to the discussion, writing and revisions of the article.
Author information
Correspondence to M. Montargès.
Competing interest statement
The authors declare no competing interests.
Extended data
| VLT/SPHERE-ZIMPOL log | |||||||||
| Date | Time (UT) | Target | Filter 1 | Filter 2 | ND | DIT (s) | NDIT | Airmass | Seeing (") |
| 2019-01-01 | 01:58 | Betelgeuse | Cnt_H | B_H | ND_1 | 2 | 6 | 1.367 | 0.67 |
| 02:26 | Rigel | Cnt_H | B_H | ND_1 | 1 | 10 | 1.065 | 0.56 | |
| 04:00 | Betelgeuse | V | V | ND_2 | 1.1 | 6 | 1.179 | 0.54 | |
| 04:14 | Rigel | V | V | ND_2 | 1.1 | 6 | 1.076 | 0.5 | |
| 04:30 | Betelgeuse | KI | Cnt_820 | ND_2 | 3 | 6 | 1.194 | 0.77 | |
| 04:48 | Betelgeuse | TiO_717 | Cnt_748 | ND_2 | 6 | 6 | 1.213 | 0.72 | |
| 05:25 | Rigel | KI | Cnt_820 | ND_2 | 6 | 6 | 1.233 | 0.67 | |
| 05:39 | Rigel | TiO_717 | Cnt_748 | ND_2 | 3 | 6 | 1.274 | 0.54 | |
| 2019-12-27 | 03:27 | Betelgeuse | B_H | Cnt_H | ND_1 | 1 | 50 | 1.208 | 0.52 |
| 03:46 | Rigel | B_H | Cnt_H | ND_2 | 1 | 20 | 1.044 | 0.43 | |
| 2020-01-28 | 02:00 | Betelgeuse | B_H | Cnt_H | ND_1 | 5 | 20 | 1.18 | 0.83 |
| 02:15 | Betelgeuse | V | V | ND_2 | 5 | 20 | 1.179 | 0.84 | |
| 02:45 | Rigel | B_H | Cnt_H | ND_2 | 4 | 16 | 1.098 | 0.55 | |
| 03:04 | Rigel | V | V | ND_4 | 4 | 16 | 1.132 | 0.64 | |
| 03:21 | Betelgeuse | KI | Cnt_H | ND_2 | 5 | 8 | 1.241 | 0.69 | |
| 03:33 | Betelgeuse | TiO_717 | Cnt_748 | ND_4 | 4 | 8 | 1.266 | 0.69 | |
| 03:45 | Rigel | KI | Cnt_820 | ND_2 | 6 | 8 | 1.242 | 0.59 | |
| 03:57 | Rigel | TiO_717 | Cnt_748 | ND_2 | 3 | 8 | 1.283 | 0.58 | |
| 2020-03-18 | 23:49 | Betelgeuse | KI | Cnt_820 | ND_2 | 2 | 20 | 1.223 | 0.74 |
| 23:39 | Betelgeuse | TiO_717 | Cnt_748 | ND_2 | 2 | 16 | 1.239 | 0.86 | |
| 2020-03-19 | 00:16 | Rigel | KI | Cnt_820 | ND_2 | 4 | 12 | 1.213 | 0.78 |
| 00:26 | Rigel | TiO_717 | Cnt_748 | ND_2 | 2 | 12 | 1.248 | 0.62 | |
| 2020-03-21 | 00:10 | Rigel | B_H | Cnt_H | ND_2 | 4 | 14 | 1.218 | 0.75 |
| 00:27 | Rigel | V | V | ND_4 | 20 | 6 | 1.28 | 0.73 | |
| 00:53 | Betelgeuse | B_H | Cnt_H | ND_2 | 5 | 18 | 1.42 | 0.38 | |
| 01:11 | Betelgeuse | V | V | ND_2 | 4 | 22 | 1.509 | 0.43 | |
| VLT/SPHERE-IRDIS log | |||||||||
| Date | Time (UT) | Target | Filter | ND | NDIT | DIT | Airmass | Seeing (") | |
| 2019-01-01 | 00:39 | 02 Ori | NB_CntK2 | NO | 100 | 4.0 | 1.745 | 0.76 | |
| 00:49 | 02 Ori | NB_CO | NO | 100 | 4.0 | 1.670 | 0.71 | ||
| 01:15 | Betelgeuse | NB_CntK2 | ND_3.5 | 20 | 4.0 | 1.575 | 0.53 | ||
| 01:17 | Betelgeuse | NB_CO | ND_3.5 | 20 | 4.0 | 1.557 | 0.55 | ||
| 01:33 | 56 Ori | NB_CntK2 | NO | 20 | 0.837 | 1.365 | 0.68 | ||
| 01:35 | 56 Ori | NB_CO | NO | 20 | 0.837 | 1.358 | 0.68 | ||
| 2019-12-27 | 04:35 | 56 Ori | NB_CO | NO | 100 | 0.837 | 1.122 | 0.39 | |
| 04:39 | 56 Ori | NB_CntK2 | NO | 100 | 0.837 | 1.124 | 0.34 | ||
| 04:05 | Betelgeuse | NB_CO | ND_3.5 | 100 | 3.0 | 1.181 | 0.33 | ||
| 04:13 | Betelgeuse | NB_CntK2 | ND_3.5 | 100 | 3.0 | 1.179 | 0.38 | ||
| Date | Time (UT) | Target | Airmass | Seeing (") |
|---|---|---|---|---|
| 2019-01-29 | 00:31 | 56 Ori | 1.214 | 0.74 |
| 00:56 | Betelgeuse | 1.239 | 0.68 | |
| 01:24 | HD 44945 | 1.194 | 0.95 | |
| 01:47 | Betelgeuse | 1.183 | 1.06 | |
| 02:14 | 56 Ori | 1.118 | 0.98 | |
| 03:14 | 56 Ori | 1.175 | 0.97 | |
| 03:36 | Betelgeuse | 1.286 | 0.94 | |
| 2020-02-14 | 00:27 | Betelgeuse | 1.195 | 0.66 |
| 00:58 | HD 44945 | 1.150 | 0.55 | |
| 01:49 | Betelgeuse | 1.185 | 0.46 | |
| 02:28 | 56 Ori | 1.204 | 0.58 |
| Phoenix composite patch | |||
| Parameter | December 2019 | January 2020 | March 2020 |
| xcenter (mas) | -7.1 | -2.4 | -28.4 |
| ycenter (mas) | -14.2 | -2.4 | -35.6 |
| radius (mas) | 23.7 | 19.0 | 45.0 |
| Thot (K) | 3,700 | 3,700 | 3,700 |
| Tcool (K) | 3,400 | 3,400 | 3,200 |
| 106 | 107 | 107 | |
| Radmc3D dusty clump | |||
| Parameter | December 2019 | January 2020 | March 2020 |
| xc (au) | -1.9 | -0.8 | -1.9 |
| yc (au) | -3.0 | -0.6 | -1.8 |
| zc (au) | 12.5 | 20.0 | 20.0 |
| r (au) | 6.5 | 5.0 | 4.5 |
| (g cm-3) | 3.2 10-19 | 4.0 10-19 | 2.0 10-18 |