Polaron-enhanced polariton nonlinearity
in lead halide perovskites
Abstract
Exciton-polaritons offer a versatile platform for realization of all-optical integrated logic gates due to the strong effective optical nonlinearity resulting from the exciton-exciton interactions.
In most of the current excitonic materials there exists a direct connection between the exciton robustness to thermal fluctuations and the strength of exciton-exciton interaction, making materials with highest levels of exciton nonlinearity applicable at cryogenic temperatures only.
Here, we show that strong polaronic effects, characteristic for perovskite materials, allow to overcome this limitation.
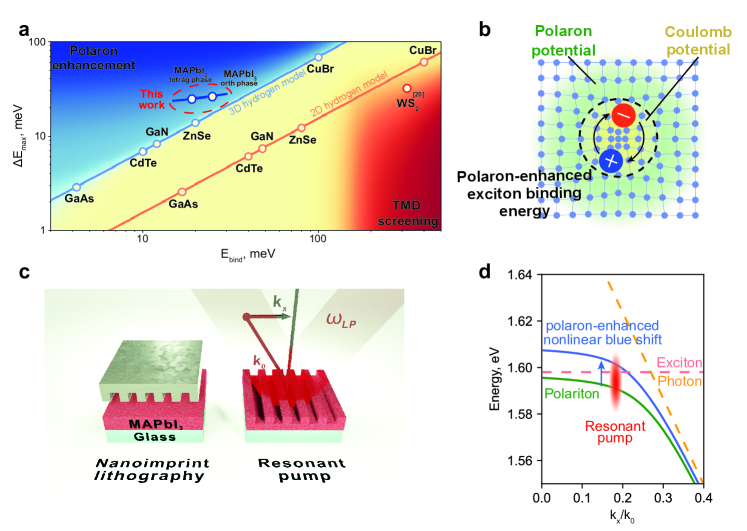
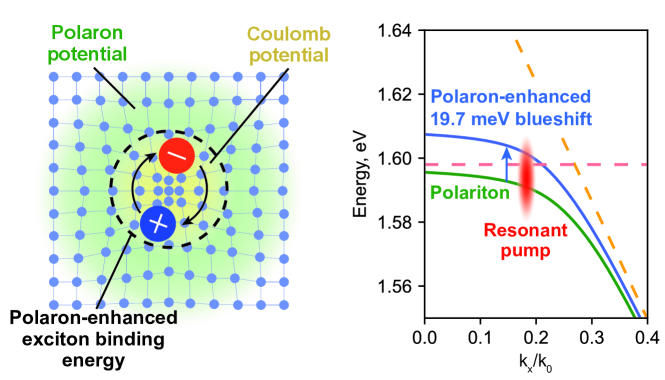
Namely, we demonstrate the record-high value of the nonlinear optical response in nanostructured organic-inorganic halide perovskite MAPbI3, experimentally detected as 19.7 meV blueshift of the polariton branch under femtosecond laser irradiation.
This is substantially higher than characteristic values for the samples based on conventional semiconductors and monolayers of transition metal dichalcogenides.
The observed strong polaron-enhanced nonlinearity exists for both tetragonal and orthorombic phases of MAPbI3, and remains stable at elevated temperatures.
Keywords: exciton-polaritons, polariton nonlinearity, perovskites, polarons
Introduction
Excitons are solid state analogs of a hydrogen atom, appearing due to the Coulomb attraction between an electron in a conduction band and a hole in a valence band. In direct bandgap semiconductors they can be created optically by resonant absorption of photons. If the energy of exciton-photon interaction exceeds all characteristic broadenings in a system, the regime of the strong light-matter coupling is achieved. It is characterized by the emergence of hybrid half-light half-matter elementary excitations, known as exciton-polaritons. To drive a system into this regime, one needs to reach an efficient confinement of electromagnetic field, which can be achieved in semiconductor microcavities [1], optical waveguides [2], photonic bound states in continuum [3] or leaky modes of photonic crystal slabs [4]. Exciton-polaritons demonstrate a set of remarkable properties, which makes them ideal candidates for both fundamental study of a variety of quantum collective phenomena [5] and modern optoelectronic applications [6]. In particular, from their photonic component they inherit extremely small effective mass and long decoherence time, while the presence of the excitonic component allows for the efficient polariton-polariton interactions, leading to the onset of the robust nonlinear optical response. The latter is experimentally revealed as a blueshift of a polariton line with the increase of a pumping power.
From technological perspective, it is clearly highly desirable to have a material platform, which combines the thermal stability of excitons and polaritons with strong degree of their optical nonlinearity. For more than a decade, the study of the nonlinear excitonic response was focused on conventional semiconductor platforms including both narrow band gap (e.g. CdTe [7] and GaAs [8, 9, 10, 11]) and wide band gap materials (e.g. GaN[12, 13, 14] and ZnO [15, 16]), where excitons are well described by the hydrogen model.
Essentially, while the blueshift per single polariton tells us about how well the nonlinear polariton systems performs at low excitation density, the maximum value of blueshift enabled by a polariton system characterises its nonlinear optical response at high density. For wide bandgap materials excitons have much smaller effective size (exciton Bohr radius), which decreases the exciton-exciton interaction constant (often referred as , and defined mostly by the processes of electron and hole exchange [17]), and thus the blueshift per polariton is reduced also. In the same time reduction of the Bohr radius substantially increases the Mott transition density. This, in general, allows to reach greater values of the maximal possible blueshift of an excitonic line.
The blueshift value can be evaluated as
| (1) |
Here is the inflection point of parabolic spectrum, defining the applicability range of Eq. (1), which is tentatively below the Mott transition density. The parameter corresponds to higher order correlations, which have an opposite sign and strongly suppress the blueshift at large densities [18].
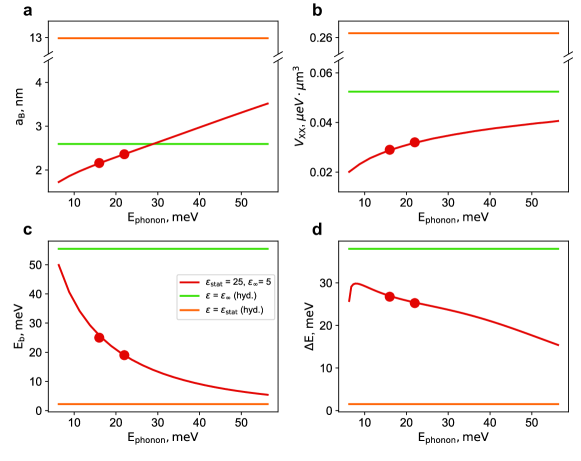
This tendency is illustrated in Fig. 1a, where linear scaling of with the exciton binding energy can be clearly seen for both the cases of bulk excitons (green line) and 2D quantum well excitons (orange line). It should be noted, that experimentally reported blueshifts are essentially smaller, than the values given by this simple estimate. This is connected with practical problems of approaching the Mott transition limit without substantial heating of the sample and other undesired side effects. The observed values of polaritonic blueshift for various materials are summarized in Table 1. Up to our knowledge, the maximal values reached so far are about 13 meV, observed in the microcavities with active media consisting on WS2 monolayers.
The further details of Coulomb interaction-induced exciton blueshift in different systems are presented in Section 4 of the Supplementary Material.
The deviation from the discussed tendency is possible, if electron-electron interaction differs substantially from the Coulomb law. One of the notorious examples of such materials are monolayer transition metal dichalcogenides (TMD), where the dimensional reduction makes an exciton state different from that described by the hydrogen model[19]. This results, among the rest, in the strong deviation (Fig. 1a) of its nonlinear behavior from the general trend [20, 3, 21]. Note, however, that from the point of view of excitonic nonlinearity the case of TMD monolayers is sub-optimal, as corresponding points lie below the line describing the case of the quantum wells of conventional semiconductors. Moreover, it is still challenging to find a way for boosting excitonic nonlinearity for 3D materials.
In turn, it is well known that hybrid halide perovskites posses strong electron-phonon interaction, which is defined by high softness of their crystalline lattice [22], see Fig. 1b. Moreover, excitons in these materials are characterized by relatively high exciton binding energy and oscillator strength[23], as well as high defect tolerance[24], which make perovskites highly prospective for studying room-temperature exciton-polariton dynamics and even Bose-Einstein condensation [25, 26, 27, 28, 29, 30]. The analysis of the corresponding nonlinearities thus seems to be an important task.
Here we present a clear experimental evidence, supported by theoretical modelling, that exciton-phonon coupling leading to the formation of exciton-polarons in hybrid halide perovskites substantially modifies exciton-exciton interaction and allows to dramatically increase nonlinear optical response, which is characterized by record high value of the polariton blueshift up to 19.7 meV, remaining robust at elevated temperatures (170 K).
| Material Group | Material | Reported blueshift [meV] | Temperature [K] | Reference |
|---|---|---|---|---|
| Semiconductor QW | GaAs | 0.6 | 8 | 31 |
| 0.8 | <10 | 32 | ||
| 2.2 | <10 | 33 | ||
| CdTe | 1.8 | 19 | 7 | |
| ZnO | 6.0 | 300 | 34 | |
| GaN | 7.5 | 300 | 35 | |
| TMD | MoSe2 | 3.0 | 127 | 21 |
| 5.0 | 7 | 3 | ||
| WS2 | 1.0 | 300 | 36 | |
| 13.0 | 300 | 37 | ||
| Polymers | BODIPY-G1 | 6.0 | 300 | 38 |
| MeLPPP | 10.5 | 300 | 39 | |
| mCherry | 12.1 | 300 | 40 | |
| Perovskites | (PEA)2PbI4 | 8.5 | 300 | 29 |
| CsPbBr3 | 9.5 | 300 | 25 | |
| CsPbCl3 | 9.5 | 300 | 28 | |
| MAPbI3 | 13.0 | 170 | This work | |
| MAPbI3 | 19.7 | 6 | This work |
Results
Fabrication of MAPbI3 photonic crystal slab
The big technological advantage of the use of halide perovskites for photonic applications [41] is the variety of low-cost wet chemistry synthesis protocols to get high-quality thin films [42], for which additional nanostructuring can be routinely carried out by such well-developed and efficient methods as nanoimprint lithography [43]. In particular, in order to achieve the strong exciton-photon coupling regime, instead of using vertical Bragg cavities to confine photons, one can realize a 1D photonic crystal slab by directly imprinting CH3NH3PbI3 (MAPbI3) film. Since perovskites have relatively high refractive index contrast with both air and glass substrate (, ), the well-localized leaky modes supported by the grating are characterized by local field enhancement enabling their strong coupling with excitons possessing high optical oscillator strength.
In the current work, thin and smooth films of MAPbI3 were fabricated by a spin-coating method in a nitrogen dry box [43]. The obtained films were patterned by means of nanoimprint lithography using periodic mold with a rectangular profile, as it is schematically shown in Fig. 1c. The resulting MAPbI3 photonic crystal slab is characterized by a thickness of 150 nm, period of nm, groves depth of 70 nm and lateral fill factor (See Section 1 of Supplementary Material).
Strong light-matter coupling regime and exciton-polariton nonlinearity
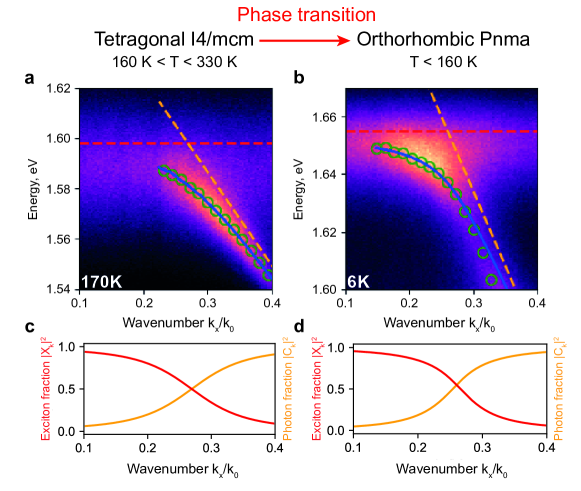
To confirm the formation of exciton-polaritons, we performed angle-resolved photoluminescence (PL) spectroscopy measurements (see "Methods") of the sample at T=170 K and T=6 K ( Fig. 2a,b), i.e. above and below the temperature of MAPbI3 phase transition () between tetragonal and orthorombic phases, respectively[44, 45]. In both high-temperature tetragonal I4/mcm and low-temperature orthorombic Pnma phases, MAPbI3 exhibits robust excitonic response, which manifests itself in the PL spectra as a broadband angle-independent peak at the energies 1598 meV and 1655 meV, respectively. As well, in both phases, the TE-polarized photonic mode exhibits clear anti-crossing with the corresponding exciton resonances. Fitting the dispersions of lower polariton branches (LPB) using coupled oscillator model [46] (Fig. 2a,b) allowed us to estimate the Rabi splitting meV and coupling strength meV for the high-temperature tetragonal phase and meV and meV for the low-temperature orthorombic phase (see "Methods" and Section 2 of Supplementary Material for the details). The extracted Hopfield coefficients and representing, respectively, the angular dependence of excitonic and photonic fractions in the polaritons are shown in Fig. 2c,d.
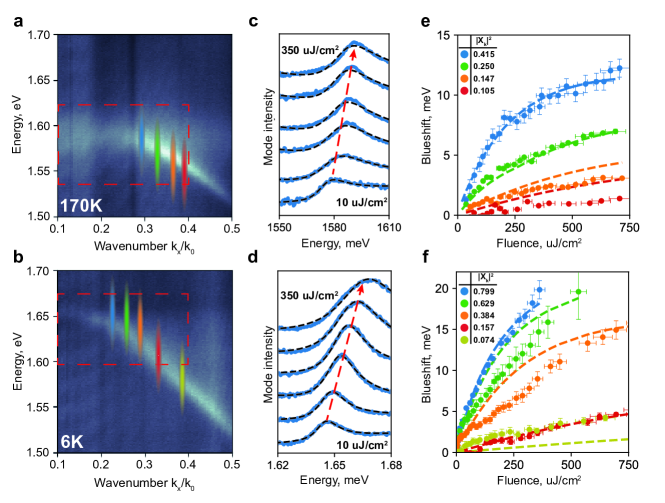
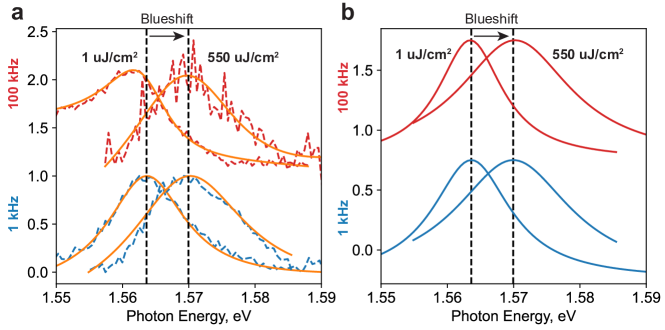
It is well known that linear excitonic response in organic-inorganic lead halide perovskites is strongly affected by the polaron effects [47, 48, 49]. It thus becomes interesting to investigate how the polaron effects will modify polariton nonlinearities. To do so, we measure the blueshifts of polariton branches in both crystal phases under resonant femtosecond-pulsed excitation depending on pump fluence and excitonic fraction in the polariton mode, defined by the angle of incidence. In the experiment, the laser pump central frequencies and angles of incidence are chosen to resonantly probe each polariton branch with different excitonic fractions, as it is shown in Fig. 4a,b. In each measurement, the spectral position of the polariton mode is extracted using Fano line shape fitting of the reflectance spectrum obtained within the spectrum of the pulse (see "Methods"). Polariton mode spectra under resonance pump with fitted Fano line shape at the lowest detuning for 170K and 6K are shown in Fig. 4c,d. The resulting fluence-dependent polariton mode blueshifts obtained at T=170 K and T=6 K for various exciton fractions are shown in Figs. 4e,f. The most pronounced blueshifts reaching to =13 meV for T=170 K and =19.7 meV for T=6 K are expectedly observed at smaller angles of incidence, corresponding to larger exciton fractions . In both cases, the fluence dependence of the blueshifts is sub-linear, clearly demonstrating the effects of the saturation similar to those reported for TMD-based samples [18].
The careful analysis of the linewidth of the polariton branch at T=6 K reveals its broadening at (see Fig. S5 in Supplementary Material). We attribute this to the exciton resonance corresponding to the tetragonal phase, which coexists with the orthorhombic Pnma phase at T=6 K in polycrystalline thin film and is weakly coupled to the photons. It gives rise to resonant absorption which leads to the reduction of the pump efficiency and, thus, the magnitude of polariton blueshifts observed for = 0.158.
Discussion
In order to unveil the physical origin of observed fluence-dependent blueshift of polariton spectrum, we develop a microscopic model of exciton-polariton response in the considered structure. Our model includes the quantum mechanical description of exciton-polaron state in MAPbI3 perovskite; the calculation of excitonic nonlinearity rates; the quantitative description of polariton gas temporal dynamics; the many-body renormalization of polariton resonance energy. As shown in Fig. 4, the calculated spectrum demonstrates an excellent agreement with experimental data. We attribute the minor deviation observed for low excitonic fractions to the uncertainty in the estimation of the Hopfield coefficients, see Section 2 of Supplementary material.
The excitonic properties of the considered material are strongly mediated by polaron effects, associated with coupling to longitudinal phonon (LO) mode [48]. Indeed, the static dielectric permittivity of MAPbI3 is [50]. In the 3D hydrogen-like model this corresponds to the exciton binding energy of about 3 meV, which makes excitons even less stable than in GaAs. In direct contradiction to this, we experimentally found the resonance energies of the exciton transition as meV in the tetragonal phase, and meV at orthorhombic phase. This is in perfect agreement with previous measurements [47], where the corresponding exciton binding energies are reported as meV, 25 meV, respectively. Fixing the high frequency dielectric permittivity , and altering the phonon energy, we reproduce these values within the Pollmann-Büttner model for exciton-polarons [51, 44]. The resulting Bohr radius is of order of nm.
The nonlinear optical response in the regime of strong light matter coupling is governed by two effects. The first one is repulsive exciton-exciton exchange interaction, which shifts the position of the excitonic mode with increase of the pump. The reduction of the Bohr radius due to the polaronic effects discussed above leads to the decrease of overlap of excitonic wavefunctons and thus to the reduction of exciton-exciton Coulomb interaction calculated within the Born approximation [17]. On the other hand, the small radius of the excitons boosts the density of Mott transition by 1-2 orders of magnitude as compared with conventional semiconductor materials, such as GaAs. In turn, this allows to reach the regime of elevated particle densities, where the strong interparticle correlations are well pronounced, and result in particular in potentially giant blueshifts (see. Fig. 1a). Thus, the polaron-induced gain in the particle density overcomes the polaron-induced reduction of the Kerr nonlinearity per particle. The second mechanism of polariton nonlinearity is associated with the composite quantum mechanical statistics of excitons, which leads to the saturation of the optical absorption and corresponding quench of the Rabi splitting. This mechanism of optical nonlinearity is inherent for exciton-polaritons and is distinct from nonlinear response emerging in the domain of other types of polaritons, such as the vibrational polaritons [53, 54, 52]. We also note, that the near-resonant excitation predominantly leads to formation of exciton-polaritons, with negligible free carrier concentration. Therefore, we neglect the other third order nonlinear effects, related to collective response of free carriers [55, 56].
Both mechanisms can be treated on the equal footing in the coupled oscillator model, which results in the following expression for the blueshift as a function of the wavevector-resolved polariton density , which can be estimated with use of the input-output formalism:
| (2) |
Here the expansion coefficients , account for both Coulomb correlations and phase space filling effects and are calculated within the coboson formalism [57, 18]. Their expressions are given in the "Methods" section. We stress that the nonlinearity associated with the phase space filling scales as and in certain conditions is comparable with the Coulomb contribution (see Section 4 of Supplementary Material). Notably, the quadratic in density term has an opposite sign as compared to the linear term, which leads to the saturation of the blueshift at elevated densities, as it is indeed in the experiment both for the tetragonal phase (Fig. 4e) and the orthorombic phase (Fig. 4f). In both cases, the reduction of blueshift with the growth of wavevector illustrated by Fig.4a,b is caused by the corresponding reduction of the exciton fraction (see Fig. 2c,d). For the orthorombic phase we report additional suppression of blueshift observed at intermediate values of wavevector (red and olive dots in Fig. 4f). We attribute this effect to the residual fraction of the tetragonal phase, having an exciton with reduced oscillator strength lying about 50 meV lower in energy. The presence of this exciton plays a parasitic role, as it becomes unintentionally excited when pumping near its resonance. The further details of theoretical treatment are given in the "Methods" section and Supplementary Material.
Conclusion and outlook
We have demonstrated the formation of the robust nonlinear polariton response in the patterned bulk hybrid halide perovskite slabs. It has been shown that polaronic effects stemming from strong exciton-phonon interaction dramatically increase the stability of the excitons in perovskites, and enhance the corresponding nonlinear optical properties. The record high value of 19.7 meV for the polariton blueshift, which is about 50 percent higher than the values for other materials, has been reported. Experimental data are in good quantitative agreement with the results of the microscopic theoretical treatment. Our research opens the route to further exploration of the phonon-mediated polariton interactions for future energy efficient and thermally stable polaritonic devices.
Methods
Sample fabrication
Film synthesis
The MAPbI3 thin film was synthesised by solvent engineering method [58]. Solution of perovskite was prepared in the nitrogen dry box in the following way: 79.5 mg of methylammonium iodide (MAI) from GreatCell Solar and 230.5 mg of Lead(II) iodide (PbI2) from TCI was dissolved in 1 ml DMF:DMSO solvent mixture in the ratio 9:1. Resulting 0.5M solution of MAPbI3 was stirred for 1 day at 27 C∘. Film fabrication was performed in a nitrogen dry box by the spin-coating method. SiO2 substrates (2525 mm) were washed with sonication in the deionized water, acetone and 2-propanol for 10 minutes consecutively, and afterwards cleaned in an oxygen plasma cleaner for 15 minutes. Perovskite solution (40 l) was deposited on the substrate and spin-coated in one step at 4000 rpm for 40 sec. At 11 second 500 L of toluene was dripped on the top of rotating substrate. Substrate with MAPbI3 at intermediate phase was placed under vacuum for 3 minutes at room temperature to evaporate the residues of the solvents and toluene.
Nanoimprint lithography
The resulting thin film was structured by the nanoimprint lithography method [59]. We used a DVD disk grating with the period 750 nm, 120 nm ridges height and the fill factor () 0.67 as a mold. The mold was cleaned in methanol and deionized water and then dried before the imprinting. The imprint process was carried out under 4.8 MPa for 10 minutes after the mold was removed. As the adhesion of SiO2 substrates was quite large after the plasma cleaning, no antiadhesive layer was needed. Imprinted perovskite samples were annealed at 100 C∘ for 10 minutes. After the nanoimprint process was finished, the perovskite nanograting was formed with negative replication of the used DVD disk mold.
Optical measurements
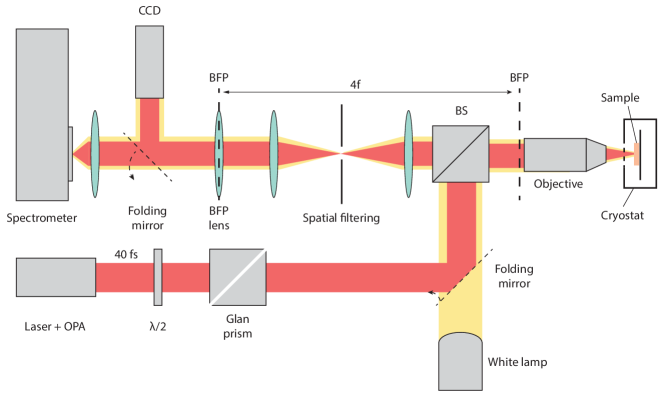
The angle-resolved reflectance spectroscopy was performed using back-focal-plane imaging setup with a slit spectrometer coupled to a liquid-nitrogen-cooled imaging CCD camera (Princeton Instruments SP2500+PyLoN) and a halogen lamp employed for the white light illumination. Angle-resolved PL measurements were performed in the same setup with off-resonant excitation by monochromatic light from a femtosecond (fs) laser (Pharos, Light Conversion) coupled with a broad-bandwidth optical parametric amplifier (Orpheus-F, Light Conversion) and compressor at the wavelength of 680 nm, 40 fs pulse duration and 100 kHz repetition rate (see Supplementary information for details). For pump-dependent reflectivity measurements, the sample was excited by 40 fs pulses from the same wavelength-tuneable laser. The angle of incidence was controlled via focusing of the laser beam within the back focal plane of the objective lens. The sample was mounted in an ultra-low-vibration closed-cycle helium cryostat (Advanced Research Systems) and maintained at a controllable temperature in the range of 7-300K. The cryostat was mounted onto a precise XYZ stage for sample positioning. Spatial filtering in the detection channel was used to avoid parasitic signals originating from the reflections from the optical elements of the setup. More details on the experimental scheme are provided in Supplementary Material Fig S4.
Fitting of experimental data
Fitting of polariton dispersions
To extract the polariton dispersions at 170K and 6K from angle-resolved photoluminescence measurements, we first subtract the uncoupled exciton photoluminescence signal from the measured spectrum at each and fit the remaining data by Lorentz peak function. Combining peak positions for all , we obtain the experimental polariton dispersion shown with empty green circles in Fig. 2a,b. The same method was used to fit the photon cavity dispersion at room temperature. Though the upper polariton branch (UPB) cannot be observed due to the band absorption, the lower polariton branch can be fitted using coupled oscillator model [46], with account for the spectral position and the linewidth of the uncoupled exciton: and those parameters of the uncoupled cavity photon mode :
| (3) |
where is the light-matter coupling strength. Resulting real part of is shown in Fig. 2a,b, imaginary part is shown in Supplementary Material Fig S5. The Rabi splitting corresponding to the spectral distance between LPB and UPB at the wavevector corresponding to the crossing of the uncoupled exciton and photon modes () can be calculated as
| (4) |
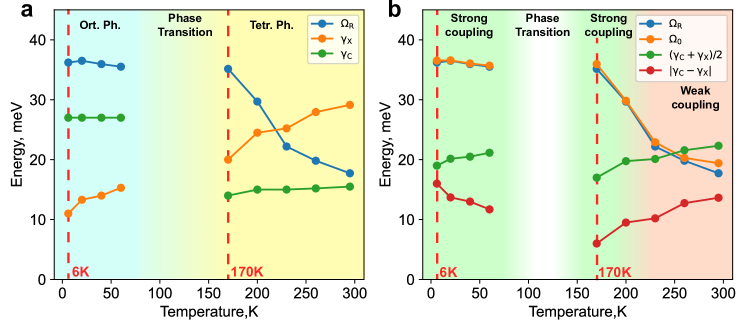
The temperature dependencies of the extracted values of , , and are shown in Fig. S12. It clearly reveals that for the studied system strong coupling criteria remain satisfied for the temperatures up to K.
Fitting of polariton blueshift under resonance pump
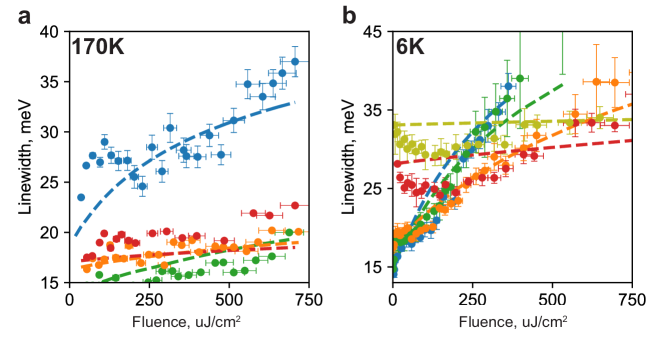
To extract the nonlinear polariton blueshifts, we measured the angle-resolved reflectance spectra in TE and TM polarization under resonant femtosecond laser pump for several detunings (visualized as colored ellipses in Fig. 4a,b). For each detuning, the reflectance spectrum in TM polarization was used as the reference, since no leaky polaritonic modes are supported in this polarization. By normalizing the TE-polarized spectrum by the TM-polarized reference for each fluence, we obtained the resonant Fano-line profiles corresponding to the lower polariton branches (see Fig. 4c,d). The changes of central frequency as functions of incident fluence, describing polariton spectral blueshifts, are shown in Fig. 4e,f. The linewidths of fitted polariton modes under resonance pump are provided in Supplementary Material Fig S6.
Model
Exciton-polarons
Due to the polar nature of metal halide perovskites, their exciton response is governed by polaron effects [48]. Their presence primarily results in the longitudinal optical (LO) phonon-induced renormalization of the single-particle bandgap, the electron and hole effective masses, and the Coulomb interaction. The coupling between the phonons and the charged particles are characterized by the dimensionless Fröhlich coupling constants:
| (5) |
where stands for bare electron [hole] mass, is the energy of LO phonon,
| (6) |
with , being the static and high frequency dielectric constants, respectively. We employ the Pollmann-Büttner model [51, 44] for exciton-polarons, solving the Schrodinger equation
| (7) |
where
| (8) |
is the dressed Coulomb interaction, and is the exciton reduced mass. Here is the elementary charge, is the vacuum permittivity, , , and are the polaron radii.
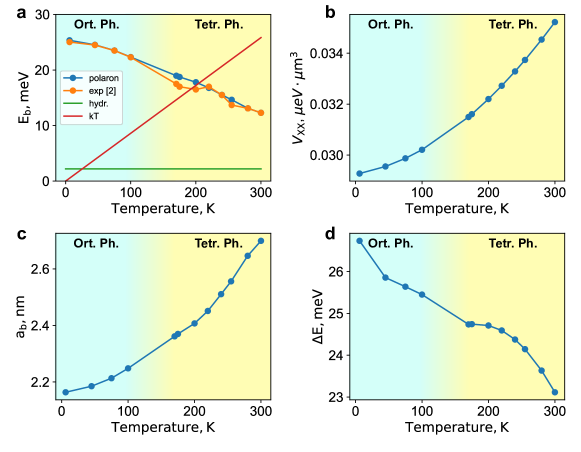
For numerical calculations, we use the values presented in the review article [48]. We set , , , , where is the free electron mass. The value of LO phonon energy meV is chosen to reproduce the previously reported [47] exciton binding energy meV at K for tetragonal () phase. The resulting exciton wave function is of hydrogenic shape, and is well fitted with , where is the Bohr radius. The corresponding value of the Bohr radius is nm. For the low temperature region K in orthorombic () phase meV is reported [47], which corresponds to meV. The resulting Bohr radius is nm. The dependence of excitonic properties on the energy of LO mode and the temperature is presented in Supplementary Material Fig S9.
Nonlinearity coefficients
The presence of the polaron effects makes MAPbI3 a unique platform for probing collective phenomena associated with bulk exciton-polaritons. Indeed, the exciton binding energy of about 20-25 meV and the Bohr radius of 2.5 nm allows the operation at elevated temperatures and high particle densities. Supplemented by pronounced interparticle correlations, this allows to reach large values of the blueshift of polariton energy. The nonlinear spectrum of the lower polariton branch is described by Eq. (2), which is obtained as Taylor decomposition of the Eq.(3) in polariton concentration up to the second order, thus accounting for the two-body and three body correlations. Both Coulomb exchange interactions between excitons and reduction of the Rabi splitting due to phase space filling effects were accounted for within the so-called coboson diagrammatic technique, developed by M. Combescot with co-authors [57]. The resulting nonlinear coefficients read (see Ref. [18] for the derivation):
| (9) |
| (10) |
We accounted for only the primary contribution of Coulomb interactions, corresponding to zero exchange momenta [60]. The explicit expressions for the calculation of Coulomb correlations , and the saturation rates , are given in Supplementary Material. We note that due to hydrogenic shape of exciton wave function the saturation factors are computed analytically and give , . The calculated values of exciton-exciton Coulomb scatterings are eVm3, eVm6. At low temperature we get eVm3, eVm6.
Dynamics
We estimate the polariton density within the input-output formalism. In the lowest order of the mean field approximation the polariton density is , where , and denotes the polariton annihilation operator. The dynamic equation for reads:
| (11) |
Here [] are the radiative [non-radiative] decay rates of lower polariton branch, is the pulse duration. is the square root of the number of photons passing through the structure per unit time per unit area, which is related to the peak incident power density , with being the pump fluence, denoting the sample length. The parameter is the exciton-exciton annihilation rate.
We numerically simulate the Eq. (11) and assume that the optical response is collected at maximal density, . The values of the parameters are given in the Supplementary Material. The resulting blueshifts of the polariton energy at K calculated via Eq. (2) are shown in Fig. 4 a, demonstrating a good agreement with experimental evidence. The only fitting parameter in our model is the exciton-exciton annihilation rate, which is fixed at .
In order to explain the behavior of the polariton blueshifts at K, we assume the presence of rudimentary tetragonal phase, clearly visible in the luminescence spectrum (see the Supplementary Material). This results in unintentional pumping of the corresponding weakly coupled exciton mode at intermediate values of wavevector. We treat such mode as an exciton reservoir. For the sake of simplicity we neglect the reservoir-induced nonlinear effects.
The full treatment would contain numerous cross-nonlinear terms between the excitons from different phases, thus overburdening the model.
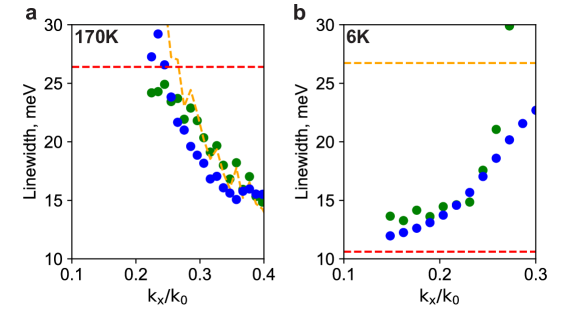
Yet, we quantify the presence of the reservoir introducing the parameter , which defines the efficiency of the pumping of the polariton branch. The exciton linewidth is extracted via decomposition of the pure polariton linewidth (see the Supplementary Material for the details). The resulting simulation of the blueshift is shown in Fig. 4 b, with and demonstrates good agreement with experiment at low wavevectors, together with reduced blueshift at higher wavevectors. We attribute the latter effect to the neglected contribution of the reservoir induced nonlinearity.
We attribute the broadening of the linewidth with increasing pump fluence to exciton-exciton annihilation. In principle such inhomogeneous broadening should be treated in self-consistent manner [17]. However, one can approximate the growth of linewidth phenomenologically as [61]:
| (12) |
where cm-3 is a variationally optimized parameter. The corresponding experimental data and theoretical fits are shown in Supplementary Material.
Acknowledgements
The experimental part of this work was funded by Russian Science Foundation, grant #21-12-00218. The theoretical part of this work carried out by V.A.S., I.V.I, and I.A.S. was partially supported by SC RA project number SCS 20RF048. I.A.S. acknowledges as well the support of the Icelandic Research Fund (Rannis), project No. 163082-051.
References
- [1] Weisbuch, C., Nishioka, M., Ishikawa, A. & Arakawa, Y. Observation of the coupled exciton-photon mode splitting in a semiconductor quantum microcavity. \JournalTitlePhysical Review Letters 69, 3314 (1992).
- [2] Ciers, J. et al. Propagating polaritons in iii-nitride slab waveguides. \JournalTitlePhys. Rev. Applied 7, 034019, DOI: 10.1103/PhysRevApplied.7.034019 (2017).
- [3] Kravtsov, V. et al. Nonlinear polaritons in a monolayer semiconductor coupled to optical bound states in the continuum. \JournalTitleLight: Science & Applications 9, 1–8 (2020).
- [4] Gogna, R., Zhang, L., Wang, Z. & Deng, H. Photonic crystals for controlling strong coupling in van der waals materials. \JournalTitleOpt. Express 27, 22700–22707, DOI: 10.1364/OE.27.022700 (2019).
- [5] Carusotto, I. & Ciuti, C. Quantum fluids of light. \JournalTitleRev. Mod. Phys. 85, 299–366, DOI: 10.1103/RevModPhys.85.299 (2013).
- [6] Liew, T. C. H., Shelykh, I. A. & Malpuech, G. Polariton devces. \JournalTitlePhysica E 43, 1543 (2011).
- [7] Kasprzak, J. et al. Bose–einstein condensation of exciton polaritons. \JournalTitleNature 443, 409–414 (2006).
- [8] Bajoni, D. et al. Polariton laser using single micropillar gaas- gaalas semiconductor cavities. \JournalTitlePhysical review letters 100, 047401 (2008).
- [9] Gao, T. et al. Polariton condensate transistor switch. \JournalTitlePhysical Review B 85, 235102 (2012).
- [10] Nguyen, H. S. et al. Realization of a double-barrier resonant tunneling diode for cavity polaritons. \JournalTitlePhysical Review Letters 110, 236601 (2013).
- [11] Sturm, C. et al. All-optical phase modulation in a cavity-polariton mach–zehnder interferometer. \JournalTitleNature communications 5, 1–7 (2014).
- [12] Semond, F. et al. Strong light-matter coupling at room temperature in simple geometry gan microcavities grown on silicon. \JournalTitleApplied Physics Letters 87, 021102 (2005).
- [13] Marsault, F. et al. Realization of an all optical exciton-polariton router. \JournalTitleApplied Physics Letters 107, 201115 (2015).
- [14] Liu, X. et al. Strong light–matter coupling in two-dimensional atomic crystals. \JournalTitleNature Photonics 9, 30–34 (2015).
- [15] van Vugt, L. K. et al. Exciton polaritons confined in a zno nanowire cavity. \JournalTitlePhysical review letters 97, 147401 (2006).
- [16] Li, F. et al. From excitonic to photonic polariton condensate in a zno-based microcavity. \JournalTitlePhysical review letters 110, 196406 (2013).
- [17] Ciuti, C., Savona, V., Piermarocchi, C., Quattropani, A. & Schwendimann, P. Role of the exchange of carriers in elastic exciton-exciton scattering in quantum wells. \JournalTitlePhysical Review B 58, 7926 (1998).
- [18] Emmanuele, R. et al. Highly nonlinear trion-polaritons in a monolayer semiconductor. \JournalTitleNature communications 11, 1–7 (2020).
- [19] Chernikov, A. et al. Exciton binding energy and nonhydrogenic rydberg series in monolayer ws 2. \JournalTitlePhysical review letters 113, 076802 (2014).
- [20] Shahnazaryan, V., Iorsh, I., Shelykh, I. A. & Kyriienko, O. Exciton-exciton interaction in transition-metal dichalcogenide monolayers. \JournalTitlePhysical Review B 96, 115409 (2017).
- [21] Stepanov, P. et al. Exciton-exciton interaction beyond the hydrogenic picture in a mose 2 monolayer in the strong light-matter coupling regime. \JournalTitlePhysical Review Letters 126, 167401 (2021).
- [22] Wright, A. D. et al. Electron–phonon coupling in hybrid lead halide perovskites. \JournalTitleNature communications 7, 1–9 (2016).
- [23] Su, R. et al. Perovskite semiconductors for room-temperature exciton-polaritonics. \JournalTitleNature Materials 1–10 (2021).
- [24] Huang, H., Bodnarchuk, M. I., Kershaw, S. V., Kovalenko, M. V. & Rogach, A. L. Lead halide perovskite nanocrystals in the research spotlight: stability and defect tolerance. \JournalTitleACS energy letters 2, 2071–2083 (2017).
- [25] Su, R. et al. Room temperature long-range coherent exciton polariton condensate flow in lead halide perovskites. \JournalTitleScience advances 4, eaau0244 (2018).
- [26] Su, R. et al. Observation of exciton polariton condensation in a perovskite lattice at room temperature. \JournalTitleNature Physics 16, 301–306 (2020).
- [27] Feng, J. et al. All-optical switching based on interacting exciton polaritons in self-assembled perovskite microwires. \JournalTitleScience Advances 7, eabj6627 (2021).
- [28] Su, R. et al. Room-temperature polariton lasing in all-inorganic perovskite nanoplatelets. \JournalTitleNano letters 17, 3982–3988 (2017).
- [29] Fieramosca, A. et al. Two-dimensional hybrid perovskites sustaining strong polariton interactions at room temperature. \JournalTitleScience advances 5, eaav9967 (2019).
- [30] Bouteyre, P. et al. Room-temperature cavity polaritons with 3d hybrid perovskite: toward large-surface polaritonic devices. \JournalTitleACS photonics 6, 1804–1811 (2019).
- [31] Brichkin, A. et al. Effect of coulomb interaction on exciton-polariton condensates in gaas pillar microcavities. \JournalTitlePhysical Review B 84, 195301 (2011).
- [32] Mukherjee, S. et al. Observation of nonequilibrium motion and equilibration in polariton rings. \JournalTitlePhysical Review B 100, 245304 (2019).
- [33] Estrecho, E. et al. Direct measurement of polariton-polariton interaction strength in the thomas-fermi regime of exciton-polariton condensation. \JournalTitlePhysical Review B 100, 035306 (2019).
- [34] Li, F. et al. Fabrication and characterization of a room-temperature zno polariton laser. \JournalTitleApplied Physics Letters 102, 191118 (2013).
- [35] Christopoulos, S. et al. Room-temperature polariton lasing in semiconductor microcavities. \JournalTitlePhysical review letters 98, 126405 (2007).
- [36] Zhao, J. et al. Ultralow threshold polariton condensate in a monolayer semiconductor microcavity at room temperature. \JournalTitleNano Letters 21, 3331–3339 (2021).
- [37] Barachati, F. et al. Interacting polariton fluids in a monolayer of tungsten disulfide. \JournalTitleNature nanotechnology 13, 906–909 (2018).
- [38] Yagafarov, T. et al. Mechanisms of blueshifts in organic polariton condensates. \JournalTitleCommunications Physics 3, 1–10 (2020).
- [39] Zasedatelev, A. V. et al. A room-temperature organic polariton transistor. \JournalTitleNature Photonics 13, 378–383 (2019).
- [40] Betzold, S. et al. Coherence and interaction in confined room-temperature polariton condensates with frenkel excitons. \JournalTitleACS Photonics 7, 384–392 (2019).
- [41] Sutherland, B. R. & Sargent, E. H. Perovskite photonic sources. \JournalTitleNature Photonics 10, 295–302 (2016).
- [42] Dunlap-Shohl, W. A., Zhou, Y., Padture, N. P. & Mitzi, D. B. Synthetic approaches for halide perovskite thin films. \JournalTitleChemical Reviews 119, 3193–3295 (2018).
- [43] Makarov, S. V. et al. Multifold emission enhancement in nanoimprinted hybrid perovskite metasurfaces. \JournalTitleACS Photonics 4, 728–735 (2017).
- [44] Menéndez-Proupin, E., Beltrán Ríos, C. L. & Wahnón, P. Nonhydrogenic exciton spectrum in perovskite ch3nh3pbi3. \JournalTitlephysica status solidi (RRL)–Rapid Research Letters 9, 559–563 (2015).
- [45] Lee, K. J. et al. Domain-size-dependent residual stress governs the phase-transition and photoluminescence behavior of methylammonium lead iodide. \JournalTitleAdvanced Functional Materials 31, 2008088 (2021).
- [46] Hopfield, J. Theory of the contribution of excitons to the complex dielectric constant of crystals. \JournalTitlePhysical Review 112, 1555 (1958).
- [47] Soufiani, A. M. et al. Polaronic exciton binding energy in iodide and bromide organic-inorganic lead halide perovskites. \JournalTitleApplied Physics Letters 107, 231902 (2015).
- [48] Baranowski, M. & Plochocka, P. Excitons in metal-halide perovskites. \JournalTitleAdvanced Energy Materials 10, 1903659 (2020).
- [49] Buizza, L. R. & Herz, L. M. Polarons and charge localization in metal-halide semiconductors for photovoltaic and light-emitting devices. \JournalTitleAdvanced Materials 2007057 (2021).
- [50] Gelmetti, I., Cabau, L., Montcada, N. F. & Palomares, E. Selective organic contacts for methyl ammonium lead iodide (mapi) perovskite solar cells: influence of layer thickness on carriers extraction and carriers lifetime. \JournalTitleACS applied materials & interfaces 9, 21599–21605 (2017).
- [51] Pollmann, J. & Büttner, H. Effective hamiltonians and bindings energies of wannier excitons in polar semiconductors. \JournalTitlePhysical Review B 16, 4480 (1977).
- [52] Ribeiro, R., Campos-Gonzalez-Angulo, J., Giebink, N., Xiong, W. & Yuen-Zhou, J. Enhanced optical nonlinearities under collective strong light-matter coupling. Physical Review A. 103, 063111 (2021)
- [53] F. Ribeiro, R., Dunkelberger, A., Xiang, B., Xiong, W., Simpkins, B., Owrutsky, J. & Yuen-Zhou, J. Theory for nonlinear spectroscopy of vibrational polaritons. The Journal Of Physical Chemistry Letters. 9, 3766-3771 (2018)
- [54] Ribeiro, R., Martinez-Martinez, L., Du, M., Campos-Gonzalez-Angulo, J. & Yuen-Zhou, J. Polariton chemistry: controlling molecular dynamics with optical cavities. Chemical Science. 9, 6325-6339 (2018)
- [55] Kalanoor, B., Gouda, L., Gottesman, R., Tirosh, S., Haltzi, E., Zaban, A. & Tischler, Y. Third-order optical nonlinearities in organometallic methylammonium lead iodide perovskite thin films. Acs Photonics. 3, 361-370 (2016)
- [56] Ferrando, A., Martinez Pastor, J. & Suarez, I. Toward metal halide perovskite nonlinear photonics. The Journal Of Physical Chemistry Letters. 9, 5612-5623 (2018)
- [57] Combescot, M., Betbeder-Matibet, O. & Dubin, F. The many-body physics of composite bosons. \JournalTitlePhysics Reports 463, 215–320 (2008).
- [58] Jeon, N. J. et al. Solvent engineering for high-performance inorganic–organic hybrid perovskite solar cells. \JournalTitleNature materials 13, 897–903 (2014).
- [59] Tiguntseva, E. et al. Enhanced temperature-tunable narrow-band photoluminescence from resonant perovskite nanograting. \JournalTitleApplied Surface Science 473, 419–424 (2019).
- [60] Carusotto, I. & Ciuti, C. Quantum fluids of light. \JournalTitleReviews of Modern Physics 85, 299 (2013).
- [61] Gribakin, B., Khramtsov, E., Trifonov, A. & Ignatiev, I. Exciton-exciton and exciton–charge carrier interaction and exciton collisional broadening in gaas/algaas quantum wells. \JournalTitlePhysical Review B 104, 205302 (2021).
Data availability
The data that support the findings of this study are available from the authors upon reasonable request, see author contributions for specific data sets.
Competing interests
The authors declare no competing interests.
Author contributions statement
M.A.M. conducted the experiments. V.A.S. developed and implemented the model. M.A.M. and V.A.S. fitted the experimental data. F.A.B. provided experimental assistance. I.A.S. and I.V.I. supervised the theoretical work. S.V.M., D.N.K., and A.K.S. supervised the experimental work. A.K.S. managed the project. All authors extensively discussed the results and participated in editing of the manuscript.
Table of Contents
In this work, exciton-polaritons in photonic crystal slab based on halide perovskite are studied. It revealed the influence of the polaron effects on the exciton state and polariton interaction. As a result, it is experimentally observed a record-high value of the nonlinear optical response detected as a 19.7 meV blueshift of the polariton branch under femtosecond laser irradiation.
Supplementary material: Polaron-enhanced polariton nonlinearity in lead halide perovskites
Mikhail A. Masharin1,†, Vanik A. Shahnazaryan1,†, Fedor A. Benimetskiy1, D. N. Krizhanovskii1,2, Ivan A. Shelykh1,3, Ivan V. Iorsh,1, Sergey V. Makarov1, Anton K. Samusev1,∗
1 ITMO University, School of Physics and Engineering, St. Petersburg, 197101, Russia
2 Department of Physics and Astronomy, University of Sheffield, Sheffield S3 7RH, United Kingdom
3 Science Institute, University of Iceland, Dunhagi 3, IS-107, Reykjavik, Iceland
∗ Corresponding author: anton.samusev@gmail.com
† These authors contributed equally: Mikhail A. Masharin, Vanik A. Shahnazaryan
1 Characterization of the sample: SEM, AFM and angle-resolved spectroscopy at room temperature
Fig. 1a shows scanning electron microscopy (SEM) image of nanostructured MAPbI3 film, which precisely reveals the period of the grating being equal to 750 nm. The topographic profile of the sample obtained using atomic force microscopy (AFM) measurements (Fig. 1b) gives the width (250 nm) and the height (85 nm) of the imprinted combs. The overall film thickness measured by AFM equals 150 nm.
To initially characterize the optical properties if the imprinted MAPbI3 sample, we have measured and simulated its angle-resolve reflectivity (Fig. 1c) at room temperature. The simulations were carried out using Fourier Modal Method (FMM)[1] with account for the MAPbI3 complex dielectric permittivity measured by means of ellipsometry. The modelling results nicely agree with the experimental data and allow to extract the dispersion of the leaky photonic mode uncoupled from exciton resonance at room temperature. Note that the absorption at the frequencies above 1.63 eV leads to the broadening and attenuation of the photon mode.
2 Extraction of the uncoupled cavity photon mode dispersion
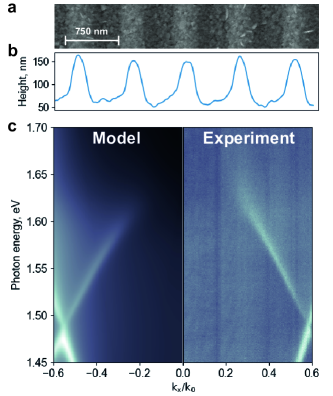
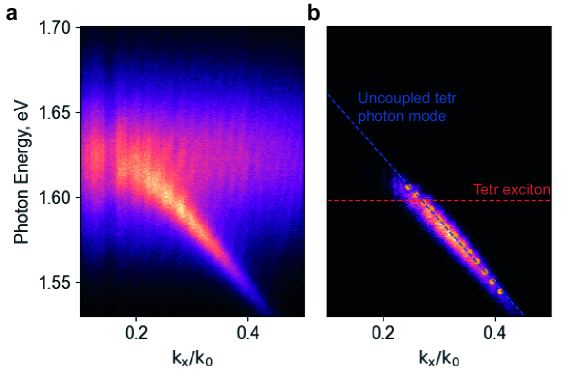
To estimate the strong exciton-photon coupling parameters (Rabi spitting, Hopfield coefficients etc.), along with the measured exciton-polariton dispersion, the uncoupled exciton energy and uncoupled photon cavity dispersion are needed. The exciton energy revealed from photoluminescence (PL) and reflectivity measurements is in excellent agreement with previously reported data[2]. Meanwhile, the dispersion of the uncoupled photon cavity mode without exciton contribution is not obvious to reveal in the studied system. As shown in Fig 1c, we are unable to measure full photon cavity mode dispersion due to the absorption. Moreover, even at room temperature exciton contribution is noticeable, which can be seen from ellipsometry measurements [3] and becomes clear from our the FMM modelling and experiment (Fig 1c). Therefore, uncoupled photon cavity mode was linearly extrapolated from the measured angle-resolved reflectance spectra at large kx, where exciton contribution is negligible. In order to get rid of the uncoupled exciton peak, we first subtracted the angle-resolved PL spectral map obtained in TM polarization from the one measured with TE-polarized analyzer. Further on, we have fitted the photon cavity peaks at each kx by Lorentz resonant function, shown in Fig 2. Since in the absence of exciton there is no disturbance of the photon cavity dispersion, we used linear fit to extend it up to the frequency of exciton transition at 170K.
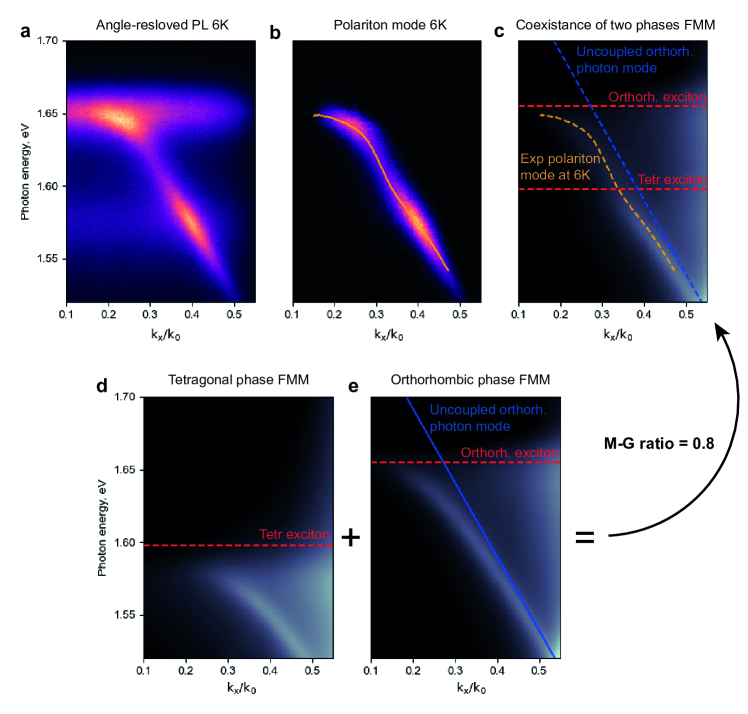
Due to the phase transition and coexistence of two crystal phases in polycrystalline film at 6K mentioned in the main text, the uncoupled photon cavity mode of orthorhombic MAPbI3 phase is affected by the exciton resonance of tetragonal one. As discussed in Ref. 4, tetragonal and orthorhombic phases in polycrystalline MAPbI3 film coexist as a core-shell-type perovskite grains at low temperatures. The core has the orthorhombic phase and the shell represents tetragonal phase. To obtain effective dielectric permittivity of this system we used Maxwell-Garnet (M-G) approximation[5]. Accounting for the refractive index of the materials from two crystal phases measured previously[3], we vary the ratio between two phases in effective refractive index, calculated with M-G approximation to match the simulated angle-resolved reflectance spectrum with the experimental one. Resulting effective refractive index corresponds to a ratio between two crystal phases of 0.8 (This corresponds to 80% of orthorhomic phase and 20% of tetragonal phase). The fitting results are shown in Fig 3. In order to estimate the uncoupled photon cavity dispersion at 6K, we simulate the angle angle-resolved reflectance spectrum for only the orthorhombic phase and linearly extrapolate the dispersion from the spectral region far from the exciton resonance to higher frequencies (Fig 3 e). In further analysis of the polariton mode dispersion, this linearly fitted cavity photon mode was considered.
3 Influence of thermal effects on the blueshift measurements
In order to confirm the absence of the thermal effects on the measured nonlinearities, which measure the optical nonlinear blueshifts at 170K for the the detuning of with repetition rates of 100 and 1 kHz. The 100 kHz repetition rate was used in the main experiment, while 1 kHz was used to confirm that the optical response of the sample remains the same, which would exclude any temperature effects. Using the method described in the main text, we measure polariton peak in the reflectance spectra under the resonance pump at incident fluences of 1 uJ/cm2 and 550 uJ/cm2 and fit the obtained spectra by the Fano resonance function (Fig 7a). To see it more clearly, we plot Lorentzian peak functions with the extracted parameters to get rid of the asymmetry in the peak shapes (Fig 7b). In these two experiments, the asymmetry parameter slightly differs due to the influence of an additional neutral density filter used in the setup. The polariton mode peak positions and linewidths measured for two different incident fluences, perfectly coincide for 1 and 100 kHz repetition rates, which confirms the absence of the thermal effects (such as sample heating) in our experiment.
4 Theory of exciton-polariton nonlinearity
4.1 Exciton-exciton Coulomb interaction in hydrogenic picture
Given by equal exciton center of mass momentum and parallel spin orientation of electrons and holes, the exciton-exciton interaction rate is the sum of four contributions [6]:
| (1) |
where the first term stands for direct interaction, and the remaining terms correspond to exciton, electron, and hole exchange, respectively. Here stands for exchange wave vector. The direct interaction plays an important role for spatially indirect excitons possessing dipole moment, while in typical conditions it is negligibly small. Typically the exchange wavevector dependence of interaction rate is neglected, and the interaction is well approximated as
| (3) |
where stand for Coulomb interaction, is the wavefunction of exciton internal dynamics, is the normalization area [volume], and for 2D and 3D, respectively. The direct calculation results in
| (4) |
| (5) |
Here the Bohr radius and binding energy read as
| (6) | ||||
| (7) |
and , .
The three-body Coulomb correlation term can be presented as [8]:
| (8) |
where and are the Fourier images of the interaction potential and the exciton wavefunction, respectively. The resulting expressions read as
4.2 Exciton-polaron nonlinearity rates
For the case of exciton-polaron we evaluate the nonlinearity rates by means of the Eqs. (3), (8). Here the Coulomb interaction potential is given by the Eq. (7) of the main text, which in the inverse space reads
| (11) |
The exciton wave function is found in the form of conventional (3D) hydrogen-like shape, in the inverse space reading as
| (12) |
The resulting values for 170K tetragonal phase exciton are eVm3, eVm6. Taking into account the values of binding energy meV, and the Bohr radius nm, we can write
| (13) |
| (14) |
The expressions for saturation rates read as [9]
| (15) |
| (16) |
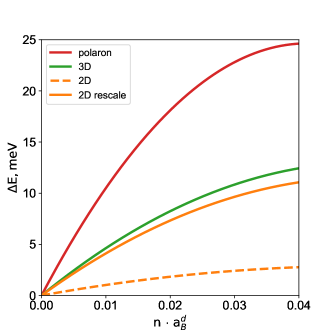
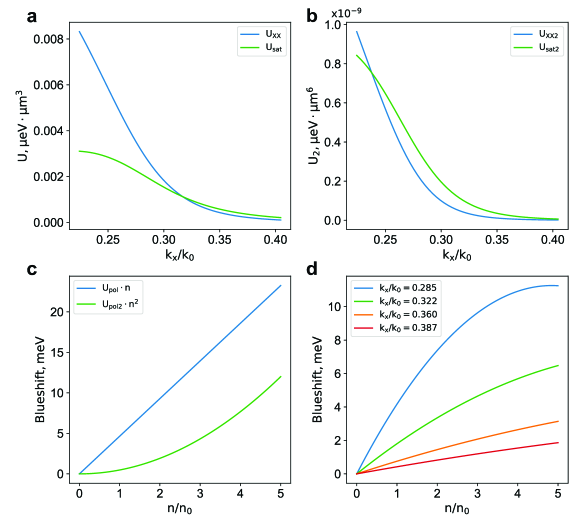
4.3 Blueshift comparison
In order to highlight the blueshift enhancement due to the polaron effects, we plot the density dependence of blueshift for various structures in Fig. 8. Here we choose the parameters of exciton-polaron in tetragonal phase, and compare with (2D) and (3D) hydrogen-like excitons having the same parameters. The results clearly demonstrate the strong enhancement of blueshift in the case of polaron renormalization of bulk excitons.
5 The phonon energy dependence of exciton Coulomb nonlinearity
The phonon energy dependence of Bohr radius and exciton binding energy is shown in Fig. 9 a, c. At the limits the exciton binding energy approaches 3D hydrogen model with dielectric permittivity , respectively. However, the corresponding Bohr radius tends even below the hydrogen limit with low permittivity, which is due to the violation of Rydberg scaling. Because of the reduction of interaction cross-section, this results in the decrease of exciton-exciton Coulomb interaction (see. Fig. 9 b). Despite this circumstance, the maximal possible blueshift is larger (see. Fig. 9 d) due to the enhanced maximal density of particles.
6 The temperature dependence of exciton Coulomb nonlinearity and light-matter coupling strength
The temperature dependence of excitonic and electronic properties of MAPbI3 is studied in detail in Ref. [2]. It is demonstrated, that the phase transition at around 160 K primarily manifests itself in the abrupt change of the bandgap. On the contrary, the excitonic binding energy varies rather smoothly, from meV at 6 K to meV at room temperature. In Fig. 10a we present the extracted data of temperature dependence of exciton binding energy and the corresponding theoretical fit within the exciton-polaron treatment. We highlight here, that the hydrogen-like exciton with binding energy meV would be thermally unstable at 170 K due to the condition .
Exploiting the obtained exciton wave functions, we further calculate the exciton Bohr radius, nonlinearity rates associated with Coulomb correlations between the excitons, and the respective maximal blueshift. The results of calculation are presented in Fig. 10 b-d, demonstrating a moderate temperature dependence of maximal blueshift.
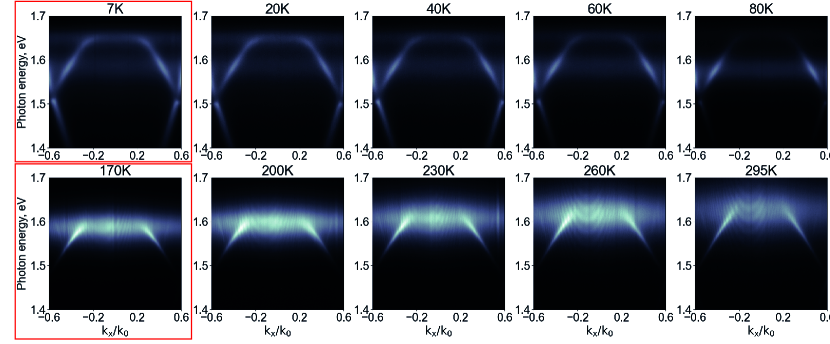
In the study, we measured angle-resolved PL spectra at different temperatures, shown in Fig 11, from which we extract polariton branches and fit them by the two-coupled oscillator model, as it was described in the Methods section in the main text. The resulting Rabi splitting, linewidths of uncoupled cavity mode, and uncoupled exciton is shown in Fig 12, a. To check the strong light-matter coupling regime we plot Rabi splitting, light-matter coupling strength, half-sum and full-difference of cavity photon and exciton linewidths in Fig 12, b. In the red region, where half-sum of linewidths exceeds Rabi splitting we claim a weak light-matter coupling regime. The green region, where linewidths half-sum is lower than Rabi splitting, corresponds to a strong light-matter coupling regime. It should be noticed, that there is the phase transition, where it is impossible to clearly determine polariton branches and therefore we do not determine data.
7 Polariton nonlinearity rates
The blueshift of lower polariton branch with increased pump fluence is defined by Eqs. (6) and (7) of the main text. The contributions of nonlinearity rates associated with exciton-exciton interactions and the quench of Rabi splitting are
| (17) | ||||
| (18) |
| (19) | ||||
| (20) |
In the Fig. 13 a, b the comparison of two effects for the first and second order of polariton nonlinearity is presented. While for the first order the Coulomb contribution is larger at moderate values of wavevector, the second order term is fully dominated by the quench of Rabi splitting. We mention that within out treatment the wavevector dependence stems from the Hopfield coefficients solely. In the Fig. 13 c the modulus of energy shifts arising from the first and second order nonlinear terms versus the particle density is presented. The contribution of the second order term results in the deviation from linear scaling at elevated particle densities, as illustrated in Fig. 13 d.
References
- [1] Li, L. New formulation of the fourier modal method for crossed surface-relief gratings. \JournalTitleJOSA A 14, 2758–2767 (1997).
- [2] Soufiani, A. M. et al. Polaronic exciton binding energy in iodide and bromide organic-inorganic lead halide perovskites. \JournalTitleApplied Physics Letters 107, 231902 (2015).
- [3] Jiang, Y. et al. Temperature dependent optical properties of ch3nh3pbi3 perovskite by spectroscopic ellipsometry. \JournalTitleApplied Physics Letters 108, 061905 (2016).
- [4] Lee, K. J. et al. Domain-size-dependent residual stress governs the phase-transition and photoluminescence behavior of methylammonium lead iodide. \JournalTitleAdvanced Functional Materials 31, 2008088 (2021).
- [5] Markel, V. A. Introduction to the maxwell garnett approximation: tutorial. \JournalTitleJOSA A 33, 1244–1256 (2016).
- [6] Ciuti, C., Savona, V., Piermarocchi, C., Quattropani, A. & Schwendimann, P. Role of the exchange of carriers in elastic exciton-exciton scattering in quantum wells. \JournalTitlePhysical Review B 58, 7926 (1998).
- [7] Glazov, M. et al. Polariton-polariton scattering in microcavities: A microscopic theory. \JournalTitlePhysical Review B 80, 155306 (2009).
- [8] Combescot, M., Betbeder-Matibet, O. & Dubin, F. The many-body physics of composite bosons. \JournalTitlePhysics Reports 463, 215–320 (2008).
- [9] Emmanuele, R. et al. Highly nonlinear trion-polaritons in a monolayer semiconductor. \JournalTitleNature communications 11, 1–7 (2020).