SpiroMask: Measuring Lung Function Using Consumer-Grade Masks
Abstract.
According to the World Health Organisation (WHO), 235 million people suffer from respiratory illnesses which causes four million deaths annually. Regular lung health monitoring can lead to prognoses about deteriorating lung health conditions. This paper presents our system SpiroMask that retrofits a microphone in consumer-grade masks (N95 and cloth masks) for continuous lung health monitoring. We evaluate our approach on 48 participants (including 14 with lung health issues) and find that we can estimate parameters such as lung volume and respiration rate within the approved error range by the American Thoracic Society (ATS). Further, we show that our approach is robust to sensor placement inside the mask.
1. Introduction
According to the World Health Organisation (WHO), 235 million people suffer from respiratory illnesses. Chronic Obstructive Pulmonary Disease (COPD) is associated with an estimated 3 million deaths per year, and asthma had an estimated 200 thousand deaths per year (Schluger and Koppaka, 2014). Common infectious respiratory diseases, such as influenza, cause 600 thousand deaths worldwide. 90% of deaths due to pulmonary disease occur in low-income and middle-income countries111https://www.who.int/health-topics/chronic-respiratory-diseases. COPD development generally starts early in life due to a complex interplay of disadvantageous factors, many of which occur in low and middle income countries (Brakema et al., 2019). Studies have shown that lung diagnosis is typically missed or delayed until poor lung health conditions advance. Early diagnosis of lung ailments can positively influence disease course, slowing progression, relieving symptoms and reducing the incidence of exacerbation (Soriano et al., 2009; van Schayck et al., 2003). But unavailability of lung function equipment hinders proper diagnosis (Tan and Ng, 2008; Yadavar, 2019).
Regular lung health monitoring can lead to prognoses about deteriorating lung health conditions (Aliverti, 2017; Tomasic et al., 2018). Typically, two kinds of breathing data are used to derive lung health bio-markers:
-
•
Tidal breathing or normal breathing: Tidal breathing refers to inhalation and exhalation during restful breathing. It is in involuntary action. Lung disease can change the normal characteristics of tidal breathing (Palmer et al., 2004).
-
•
Forced breathing: It is performed by taking a deep inhalation resulting in full expansion of the chest followed by a forceful exhalation. A person will require to voluntarily perform forceful breathing maneuver.
Forced Expiratory Flow (FEF) measurement deduced from forced breathing is the most widely used method to assess the severity of asthma. Monitoring the forcefully exhaled airflow can help diagnose the onset of asthma, COPD and other conditions that affect breathing (Van der Ent et al., 1996; Larson et al., 2011; Song et al., 2020). But, FEF measurements require a controlled environment. Moreover, a majority of young and old patients with airway obstruction are not able to perform adequate forced breathing maneuvers (Van der Ent et al., 1996). Prior research has shown that tidal breathing patterns can also be used to detect and quantify airway obstruction (Walker et al., 1990).
Respiration rate can be deduced from tidal breathing. It is defined as the number of breaths taken by a person in a minute. Respiratory rate deduced from tidal breathing is an important marker of cardiac arrest, dyspnea (Fieselmann et al., 1993; Hodgetts et al., 2002; Wang et al., 2021; Kristiansen et al., 2021), accessing sleep quality and monitoring stress (Dai et al., 2021). Lung inflammation caused by COPD deterioration or lung infection leads to a higher respiration rate (Rahman et al., 2020; Larson et al., 2011).
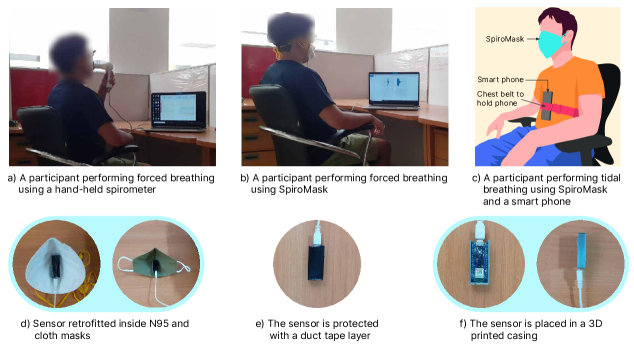
In clinical settings and hospitals, exhaled airflow is measured using a spirometry test (Figure 3 a). During a spirometry test, a patient performs forceful breathing through a flow-monitoring device (a tube or mouthpiece), which measures instantaneous flow and cumulative exhaled volume. However, spirometry tests performed at hospitals are not transient, and the recent global pandemic has led to the suspension of certain non-urgent healthcare services such as routine diagnostic testing (Kouri et al., 2020; Johnson et al., 2020). Although home spirometry tests are available (Otulana et al., 1990), even the cheapest hand-held digital spirometer cost about USD 300. Previous work has accurately estimated forced breathing parameters using a smartphone (Larson et al., 2012). In smartphone spirometry, a person must do a maneuver of forceful breathing towards the cellphone. But, the approach to microphone-based smartphone spirometry is susceptible to users’ way of holding the phone, users’ lip posture, environmental variability, and phone’s make and model (Goel, 2016).
Previous studies (Rahman et al., 2020) have also used accelerometers in smartphones for continuous respiration monitoring. However, the approach requires a controlled environment where the participant must put the smartphone in a particular location on the chest. Recently, studies (Zhou et al., 2020) have shown that wearable spirometry can be conducted using a pressure sensor inside a specialised mask meant for athletes. Progress on mask spirometry is limited because, i) the evaluations were done on healthy adults alone, ii) there was no continuous monitoring of respiration rate, iii) athlete training masks are relatively costly (40-50 USD) compared to consumer-grade masks (5-10 USD For N95 mask), iv) athlete training masks are meant to restrict the oxygen received by a person to create a high-altitude environment222https://www.healthline.com/health/training-mask-benefits#benefits, as such they cannot be a replacement for generally used cloth or N95 mask. In Section 9, we qualitatively show that the general population would not prefer a specialised mask as a daily wearable.
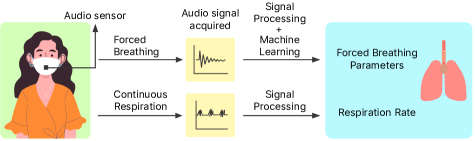
This paper shows that consumer-grade masks (N95 and cloth masks) can be used for Spirometry and continuous respiration rate monitoring by processing the signal from the microphone retrofitted inside the mask (Figure 1). The main intuition behind using audio is to leverage the relationship between variation in air flow rate and the intensity change in nasal sound (Yap and Moussavi, 2002; Morrison, 1969; Kumar et al., 2021; Nam et al., 2015). Our work addresses the limitations of prior research (Larson et al., 2011; Adhikary et al., 2020; Zhou et al., 2020). In particular, our approach to SpiroMask i) provides a relatively controlled environment for Spirometry as well as tidal breathing monitoring, ii) can classify between tidal breathing, noise and speech, iii) is accurate for participants with lung ailments as well as for healthy individuals.
Our approach uses the audio signal to derive vital lung parameters and continually monitor respiration rate. We used machine learning with sequential forward selection techniques to learn a set of audio features that accurately estimate lung health. We have two separate pipelines for estimating parameters from forced breathing and tidal breathing. To estimate respiration rate (from tidal breathing), we used a neural network that distinguishes tidal breathing from speech and noise. We estimated the average peak to peak time from the tidal breathing signal to derive the respiration rate. The parameters estimated from forced breathing are described in Section 2.
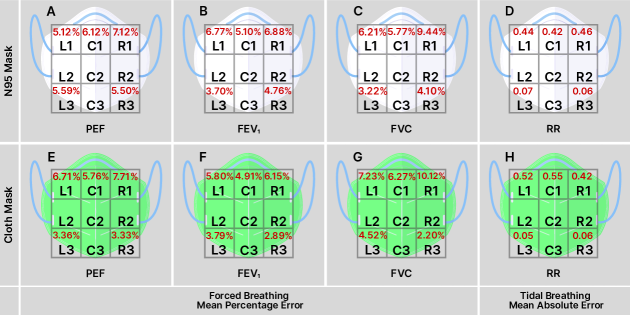
Our study was approved by the Institutional Review Board (IRB). We recruited 48 participants, including 15 female participants. A total of 14 participants had restrictive and obstructive lung ailment. The number of healthy and unhealthy participants in our trial is comparable to study population of past studies (Goel et al., 2016; Larson et al., 2011; Whitlock et al., 2020; Zhou et al., 2020; Yue et al., 2018; Zubaydi et al., 2017; Rahman et al., 2014). For each participant the study lasted between 45 minutes to about an hour. The mean percentage errors on forceful breathing parameters for cloth masks were between 5.2% to 6.7%. For the N95 mask, they were between 5.8% to 6.3%. We achieved an accuracy of 94.7% on classifying tidal breathing from noise and speech. The Mean Absolute Error (MAE) on the estimation of respiration rate was 0.68 for the cloth mask and 0.49 for the N95 mask. Our results on forceful breathing are within the acceptable error range as endorsed by the American Thoracic Society or ATS.
We have performed sensitivity analysis on the position of the sensor inside the mask. Our approach is robust to sensor placement for forced breathing. However, certain positions (directly below the nose) inside the mask are ideal for estimating respiration rate from tidal breathing monitoring.
To summarise, the main contributions of this paper are:
-
•
SpiroMask: a novel mask-based system for estimating forced and tidal breathing to assess lung health parameters using a microphone
-
–
that works on consumer-grade masks
-
–
is accurate within the ATS guidelines
-
–
works well for both healthy and unhealthy subjects
-
–
is robust to the microphone placement
-
–
-
•
Public dataset: We publicly release our dataset at Github333https://github.com/rishi-a/SpiroMask We believe ours is the first such large publicly available dataset that measures both the tidal and forced breathing parameters and ground truth for 48 participants (including 14 with lung ailments). We believe that our dataset can help advance research in the community.
-
•
Reproducibility: We believe that our work is fully reproducible. We use the same repository as above for the code. All the generated tables and graphs have corresponding scripts to reproduce all the results. We believe our efforts towards reproducibility will lower the effort towards replication and building on top of our work.
2. Background and Related Work
This section underlines the basics of spirometry and lung function indices, followed by an overview of prior work on audio-based and pressure-based sensing of lung indices.
2.1. Spirometry
Spirometry is a widely used pulmonary function test. It measures how fast and how much air the patient can breathe out and is the most widely employed objective measure of lung function (Townsend et al., 2011). Spirometry tests are usually performed in clinics or hospitals. Currently, the most commonly used devices for respiratory evaluation are hand-held spirometers. A spirometry test consists of the following sequence of events (Graham et al., 2019).
-
•
A soft clip is placed on the patient’s nose to allow normal breathing through her mouth.
-
•
The patient wraps her lips tightly around the spirometer mouthpiece shown in Figure 3 (a), ensuring that all the exhaled air goes through into the spirometer for accurate measurement.
-
•
The patient then takes the deepest possible breath, filling her lungs to the maximum.
-
•
The patient exhales hard and fast and continues exhaling into the spirometer until no more air comes out.
Spirometry results are effort dependent. Patients need to be coached by a trained professional to perform a forceful exhalation for a successful spirometry test. A digital spirometry test produces the flow versus volume plot of the lung444https://pftforum.com/review/tutorials/spirometry-tutorials/assessing-flow-volume-loops/ from which vital lung parameters are extracted.
A forceful breathing maneuver requires a controlled environment with proper guidance from doctors.
A standard spirometer measures the volume and flow of air that can be inhaled and exhaled. Spirometry generates pneumotachographs, which plot the volume and flow of air coming in and out of the lungs. The most common parameters measured by spirometry are forced vital capacity (FVC), forced expiratory volume at one second (FEV1), and peak expiratory flow (PEF). FVC is the total air volume exhaled denoted by C in Table 1, FEV1 is the exhaled air volume in the first second of exhalation, denoted by B. PEF is the maximum airflow velocity in exhalation, denoted by A.
![[Uncaptioned image]](/html/2201.09280/assets/x2.png)
|
||||
| ID | Abbreviation | Definition | ||
| A | PEF |
|
||
| B | FEV1 |
|
||
| C | FVC | Forced vital capacity (FVC) is the total air volume exhaled (L) | ||
| D | FEV1/FVC |
|
||
| E | RR | Respiratory Rate (samples/min) | ||
2.2. Smartphone Spirometry
Researchers have explored the potential to turn existing mobile devices and smartphones into portable electronic spirometers using their inbuilt microphones supplemented with machine learning techniques (Sim, 2019; Rahman et al., 2019; Larson et al., 2012; Viswanath et al., 2018; Thap et al., 2016; Zubaydi et al., 2017; Song et al., 2020). These studies use the features from the Hilbert transformation (Johansson, 1999), linear predictive coding (O’Shaughnessy, 1988) and the spectrogram of an audio signal to train a linear regression model for each of the vital lung parameters, i.e. FVC, FEV1 and PEF. Compared to the clinical spirometer, the reported mean error is 5.1%, 5.2% and 6.3% for FEV1, FVC and PEF, respectively. In our work, we show that Hilbert transformation with a finite impulse response filter gives a comparable or better estimate of lung function parameters, and we can avoid non-trivial modelling like linear predictive coding. Also, given that the audio sensor is fixed in the mask, we are not required to compensate for pressure losses sustained over the variable distance from the mouth to the microphone, and reverberation/reflections caused in and around the subject’s body.
Researchers have also proposed a variable frequency complex demodulation method (VFCDM) technique to extract the FEV1/FVC ratio (Thap et al., 2016) from audio. A built-in smartphone microphone was also used in (Zubaydi et al., 2017) to estimate FEV1 and FVC. However, they do not estimate PEF or tidal breathing parameters like respiration rate. Commodity smartphone has also been used to measures the humans’ chest wall motion via acoustic sensing. Lung function indices are deduced from the measured motion (Song et al., 2020). Existing literature on extracting PFT parameters requires a person to perform the forced breathing maneuver in a controlled noiseless environment. Researchers have investigated the scope of extracting PFT events from speech. Previous literature (Rahman et al., 2019) studied subjects having varying pulmonary conditions to collect mobile sensor data, including audio, to extract pulmonary biomarkers such as breathing, coughs, spirometry, and breathlessness.
| Type of mask | Participants | Lung health parameters | |||||||||||||||||
|
N95 | Healthy | Unhealthy |
|
|
|
|||||||||||||
| Zhou et al. (Zhou et al., 2020) | ✗ | ✗ | 20 | 0 | ✗ |
|
✗ | ||||||||||||
| Adhikary et al. (Adhikary et al., 2020) | ✓ | ✗ | 8 | 0 | ✗ | FVC | ✗ | ||||||||||||
| Curtiss, | |||||||||||||||||||
| Rothrock et al. (Curtiss et al., 2021) | ✓ | ✓ | 9 | 0 | ✓ | ✗ | ✗ | ||||||||||||
| SpiroMask (Our work) | ✓ | ✓ | 34 | 14 | ✓ |
|
✓ | ||||||||||||
Smartphone spirometry has the following limitations:
-
•
It requires accounting for variability in the distance between microphone and mouth. In Section A.2, we have described how this variability affects the flow-volume curve.
- •
-
•
It is not suited for sensing tidal breathing as a person will not keep the smartphone near their nose for a long duration.
- •
-
•
It requires a user to actively interact with the smartphone.
2.3. Wearable Spirometry
Recent efforts have been made to integrate face masks with audio and pressure sensors to extract vital lung parameters (Zhou et al., 2020; Adhikary et al., 2020). Researchers have used a MEMS-based barometric pressure sensor inside an athlete training mask555https://www.trainingmask.com/training-masks/training-mask-3-0/ Last accessed: 15th August 2021. Such masks are specially designed for athletes, restricting breathing, making an athlete feel like they are at a high altitude. Accurate wearable spirometry has been performed in athlete masks with error margins of 2.9% and 3.3% for FVC and FEV1 respectively (Zhou et al., 2020). Researchers have also experimented by integrating an audio sensor inside a surgical mask to estimate FVC from the energy of the audio signal but they have not quantified the error (Adhikary et al., 2020). However, progress in mask spirometry is limited in the following ways:
-
•
Continuous monitoring of tidal parameters was absent.
-
•
The proposed approaches are not suitable for consumer-grade N95 and cloth masks.
-
•
Previous work did not consider participants with lung ailments in their user-study and thus the efficacy is not known.
-
•
There was no discussion on the robustness of sensor positioning inside the mask.
Table 2 compares our work with previous literature, and shows the novelty of our work for: i) estimating lung parameters for consumer-grade cloth and N95 masks; ii) single system for measuring both forced and tidal breathing parameters; iii) a larger study with unhealthy and healthy subjects; and a discussion on robustness of sensor placement.
2.4. Respiration Rate Detection
Most of the prior work estimates respiration rate using Inertial Measurement Unit (IMU). Röddiger et al. (Röddiger et al., 2019) estimated respiration rate from accelerometer and gyroscope placed inside in-ear headphones. Hernandez et al. (Hernandez et al., 2014) installed IMU in Google glass to estimate pulse rate and respiration rate from ballistocardiogram. Sun et al. (Sun et al., 2017) used accelerometer data from smartwatches to deduce respiration rate when a person is asleep. Liaqat et al. (Liaqat et al., 2019) used machine learning algorithms to filter out IMU data that can be used to estimate respiration rate in the wild using smartwatch. Aly et al. (Aly and Youssef, 2016) used the approach of placing a smartphone over the chest to estimate respiration rate using accelerometer and gyroscope. Islam et al. (Islam et al., 2021) used sensor fusion data from both smartwatch and smartphone. All of these works except the work done by Sun et al. (Sun et al., 2017) focused on estimating respiration rate with different posture of a user. For a fair comparison, we compared the error of only ‘Sitting’ posture with our work and found that our results are comparable or better to previous works. We have summarized many previous works in Table 3 below.
In the past, microphones have also been used to estimate respiration rate. Kumar et al. (Kumar et al., 2021) used short audio segments from in-ear headphones to estimate respiration rate when a person is subject to strenuous exercises. Nam et al. (Nam et al., 2015) used a microphone placed below the nose to record nasal sound. We cannot directly compare the error between SpiroMask and previous work that used a microphone due to different metrics used but we believe that SprioMask performance is acceptable given that our evaluation was on a relatively larger set of participants.
| Metric — Error | Hardware | Participants | |
| Röddiger et al. (Röddiger et al., 2019) | MAE = 3.10 | Bluetooth earphone (via Accelerometer) | 12 Participants |
| MAE = 2.74 | (via Gyroscope) | (2 Females) | |
| Hernandez et al. (Hernandez et al., 2014) | MAE = 1.15 | Head mounted device (via Gyroscope) | 12 Participants |
| MAE = 1.1 | (via Accelerometer) | (6 Females) | |
| MAE = 1.1 | (via Camera) | ||
| Kumar et al. (Kumar et al., 2021) | MSE = 0.2 | Headphones (via Microphone) | 21 Participants |
| Sun et al. (Sun et al., 2016) | MAE = 0.75 | Smartwatch (via Accelerometer only) | 16 Participants |
| Hernandez et al. (Hernandez et al., 2015) | MAE = 0.22 | Smartwatch (via Gyroscope) | 12 Participants |
| MAE = 0.41 | (via Accelerometer) | ||
| MAE = 0.22 | (both) | ||
| Liaqat et al. (Liaqat et al., 2019) | MAE = 1.9 | Smartwatch (via Accelerometer ) | 14 Participants |
| Islam et al. (Islam et al., 2021) | MAPE = 8.26% | Smartphone ((via Accelerometer) | 131 Participants |
| Aly et al. (Aly and Youssef, 2016) | Smartphone (via Accelerometer) | 7 participants | |
| MdAE* = 0.04 | (with metronome) | (4 females) | |
| MdAE = 0.53 | (without metronome) | ||
| SpiroMask (our work) | MAE = 0.6 | Consumer grade mask (via microphone) | 37 Participants |
| (13 Female) | |||
| (14 with lung ailments) |
2.5. Audio and Pressure sensor
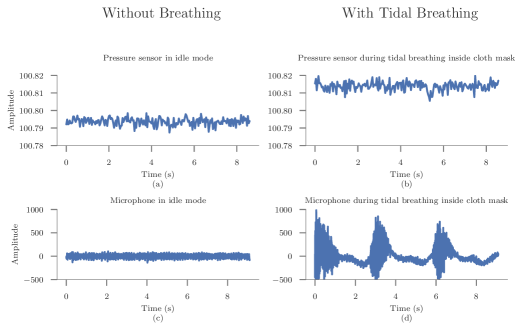
Prior literature has successfully used both an in-situ microphone and a MEMS barometer inside a very tightly sealed athlete mask to sense breathing and perform portable spirometry (Zhou et al., 2020; Adhikary et al., 2020). However, our experiments show that a pressure sensor cannot be used to sense breathing inside a consumer-grade cloth mask. Figure 2 (a) and (b) shows that the pressure sensor outputs a similar signal (Pearson correlation coefficient, ) when the cloth mask is worn and not worn. The amplitude in Figure 2 (b) is higher than in Figure 2 (a) because the pressure inside a mask is higher than the atmospheric pressure. However, there is little to no change in the signal to distinguish between inhalation and exhalation. Previous work (Zhou et al., 2020) leveraged the change in pressure to detect forceful breathing inside a special kind of mask. However, the differential pressure is insignificant in N95 and cloth masks making the breathing signal unrecognisable. It implies that pressure sensors are ineffective in distinguishing tidal breathing in cloth masks unless the sensor is sealed from atmospheric pressure. Figure 2 (c) and (d) shows that a microphone does a better job (Pearson correlation coefficient, ) in sensing tidal breathing inside a cloth mask. These results suggest that commodity-grade pressure sensors placed on standard masks are likely to result in poorer lung health estimation than audio sensing. Thus, we do not baseline against this previous work (Zhou et al., 2020) in mask based spirometry as the approach does not work on consumer-grade masks.
3. Data Collection Procedure
We now describe our data collection procedure.
3.1. IRB approval and screening criteria
Our user study on SpiroMask was approved by the Institutional Review Board (IRB). All participants between 18 to 70 years of age could become a participant in the study. People who are severely ill and have been advised bed rest by doctors were not allowed to participate in the study. We recruited 52 participants for the study, out of which 16 participants reported having lung ailments. All participants were remunerated as per institute guidelines.
3.2. Entry survey
Every participant filled out an entry survey before the user study. We asked them to declare their age, height, weight, any recent illness, history of contracting COVID19 and if they had a meal before coming for the user study. We also asked them if they had a clinically validated history of lung ailments and if they had done a spirometry test in the past.
3.3. Sensing hardware
3.3.1. Microphone
We recorded the audio of forceful expiration and tidal breathing using an Arduino nano sense microcontroller666https://store.arduino.cc/usa/nano-33-ble-sense due to the availability of embedded sensors like the MEMS microphone. Its compact size makes it possible to affix the microcontroller on a face mask. The microphone has a sampling rate of 16 kHz. We placed our microcontroller inside a 3D printed enclosure (Figure 3 (f) to protect it from static discharge and wear and tear. The 3D enclosure is affixed to the mask using velcro and double-sided tape (Figure 3 (e). We advised the participants to affix the microcontroller on their mask to ensure their comfort and safety while wearing it. We confirmed that the mask was appropriately worn before starting the SpiroMask experiment. Our future system would be smaller and hand-sewable on the fabric.
3.3.2. Spirometer
Our setup also consisted of the Helios 401777https://labsakha.com/wp-content/uploads/2019/03/RMS-Helios-401-Features-Specifications.pdf medical-grade (ISO 14971:2019 (Teferra, 2017)) hand-held spirometer. We used the spirometer to collect the ground truth lung capacity of every participant.
3.3.3. Smartphone
We used a Samsung Galaxy M20 smartphone to collect accelerometer data for the expansion and contraction of the chest. The accelerometer had a sampling rate of 100 Hz.
3.4. Data communication and storage
The sensor inside the mask was connected to a desktop computer via USB cable. To ensure no data loss and interruption (due to draining battery) during the user study, we refrained from using any wireless mode of audio data transfer. Transmitting high quality audio with limited power is a challenge because our sensing hardware samples audio at 16 kHz which amounts to 768 Kbps of data (Jongboom, 2022). But the practical throughput of BLE is around 125 Kbps or less (Semiconductor, 2022). For every participant, the investigator checked if the microphone and the smartphone are responding to remote commands. We used the MATLAB mobile application888https://www.mathworks.com/products/matlab-mobile.html to collect accelerometer data from the smartphone. An investigator could issue remote commands from their laptop to retrieve audio and IMU data from the microphone and smartphone. The sensitive audio data was stored securely in the cloud.
3.5. COVID19 norms
We followed all local COVID19 guidelines during the entire process. The tests were done in a well-ventilated room with a single participant at a time. The investigator was double vaccinated and wore an N95 mask during the entire duration of the experiment. On the participant’s arrival, we asked the participant to sanitise their hands. In the spirometry test, each participant used a new mouthpiece. We did not reuse any N95 or cloth masks. The investigator gave a fresh piece of both the masks.
| Forced Breathing | Tidal Breathing | ||||||
| Total Participants (n) | 48 | 37 | |||||
| Participants with lung ailments (n, %) | 14 (29.1%) | 14 (37.8%) | |||||
| Females (n, %) | 15 (31.3%) | 13 (35.1%) | |||||
| Age (yrs) (mean, range) | 28.05 (21-68) | 26.19 (20-32) | |||||
| Height (cm) (mean, range) | 167.39 (142.4-182.9) | 167.0 (152.4-182.88) | |||||
| Participants with lung ailments |
|
||||||
3.6. Data collection for forced breathing
We started the user study with data collection for forced breathing, as shown in Figure 3. We conducted the study over two phases. Phase 1 was in January - February 2021, and Phase 2 began in July 2021999Our country was very significantly impacted by COVID19 between March and June 2021 and thus we suspended data collection during that time. Table 4 summarises the participant demography.
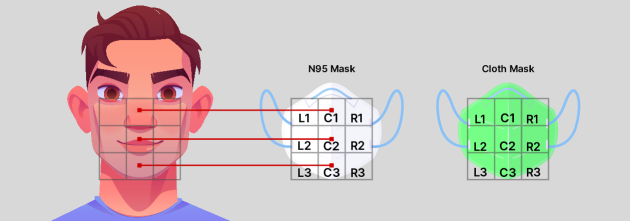
The investigators explained the entire user study to the participants. We demonstrated the spirometry test to the participants. For most of the participants, we could obtain the spirometry ground truth in the first attempt itself. The proprietary spirometer software flagged incorrect attempts for some participants. For every wrong maneuver, we repeated the spirometry test at least once, after which we obtained the ground truth. SpiroMask test followed the spirometry test. Forceful exhalation using the mouth is made possible in a hand-held spirometer due to the availability of a dedicated mouthpiece. Based on some pilots experiments, we realised that it is easier to do a forceful exhalation using the nose with mouth closed when a face mask is worn. We asked the participants to attach the sensor themselves on the mask. We issued the remote command to start data collection and instructed the participant to begin deep inhalation and forceful exhalation. Each forceful breath lasted for 6 to 8 seconds. For 12 participants, we collected samples of forceful breathing audio for different positions inside the mask (L1, C1, R1, L3, R3 in Figure 4). Eight (66.6%) out of these 12 participants preferred to start with the R3 position. Most of the other participants, who did not participate in the sensor positioning study also preferred the R3 position. They all had an unanimous opinion that R3 was the most comfortable position to place the sensor as it did not lead to any discomfort. To ensure that forced breathing performance does not degrade in the course of multiple maneuver, we asked all the 12 participants to rest for at least 5 minutes after each attempt. The ATS guideline (Graham et al., 2019) permits upto 8 maneuver in adults if the correct flow-volume curve is not achieved. The study duration for these subset of 12 participants was relatively longer compared to other participants. We then repeated the SpiroMask test using the cloth mask.
Despite several attempts, four participants (not included in the pool of 48 participants) were unable to perform the spirometry test. One participant had buccinator muscle pain making it impossible for her to hold the mouthpiece of the spirometer. Three other participants could not perform a proper forceful breathing maneuver. They complained about lung discomfort when asked to attempt a forceful exhalation. The investigator decided not to continue with the spirometry test for these three individuals anticipating worsening medical conditions. It should be noted that while these three people expressed relative comfort using our system SpiroMask, we still had to discard their samples owing to the lack of verified ground truth.
We finally had data for 48 participants, out of which 14 had lung ailments. The number of healthy and unhealthy participants in our study is comparable or more than in several similar studies (Goel et al., 2016; Larson et al., 2011; Whitlock et al., 2020; Zhou et al., 2020; Yue et al., 2018; Zubaydi et al., 2017; Rahman et al., 2014).
3.7. Data collection for tidal breathing
Data collection on tidal breathing started in the second phase (July 2021) of our user study. Table 4 summarises the participant demography. First, we asked the participants to place the smartphone in the sternum with the help of a chest belt, as shown in Figure 3. Previous work (Chu et al., 2019) has shown that putting an accelerometer in the sternum can help us retrieve the respiration rate by leveraging the movement of the rib cage and the movement of the abdomen. Accelerometer data are susceptible to motion artifacts, therefore we had positioned the participants on stationary chairs without any movable parts in it and advised them to remain as still as possible. To filter out noises due to involuntary movements, we used convolution filter. Convolution has the effect of a low pass filter (Downey, 2016). We experimentally found out that using a window size of 70 samples denoises the signal. The accelerometer’s sampling rate was 100 Hz. Previous work has also used a stretch sensor combined with a motion sensor in a chest belt to measure breathing parameters, even when the user is ambulatory (Whitlock et al., 2020). Proprietary respiration belts were used in some studies (Yue et al., 2018; Shih et al., 2019) to collect the ground truth on respiration rate. Such ground truth systems are very expensive and unavailable in our country.
Similar to the SpiroMask test for forced breathing, we asked the participant to wear the mask and start tidal breathing. We issued remote commands from a laptop to start data collection from the smartphone and the microphone simultaneously. We also instructed the participants to begin counting their exhalations after issuing the remote command. Each sample of tidal breathing lasted for 20 seconds. We used a development platform (Jan Jongboom, 2019) in which the time length of audio recording from the microcontroller was restricted to 20 seconds. The length of the audio recording could be extended had we used the Software Developemnt Toolkit (SDK) of the microprocessor. We did not choose to do so due to engineering challenges. Prior work (Röddiger et al., 2019) has shown that 20 seconds of IMU data is enough to estimate respiration rate. In Appendix A, we have demonstrated why 20 seconds of audio is enough to estimate respiration rate. For 18 out of 37 participants101010We should recall that 48 users participated in the Forced breathing test and 37 users participated in the tidal breathing test as summarised in Table 4, we took at least two samples at each position (L1, C1, R1, L3, R3 in Figure 4) of the mask. These positions covered the entire space of both the masks where the sensor could be placed. We repeated the SpiroMask test for tidal breathing on a cloth mask. Some participants were not comfortable in strapping the smartphone to the chest with a belt. For all such participants, we relied on their self-count and a metronome test.
We also performed a metronome test (Semjen et al., 1998) for a subset of participants to validate the use of accelerometers to detect actual respiration rate.
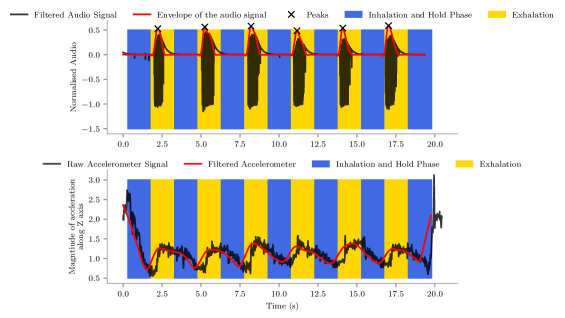
Previous studies have explicitly used a metronome as a ground truth to monitor respiration rate (Chu et al., 2019). The metronome test is similar to the procedure of tidal breathing. But, in addition, we asked the participant to inhale and exhale as per the clicks of a 40 Beat Per Minute (BPM) metronome (40 beats corresponds to 20 exhalations and 20 inhalations). The metronome clicks were played on quietly so that they are not captured in the audio of tidal breathing. We choose 40 BPM because the participants were more comfortable at a lower breathing pace. Figure 5 shows a 20-second window of audio and IMU data for a participant performing breathing as per the metronome. We filtered the IMU data using a moving average filter with a window size of 20 data points. The average peak to peak time is 3.2 second which gives us 6.25 breathing cycles () which is close to the theoretical number of . Figure 5 validates the use of accelerometer as ground truth for respiration rate.
3.8. Exit survey
The participants finally filled out an exit survey where they gave their feedback and opinion on the comfort of masks and spirometry tests. Particularly, we asked the following optional questions:
-
(1)
Can you compare the spirometer and SpiroMask test—which did you prefer and why?
-
(2)
Which mask (out of N95 and cloth masks) feels more comfortable to you and why?
-
(3)
Can you compare the SpiroMask and phone with chest belt for respiration rate monitoring—which did you prefer and why?
The entire user study took approximately an hour per participant.
4. Approach
The goal of SpiroMask is to estimate vital lung parameters and respiration rate using audio of breathing maneuver. Our work is inspired by the advancement of smartphone (Larson et al., 2012) and wearable spirometry (Zhou et al., 2020). The main intuition behind using audio is to leverage the relationship between variation in air flow rate and the intensity change in tracheal sound (Yap and Moussavi, 2002). We now describe the pipeline for estimating the forced breathing and tidal breathing parameters.
4.1. Forced Breathing
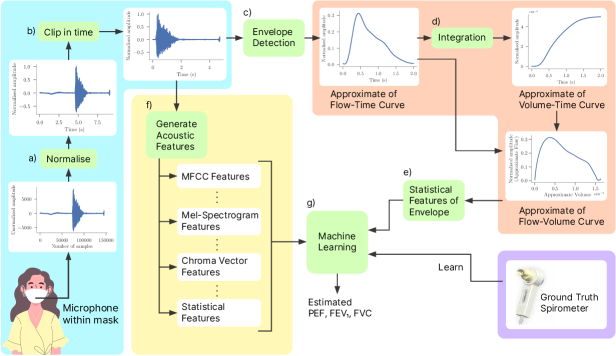
A spirometry test comprises of forceful exhalation through a flow monitoring device that measures instantaneous flow and cumulative exhaled volume (Table 1). Similar to a spirometry test, a user is required to wear our smart mask, breathe in their full lung volume, and forcefully exhale. The entire pipeline of extracting forced breathing parameters is shown in Figure 6. We now explain the steps below.
-
(i)
Recording Audio: The microphone inside the mask records the exhalation and sends the audio data to a computer.
-
(ii)
Normalising amplitude: The audio data is normalised between -1 and 1 (Taylor et al., 2018).
-
(iii)
Clipping audio: Keeping in terms with the ATS guidelines (Culver et al., 2017), we extract the part of the signal which represents a second before the start of forceful exhalation till the end of it. The start of forceful exhalation is detected using a threshold amplitude.
-
(iv)
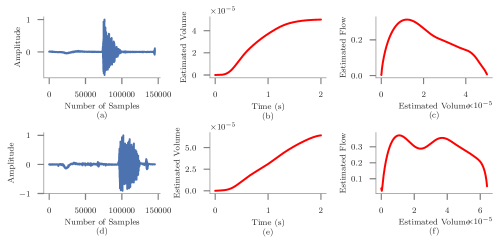
Envelope Detection: The audio signal’s envelope can be assumed to be a reasonable approximation of the flow rate because it is a measure of the overall signal power (or amplitude) at low frequency (Larson et al., 2012). We obtain an estimation of the acoustic envelope of the forceful exhalation using Hilbert Transform (HT) (Johansson, 1999). This method has been employed in previous acoustical flow estimation studies (Larson et al., 2012; Taylor et al., 2018). To validate HT’s estimated envelope for a signal with multiple harmonics, we generated a synthetic amplitude modulated signal using a message signal (the envelope) and a carrier wave (Seydnejad and Kitney, 1997; Sun et al., 2016; Potamianos and Maragos, 1994). Figure 18 (in Appendix) shows that the envelope estimated is a poor fit to the true envelope. We improve the estimated envelope using an finite impulse response (FIR) filter with Kaiser window (Potamianos and Maragos, 1994). Since an audio signal comprises multiple harmonics, we will need to process the HT envelope using an FIR filter with Kaiser window. The estimated lung parameters’ error margin would depend on stopband attenuation and transition width of the filter.
-
(v)
Approximate of ‘Volume-Time’ (VT) curve: The cumulative sum of flow rate over time gives us the approximate measure of the volume of the lung.
-
(vi)
Approximate of ‘Flow-Volume’ (FV) curve: At this stage we have the approximate ‘flow versus time’ curve and the approximate ‘volume versus time’ curve. These two results can be combined to derive the ‘flow versus volume’ curve.
-
(vii)
Feature Generation: We created two sets of features. The first set of features were from the audio waveform and the second set of features was from the FV curve. These features were input into a regression model to predict PEF, FEV1 and FVC.
As shown in Figure 6 (f), we generated acoustic features with a window size of 30ms and a step size of 15ms for each audio sample. The window and the step size were based on prior literature (Larson et al., 2011). The features are Mel Filter Bank Energy (MFE), 10 mean and variance normalised Mel Frequency Cepstral Coefficient (MFCC MVN), the power spectrum, Mel Bands of spectogram. Besides these features, we also generated temporal features from the audio waveform and the FV curve (Barandas et al., 2020). Temporal features include information about entropy, peak to peak distance, the centroid of the signal etc. Previous literature (Barandas et al., 2020) lists all the temporal features and how they are computed for time series data. All the features are described in Table 6 in the Appendix.
MFE features are known to distinguish speakers by modelling the shape of the vocal tract (Tak et al., 2017; Madikeri and Murthy, 2011). Previous literature has used MFCC, temporal and statistical features to classify abnormal lung sound and non-speech sounds (Chatterjee et al., 2019; Rahman et al., 2014; Schuller et al., 2010). As stated in previous work (Larson et al., 2011), the features in the frequency domain can be assumed to be amplitudes excited by reflection in the vocal track and the mouth opening and therefore should be proportional to the flow rate.
-
(viii)
Machine Learning: Given the extracted features and ground truth from spirometry, we train three supervised regression models: linear regression, random forest (RF) and support vector regression (SVR) models to predict PEF, FEV1 and FVC from 260 features including acoustic and temporal features from each audio files. There are two main reasons for choosing these three algorithms. i) Linear regression is easy to implement and thus would be best suited for edge devices with limited compute capabilities. ii) RF and SVR can learn non-linear decision surfaces. They are also non-parametric algorithms (SVR with Radial Basis Function (RBF) is non-parametric) which means that their complexity grows as more data is made available.
Specific features: To predict PEF, we used the cumulative sum of MFE, Log MFE, MFCC MVN, Power Spectrum and Melspectogram as an input to the regression model. To predict FEV1, we clipped the portion of the audio waveform after 1 second of the start of exhalation. These changes in features were inspired by previous literature (Larson et al., 2011). For FVC, we used the features from entire audio waveform.
Feature selection: We used sequential forward selection technique (SFS) (James et al., 2013) to reduce the feature space for faster computation and prevent overfitting.
4.2. Tidal Breathing
Our objective to to estimate respiration rate from tidal breathing. The first step in this process is to classify the audio samples as speech, tidal breathing or noise. Thereafter, an algorithm calculated the average peak to peak time for every sample classified as tidal breathing to derive the respiration rate.
Classification Task: The entire pipeline of estimating respiration rate is explained below.
-
•
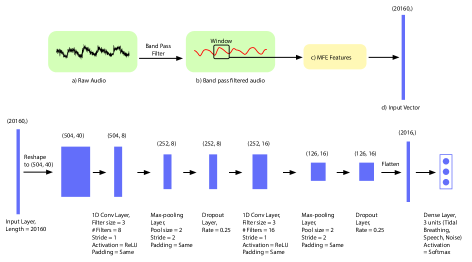
Feature Generation: Pulmonary nasal sounds lie in the frequency range of 20Hz to 2500 Hz whereas speech which is located in the range of 300-4000 Hz (Chatterjee et al., 2019; Seren, 2005). For each audio sample, we used a Butterworth band pass filter with a low cut off frequency of 50Hz and high cut off frequency of 500Hz. We experimentally found out that these choices of frequencies conserved all the tidal breathing information as shown in Figure 8. The audio samples were sliced using a rectangular window as shown in Figure 7 (b). We describe the choice of window size and the size of offset between subsequent window in Section 5.3. For each window, we generate Mel Filter Bank Energy (MFE) features. MFE features isolate vocal track components which are crucial for estimating lung health (Chauhan et al., 2017; Larson et al., 2011; Rahman et al., 2014).
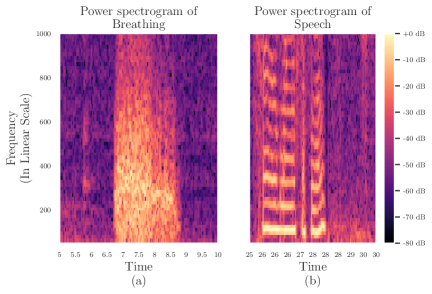
Figure 8. (a) The majority of breathing information is withing 500 Hz. In (b), horizontal lines or harmonics signifies speech information which is different from (a). At a cutoff of 500 Hz, a significant amount of speech information is lost. The lower harmonics aren’t enough to decipher speech audio. -
•
Classification: We used a 1D Convolutional Neural Network (1D CNN) to classify speech, tidal breathing and noise (Zeng et al., 2018; Xu et al., 2021). We collected 40 minutes of tidal breathing data during our user study. To ensure a relatively balanced dataset, we also had 36 minutes of speech and 40 minutes of noise data. The details about noise data is described in the next section. 1D CNNs can be efficiently trained with a limited dataset of 1D signals where a temporal dependence exists between the values (Kiranyaz et al., 2019). As shown in Figure 7, we used a 2 layer CNN with dropout.
-
•
Estimating Respiratory Rate: Once we have identified and isloated tidal breathing audio, we used a respiratory rate detection algorithm to detect the respiratory rate for samples labelled as tidal breathing by the 1D CNN. We applied the Hilbert Transform envelope detection algorithm to the audio samples as described in Section 4.1. We used a peak detection algorithm (Virtanen et al., 2020) over the Hilbert envelope. The total length of the tidal signal divided by the average peak to peak time gives us the respiration rate.
5. Evaluation
5.1. Experimental Setting For Forced Breathing
Signal Processing: The amplitude of the forced breathing audio recordings was normalised between -1 and 1, and clipped in time. Then, Hilbert transform was applied to deduce the approximate flow versus time curve by applying the pipeline explained in Section 4. The shape of the ‘flow-volume’ curve depends on the design of a minimum-order FIR filter. We need a minimum order filter to save on processing time for each sample and to ensure numerical stability (Winder, 2002; Shenoi, 2006). The transition width () and the stopband ripple () of a FIR filter decide the order of the filter. We used as the transition width, (where is the sampling rate which is 12 kHz) and as the stopband ripple to obtain the correct shape of flow-volume curve. Finally, one of the investigators visually analysed the flow-volume curve of every participant for its correct shape (Knudson et al., 1976; Luo et al., 2017). In our future work, a machine learning model would classify correct and incorrect flow-volume curve based on the approach in the previous work (Luo et al., 2017). Figure 9(c) and Figure 9(f) shows a correct and incorrect shape of the flow-volume curve, respectively. While Figure 9(c) shows end expiratory curvilinearity (Miller et al., 2005), the same curvilinearity is missing in Figure 9(f). Beside curvilinearity we also relied on previous literature (Luo et al., 2017) to distinguish between correct and incorrect shape of flow-volume curve. The proper shape implies a successful forceful breathing maneuver.
Cross validation:
In both RF and SVR, we use a nested leave-one-out (subject) cross-validation strategy (LOOCV). The outer loop is used for predicting the lung parameters for a test participant, where all but that participant is used in the train set. The inner loop is used to fine-tune the hyper-parameters. Leave One Out Cross Validation (LOOCV) is preferred because it has far less bias compared to the validation set approach where we randomly split the dataset into train/test/validation or use K-Fold cross validation. LOOCV tends not to overestimate the test error rate as much as the validation approach does (James et al., 2013).
Metric: We reported the mean percentage error across all participants for FEV1, FVC and PEF. The percentage error is given by where is the ground truth value and is the estimated value. Percentage error is chosen as a metric because the guidelines on standardized spirometry (Miller et al., 2005) as well as subsequent research (Rubini et al., 2010; Larson et al., 2012) report the error between two spirometry efforts in percentages. Using the same error metric across Spirometry research helps us in a fair comparison of the performances.
Tuning Hyperparameters: The number of trees in RF span from 5 to 500 in steps of 10. The nodes in RF were expanded until leaves contain less than two samples. For SVR, the hyperparameter space consisted of the regularisation parameter and the type of kernel among linear, radial basis function and polynomial. We used grid search strategy to find the optimal hyperparameters. We discuss the results of forced breathing in Section 5.2.
5.2. Results For Forced Breathing
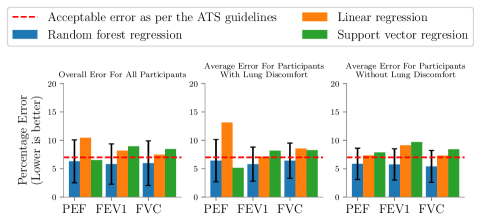
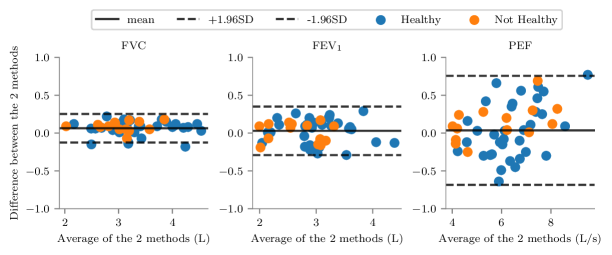
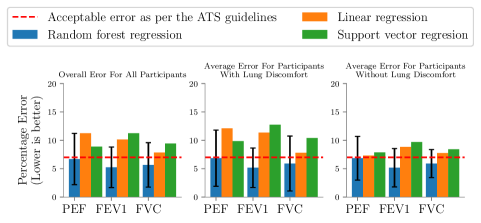
Our overall result for N95 mask is shown in Figure 10. The RF regression performs the best across participants with a healthy and unhealthy lung condition. Across all the participants, we have an Mean Percentage Error (MPE) of 6.30% on PEF, 5.82% on FEV1 and 5.98% on FVC for the N95 mask. To explain the direction of bias, Figure 11 shows the Bland-Altman (Bland and Altman, 1986) plot of each lung function measure. The vertical axis shows the difference between SpiroMask and Spirometer. The horizontal axis shows the mean value of the two methods. Measures taken for healthy participants are shown in blue dots and unhealthy participants in orange dots. Lines indicating the are shown as dashed lines. From the plot, it can be seen that SpiroMask generalises well across healthy and unhealthy participants. On average, the ground truth Spirometer has slightly higher value for all the three parameters. Although, the PEF has higher variability compared to FEV1 and FVC, but agreement holds true for PEF as well.
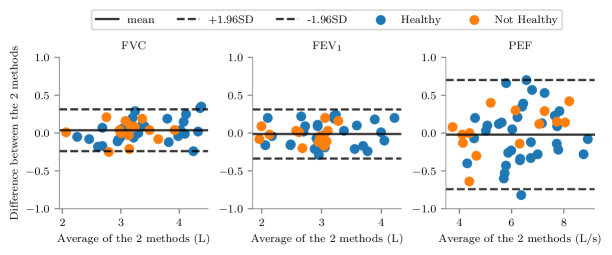
For the cloth mask (Figure 12), we have MPE of 6.71% on PEF, 5.25% on FEV1 and 5.67% on FVC. The Bland-Altman plot for cloth mask (Figure 13) shows a similar agreement between spirometer and SpiroMask. Our results for all the lung parameters fall within the clinically relevant range. As mentioned in previous work (Larson et al., 2011), a clinically relevant range is used because a participant cannot simultaneously use a spirometer and SpiroMask, so actual ground truth is unattainable. The limit of variability for a measure of lung function value should be within 7% over short duration as mandated by the ATS guidelines (Miller et al., 2005). Our result on both the masks are well within the ATS guidelines for both healthy and unhealthy participants. Details of confounding factors and trends are described in Section 8.
Our result on PEF is better on the N95 mask. FEV1 and FVC are marginally better on cloth masks. In the future, we plan to study the comparative performance of the two masks using statistical tests.
The category of features selected using Sequential Forward Selection for PEF, FEV1 and FVC are listed in the Appendix A.
5.3. Experimental Setting For Tidal Breathing
5.3.1. Classification Task
We had 120 samples of tidal breathing across 37 participants. Speech data was available from 108 participants (36 Minutes of data). There were 120 samples of noise data (40 Minutes). The noise class consists of noise collected from different places like crowded cafeteria (30 samples), artificial traffic noise played via YouTube in a Bluetooth speaker in different volume levels (40 samples), white noise (30 samples generated fromAudacity111111https://www.audacityteam.org/) and 20 samples collected from a garden (mostly involving children playing and bird chirping). We have the following set of hyperparameters: the window size, offset size and Fast Fourier Transform (FFT) length (The choice of the hyperparameter space is described in Appendix). The window size cannot be bigger than the shortest audio sample, and the offset size can at maximum be as large as the window size. We used 6-fold cross-validation where the inner loop was used for tuning hyperparameters.
5.3.2. Estimating Respiration Rate
For all samples that were classified as tidal breathing, we applied Hilbert Transformation over the sample, followed by peak detection. Peak detection was also applied on the acceleromter signal. An algorithm compared the average peak to peak time between the ground truth accelerometer signal and the audio signal. The total length of the signal divided by the average peak to peak time gave us the respiration rate. The respiration rate was compared using Mean Absolute Error (MAE) for each participant. Our choice of error is in line with most of the previous literature listed in Table 3 in Section 2.
5.4. Results For Tidal Breathing
5.4.1. Classification task
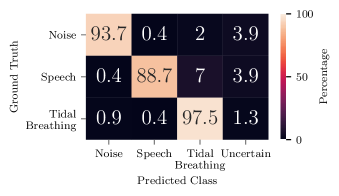
Our result in Figure 14 shows that we achieve an accuracy of 94.7%. The confusion matrix shows that the CNN misclassified 2% of noise samples and 7% speech samples as tidal breathing. As described in Section 4.2, we segmented each audio sample into smaller windows, and the classifier predicts the class of every window. The CNN assigns one class (Tidal Breathing, Noise or Speech) to an audio sample if 90% of the segmented windows of that sample belong to that class. We have set a high threshold to ensure a fewer number of false positives. Figure 14 also shows the percentage of samples which the CNN could not classify. A higher threshold leads to better accuracy, but at the cost of some samples labelled as uncertain. A lower threshold would lead to higher misclassification. For example, the peak detection algorithm would return an inaccurate respiration rate if the CNN labels a speech sample as a tidal sample. A higher threshold lessens misclassification by segregating audio samples that cannot be classified into one class.
5.4.2. Estimating respiration rate
We achieved a Mean Absolute Error (MAE) of 0.49 on the N95 mask. The MAE on the cloth mask was 0.68. Our results are comparable to previous work on estimating respiration rate using smartphone (Rahman et al., 2020) and WiFi signals (Yue et al., 2018). We estimated the respiration rate from the average peak to peak time. It must be noted that the Hilbert Transform envelope for samples incorrectly classified as tidal breathing samples had an amplitude of zero resulting in no peaks, and we thus reject such cycles.
6. Sensitivity analysis
6.1. Sensor Positioning:
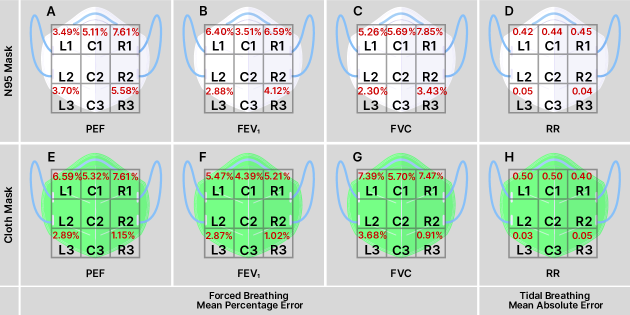
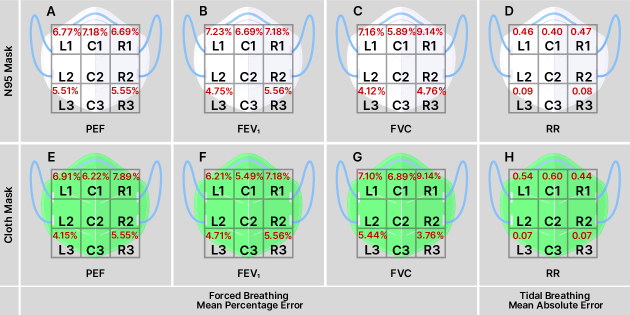
In this section, we analyse the robustness of our methods with respect to sensor placement inside the mask. The motivation to perform this experiment is that a person might retrofit the sensor inside any position inside the mask, and SpiroMask will be expected to monitor forced and tidal breathing without any drop in accuracy of lung parameters.
We described in Section 3 that we collected forced breathing and tidal breathing samples for some participant by placing the sensor in five different positions inside the mask (Figure 4). We had sensor position data for 12 participants (including 8 participants with unhealthy lungs). For tidal breathing, we had sensor positioning data for 18 participants. We used the model trained on audio samples collected by placing the sensor at position L1 and predicted on all other samples that belong to locations C1, R1, L3, R3. We used the same cross-validation strategy as described in Section 5. Figure 15 shows the main results on 12 participants (Forced Breathing) and 18 participants (Tidal Breathing). For forced breathing, we observe that SpiroMask is robust to sensor placement where the MPE for all positions is below 7% (the ATS acceptable error). However, for tidal breathing, location L3 and R3 have the lowest MAE. The low MAE on L3 and R3 can be attributed to the microphone being below the apex of the nose. None of the audio samples from L3 or R3 were misclassified during the classification task explained in Section 5. A detailed break-up of MPE and MAE for forced and tidal breathing among healthy and unhealthy participants is given in Figure 22 and Figure 23 in the Appendix. Note that the error metrics were chosen based on prior work on Smartphone spirometry and respiration rate estimation as explained in Secion 5.1 and Section 5.3.
6.2. Sampling Rate:
For continuous respiration rate monitoring, SpiroMask does not analyse speech signals and is concerned only with tidal breathing signals. The information content in tidal breathing lies between 50 Hz to 500 Hz.
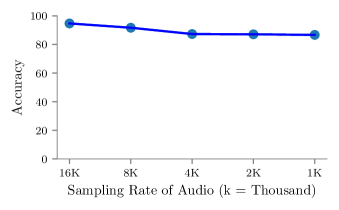
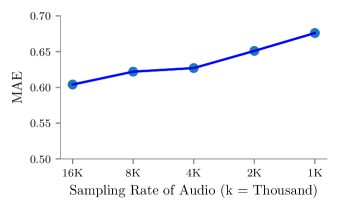
Figure 16 shows the classification accuracy for different sampling rates. The classification accuracy remains above 80% even when the sampling rate is reduced to 1 KHz. The decrease in accuracy is attributed to misclassification of noise and speech samples as ‘uncertain’ samples at a lower sampling rate. Figure 17 shows that the mean absolute error of average peak to peak time (consequently the respiration rate) calculated on tidal samples increases on decreasing the sampling rate. Reducing the sampling rate to 1 KHz also aids in aiding privacy concerns as speeches are not intelligible when audio we sample audio at 1 KHz. To validate speech intelligibility, we asked three participants to hear two speech recordings. Each of these recordings were sampled at 2 KHz and 1 KHz. Each sample size is 16-bits long. None of the participants could decipher the speeches recorded at 1 KHz. One of the three participants could decipher one of the speech recording sampled at 2 KHz. Speech spoken relatively slowly are easier to decipher at lower sampling rate. Therefore for preserving privacy, we can use lower sampling rates at the cost of a slight decrease in the accuracy of the respiration rate.
7. Energy Consumption of Classifier
To study the battery life and the usability of our system we arrived at an estimated power consumption of SpiroMask’s tidal breathing monitoring system. We evaluated the power consumption of the classifier running on the microcontroller. We used an oscilloscope to calculate the voltage drop across a shunt resistor. We arrived at the value of shunt resistor on basis of the voltage resolution of the oscilloscope so that a small current draw (in order of ) leads to a high voltage drop (in order of 100) across the shunt. Consequently, we could arrive at the current consumption. The microcontroller first samples the audio, after which the model inference predicts whether the sampled audio represents ‘Noise’, ‘Tidal Breathing’ or ‘Speech’. The current consumption at different stages of the microcontroller can be seen in Table 5. With a duty cycle of one respiratory rate every minute, the average current consumption is 1.64 mA. To arrive at a battery life estimate, we assume 11 hrs/day of active respiration rate measurement with a 240 mAh coin cell battery. In this scenario, SpiroMask’s respiration rate system is expected to last for approximately thirteen days on battery power alone.
|
|
||||||
| No Operation | Sampling | Classifier | |||||
| 0.96 | 1.6 | 4.7 | 13 Days | ||||
8. Confounding Factors and Trends
We performed 8-way multivariate analysis of variance (MANOVA) (Warne, 2014)
tests to determine if other variables significantly contributed to the difference (in terms of percent error) between SpiroMask and the spirometer in estimating the forced breathing parameters FEV1, FVC and PEF. MANOVA is more suitable than univariate analysis of variance (ANOVA) tests for forced breathing since we have 3 dependent variables. We performed separate MANOVA tests for N95 and cloth masks. We used height, weight, gender, age, whether the subject has performed spirometry tests before, whether the subject reported any lung ailments, whether the subject has the habit of smoking, and whether the subject had a meal before appearing for the test as the 8 grouping variables. The test for cloth mask shows that none of the grouping variables have a significant effect on the percent error between SpiroMask and spirometer measures (all p-values were greater than 0.05, the significance level of the test).
The test for N95 mask suggests that height could be a significant variable (p-value 0.04). Since this is only suggested by the test for N95 mask and not by the test for cloth mask, we need to investigate further to determine how significant the variable height is. We have provided scatter plots showing the variation of percent error for the forced breathing parameters with respect to height (for N95 mask) in Section A.6 of the Appendix. The presence of trend between FVC and FEV1 with height suggests incorporating such information whenever available will further improve our models. We leave the detailed ablation study with participant features like health and weight for the future.
We also performed 7-way analysis of variance (ANOVA) tests to determine if other variables significantly contributed to the difference (in terms of percent error) between SpiroMask and a smartphone strapped to the chest in estimating the tidal breathing parameter (respiration rate). We performed separate ANOVA tests for N95 and cloth masks. We used height, weight, gender, age, whether the subject reported any lung ailments, whether the subject has the habit of smoking, and whether the subject had a meal before appearing for the test as the 7 grouping variables. The tests for both N95 and cloth masks show that none of the grouping variables have a significant effect on the percent error between SpiroMask and smartphone measures (all p-values were greater than 0.05, the significance level of the test). Refer to Section A.6 in the Appendix for more detailed results of the MANOVA and ANOVA tests.
9. Participant feedback
We collected feedback through an exit survey with three optional questions: whether they preferred a spirometer or SpiroMask (for measuring forced breathing parameters), whether they preferred SpiroMask or a phone strapped to the chest with a belt (for measuring tidal breathing parameters), and whether they preferred a cloth mask or an N95 mask.
9.1. SpiroMask and spirometer
Around 58% of the responses preferred SpiroMask over a spirometer, while around 21% of the responses were equally comfortable with both methods. The main reasons cited by the responses preferring SpiroMask over a spirometer included: “mask was more comfortable”, “forced exhalation was easier to perform in a mask”, and “spirometer was hard to hold and operate, it is bulky”. Some of the older aged subjects commented that “it becomes hard to hold the spirometer in the mouth for a long time” (subject no. 16), and “mask is preferable as spirometer required breathing using mouthpiece which was a bit difficult” (subject no. 7). Interestingly, 75% preferred a cloth mask over an N95 mask, mainly based on comfort.
9.2. SpiroMask and chest belt
As mentioned in Section 4, we used the accelerometer sensor of a smartphone to collect ground truth on respiration rate. But, we could attain the ground truth via accelerometer only for a few participants. For the rest, we relied on self-counting as the ground truth. Among those who wore the smartphone strapped belt, 91% preferred SpiroMask over the phone to monitor tidal breathing during the user study. A participant said, “ the chest belt seemed to restrict breathing,” and others voiced similar opinions. When asked by the investigator if they would like to wear a chest belt or SpiroMask as a part of their daily life, the opinion unanimously favoured SpiroMask.
10. Limitations and Future Work
We now discuss some limitations of our work and proposed future work to address them
-
•
Human motions hinder breathing measurement. Prior research has shown that sensors worn in the chest can be used to measure breathing parameters during activities such as walking (Whitlock et al., 2020). But, we found that wearing a chest belt is not always comfortable and is susceptible to jittering activity. Currently, SpiroMask can classify noise, breathing audio and speech but does not attempt to extract breathing signal from noisy audio recordings. We investigated audio signals which were collected from the microphone placed inside a user donned mask in simultaneous presence of background noise and user activity. In our follow up work (Adhikary et al., 2022), we demonstrated the challenges in extracting useful breathing information from such signals.
-
•
Our confounding variable analysis suggests that incorporating personal parameters such as height can help improve the estimation for forced breathing parameters. In the future, we plan to conduct an ablation study to study the potential improvements in modelling when personal health parameters are available. Previous smartphone spirometry work has shown improvement via personalisation (Larson et al., 2012), though their notion of personalisation was different.
-
•
A detailed large scale user study on the usability of SpiroMask is currently out of the scope of our current research. In our current work, we evaluated the percentage of participants who would prefer SpiroMask over a traditional spirometer or a chest belt.
-
•
Currently, SpiroMask could not detect inhalations due to low amplitude. This is a known problem in smartphone spirometry (Larson et al., 2012). However, unlike the smartphone, since we use a custom microphone, we plan to experiment with multi-microphone setup, one with high gain for inhalation and the other for exhalation.
-
•
In our current work, we do not estimate the tidal volume. This is primarily due to lack of clinical-grade ground truth device for tidal volume estimation. We believe that our existing pipeline for forced volume should be easily adaptable to estimate tidal volume.
-
•
In the current work, we predict specific points on the flow-volume curve (such as FEV1, FVC). In the future, we plan to predict the whole flow-volume curve instead of only these points. This problem can be naturally mapped to a sequence-to-sequence learning problem (Sutskever et al., 2014). We plan to leverage recent advances in neural networks based sequence to sequence methods for this task (Zhang et al., 2018; Nguyen et al., 2020).
-
•
Our current prototype requires external power. Recent advances in the community have leveraged triboelectric nanogenerator to develop self powered acoustic sensor (Arora et al., 2018). In the future, we would like to explore these recent advances towards making the system self-powered.
-
•
Our work shows that lung health can be diagnosed by monitoring forceful breathing or tidal breathing via a microphone placed inside a consumer-grade N95 or cloth mask. We optimised the Convolutions Neural Network (CNN) classifier described in Section 4.2 to work in real-time in the Arduino Nano 33 BLE Sense121212https://store-usa.arduino.cc/products/arduino-nano-33-ble-sense microcontroller. We used offline algorithms to deduce forced and tidal breathing parameters. We envision that a SpiroMask will feed the lung health parameters on a wearer’s smartphone over Bluetooth Low Energy (BLE).
11. Conclusion
In this paper, we presented a system for performing spirometry and continuous respiration rate monitoring using consumer-grade N95 and cloth masks. Forced and tidal breathing are used for deriving lung health bio-markers like estimating the respiration rate and volume of exhaled air. We showed that a retrofit sensor placed inside an N95 or a two-layered cloth mask can estimate forced and tidal breathing. Our evaluation of over 48 participants of forced breathing implies that the accuracy of wearable spirometry is well within the clinically accepted range for participants with and without lung ailments. Moreover, our work is comparable to existing research on portable spirometry and requires less complex modelling, making it possible to deploy it on microcontrollers running machine learning models. Our subjective evaluation in our study population shows acceptability and ease of use compared to traditional spirometry.
Acknowledgments
The authors thank the reviewers for their constructive and actionable feedback. The authors would also thank Prof. Mayank Goel for his insights on some of the experiments. Rishiraj is supported by the Prime Minister’s Research Fellowship (PMRF) awarded by the Government of India and the Fulbright fellowship awarded jointly by the Indian and the US governments.
References
- (1)
- Adhikary et al. (2020) Rishiraj Adhikary, Tanmay Srivastava, Prerna Khanna, Aabhas Asit Senapati, and Nipun Batra. 2020. Naqaab: towards health sensing and persuasion via masks. In Adjunct Proceedings of the 2020 ACM International Joint Conference on Pervasive and Ubiquitous Computing and Proceedings of the 2020 ACM International Symposium on Wearable Computers. 5–8.
- Adhikary et al. (2022) Rishiraj Adhikary, Aryan Varshney, and Nipun Batra. 2022. Towards Continuous Respiration Rate Detection While Walking. In Adjunct Proceedings of the 2022 ACM International Joint Conference on Pervasive and Ubiquitous Computing and Proceedings of the 2022 ACM International Symposium on Wearable Computers.
- Aliverti (2017) Andrea Aliverti. 2017. Wearable technology: role in respiratory health and disease. Breathe 13, 2 (2017), e27–e36.
- Aly and Youssef (2016) Heba Aly and Moustafa Youssef. 2016. Zephyr: Ubiquitous accurate multi-sensor fusion-based respiratory rate estimation using smartphones. In IEEE INFOCOM 2016-The 35th Annual IEEE International Conference on Computer Communications. IEEE, 1–9.
- Arora et al. (2018) Nivedita Arora, Steven L Zhang, Fereshteh Shahmiri, Diego Osorio, Yi-Cheng Wang, Mohit Gupta, Zhengjun Wang, Thad Starner, Zhong Lin Wang, and Gregory D Abowd. 2018. SATURN: A thin and flexible self-powered microphone leveraging triboelectric nanogenerator. Proceedings of the ACM on Interactive, Mobile, Wearable and Ubiquitous Technologies 2, 2 (2018), 1–28.
- Barandas et al. (2020) Marília Barandas, Duarte Folgado, Letícia Fernandes, Sara Santos, Mariana Abreu, Patrícia Bota, Hui Liu, Tanja Schultz, and Hugo Gamboa. 2020. TSFEL: Time series feature extraction library. SoftwareX 11 (2020), 100456.
- Bland and Altman (1986) J Martin Bland and DouglasG Altman. 1986. Statistical methods for assessing agreement between two methods of clinical measurement. The lancet 327, 8476 (1986), 307–310.
- Brakema et al. (2019) EA Brakema, FA Van Gemert, RMJJ Van der Kleij, S Salvi, Milo Puhan, and NH Chavannes. 2019. COPD’s early origins in low-and-middle income countries: what are the implications of a false start? NPJ primary care respiratory medicine 29, 1 (2019), 1–3.
- Carey and Foundation (2010) W.D. Carey and Cleveland Clinic Foundation. 2010. Current Clinical Medicine. Saunders Elsevier. https://books.google.co.in/books?id=qo-rpwAACAAJ
- Chatterjee et al. (2019) Soujanya Chatterjee, Md Mahbubur Rahman, Ebrahim Nemati, Viswam Nathan, Korosh Vatanparvar, and Jilong Kuang. 2019. mLung++ automated characterization of abnormal lung sounds in pulmonary patients using multimodal mobile sensors. In Adjunct Proceedings of the 2019 ACM International Joint Conference on Pervasive and Ubiquitous Computing and Proceedings of the 2019 ACM International Symposium on Wearable Computers. 474–481.
- Chauhan et al. (2017) Jagmohan Chauhan, Yining Hu, Suranga Seneviratne, Archan Misra, Aruna Seneviratne, and Youngki Lee. 2017. BreathPrint: Breathing acoustics-based user authentication. In Proceedings of the 15th Annual International Conference on Mobile Systems, Applications, and Services. 278–291.
- Chu et al. (2019) Michael Chu, Thao Nguyen, Vaibhav Pandey, Yongxiao Zhou, Hoang N Pham, Ronen Bar-Yoseph, Shlomit Radom-Aizik, Ramesh Jain, Dan M Cooper, and Michelle Khine. 2019. Respiration rate and volume measurements using wearable strain sensors. NPJ digital medicine 2, 1 (2019), 1–9.
- Culver et al. (2017) Bruce H Culver, Brian L Graham, Allan L Coates, Jack Wanger, Cristine E Berry, Patricia K Clarke, Teal S Hallstrand, John L Hankinson, David A Kaminsky, Neil R MacIntyre, et al. 2017. Recommendations for a standardized pulmonary function report. An official American Thoracic Society technical statement. American journal of respiratory and critical care medicine 196, 11 (2017), 1463–1472.
- Curtiss et al. (2021) Alexander Curtiss, Blaine Rothrock, Abu Bakar, Nivedita Arora, Jason Huang, Zachary Englhardt, Aaron-Patrick Empedrado, Chixiang Wang, Saad Ahmed, Yang Zhang, et al. 2021. FaceBit: Smart Face Masks Platform. Proceedings of the ACM on Interactive, Mobile, Wearable and Ubiquitous Technologies 5, 4 (2021), 1–44.
- Dai et al. (2021) Ruixuan Dai, Chenyang Lu, Michael Avidan, and Thomas Kannampallil. 2021. RespWatch: Robust Measurement of Respiratory Rate on Smartwatches with Photoplethysmography. In Proceedings of the International Conference on Internet-of-Things Design and Implementation. 208–220.
- Downey (2016) Allen Downey. 2016. Think DSP: digital signal processing in Python. ” O’Reilly Media, Inc.”.
- Fieselmann et al. (1993) John F Fieselmann, Michael S Hendryx, Charles M Helms, and Douglas S Wakefield. 1993. Respiratory rate predicts cardiopulmonary arrest for internal medicine inpatients. Journal of general internal medicine 8, 7 (1993), 354–360.
- French and Steinberg (1947) Norman R French and John C Steinberg. 1947. Factors governing the intelligibility of speech sounds. The journal of the Acoustical society of America 19, 1 (1947), 90–119.
- Goel (2016) Mayank Goel. 2016. Extending the capabilities of smartphone sensors for applications in interaction and health. https://digital.lib.washington.edu/researchworks/handle/1773/37080. [Online; accessed 10-April-2022].
- Goel et al. (2016) Mayank Goel, Elliot Saba, Maia Stiber, Eric Whitmire, Josh Fromm, Eric C Larson, Gaetano Borriello, and Shwetak N Patel. 2016. Spirocall: Measuring lung function over a phone call. In Proceedings of the 2016 CHI conference on human factors in computing systems. 5675–5685.
- Graham et al. (2019) Brian L Graham, Irene Steenbruggen, Martin R Miller, Igor Z Barjaktarevic, Brendan G Cooper, Graham L Hall, Teal S Hallstrand, David A Kaminsky, Kevin McCarthy, Meredith C McCormack, et al. 2019. Standardization of spirometry 2019 update. An official American thoracic Society and European respiratory Society technical statement. American journal of respiratory and critical care medicine 200, 8 (2019), e70–e88.
- Hernandez et al. (2014) Javier Hernandez, Yin Li, James M Rehg, and Rosalind W Picard. 2014. Bioglass: Physiological parameter estimation using a head-mounted wearable device. In 2014 4th International Conference on Wireless Mobile Communication and Healthcare-Transforming Healthcare Through Innovations in Mobile and Wireless Technologies (MOBIHEALTH). IEEE, 55–58.
- Hernandez et al. (2015) Javier Hernandez, Daniel McDuff, and Rosalind W Picard. 2015. Biowatch: estimation of heart and breathing rates from wrist motions. In 2015 9th International Conference on Pervasive Computing Technologies for Healthcare (PervasiveHealth). IEEE, 169–176.
- Hodgetts et al. (2002) Timothy J Hodgetts, Gary Kenward, Ioannis G Vlachonikolis, Susan Payne, and Nicolas Castle. 2002. The identification of risk factors for cardiac arrest and formulation of activation criteria to alert a medical emergency team. Resuscitation 54, 2 (2002), 125–131.
- Islam et al. (2021) Bashima Islam, Md Mahbubur Rahman, Tousif Ahmed, Mohsin Yusuf Ahmed, Md Mehedi Hasan, Viswam Nathan, Korosh Vatanparvar, Ebrahim Nemati, Jilong Kuang, and Jun Alex Gao. 2021. BreathTrack: Detecting Regular Breathing Phases from Unannotated Acoustic Data Captured by a Smartphone. Proceedings of the ACM on Interactive, Mobile, Wearable and Ubiquitous Technologies 5, 3 (2021), 1–22.
- James et al. (2013) Gareth James, Daniela Witten, Trevor Hastie, and Robert Tibshirani. 2013. An introduction to statistical learning. Vol. 112. Springer.
- Jan Jongboom (2019) Zach Shelby Jan Jongboom. 2019. Edge Impulse. https://www.edgeimpulse.com/. [Online; accessed 13-April-2022].
- Johansson (1999) Mathias Johansson. 1999. The hilbert transform. Mathematics Master’s Thesis. Växjö University, Suecia. Disponible en internet: http://w3. msi. vxu. se/exarb/mj_ex. pdf, consultado el 19 (1999).
- Johnson et al. (2020) Karin G Johnson, Shannon S Sullivan, Afua Nti, Vida Rastegar, and Indira Gurubhagavatula. 2020. The impact of the COVID-19 pandemic on sleep medicine practices. Journal of Clinical Sleep Medicine (2020), jcsm–8830.
- Jongboom (2022) Jan Jongboom. 2022. Edge Impulse Forum. https://forum.edgeimpulse.com/t/what-pre-processing-step-is-applied-to-raw-audio-samples-by-edge-impulse/2706/4?u=rishi. [Online; accessed 7-May-2022].
- Kiranyaz et al. (2019) Serkan Kiranyaz, Turker Ince, Osama Abdeljaber, Onur Avci, and Moncef Gabbouj. 2019. 1-d convolutional neural networks for signal processing applications. In ICASSP 2019-2019 IEEE International Conference on Acoustics, Speech and Signal Processing (ICASSP). IEEE, 8360–8364.
- Knudson et al. (1976) Ronald J Knudson, Ronald C Slatin, Michael D Lebowitz, and Benjamin Burrows. 1976. The maximal expiratory flow-volume curve: normal standards, variability, and effects of age. American Review of Respiratory Disease 113, 5 (1976), 587–600.
- Kouri et al. (2020) Andrew Kouri, Samir Gupta, Azadeh Yadollahi, Clodagh M Ryan, Andrea S Gershon, Teresa To, Susan M Tarlo, Roger S Goldstein, Kenneth R Chapman, and Chung-Wai Chow. 2020. CHEST Reviews: Addressing reduced laboratory-based pulmonary function testing during a pandemic. Chest (2020).
- Kristiansen et al. (2021) Stein Kristiansen, Konstantinos Nikolaidis, Thomas Plagemann, Vera Goebel, Gunn Marit Traaen, Britt Øverland, Lars Aakerøy, Tove-Elizabeth Hunt, Jan Pål Loennechen, Sigurd Loe Steinshamn, et al. 2021. Machine Learning for Sleep Apnea Detection with Unattended Sleep Monitoring at Home. ACM Transactions on Computing for Healthcare 2, 2 (2021), 1–25.
- Kumar et al. (2021) Agni Kumar, Vikramjit Mitra, Carolyn Oliver, Adeeti Ullal, Matt Biddulph, and Irida Mance. 2021. Estimating Respiratory Rate From Breath Audio Obtained Through Wearable Microphones. In 2021 43rd Annual International Conference of the IEEE Engineering in Medicine & Biology Society (EMBC). IEEE, 7310–7315.
- Larson et al. (2012) Eric C Larson, Mayank Goel, Gaetano Boriello, Sonya Heltshe, Margaret Rosenfeld, and Shwetak N Patel. 2012. SpiroSmart: using a microphone to measure lung function on a mobile phone. In Proceedings of the 2012 ACM Conference on ubiquitous computing. 280–289.
- Larson et al. (2011) Eric C Larson, TienJui Lee, Sean Liu, Margaret Rosenfeld, and Shwetak N Patel. 2011. Accurate and privacy preserving cough sensing using a low-cost microphone. In Proceedings of the 13th international conference on Ubiquitous computing. 375–384.
- Liaqat et al. (2019) Daniyal Liaqat, Mohamed Abdalla, Pegah Abed-Esfahani, Moshe Gabel, Tatiana Son, Robert Wu, Andrea Gershon, Frank Rudzicz, and Eyal De Lara. 2019. WearBreathing: Real world respiratory rate monitoring using smartwatches. Proceedings of the ACM on Interactive, Mobile, Wearable and Ubiquitous Technologies 3, 2 (2019), 1–22.
- Luo et al. (2017) Andrew Z Luo, Eric Whitmire, James W Stout, Drew Martenson, and Shwetak Patel. 2017. Automatic characterization of user errors in spirometry. In 2017 39th Annual International Conference of the IEEE Engineering in Medicine and Biology Society (EMBC). IEEE, 4239–4242.
- Madikeri and Murthy (2011) Srikanth R Madikeri and Hema A Murthy. 2011. Mel filter bank energy-based slope feature and its application to speaker recognition. In 2011 National Conference on Communications (NCC). IEEE, 1–4.
- Mariakakis et al. (2019) Alex Mariakakis, Edward Wang, Shwetak Patel, and Mayank Goel. 2019. Challenges in realizing smartphone-based health sensing. IEEE Pervasive Computing 18, 2 (2019), 76–84.
- Miller et al. (2005) Martin R Miller, JATS Hankinson, V Brusasco, F Burgos, R Casaburi, A Coates, R Crapo, Pvd Enright, CPM Van Der Grinten, P Gustafsson, et al. 2005. Standardisation of spirometry. European respiratory journal 26, 2 (2005), 319–338.
- Morrison (1969) Murray D Morrison. 1969. Nasal spirometry: a volumetric study of nasal air flow capacity. Archives of Otolaryngology 90, 5 (1969), 636–640.
- Nam et al. (2015) Yunyoung Nam, Bersain A Reyes, and Ki H Chon. 2015. Estimation of respiratory rates using the built-in microphone of a smartphone or headset. IEEE journal of biomedical and health informatics 20, 6 (2015), 1493–1501.
- Nguyen et al. (2020) Thai-Son Nguyen, Sebastian Stueker, Jan Niehues, and Alex Waibel. 2020. Improving sequence-to-sequence speech recognition training with on-the-fly data augmentation. In ICASSP 2020-2020 IEEE International Conference on Acoustics, Speech and Signal Processing (ICASSP). IEEE, 7689–7693.
- O’Shaughnessy (1988) Douglas O’Shaughnessy. 1988. Linear predictive coding. IEEE potentials 7, 1 (1988), 29–32.
- Otulana et al. (1990) Babatunde A Otulana, Tim Higenbottam, Lilie Ferrari, John Scott, Gilbert Igboaka, and John Wallwork. 1990. The use of home spirometry in detecting acute lung rejection and infection following heart-lung transplantation. Chest 97, 2 (1990), 353–357.
- Palmer et al. (2004) John Palmer, Julian Allen, and Oscar Mayer. 2004. Tidal breathing analysis. NeoReviews 5, 5 (2004), e186–e193.
- Potamianos and Maragos (1994) Alexandros Potamianos and Petros Maragos. 1994. A comparison of the energy operator and the Hilbert transform approach to signal and speech demodulation. Signal processing 37, 1 (1994), 95–120.
- Rahman et al. (2020) Md Mahbubur Rahman, Mohsin Yusuf Ahmed, Tousif Ahmed, Bashima Islam, Viswam Nathan, Korosh Vatanparvar, Ebrahim Nemati, Daniel McCaffrey, Jilong Kuang, and Jun Alex Gao. 2020. BreathEasy: Assessing Respiratory Diseases Using Mobile Multimodal Sensors. In Proceedings of the 2020 International Conference on Multimodal Interaction. 41–49.
- Rahman et al. (2019) Md Mahbubur Rahman, Viswam Nathan, Ebrahim Nemati, Korosh Vatanparvar, Mohsin Ahmed, and Jilong Kuang. 2019. Towards reliable data collection and annotation to extract pulmonary digital biomarkers using mobile sensors. In Proceedings of the 13th EAI International Conference on Pervasive Computing Technologies for Healthcare. 179–188.
- Rahman et al. (2014) Tauhidur Rahman, Alexander Travis Adams, Mi Zhang, Erin Cherry, Bobby Zhou, Huaishu Peng, and Tanzeem Choudhury. 2014. BodyBeat: a mobile system for sensing non-speech body sounds.. In MobiSys, Vol. 14. Citeseer, 2–594.
- Röddiger et al. (2019) Tobias Röddiger, Daniel Wolffram, David Laubenstein, Matthias Budde, and Michael Beigl. 2019. Towards respiration rate monitoring using an in-ear headphone inertial measurement unit. In Proceedings of the 1st International Workshop on Earable Computing. 48–53.
- Rubini et al. (2010) Alessandro Rubini, Andrea Parmagnani, Marco Redaelli, Michela Bondì, Daniele Del Monte, and Vincenzo Catena. 2010. Daily variations of spirometric indexes and maximum expiratory pressure in young healthy adults. Biological Rhythm Research 41, 2 (2010), 105–112.
- Schluger and Koppaka (2014) Neil W Schluger and Ram Koppaka. 2014. Lung disease in a global context. A call for public health action. Annals of the American Thoracic Society 11, 3 (2014), 407–416.
- Schuller et al. (2010) Björn Schuller, Stefan Steidl, Anton Batliner, Felix Burkhardt, Laurence Devillers, Christian Müller, and Shrikanth S Narayanan. 2010. The INTERSPEECH 2010 paralinguistic challenge. In Eleventh Annual Conference of the International Speech Communication Association.
- Semiconductor (2022) Nordic Semiconductor. 2022. Bluetooth Low Energy data throughput. https://infocenter.nordicsemi.com/index.jsp?topic=%2Fsds_s140%2FSDS%2Fs1xx%2Fble_data_throughput%2Fble_data_throughput.html. [Online; accessed 7-May-2022].
- Semjen et al. (1998) Andras Semjen, Dirk Vorberg, and Hans-Henning Schulze. 1998. Getting synchronized with the metronome: Comparisons between phase and period correction. Psychological Research 61, 1 (1998), 44–55.
- Seren (2005) Erdal Seren. 2005. Frequency spectra of normal expiratory nasal sound. American journal of rhinology 19, 3 (2005), 257–261.
- Seydnejad and Kitney (1997) Saeid Reza Seydnejad and Richard I Kitney. 1997. Real-time heart rate variability extraction using the Kaiser window. IEEE Transactions on Biomedical Engineering 44, 10 (1997), 990–1005.
- Shenoi (2006) Belle A Shenoi. 2006. Introduction to digital signal: Processing and filter design. Wiley Online Library.
- Shih et al. (2019) Chen-Hsuan Shih, Naofumi Tomita, Yanick X Lukic, Álvaro Hernández Reguera, Elgar Fleisch, and Tobias Kowatsch. 2019. Breeze: Smartphone-based acoustic real-time detection of breathing phases for a gamified biofeedback breathing training. Proceedings of the ACM on Interactive, Mobile, Wearable and Ubiquitous Technologies 3, 4 (2019), 1–30.
- Sim (2019) Ida Sim. 2019. Mobile devices and health. New England Journal of Medicine 381, 10 (2019), 956–968.
- Song et al. (2020) Xingzhe Song, Boyuan Yang, Ge Yang, Ruirong Chen, Erick Forno, Wei Chen, and Wei Gao. 2020. SpiroSonic: monitoring human lung function via acoustic sensing on commodity smartphones. In Proceedings of the 26th Annual International Conference on Mobile Computing and Networking. 1–14.
- Soriano et al. (2009) Joan B Soriano, Jan Zielinski, and David Price. 2009. Screening for and early detection of chronic obstructive pulmonary disease. The Lancet 374, 9691 (2009), 721–732.
- Sun et al. (2016) Changjun Sun, Lijing Li, and Wen Chen. 2016. Quadratic correlation time delay estimation algorithm based on kaiser window and hilbert transform. In 2016 Sixth International Conference on Instrumentation & Measurement, Computer, Communication and Control (IMCCC). IEEE, 927–931.
- Sun et al. (2017) Xiao Sun, Li Qiu, Yibo Wu, Yeming Tang, and Guohong Cao. 2017. Sleepmonitor: Monitoring respiratory rate and body position during sleep using smartwatch. Proceedings of the ACM on interactive, mobile, wearable and ubiquitous technologies 1, 3 (2017), 1–22.
- Sutskever et al. (2014) Ilya Sutskever, Oriol Vinyals, and Quoc V Le. 2014. Sequence to sequence learning with neural networks. arXiv preprint arXiv:1409.3215 (2014).
- Tak et al. (2017) Rishabh N Tak, Dharmesh M Agrawal, and Hemant A Patil. 2017. Novel phase encoded mel filterbank energies for environmental sound classification. In International Conference on Pattern Recognition and Machine Intelligence. Springer, 317–325.
- Tan and Ng (2008) Wan C Tan and Tze P Ng. 2008. COPD in Asia: where East meets West. Chest 133, 2 (2008), 517–527.
- Taylor et al. (2018) Terence E Taylor, Helena Lacalle Muls, Richard W Costello, and Richard B Reilly. 2018. Estimation of inhalation flow profile using audio-based methods to assess inhaler medication adherence. PloS one 13, 1 (2018), e0191330.
- Teferra (2017) Meseret N Teferra. 2017. ISO 14971-Medical Device Risk Management Standard. International Journal of Latest Research in Engineering and Technology (IJLRET) 3, 3 (2017), 83–87.
- Thap et al. (2016) Tharoeun Thap, Heewon Chung, Changwon Jeong, Ki-Eun Hwang, Hak-Ryul Kim, Kwon-Ha Yoon, and Jinseok Lee. 2016. High-resolution time-frequency spectrum-based lung function test from a smartphone microphone. Sensors 16, 8 (2016), 1305.
- Tomasic et al. (2018) Ivan Tomasic, Nikica Tomasic, Roman Trobec, Miroslav Krpan, and Tomislav Kelava. 2018. Continuous remote monitoring of COPD patients—justification and explanation of the requirements and a survey of the available technologies. Medical & biological engineering & computing 56, 4 (2018), 547–569.
- Townsend et al. (2011) Mary C Townsend, Occupational, Environmental Lung Disorders Committee, et al. 2011. Spirometry in the occupational health setting–2011 update. Journal of occupational and environmental medicine 53, 5 (2011), 569–584.
- Van der Ent et al. (1996) CK Van der Ent, HJ Brackel, J Van der Laag, and Jan M Bogaard. 1996. Tidal breathing analysis as a measure of airway obstruction in children three years of age and older. American journal of respiratory and critical care medicine 153, 4 (1996), 1253–1258.
- van Schayck et al. (2003) Onno CP van Schayck, Anthony D’Urzo, Giovanni Invernizzi, Miguel Román, Björn Ställberg, and Christopher Urbina. 2003. Early detection of chronic obstructive pulmonary disease (COPD): the role of spirometry as a diagnostic tool in primary care. Primary Care Respiratory Journal 12, 3 (2003), 90–93.
- Virtanen et al. (2020) Pauli Virtanen, Ralf Gommers, Travis E Oliphant, Matt Haberland, Tyler Reddy, David Cournapeau, Evgeni Burovski, Pearu Peterson, Warren Weckesser, Jonathan Bright, et al. 2020. SciPy 1.0: fundamental algorithms for scientific computing in Python. Nature methods 17, 3 (2020), 261–272.
- Viswanath et al. (2018) Varun Viswanath, Jake Garrison, and Shwetak Patel. 2018. SpiroConfidence: determining the validity of smartphone based spirometry using machine learning. In 2018 40th Annual International Conference of the IEEE Engineering in Medicine and Biology Society (EMBC). IEEE, 5499–5502.
- Walker et al. (1990) H Kenneth Walker, W Dallas Hall, and J Willis Hurst. 1990. Clinical methods: the history, physical, and laboratory examinations. (1990).
- Wang et al. (2021) Xuyu Wang, Runze Huang, Chao Yang, and Shiwen Mao. 2021. Smartphone Sonar-Based Contact-Free Respiration Rate Monitoring. ACM Transactions on Computing for Healthcare 2, 2 (2021), 1–26.
- Warne (2014) Russell T Warne. 2014. A primer on multivariate analysis of variance (MANOVA) for behavioral scientists. Practical Assessment, Research & Evaluation 19 (2014).
- Whitlock et al. (2020) Justin Whitlock, Joshua Sill, and Shubham Jain. 2020. A-spiro: Towards continuous respiration monitoring. Smart Health 15 (2020), 100105.
- Winder (2002) Steve Winder. 2002. Analog and digital filter design. Elsevier.
- Xu et al. (2021) Xuhai Xu, Ebrahim Nemati, Korosh Vatanparvar, Viswam Nathan, Tousif Ahmed, Md Mahbubur Rahman, Daniel McCaffrey, Jilong Kuang, and Jun Alex Gao. 2021. Listen2Cough: Leveraging End-to-End Deep Learning Cough Detection Model to Enhance Lung Health Assessment Using Passively Sensed Audio. Proceedings of the ACM on Interactive, Mobile, Wearable and Ubiquitous Technologies 5, 1 (2021), 1–22.
- Yadavar (2019) Swagata Yadavar. 2019. Why India Is Struggling To Tackle Its Lung Disease Crisis. https://www.indiaspend.com/why-india-is-struggling-to-tackle-its-pulmonary-disease-crisis/. [Online; accessed 10-March-2022].
- Yap and Moussavi (2002) Yee Leng Yap and Zahra Moussavi. 2002. Acoustic airflow estimation from tracheal sound power. In IEEE CCECE2002. Canadian Conference on Electrical and Computer Engineering. Conference Proceedings (Cat. No. 02CH37373), Vol. 2. IEEE, 1073–1076.
- Yue et al. (2018) Shichao Yue, Hao He, Hao Wang, Hariharan Rahul, and Dina Katabi. 2018. Extracting multi-person respiration from entangled rf signals. Proceedings of the ACM on Interactive, Mobile, Wearable and Ubiquitous Technologies 2, 2 (2018), 1–22.
- Zeng et al. (2018) Ming Zeng, Haoxiang Gao, Tong Yu, Ole J Mengshoel, Helge Langseth, Ian Lane, and Xiaobing Liu. 2018. Understanding and improving recurrent networks for human activity recognition by continuous attention. In Proceedings of the 2018 ACM international symposium on wearable computers. 56–63.
- Zhang et al. (2018) Chaoyun Zhang, Mingjun Zhong, Zongzuo Wang, Nigel Goddard, and Charles Sutton. 2018. Sequence-to-point learning with neural networks for non-intrusive load monitoring. In Proceedings of the AAAI Conference on Artificial Intelligence, Vol. 32.
- Zhou et al. (2020) Bo Zhou, Alejandro Baucells Costa, and Paul Lukowicz. 2020. Accurate Spirometry with Integrated Barometric Sensors in Face-Worn Garments. Sensors 20, 15 (2020), 4234.
- Zubaydi et al. (2017) Fatma Zubaydi, Assim Sagahyroon, Fadi Aloul, and Hasan Mir. 2017. MobSpiro: Mobile based spirometry for detecting COPD. In 2017 IEEE 7th Annual Computing and Communication Workshop and Conference (CCWC). IEEE, 1–4.
Appendix A Appendix
In this supplementary document, we provide additional details for our paper.
A.1. Validating Hilbert Transformation
Figure 18 below validates the Hilbert-Transform envelope detection algorithm for a synthetic signal with multiple harmonics.
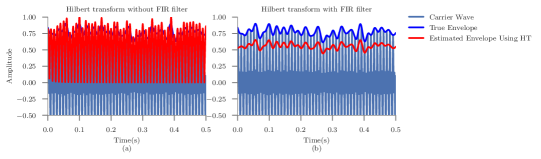
A.2. Comparison With Smartphone Spirometry
To compare SpiroMask and smartphone spirometry, we asked three participants to perform four forceful breathing maneuvers. Participants performed the first two maneuvers using a smartphone. They used SpiroMask for the following two maneuvers. Our objective was to quantify the difference between the two maneuvers recorded via both systems. Figure 19 shows the comparison for one such user. The spectrogram of two maneuvers performed over SpiroMask are more similar (Figure 19(a)) than those conducted over the phone (Figure 19(b)). Particularly, the information between 2-6 kHz in one of the maneuver performed via smartphone is lost which leads to incorrect flow-volume curve (Goel et al., 2016). The variability arises in the phone because a user is unable to repeat the maneuver with the same angle and the distance between the mouth and the phone. A dissimilar flow-volume (FV) curve for the same user over a short period (¡ 5 Minutes) leads to a wrong lung health estimate (Rubini et al., 2010). This experiment shows that SpiroMask provides a more controlled environment for spirometry. Figure 19(a) also shows that the inhalation phase of breathing
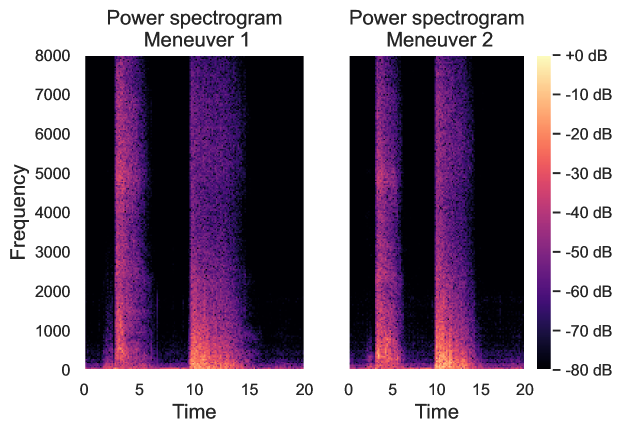
for both the maneuver performed in SpiroMask. Here, both
the inhalation followed by exhalation can be seen
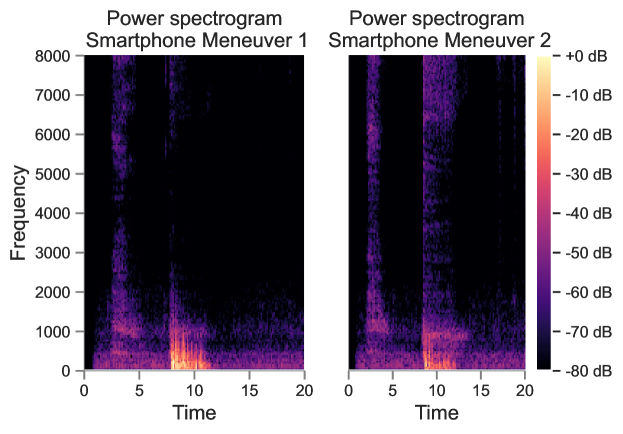
A.3. Feature Set
The list of features are described in Table 6
| Group | Frame Level Descriptors | |||||
| 1 | Temporal Domain |
|
||||
| 2 | MFCC | 13 Mel-Frequency Cepstral Coefficients | ||||
| 2 | MFCC (Normalised) | 13 Variance Normalised Mel-Frequency Cepstral Coefficients | ||||
| 3 | Mel Spectogram | 64 Mel Bands of Spectrogram | ||||
| 4 | Power Spectrum | Power spectrum for each frame for each audio waveform | ||||
| 5 | Mel Filter Bank Energy | 40 Mel Bands of spectrogram | ||||
| 4 | Log Mel Filter Bank Energy | 40 Mel Bands of spectrogram |
A.4. Length of audio signal for tidal breathing
In Section 3.7, we mentioned that we used 20 seconds of audio recording to estimate the respiration rate. We were limited to 20 seconds because of engineering challenges in our prototyping platform. To validate if 20 seconds of audio is enough to estimate respiration rate, we compared the 20 second recording with a 30 second recording collected from an alternate microphone. Both the microphones were placed inside the mask. One of these microphone was the onboard microphone of SpiroMask’s prototyping platform131313https://docs.arduino.cc/hardware/nano-33-ble-sense/ (Arduino’s microphone) while the other microphone was embedded in a breakout board which was connected to the Raspberry Pi Pico (RPi Pico Microphone) 141414https://www.raspberrypi.com/documentation/microcontrollers/raspberry-pi-pico.html. We ensured that both the microphone have the same make and model. The RPi Pico with a interfaced microphone could be identified as a USB device in a Linux computer. A participant donned the two microphone mask and continued tidal breathing.
We simultaneously started recording breathing audio from both the device. The RPi Pico microphone could record audio for a long time since it is acting as a USB microphone connected to a computer. The envelope of both the recording are shown in Figure 20. The Arduino microphone recorded a 20 second audio while we stopped the other recording at the end of 30 seconds. The average time between peak to peak for Arduino’s 20 second recording was while for the RPi Pico’s 30 second recording was . Both the signal had 7 peaks at the end of 20 seconds. The breathing rate estimated from the 20 second recording and the 30 second recording will be same. Thus, we conclude that 20 seconds of audio would suffice to estimate the respiration rate.
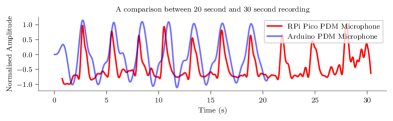
A.5. Ablation Studies
Table 7, 8 and 9 shows the most important features for each of the three lung parameter (PEF, FEV1 and FVC) discovered using Sequential Forward Selection (SFS) technique.
| Category of Feature For PEF | Mean Percentage Error | |
| 1 | Temporal features of the FV curve | 13.71% |
| 2 | Mel Filter Bank Energy (MFE) features | 13.32% |
| 3 | Mean and variance normalised MFCC features | 9.92% |
| 4 | Melspectogram features | 10.12% |
| 4 | MFCC+MFE+Melspectrogram | 6.89% |
| 5 | All Features (by restricting audio waveform til the peak of the signal) | 6.71% |
| Category of Feature (FEV1) | Mean Percentage Error | |||
| 2 | Temporal features of the FV curve | 19.25% | ||
| 3 | Mel Filter Bank Energy (MFE) features | 11.58% | ||
| 4 | Log of Mel Filter Bank Energy (MFE) features | 10.18% | ||
| 5 | Mean and variance normalised MFCC features | 6.21% | ||
| 9 |
|
5.25% |
| Category of Feature (FVC) | Mean Percentage Error | |
| 1 | STemporal features of the FV curve | 21.36% |
| 2 | Mel Filter Bank Energy (MFE) features | 12.71% |
| 3 | Log of Mel Filter Bank Energy (MFE) features | 12.38% |
| 4 | Mean and variance normalised MFCC features | 13.11% |
| 5 | Power spectrum features | 9.69% |
| 6 | Melspectogram features+MFCC | 6.16% |
| 7 | All Features | 5.67% |
A.6. Multivariate Analysis of Variance (MANOVA) Test
Tables 10 and 11 show the results obtained in the 8-way MANOVA and 7-way ANOVA tests respectively. MANOVA was performed for forced breathing parameters and ANOVA was performed for the tidal breathing parameter (respiration rate). Both MANOVA and ANOVA were performed for cloth and N95 masks. The 8 grouping variables used in the MANOVA tests were height, weight, gender, age, whether the subject has performed spirometry tests before, whether the subject reported any lung ailments, whether the subject has a habit of smoking, and whether the subject had a meal before appearing for the experiment. The 7 grouping variables used in the ANOVA tests were height, weight, gender, age, whether the subject reported any lung ailments, whether the subject has a habit of smoking, and whether the subject had a meal before appearing for the experiment. Figure 21 presents the variation of percent error for the forced breathing parameters with respect to height (the grouping variable with the lowest p-value in the MANOVA test) for N95 mask.
| Grouping Variable | p-value | |
| Cloth Mask | N95 Mask | |
| Age | 0.9886 | 0.5533 |
| Gender | 0.8378 | 0.6739 |
| Height | 0.9365 | 0.0383 |
| Weight | 0.4568 | 0.5243 |
| Whether the subject had a meal before the experiment | 0.5802 | 0.1457 |
| Whether the subject has a habit of smoking | 0.8733 | 0.2166 |
| Whether the subject has performed spirometry before | 0.1021 | 0.7105 |
| Whether the subject reported any lung ailment | 0.0930 | 0.4712 |
| Grouping Variable | p-value | |
| Cloth Mask | N95 Mask | |
| Age | 0.9436 | 0.1311 |
| Gender | 0.6492 | 0.7258 |
| Height | 0.0796 | 0.7958 |
| Weight | 0.4298 | 0.5990 |
| Whether the subject had a meal before the experiment | 0.2749 | 0.0881 |
| Whether the subject has a habit of smoking | 0.3807 | 0.8628 |
| Whether the subject reported any lung ailment | 0.4152 | 0.8152 |
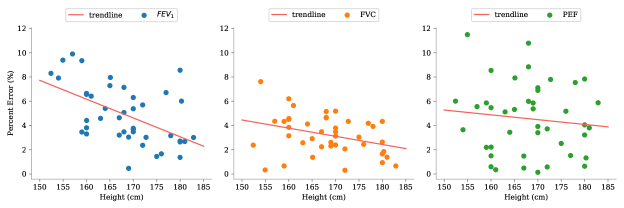
A.7. Sensitivity Analysis on Position of Sensor