11email: preibisch@usm.uni-muenchen.de
Gaia EDR3 distances of the young stellar clusters in the extended Carina Nebula complex††thanks: Table 1 is only available in electronic form at the CDS via anonymous ftp to cdsarc.u-strasbg.fr (130.79.128.5) or via http://cdsweb.u-strasbg.fr/cgi-bin/qcat?J/A+A/
Abstract
Context. The Carina Nebula complex (CNC) is one of the most massive and active star-forming regions in our Galaxy and it contains several large young star clusters. The distances of the individual clusters and their physical connection were poorly known up to now, with strongly discrepant results reported in the literature.
Aims. We want to determine reliable distances of the young stellar clusters in the central Carina Nebula region (in particular, Tr 14, 15, and 16) and the prominent clusters NGC 3324 and NGC 3293 in the northwestern periphery of the CNC.
Methods. We analyzed the parallaxes in Gaia EDR3 for a comprehensive sample of 237 spectroscopically identified OB stars, as well as for 9562 X-ray-selected young stars throughout the complex. We also performed an astrometric analysis to identify members of the young cluster vdBH 99, which is located in the foreground of the northwestern part of the Carina Nebula.
Results. We find that the distances of the investigated clusters in the CNC are equal within , and yield very consistent most likely mean distance values of kpc for the OB star sample and kpc for the sample of X-ray-selected young stars.
Conclusions. Our results show that the clusters in the CNC constitute a coherent star-forming region, in particular with regard to NGC 3324 and NGC 3293 at the northwestern periphery, which are (within ) at the same distance as the central Carina Nebula. For the foreground cluster vdBH 99, we find a mean distance of pc and an age of Myr. We quantified the contamination of X-ray-selected samples of Carina Nebula stars based on members of this foreground cluster.
Key Words.:
Stars: formation – Stars: pre-main sequence – open clusters and associations: Tr 14, Tr 15, Tr 16, NGC 3324, NGC 3293, vdBH 991 Introduction
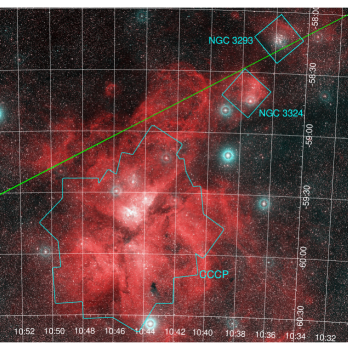
The Carina Nebula (NGC 3372; see Smith & Brooks, 2008, for a review and Fig. 1 for an optical image) is a very prominent giant H II region that is powered by at least 70 O-type and Wolf-Rayet (WR) stars, including many of the most luminous and massive stars known in our Galaxy (see Smith, 2006). The central region of the Carina Nebula is dominated by the young star clusters Tr 14, 15, and 16, along with several smaller clusters such as Bochum 10 and 11 or the Treasure Chest cluster are found south of Tr 14 – 16. However, the optical nebulosity of the Carina Nebula (see Smith et al., 2000), the dusty clouds (see Preibisch et al., 2012), and the molecular gas (see Rebolledo et al., 2016) extend over a much wider area spanning more than two degrees on the sky (see Fig. 1). This large cloud complex contains a total gas and dust mass of about (Preibisch et al., 2012) and harbors several further star clusters. The clouds south of the central Carina Nebula constitute the so-called “Southern Pillars” region (Smith et al., 2010), where the ionizing radiation from the massive stars in Tr 14 and 16 is currently triggering the formation of a new generation of stars in the remaining dense clouds. The area northwest of the central Carina Nebula contains the prominent H ii region Gum 31 around the stellar cluster NGC 3324 and, just beyond the northwestern edge of the optical nebulosity, the young stellar cluster NGC 3293. We denote this extended () complex of star clusters, optical nebulosity, and dusty clouds as the Carina Nebula complex (CNC) in the following text.
Comprehensive information about the young stellar populations in the Carina Nebula was obtained thanks to the deep X-ray imaging survey of the Chandra Carina Complex Project (CCCP; see Townsley et al., 2011, for an overview), which mapped the central 1.4 square-degrees (i.e. about half of the total spatial extent of the CNC) with the Chandra X-ray observatory and revealed 14 368 individual X-ray sources. The combination of the X-ray data with deep infrared surveys (Povich et al., 2011; Preibisch et al., 2011b, 2014b) showed that the large majority of these X-ray sources are young stars in the Carina Nebula (see Broos et al., 2011a), with ages ranging from Myr up to Myr (Preibisch et al., 2011a; Wang et al., 2011; Wolk et al., 2011). The northern clusters NGC 3324 and NGC 3293 have been studied in a similar way by individual Chandra X-ray observations (see Preibisch et al., 2014a, 2017), which revealed their young stellar populations by correlation with infrared data.
Given the large angular extent of the CNC on the sky, it was not clear up to now whether the individual clusters of the CNC are physically related. Since the region is very close to the galactic plane, the possibility of chance projections with stellar clusters in the galactic background must not be neglected. In particular, the physical relation between the clusters NGC 3324 and NGC 3293 at the northwestern periphery of the CNC and the clusters Tr 14 – 16 in the central parts of the Carina Nebula remained dubious, since widely discrepant distance estimates had been reported in the literature.
The pre-Gaia distance estimates to stellar clusters in the Carina Nebula have often yielded conflicting results and also caused high uncertainties in terms of the inferred stellar parameters, such as ages and masses, as well as the question of whether parts of the extended complex are actually physically related or whether they only appear to be in proximity on the sky due to projection effects. The distance to Car in the center of the Carina Nebula could be measured with good accuracy by the kinematical analysis of the expanding Homunculus Nebula, yielding values of kpc (Allen & Hillier, 1993) and kpc (Smith, 2006). For the clusters Tr 14 – 16, substantially discrepant distance values had been reported; tabulations of literature results and discussions about the reasons for the discrepancies can be found in Maíz Apellániz et al. (2020, (see their Section 3.3 and Table A.1;) and Shull et al. (2021, their Table 1). Although Smith (2006) and Smith & Brooks (2008) provided good arguments for a common distance of kpc for Tr 14 – 16, some recent studies have suggested either significantly different distances for the three clusters (e.g., kpc for Tr 14, kpc for Tr 15, and kpc for Tr 16 obtained by Kharchenko et al., 2005), or claimed considerably larger values (e.g. kpc for Tr 14, kpc for Tr 15, and kpc for Tr 16 according to Pandey et al., 2010, based on optical photometry).
For the cluster NGC 3324, located just northwest of the Carina Nebula, distances ranging from kpc (Kharchenko et al., 2005), over kpc (Walborn, 1982), kpc (Carraro et al., 2001), and kpc (Clariá, 1977), and up to kpc (Pandey et al., 2010) can be found in the literature. Also for NGC 3293, located at the northwestern periphery of the CNC, no clear distance information was available up to now. Reported values include kpc (Dias et al., 2002), kpc (Baume et al., 2003), kpc (Kharchenko et al., 2005), kpc (Pandey et al., 2010), and kpc (Kaltcheva & Golev, 2012). Most of these literature values would suggest that NGC 3324 and NGC 3293 are significantly more distant than the central Carina Nebula, implying that there is no physical connection but only a projection effect.
However, most of the quoted pre-Gaia distance estimates are quite uncertain since they were based on the analysis of optical color-magnitude diagrams (CMDs), which can be strongly affected by the assumptions about the reddening of the stars in each cluster. It is well known that the cloud extinction in the CNC shows very strong spatial variations on small scales; stars with extinctions of mag are found close to stars suffering extinctions of mag or more111A good example for the strong spatial variations of cloud extinction in the Carina Nebula is the highly obscured cluster Tr 16-SE (see Preibisch et al., 2021): the stars in Tr 16-SE suffer extinctions of mag, making them very faint or invisible in optical images, although they are located just a few arcminutes south of the (much less obscured and therefore optically much brighter) stars of the cluster Tr 16. (see Preibisch et al., 2012, for a cloud column-density map). These strong variations in the extinction of individual stars can cause large uncertainties in the cluster distance estimates derived from CMDs.
The Gaia mission (Gaia Collaboration et al., 2016) is currently providing astrometric data with unprecedented precision, and allows for direct measurements of distances to be made for the stars in the Carina Nebula for the first time. The study of Cantat-Gaudin et al. (2018) used on Gaia DR2 parallaxes to derive mean distances of kpc for Tr 14, kpc for Tr 15, and kpc for Tr 16, where the quoted uncertainties are based on the 16th to 84th percentile distance confidence interval. Maíz Apellániz et al. (2020) determined very similar distances of kpc for Tr 14 and kpc for Tr 16 W. These values are in good agreement to the previous “canonical” distance of kpc and with the expansion-parallax distance of kpc determined for the Homunculus Nebula around Car (Smith, 2006).
The analysis of the Gaia DR2 parallaxes for the X-ray-selected stars in the Carina Nebula from the CCCP leads to distance estimates of kpc (Kuhn et al., 2019) and kpc (Povich et al., 2019); both values are higher, but still marginally consistent with the previous “canonical” distance.
For NGC 3324, Cantat-Gaudin et al. (2018) determined a distance of kpc from Gaia DR2 data; this value would suggest that NGC 3324 is about 200 pc further away than Tr 14 – 16, namely, behind the Carina Nebula. For NGC 3293, Cantat-Gaudin et al. (2018) derived a distance of kpc based on Gaia DR2 data.
The recently released Gaia EDR3 data (see Gaia Collaboration et al., 2021) have considerably improved the accuracy of the astrometric parameters compared to the DR2 results and clearly a fresh look at the distances of the stars in the CNC is warranted. A study of the Gaia EDR3 data for 69 massive stars in the central Carina Nebula by Shull et al. (2021) found a common distance of kpc for these stars and no significant differences in the distances of the central Carina Nebula clusters Tr 14, 15, and 16. As pointed out by the authors, the controversy over the distance of the stellar clusters in the central region of the Carina Nebula is now settled thanks to this result. Very similar distances were determined in the recent study of Maíz Apellániz et al. (2021), who found kpc for Tr 14, kpc for Tr 16 W, and kpc for Tr 16 E. These Gaia results confirm that the above mentioned “canonical” distance value was already a very good estimate. While the distance to the central Carina Nebula is now well determined, the distances of the northern clusters NGC 3324 and NGC 3293 in the CNC and their relation to the central Carina Nebula stellar population still remain to be addressed with the new Gaia EDR3 data.
Here we use Gaia EDR3 data to (1) extend the study of Shull et al. (2021) with a larger (237 rather than 69 objects) sample of OB stars, covering not only the central Carina Nebula but also including the clusters NGC 3324 and NGC 3293 at the northwestern periphery of the CNC (Sect. 2); (2) determine the mean distance to the large sample of 9562 Gaia matches to X-ray-selected stars in the CNC and compare it to the distances derived for the OB stars (Sect. 3); (3) investigate the stellar cluster vdBH 99 (van den Bergh & Hagen, 1975), which is located in the foreground of the northwestern part of the CNC, and quantify the contamination of the X-ray-selected sample of young stars in the CNC due to this foreground cluster (Sect. 4).
2 Gaia distances to the massive stars in the CNC
2.1 Construction of the OB star sample
We started composing our sample of massive stars in the Carina Nebula by using the compilation of 114 O- and B-type (and Wolf-Rayet (WR)) stars in the Carina Nebula (sorted into the individual stellar clusters Tr 14 – 16 and Bochum 10 and 11) by Smith (2006). This sample was complemented by 15 additional OB stars in the Carina Nebula listed in Shull et al. (2021). We also added 8 OB stars which were recently identified in the cluster Tr16-SE (Preibisch et al., 2021), the 5 OB stars known in NGC 3324 (see Preibisch et al., 2014a), and 99 B stars from NGC 3293 (Evans et al., 2005). This results in a sample of 241 OB stars in the CNC.
2.2 Determination of Gaia EDR3 parallaxes and bias correction
We found Gaia EDR3 matches for all OB stars within a one arcsecond radius; all but one star (CPD have parallax measurements. Lindegren et al. (2021) found that the parallaxes in Gaia EDR3 exhibit an offset to their true value and are therefore biased. These authors also published an algorithm that can be used to calculate the parallax offset for each star as a function of several parameters. We made use of this algorithm to determine the correction222The correction is only possible for stars with Gaia EDR3 magnitudes between mag and mag. For stars with 5-parameter solutions, the effective wavenumber, i.e., the “photon flux-weighted inverse wavelength as estimated from the BP and RP bands” (Hambly et al., 2021), has to be between 1.1 and 1.9 . For stars with 6-parameter solutions, the pseudocolor, i.e., the “astrometrically estimated effective wavenumber of the photon flux distribution in the astrometric (G) band” (Hambly et al., 2021), has to be between 1.24 and 1.72 (Lindegren et al., 2021). Four of our target stars have an effective wavenumber outside of this interval and one (HD 92964) has a G-magnitude smaller than 6 mag. for the parallaxes for all but five stars in our sample.
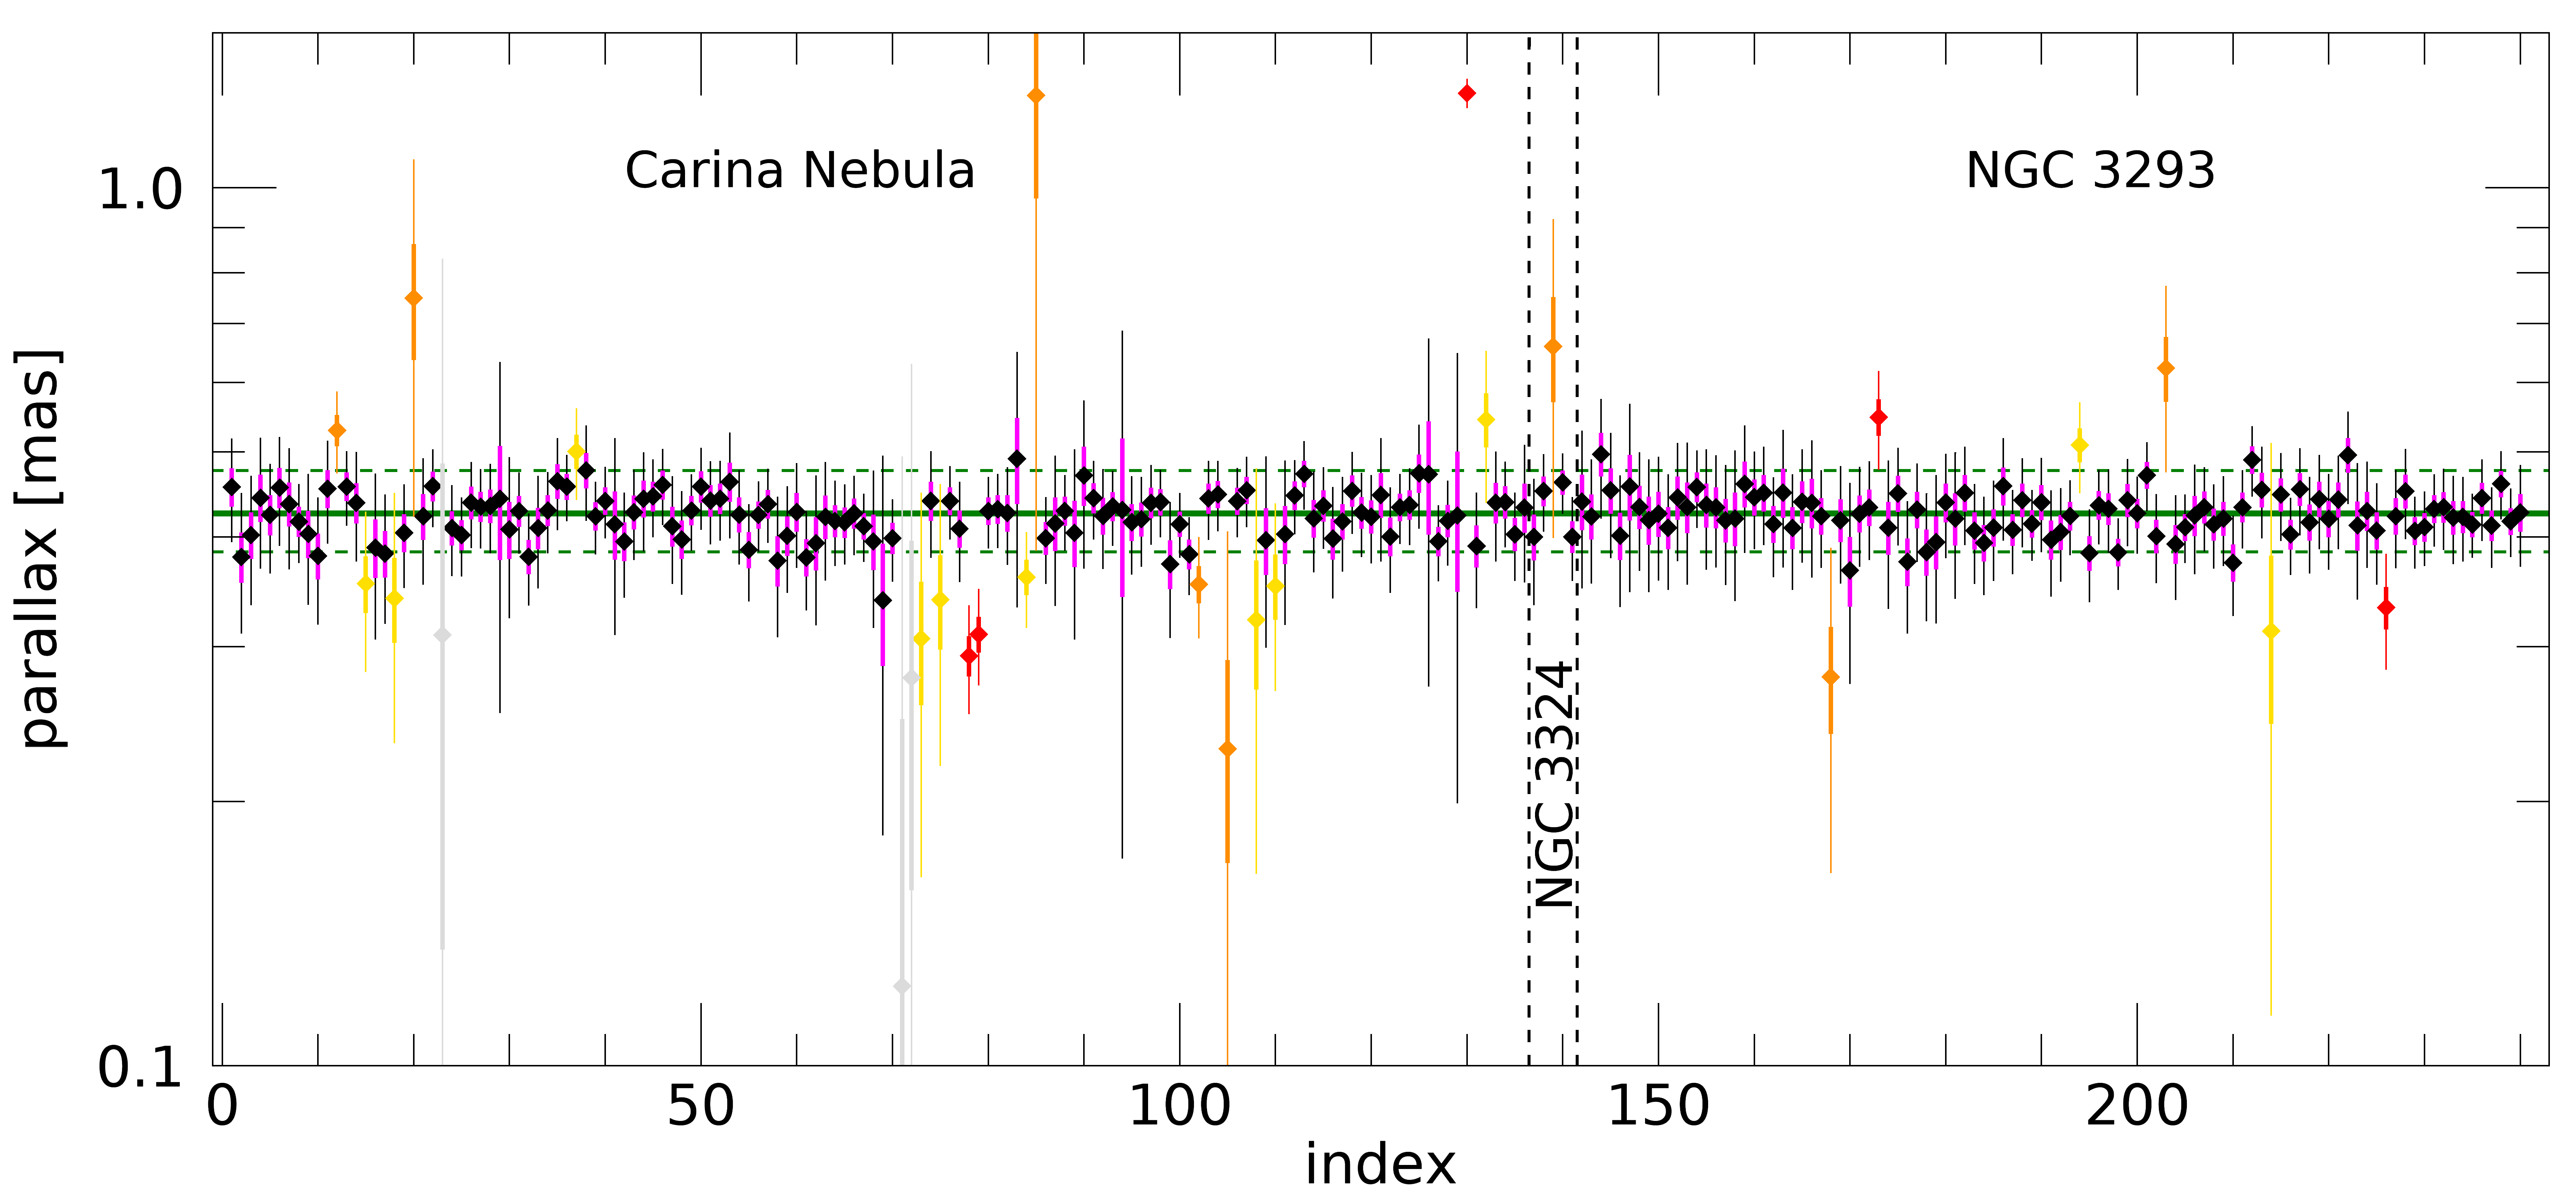
The offset values for the stars in our OB sample range from mas to mas. The correction is applied by subtracting these offset values from the parallaxes listed in the catalog, namely, by calculating the corrected parallax as . The list of the 240 OB stars with their positions, names, corrected parallaxes, and spectral types is given in the electronic Table 1 (available at the CDS). The corrected parallaxes with their error bars are plotted in Fig. 2. Almost all stars in the sample have small fractional parallax uncertainties of ; only three stars333HD 93403 A, J10452860-5947553 and J10453468-5947536 have high parallax uncertainties of and they were thus excluded from further analysis. Figure 2 shows that the large majority of the stars have very similar and well consistent parallaxes corresponding to distances in the range 2.1 kpc to 2.6 kpc. A few stars are more or less obvious outliers, that is, likely foreground or background stars unrelated to the CNC – we consider these outliers in Sect. 2.3.
For an initial estimate of the distances of the groups, we computed the median and the ”normalized median absolute deviation”444The normalized median absolute deviation is a robust measure of the variability in a data set that is scaled to be approximately equal to the standard deviation for normally distributed data (see, e.g., Feigelson & Babu, 2012). of the parallaxes and inverted them to derive distance estimates. For the OB stars in the Carina Nebula sample, the median value of the parallaxes is 0.4242 mas and the normalized median absolute deviation is mas, corresponding to a median distance of kpc. This value is in very good agreement555This is not surprising, since our OB sample contains all of the stars from Shull et al. (2021). However, our sample is considerably larger, and thus provides a useful confirmation of their result. with the result from Shull et al. (2021), and also in extremely good agreement to the distance of kpc for Car from Smith (2006).
For the OB stars in NGC 3324 we find a median parallax of mas and corresponding distance of kpc, and for the OB stars in NGC 3293, the results are mas and a corresponding distance of kpc. Combining all three sub-samples of OB stars yields a distance of kpc.
2.3 Identification and exclusion of fore- and background stars
In the next step, we take into account that the OB star samples suffer from a small degree of foreground or background contamination. As seen in Fig. 2, several stars show considerably smaller or larger parallaxes than expected for objects at kpc and are thus most likely contaminators in the fore- or background. This is not surprising, since the samples were collected from various spectroscopic observations of stars in the CNC area and it is often difficult to estimate stellar distances from spectra and photometry alone, especially if the luminosity class of the stars cannot be well measured.
The Gaia parallaxes provide now a way to distinguish fore- or background stars from CNC members, but for this, it is necessary to define appropriate distance limits. An inspection of the distribution of parallaxes shows that the large majority () of the OB stars show a narrow range of parallaxes corresponding to distances between kpc and kpc. We therefore define all the stars for which the full extent of the uncertainty range of their parallax corresponds to distances of less than 2.1 kpc (i.e., mas) as clear foreground stars and all stars for which the full extent of the uncertainty range of their parallax corresponds to distances of more than 2.6 kpc (i.e. mas) as clear background stars. The five clear fore- or background stars666Among the stars listed in Smith (2006) as members of the Carina Nebula, HDE 302989 (SpT = B2 V) is a foreground star ( pc), HD 93342 (SpT = B1 Ia) is a background star ( kpc), and Tr15-18 (SpT = B1 Ia) is a background star ( kpc). identified by this criterion in our OB star sample are highlighted in red in Fig. 2.
The choice of the conditions for excluding stars introduces some degree of subjectivity into the analysis. In order to investigate how strongly our choice affects the results, we also created samples where all stars that are at least or at least above or below the to mas parallax interval are excluded. This -criterion excludes 13 stars777We note that also one of the O stars in NGC 3324, HD 92 206 C (= CD 3378, spectral type O7.5 V), has a discrepant parallax that qualifies it as a “ outlier” foreground stars, although its location in the center of the Gum 31 nebula seems to suggest that this is one of the ionizing stars of the Gum 31 H II region. HD 92206 C is a double-lined, 2.02 day period spectroscopic binary with a B0 V companion (Campillay et al., 2007) and a third component (Mayer et al., 2017). A further possible companion star was found at a separation of in the Chandra X-ray image (see Preibisch et al., 2014a). Perhaps the orbital motions in this multiple system might have affected the parallax measurement. This hypothesis is supported by the fact that the Gaia Renormalised Unit Weight Error (RUWE) of this star has a value of 5.27, considerably larger than most other stars in our sample. Such a high RUWE value “could indicate that the source is non-single or otherwise problematic for the astrometric solution” (https://gea.esac.esa.int/archive/documentation/GDR2/Gaia_archive/chap_datamodel/sec_dm_main_tables/ssec_dm_ruwe.html)., and the -criterion excludes 24 stars from our sample. In the following distance analysis steps, we compare the effects of the three different exclusion limits in order to see how robust the results are.
2.4 Maximum-likelihood analysis of the mean distances
We used a maximum likelihood (ML) procedure to estimate the distance to different structures in the CNC. Assuming a spherical symmetric cluster of stars at a mean distance and a line-of-sight extent much smaller than the mean distance, and measurement errors that follow a Gaussian distribution, the likelihood for obtaining the observed set of parallax values for with associated uncertainties is given by the product of the Gaussian functions around the parallax value :
| (1) |
The most likely value for the cluster parallax, , and the corresponding mean distance, , of the cluster can then be found by maximizing the likelihood function . In the Gaussian case of Equation 1, the maximum likelihood estimator of the parallax, , is simply the weighted arithmetic mean of all measurement values with weights of and the uncertainty of this ML parallax value, , can also be simply calculated from the sum of the weights. We note that this uncertainty corresponds to the uncertainty of the mean value, not the sample standard deviation (as reported, e.g., in the results of Kuhn et al. (2019), Povich et al. (2019), and Shull et al. (2021)).
Finally, we compute an estimate of the most likely mean distance, , and its uncertainty range by inverting the ML parallax values. In general, the inversion of the mean parallax may lead to a biased estimate of the true mean distance. Since measured parallaxes are never error-free, and because the transformation from parallax, to distance, is non-linear, the expectation value of is generally not an unbiased estimate of the true distance (see, e.g., Brown, 2012; Bailer-Jones, 2015; Luri et al., 2018). However, for moderate fractional parallax uncertainties () and for a spherical homogeneous group of stars, the inverse of the mean parallax is still a good estimator of the mean distance of the group (as long as the uncertainties of the parallax values are normally distributed; see de Zeeuw et al., 1999). Since for almost all stars in our sample, the fractional parallax uncertainties are small (), the inversion of the mean parallax should yield a useful distance estimate. Furthermore, we also estimate distances via a more sophisticated Bayesian inference model, which we describe in Sect. 2.5.
The maximum likelihood mean parallax and distance values for all three choices of the exclusion criterion are summarized in Table 2. The numbers show that the different values of the exclusion criterion (i.e., , , or ) affect the resulting mean parallaxes only very slightly; the corresponding distances vary by only a few parsec, namely, of the mean distance. This directly confirms that our analysis results are robust and do not depend noticeably on the assumptions established for the exclusion of outlier stars.
Comparing the distances of the three OB star samples, we find that the ML distances for the OB samples in the Carina Nebula and NGC 3293 are almost identical. The ML distance of NGC 3324 appears slightly ( pc, i.e. 2.5%) smaller than those for the Carina Nebula and NGC 3293; but due to the small sample size of only five stars, the uncertainties in the NGC 3324 distance estimate are relatively large, and it is still consistent with a common distance for all three samples. Combining all three OB samples yields a value of kpc as our best estimate of the maximum likelihood mean distance of the CNC OB stars.
We also investigated how the distance results would change if we applied a quality criterion on the parallaxes, by excluding stars for which the “renormalised unit weight error” (RUWE, an indicator for the quality of the astrometric solution; see Lindegren, 2018) is larger than 1.4. All details about these calculations and the resulting distance values are described in Appendix 1. We find that applying this quality criterion leads only to very marginal changes of the distances by just a few pc and this would neither affect our conclusions, nor the final distance estimates quoted here (by three significant digits) in any way.
2.5 Bayesian inference of distances with Kalkayotl
As a second way to determine distances we employed the program Kalkayotl developed by Olivares et al. (2020). Kalkayotl is a free and open code that uses a Bayesian hierarchical model to obtain samples of the posterior distribution of the cluster mean distance by means of a Markov chain Monte Carlo (MCMC) technique implemented in PyMC3. Kalkayotl also takes the parallax spatial correlations into account, which improves the credibility of the results. Olivares et al. (2020) performed extensive tests and found that Kalkayotl allows for trustworthy estimates of cluster distances to be derived up to about 5 kpc from Gaia data.
We used Kalkayotl version 1.1, with the parameters generally left at their standard values. For the prior, we used the implemented Gaussian model with a mean distance of kpc and a cluster scale of pc. The calculations were done in distance space, and the reported uncertainties for the inferred mean distances are the central 68.3% quantiles888corresponding to the “ range” for a Gaussian distribution. The resulting distances are also listed in Table 2 and in Table A.1 for the distances determined with the RUWE selection criterion.
2.6 Discussion of distance results
| Group | outlier exclusion: | ML parallax | ML distance | Kalkayotl distance | ||||
|---|---|---|---|---|---|---|---|---|
| fore- | back- | -range | central 68.3% quant. | |||||
| ground | [mas] | [kpc] | [kpc] | |||||
| Carina Neb. | 1 | 2 | 2.367 | |||||
| OB stars | 4 | 4 | 2.367 | |||||
| 6 | 11 | 2.363 | ||||||
| NGC 3324 | 0 | 0 | 2.321 | |||||
| OB stars | 1 | 0 | 2.338 | |||||
| 1 | 0 | 2.338 | ||||||
| NGC 3293 | 1 | 1 | 2.354 | |||||
| OB stars | 2 | 2 | 2.356 | |||||
| 3 | 3 | 2.357 | ||||||
| All | 2 | 3 | 2.363 | |||||
| OB stars | 7 | 6 | 2.363 | |||||
| 10 | 14 | 2.362 | ||||||
| CCCP | 906 | 217 | 2.337 | |||||
| X-ray | 1171 | 577 | 2.336 | |||||
| 1908 | 1523 | 2.330 | ||||||
| NGC 3324 | 61 | 13 | 2.348 | |||||
| X-ray | 76 | 29 | 2.358 | |||||
| 113 | 64 | 2.361 | ||||||
| NGC 3293 | 58 | 10 | 2.346 | |||||
| X-ray | 73 | 32 | 2.342 | |||||
| 121 | 90 | 2.342 | ||||||
| All | 1025 | 240 | 2.338 | |||||
| X-ray | 1320 | 638 | 2.336 | |||||
| 2142 | 1677 | 2.331 | ||||||
The comparison of the distances derived with the ML procedure and with Kalkayotl shows generally good agreement; in most cases, the differences are no more than 10–20 pc, that is, less than 1% of the absolute distance, showing that our distance results are robust with respect to the employed analysis method. Comparing the three OB samples, also the Kalkayotl results indicate that the five NGC 3324 OB stars are slightly closer than the mean distance for the Carina Nebula and NGC 3293 OB stars, but this small difference is not significant and may well be purely due to the small sample size.
Combining all three OB star samples, we find a mean distance of kpc for the OB stars in the CNC. This result is in excellent agreement to the previously determined distance of kpc found by Smith (2006) for Car.
3 Gaia distances to the X-ray detected stars in the CNC
Although the OB stars considered in the previous section are the most prominent objects, the vast majority of stars in the complex are low-mass stars. But the population of low-mass stars in the CNC is still only poorly known, since spectroscopic observations of these faint stars are very time-consuming and have been obtained thus far for a very small fraction of the low-mass stars in the CNC. Due to the celestial position of the Carina Nebula very close to the Galactic plane, there is also a very high rate of background contamination in the CNC, making it very difficult to identify low-mass (= optically faint) CNC members among the millions of Galactic fore- and background stars in the CNC area (see Preibisch et al., 2014b).
X-ray observations provide a very good way to solve this problem by picking out young, coronally active stars among the much older (and usually X-ray faint) Galactic field stars (see, e.g. Preibisch & Feigelson, 2005). In the CNC, the combination of the comprehensive CCCP X-ray survey (see Townsley et al., 2011) with the individual Chandra observations of NGC 3324 (Preibisch et al., 2014a) and NGC 3293 (Preibisch et al., 2017) have provided an approximately mass-limited ) sample of the young low-mass stars in the complex.
3.1 Construction of the X-ray sample
The CCCP X-ray catalog of 14 368 X-ray sources described in Broos et al. (2011c) was used as our sample in the Carina Nebula. Most of these X-ray sources are young stars in the Carina Nebula, but a significant contamination with X-ray active foreground-stars and background-stars, as well as with extragalactic objects is to be expected (see Broos et al., 2011b, and our Sect. 3.4). In order to analyze the Gaia EDR3 parallaxes of the X-ray sources, we matched the CCCP source catalog with Gaia EDR3 sources via the program match_xy (see Broos et al., 2010). This program is preferred over simple matching algorithms with a fixed “search radius” since the positional uncertainties of the X-ray sources show a rather wide variation999X-ray source positional uncertainties are a function of the source position on the detector and the number of detected X-ray counts for each source. and range from up to in the CCCP sample. For each pair of possible matches, match_xy calculates the probability for the null hypothesis that the two catalog entries are observations of the same object by assuming Gaussian positional uncertainties and a significance threshold of 0.99. The algorithm also enforces a one-to-one relationship among the pairs of sources declared to be matches. More detailed information about the algorithm is given in Broos et al. (2010).
The positional uncertainties for the X-ray sources were taken directly from the CCCP catalog, while the Gaia EDR3 positional uncertainties were assumed to be . The matching procedure revealed a very small systematic positional shift of in right ascension and of in declination between the CCCP and Gaia EDR3 positions. After correcting this systematic shift, we found 9111 Gaia EDR3 matches to X-ray source positions. The X-ray source catalogs of the star clusters NGC 3324 (Preibisch et al., 2014a, 679 X-ray sources) and NGC 3293 (Preibisch et al., 2017, 1026 X-ray sources) were matched to Gaia EDR3 in the same way. This revealed small positional shifts of in RA and in Dec for NGC 3324 and in RA and in Dec for NGC 3293. The number of resulting Gaia EDR3 matches was 480 for NGC 3324 and 648 for NGC 3293.
3.2 Determination of Gaia EDR3 parallaxes and bias correction
In the CCCP-region, 8505 X-ray sources with Gaia EDR3 match have a parallax. In NGC 3324 and NGC 3293, the corresponding numbers are 455 and 602, respectively. The algorithm provided by Lindegren et al. (2021) was used again to determine the parallax bias for each source. The majority of stars could be corrected via this method (6482 for CCCP, 319 for NGC 3324, and 498 for NGC 3293).
3.3 Analysis of the distances of the X-ray-selected stars
We used the same methods and criteria for the mean distance determination as in our analysis for the OB stars described in Sect. 2. Among the 8505 Gaia EDR3 matches with parallax in the CCCP sample, 906 objects are classified as foreground stars and 217 objects as background stars based on their parallaxes and the -criterion described in Sect. 2.3.
The mean distances derived with the ML method and with Kalkayotl for the three different X-ray samples and the different outlier rejection criteria are summarized in Tab. 2. The Kalkayotl distances are again very similar to the ML distances (with differences of pc, i.e., of the absolute distance) for all three samples. Comparing the three different samples shows again that NGC 3293 and the Carina Nebula population have almost identical distances. The X-ray-selected stars in NGC 3324 appear to be marginally ( pc according to the ML results and pc according to the Kalkayotl results) more distant than the stars in the Carina Nebula, but this difference is not significant and corresponds to of the absolute distance.
| Class | number of | Gaia matches | Consistent with | Not consistent with |
|---|---|---|---|---|
| X-ray sources | with parallax | B11 classification | B11 classification | |
| 1 (foreground) | 716 | 447 | 429 (96.0%) | 18 (4.0%) |
| 2 (Carina Nebula) | 10 714 | 7262 | 6571 (90.5%) | 691 (9.5%) |
| 3 (background) | 16 | 10 | 3 (30.0%) | 7 (70.0%) |
| 4 (extragalactic) | 877 | 89 | 87 (97.8%) | 2 (2.3%) |
The distances derived for the X-ray samples are also generally in good agreement with those for the corresponding OB star samples; in most cases, the differences are pc, namely, of the absolute distance. We note that while the distance estimates for the OB stars in NGC 3324 were pc lower than those for the Carina Nebula OB stars, the distance estimates for the NGC 3324 X-ray sources are pc higher than those for the Carina Nebula X-ray sources. This suggests that these small () differences in the distances for NGC 3324 and the Carina Nebula are not significant.
These results for the X-ray-selected samples provide strong support for the conclusions drawn above from the distance results for the OB star samples. They confirm that the clusters NGC 3324 and NGC 3293 are (within less than 2%) at the same distance as the central Carina Nebula. Combining all three X-ray samples yields a final value of kpc as our best estimate of the mean CNC X-ray star distance, which is very close (only 1% smaller) to the kpc for the OB stars in the CNC derived above.
3.4 Fore- and background contamination in the CCCP sample
Long before the availability of Gaia parallaxes, Broos et al. (2011b, B11 hereafter) addressed the problem of Galactic fore- and background contamination of the X-ray-selected sample in the CCCP and performed a probabilistic classification of the CCCP X-ray sources that was solely based on the X-ray properties and the optical and infrared photometry of their counterparts. They classified the X-ray sources into four classes: 5.0% of the X-ray sources were classified as “likely foreground stars” (class 1), 74.6% as ”likely Carina pre-main-sequence stars” (class 2), 0.1% as “likely background stars” (class 3), and 6.1% as “likely extragalactic sources” (class 4). For about 14.2% of the X-ray objects, the classification procedure gave no convincing clues and these objects thus remained unclassified.
With the Gaia EDR3 parallaxes available today, we can now compare this photometric probabilistic classification with the new direct distance information from the Gaia parallaxes, and check how well the purely photometric probabilistic classification worked. For this, we assumed a source classification as inconsistent with the Gaia parallax if the uncertainty interval lies completely outside the distance range corresponding to its classification, namely, kpc for foreground stars, 2.1– 2.6 kpc for Carina Nebula stars, and kpc for background stars and extragalactic objects. The results of this comparison are compiled in Table 3.
The comparison shows that in the large majority (90.8%) of cases the B11 classification as foreground or background or Carina Nebula member is consistent with the Gaia parallax of the objects; it is only in 9.2% of cases that the Gaia parallax is inconsistent with the B11 classification. In addition, it is only in the (very small) group of likely background stars the classification did not work well, but this is, firstly, not unexpected (since obtaining a purely photometric distinction between background objects and strongly obscured stars in the Carina Nebula is very difficult), and, secondly, this leads to only seven misclassified objects (i.e., a vanishingly small fraction of the 14 368 X-ray sources). In conclusion, this comparison shows that the B11 probabilistic classification worked remarkably well in sorting the X-ray sources into different classes.
Considering the 2045 X-ray sources that remained unclassified in B11, we found 697 Gaia EDR3 matches with parallaxes. The large majority (73.9%) of these have parallaxes that are consistent (within their uncertainty interval) with being members of the Carina Nebula. The rest are either foreground (23.0%) or background objects (3.1%) according to their parallaxes.
4 The foreground cluster vdBH 99
Due to the Carina Nebula’s position very close to the Galactic plane, contamination by field stars and also possibly by stellar clusters in the fore- or background is a serious issue. The stellar cluster vdBH 99, first mentioned by van den Bergh & Hagen (1975), is located just about one degree northwest of the Carina Nebula, and just south of NGC 3324/Gum 31, and therefore clearly causes foreground contamination. The optically brightest cluster member HD 92397 ( mag) is a K4.5 AGB or supergiant star (Messineo & Brown, 2019). Using Gaia DR2 data, Cantat-Gaudin et al. (2018) determined the center of vdBH 99 at the J2000 coordinates and a radius which encloses half of the members of . They also derived a mean distance of pc for vdBH 99. Bossini et al. (2019) found an age of Myr for vdBH 99 based on Gaia DR2 parallaxes and photometry.
Since the fractional X-ray luminosities () of young stars are approximately constant during the first Myr (see Preibisch & Feigelson, 2005), the low-mass stars in vdBH 99 are expected to be relatively bright X-ray sources and to contaminate the X-ray-selected samples of young stars in the CNC to some degree. With the Gaia data, we can now identify members of vdBH 99 by their parallaxes and proper motions, and quantify the level of foreground contamination for the CNC.
4.1 Selection of cluster members with Gaia EDR3 data
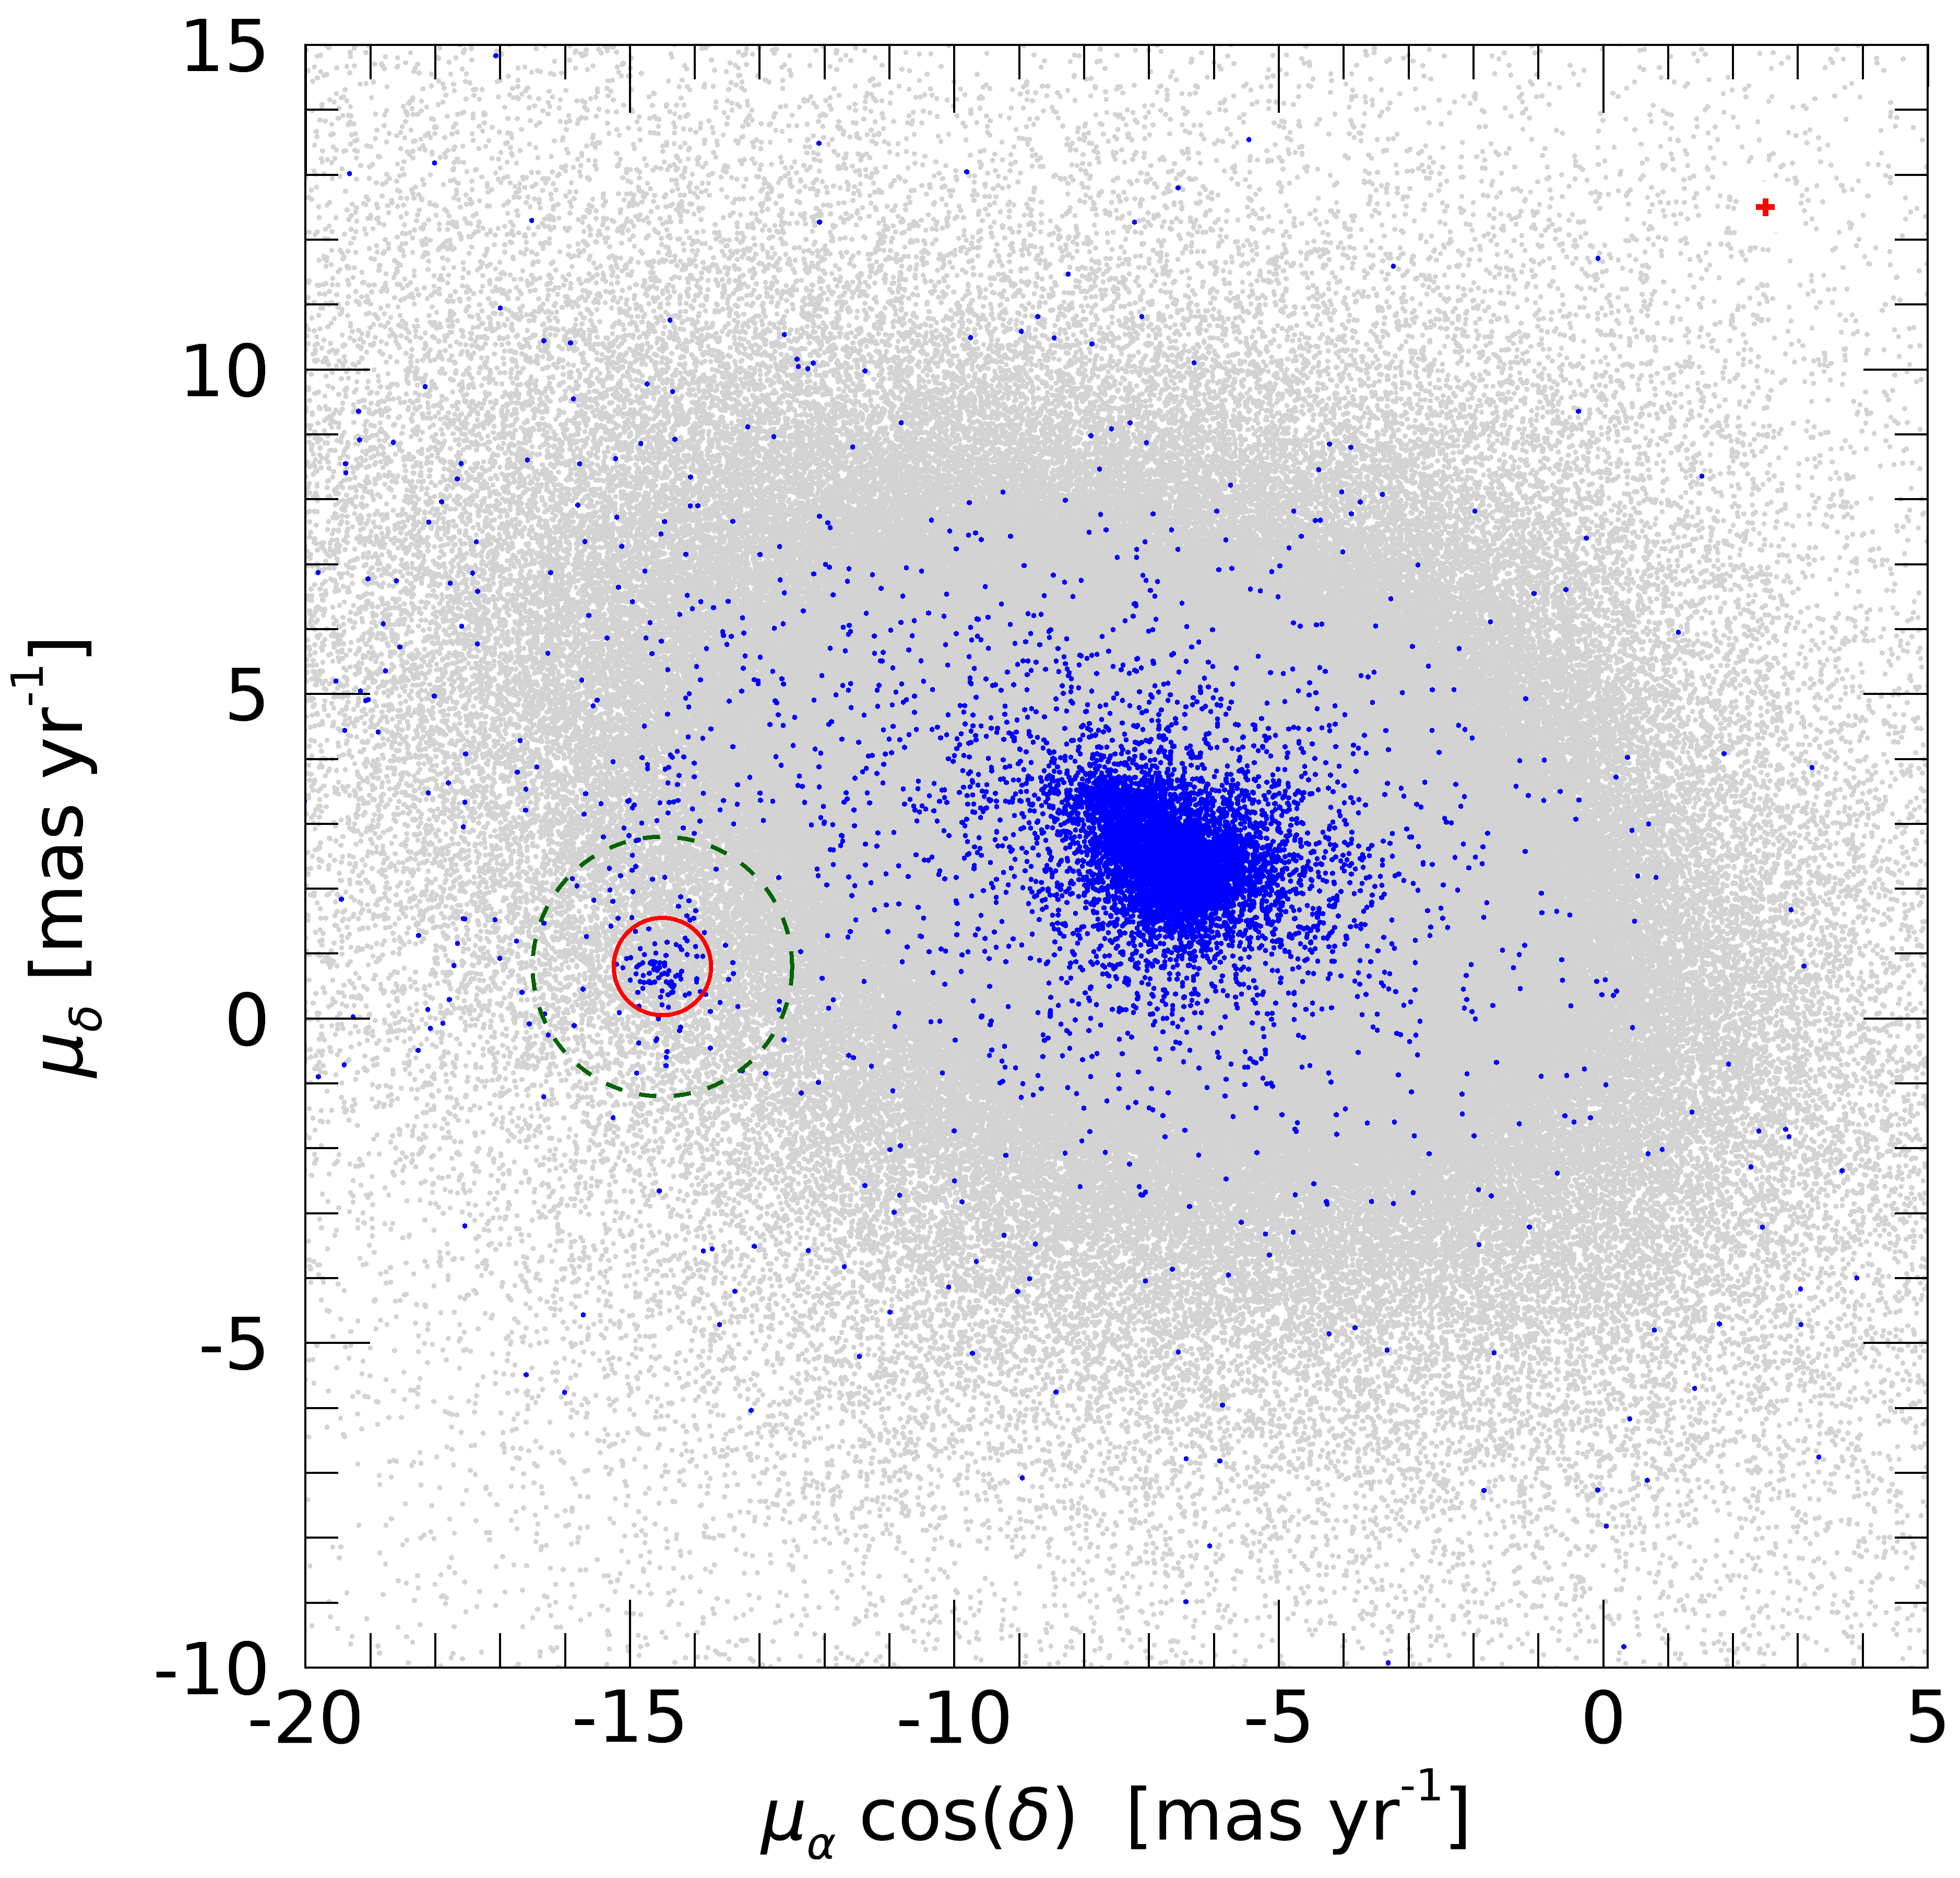

In Fig. 3, we show a proper motion diagram of all Gaia EDR3 objects in and around the CNC, where the X-ray detected objects are marked by color. It can be seen that the large majority of X-ray-selected objects in the CNC show proper motions that are basically indistinguishable from the proper motions of the galactic field population at this celestial position, centered roughly around . However, Fig. 3 also shows a clear group of X-ray detected stars with proper-motions around that is quite distinct from the CNC and galactic field population.
Figure 4 shows the distribution of parallaxes of all Gaia stars in and around the CNC with proper-motion vectors within or around (i.e., the regions marked by the green and red circles in Fig. 3). Besides the broad peak of parallaxes between mas and mas, which is produced by the galactic field population and the CNC members, the distribution of parallaxes also shows another clear peak at mas, which contains the likely members of vdBH 99. We define the ranges of the parallax selection interval for vdBH 99 members as mas ( of the mode value), namely, extending from 2.0 mas to 2.46 mas.
Since a large fraction of the stars in the proper-motion selection circle are not vdBH 99 members but unrelated field stars, we tried to find an efficient selection criterion for vdBH 99 members in proper motion space. For this, we considered different radii for the proper motion selection circle and tested how many, and what fraction of the X-ray-detected stars in these circles, have parallaxes between 2.0 and 2.46 mas; that is, which ones might be considered members of the foreground cluster. We tried proper motion selection circle radii ranging from to , and we found that a radius of yielded the highest fraction (92%) of stars in the 2.0–2.46 mas parallax interval. This choice provides a good compromise between a high level of completeness for likely vdBH 99 members and a low level of contamination by unrelated field stars.
For the final selection of likely vdBH 99 cluster members, we used the following selection criteria: (1) a sky position within a radius around which is the center of vdBH 99 as determined by Cantat-Gaudin et al. (2018); (2) a proper motion vector inside a circle with a radius of centered around , as indicated by the red circle in Fig. 3; (3) a parallax between 2.0 and 2.46 mas, with a relative uncertainty of . We found 700 stars in the Gaia EDR3 catalog satisfying all three criteria.
In order to estimate the completeness of our selection for vdBH 99 cluster members, we analyzed the distribution of all Gaia stars in the radius circle on the sky and the selected parallax interval in the proper motion space. We found that the peak of the distribution of proper motions, , around and around can both be approximately characterized by Gaussian distributions with a standard deviation of . Since our proper motion selection circle radius of is just times the proper-motion standard deviations , we estimate the completeness101010For a two-dimensional Gaussian distribution with equal standard deviation in x- and y-direction (), a circle with a radius of contains 86.5% of the values. of our proper-motion selection to be .
4.2 Determination of cluster properties
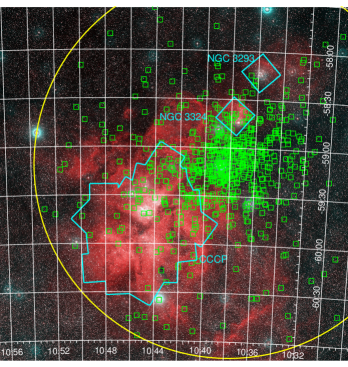
The spatial distribution of the likely vdBH 99 cluster members is shown in Fig. 5. Using the bias-corrected parallaxes and the maximum-likelihood procedure described above, we found a mean parallax of mas for vdBH 99, corresponding to a mean distance of pc. The distance determined with Kalkayotl is pc. Our values are marginally smaller than the pc determined by Cantat-Gaudin et al. (2018) based on Gaia DR2 data.
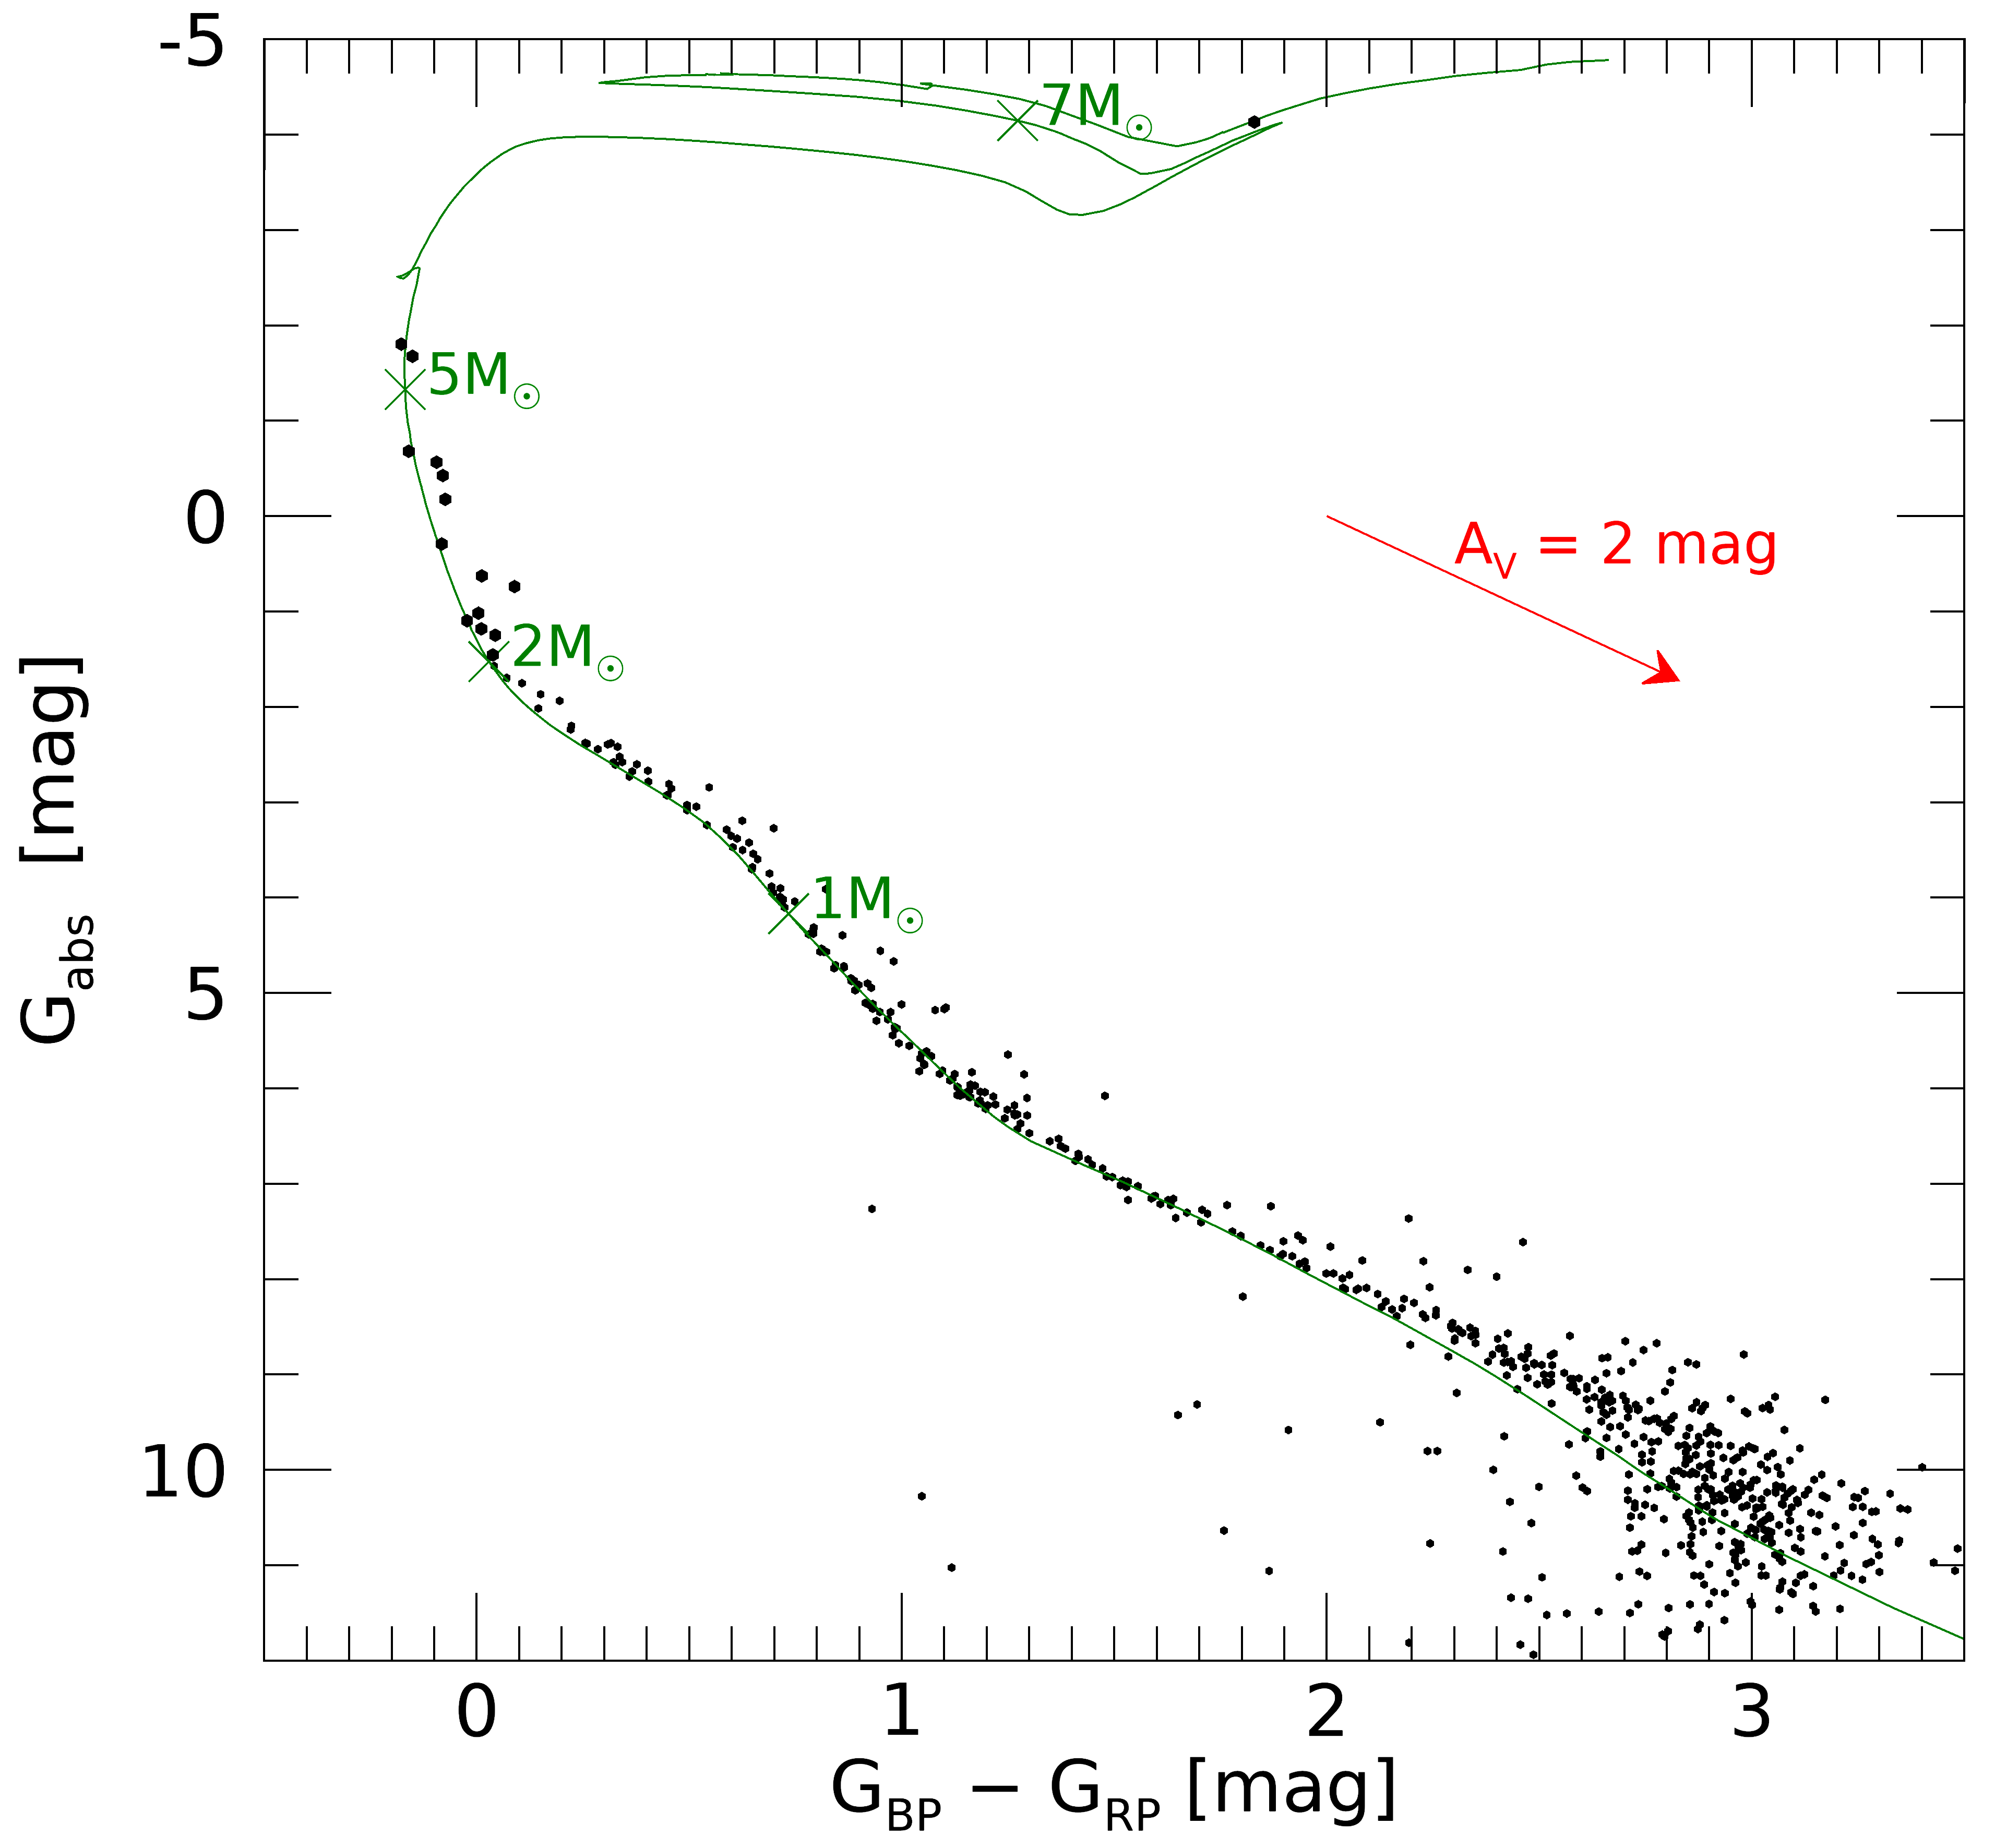
We also determined the age of vdBH 99 by fitting theoretical isochrones to the distribution of likely members in the Gaia versus color-magnitude diagram shown in Fig. 6. The isochrones were taken from the current version of the PARSEC111111available at http://stev.oapd.inaf.it/cgi-bin/cmd_3.4 tracks (Bressan et al., 2012). We obtained the best fit with an age of Myr and an extinction of mag. This is somewhat younger than the 81 Myr age estimation by Bossini et al. (2019), which was based on Gaia DR2 data and an assumed extinction of mag.
4.3 Contamination of the X-ray samples in the CNC by vdBH 99 stars
Finally, we investigated the contamination of the samples of X-ray sources in the CNC by members of vdBH 99. Using the selection criteria described in Sect. 4.1, we found 89 likely vdBH 99 members that have matches to an X-ray source in the CNC. As expected, the contamination rate depends on position: it is very low with for the CCCP sample and for the NGC 3293 X-ray sample, but for the NGC 3324 X-ray sample, which is closest on the sky to the center of vdBH 99. Even if we consider that our sample of likely vdBH 99 members is not fully complete, these numbers suggest that the overall level of contamination of the X-ray sources in the CNC by foreground members of vdBH 99 is quite small and does not affect the conclusions drawn about the young stellar populations in the CNC in our earlier studies of the X-ray-selected populations (Preibisch et al., 2011a, 2014a, 2017).
5 Conclusions and summary
Our analysis of the Gaia EDR3 parallaxes for the samples of massive stars and X-ray detected stars in the (inner) Carina Nebula, NGC 3324, and NGC 3293 shows that these star samples are at a common, well-constrained distance of kpc; any differences in the derived cluster distances are insignificant and smaller than 2% of the absolute distance. The Gaia-based distance we find here agrees very well with the distance to Car derived by Smith (2006) (by the expansion of the Homunculus Nebula) and with the old “canonical” distance of kpc motivated by Smith & Brooks (2008), which had been adopted in many recent studies of the CNC.
Our result that NGC 3324 and NGC 3293 at the northwestern periphery of the CNC are (within ) at the same distance as the star clusters in the central Carina Nebula, clearly refutes some (pre-Gaia) claims in the literature about vastly different distances among these clusters. The Gaia EDR3 data show clearly that the CNC is a coherent physical structure at a common distance, not a chance projection of unrelated stellar clusters at different distances.
Since the conclusions drawn in previous investigations about the ages and the mass functions of the stellar clusters in the CNC are strongly dependent on the assumed distance, our result confirms the validity of our earlier results about the stellar populations in Tr 14 – 16, NGC 3324, and NGC 3293 (Preibisch et al., 2011a; Wang et al., 2011; Wolk et al., 2011; Preibisch et al., 2014a, 2017). The age estimates for the individual clusters in the CNC are particularly important for reconstructing the star formation history in the CNC. In this context, our finding that NGC 3293 is at the same distance as the clusters Tr 14 – 16 in the central Carina Nebula, provides an important confirmation that NGC 3293 actually is the oldest ( Myr) of the larger clusters in the CNC. The picture of the complex spatio-temporal progression of the star-formation activity in the CNC outlined in Preibisch et al. (2017) is thus confirmed.
Our analysis of young foreground cluster vdBH 99, which overlaps with the northwestern parts of the CNC, suggests an age of Myr and a distance of pc. Although this cluster comprises at least about 700 member stars, the contamination rate of the existing Chandra X-ray observations of the CCCP, NGC 3324, and NGC 3293 due to vdBH 99 members is not more than a few percent.
Acknowledgements.
This work has made use of data from the European Space Agency (ESA) mission Gaia (https://www.cosmos.esa.int/gaia), processed by the Gaia Data Processing and Analysis Consortium (DPAC, https://www.cosmos.esa.int/web/gaia/dpac/consortium). Funding for the DPAC has been provided by national institutions, in particular the institutions participating in the Gaia Multilateral Agreement. The research of T.P. was partly supported by the Excellence Cluster ORIGINS which is funded by the Deutsche Forschungsgemeinschaft (DFG, German Research Foundation) under Germany’s Excellence Strategy - EXC-2094 - 390783311.References
- Allen & Hillier (1993) Allen, D. A. & Hillier, D. J. 1993, Proceedings of the Astronomical Society of Australia, 10, 338
- Bailer-Jones (2015) Bailer-Jones, C. A. L. 2015, PASP, 127, 994
- Baume et al. (2003) Baume, G., Vázquez, R. A., Carraro, G., & Feinstein, A. 2003, A&A, 402, 549
- Bossini et al. (2019) Bossini, D., Vallenari, A., Bragaglia, A., et al. 2019, A&A, 623, A108
- Bressan et al. (2012) Bressan, A., Marigo, P., Girardi, L., et al. 2012, MNRAS, 427, 127
- Broos et al. (2011a) Broos, P. S., Getman, K. V., Povich, M. S., et al. 2011a, ApJS, 194, 4
- Broos et al. (2011b) Broos, P. S., Getman, K. V., Povich, M. S., et al. 2011b, ApJS, 194, 4
- Broos et al. (2010) Broos, P. S., Townsley, L. K., Feigelson, E. D., et al. 2010, ApJ, 714, 1582
- Broos et al. (2011c) Broos, P. S., Townsley, L. K., Feigelson, E. D., et al. 2011c, ApJS, 194, 2
- Brown (2012) Brown, A. G. A. 2012, Statistical astrometry (Cambridge University Press), 242
- Campillay et al. (2007) Campillay, A., Arias, J., Barba, R., et al. 2007, in VI Reunion Anual Sociedad Chilena de Astronomia (SOCHIAS), 63
- Cantat-Gaudin et al. (2018) Cantat-Gaudin, T., Jordi, C., Vallenari, A., et al. 2018, A&A, 618, A93
- Carraro et al. (2001) Carraro, G., Patat, F., & Baumgardt, H. 2001, A&A, 371, 107
- Clariá (1977) Clariá, J. J. 1977, A&AS, 27, 145
- de Zeeuw et al. (1999) de Zeeuw, P. T., Hoogerwerf, R., de Bruijne, J. H. J., Brown, A. G. A., & Blaauw, A. 1999, AJ, 117, 354
- Dias et al. (2002) Dias, W. S., Alessi, B. S., Moitinho, A., & Lépine, J. R. D. 2002, A&A, 389, 871
- Evans et al. (2005) Evans, C. J., Smartt, S. J., Lee, J. K., et al. 2005, A&A, 437, 467
- Fabricius et al. (2021) Fabricius, C., Luri, X., Arenou, F., et al. 2021, A&A, 649, A5
- Feigelson & Babu (2012) Feigelson, E. D. & Babu, G. J. 2012, Modern Statistical Methods for Astronomy (Cambridge University Press)
- Gaia Collaboration et al. (2021) Gaia Collaboration, Brown, A. G. A., Vallenari, A., et al. 2021, A&A, 649, A1
- Gaia Collaboration et al. (2016) Gaia Collaboration, Prusti, T., de Bruijne, J. H. J., et al. 2016, A&A, 595, A1
- Hambly et al. (2021) Hambly, N., Arenou, F., Babusiaux, C., et al. 2021, Gaia EDR3 documentation Chapter 13: Datamodel description, Gaia EDR3 documentation
- Kaltcheva & Golev (2012) Kaltcheva, N. T. & Golev, V. K. 2012, PASP, 124, 128
- Kharchenko et al. (2005) Kharchenko, N. V., Piskunov, A. E., Röser, S., Schilbach, E., & Scholz, R. D. 2005, A&A, 438, 1163
- Kuhn et al. (2019) Kuhn, M. A., Hillenbrand, L. A., Sills, A., Feigelson, E. D., & Getman, K. V. 2019, ApJ, 870, 32
- Lindegren (2018) Lindegren, L. 2018, gAIA-C3-TN-LU-LL-124
- Lindegren et al. (2021) Lindegren, L., Bastian, U., Biermann, M., et al. 2021, A&A, 649, A4
- Luri et al. (2018) Luri, X., Brown, A. G. A., Sarro, L. M., et al. 2018, A&A, 616, A9
- Maíz Apellániz et al. (2021) Maíz Apellániz, J., Barbá, R. H., Fernández Aranda, R., et al. 2021, arXiv e-prints, arXiv:2110.01464
- Maíz Apellániz et al. (2020) Maíz Apellániz, J., Crespo Bellido, P., Barbá, R. H., Fernández Aranda, R., & Sota, A. 2020, A&A, 643, A138
- Mayer et al. (2017) Mayer, P., Harmanec, P., Chini, R., et al. 2017, A&A, 600, A33
- Messineo & Brown (2019) Messineo, M. & Brown, A. G. A. 2019, AJ, 158, 20
- Olivares et al. (2020) Olivares, J., Sarro, L. M., Bouy, H., et al. 2020, A&A, 644, A7
- Pandey et al. (2010) Pandey, A. K., Sandhu, T. S., Sagar, R., & Battinelli, P. 2010, MNRAS, 403, 1491
- Povich et al. (2019) Povich, M. S., Maldonado, J. T., Haze Nuñez, E., & Robitaille, T. P. 2019, ApJ, 881, 37
- Povich et al. (2011) Povich, M. S., Smith, N., Majewski, S. R., et al. 2011, ApJS, 194, 14
- Preibisch & Feigelson (2005) Preibisch, T. & Feigelson, E. D. 2005, ApJS, 160, 390
- Preibisch et al. (2017) Preibisch, T., Flaischlen, S., Gaczkowski, B., Townsley, L., & Broos, P. 2017, A&A, 605, A85
- Preibisch et al. (2021) Preibisch, T., Flaischlen, S., Göppl, C., Ercolano, B., & Roccatagliata, V. 2021, A&A, 648, A34
- Preibisch et al. (2011a) Preibisch, T., Hodgkin, S., Irwin, M., et al. 2011a, ApJS, 194, 10
- Preibisch et al. (2014a) Preibisch, T., Mehlhorn, M., Townsley, L., Broos, P., & Ratzka, T. 2014a, A&A, 564, A120
- Preibisch et al. (2011b) Preibisch, T., Ratzka, T., Kuderna, B., et al. 2011b, A&A, 530, A34
- Preibisch et al. (2012) Preibisch, T., Roccatagliata, V., Gaczkowski, B., & Ratzka, T. 2012, A&A, 541, A132
- Preibisch et al. (2014b) Preibisch, T., Zeidler, P., Ratzka, T., Roccatagliata, V., & Petr-Gotzens, M. G. 2014b, A&A, 572, A116
- Rebolledo et al. (2016) Rebolledo, D., Burton, M., Green, A., et al. 2016, MNRAS, 456, 2406
- Shull et al. (2021) Shull, J. M., Darling, J., & Danforth, C. W. 2021, ApJ, 914, 18
- Smith (2006) Smith, N. 2006, MNRAS, 367, 763
- Smith & Brooks (2008) Smith, N. & Brooks, K. J. 2008, ASP Monograph Publications, Vol. 5, The Carina Nebula: A Laboratory for Feedback and Triggered Star Formation, ed. B. Reipurth (Astronomical Society of the Pacific), 138
- Smith et al. (2000) Smith, N., Egan, M. P., Carey, S., et al. 2000, ApJ, 532, L145
- Smith et al. (2010) Smith, N., Povich, M. S., Whitney, B. A., et al. 2010, MNRAS, 406, 952
- Townsley et al. (2011) Townsley, L. K., Broos, P. S., Corcoran, M. F., et al. 2011, ApJS, 194, 1
- van den Bergh & Hagen (1975) van den Bergh, S. & Hagen, G. L. 1975, AJ, 80, 11
- Walborn (1982) Walborn, N. R. 1982, AJ, 87, 1300
- Wang et al. (2011) Wang, J., Feigelson, E. D., Townsley, L. K., et al. 2011, ApJS, 194, 11
- Wolk et al. (2011) Wolk, S. J., Broos, P. S., Getman, K. V., et al. 2011, ApJS, 194, 12
Appendix A Distance estimates with RUWE selection
The RUWE values listed in the Gaia catalog are a goodness-of-fit statistic describing the quality of the astrometric solution (see Lindegren 2018). Values above 1.4 indicate a low reliability of the astrometric parameters (Fabricius et al. 2021). In this section, we investigate how our distance estimate would change if we excluded all sources with RUWE from our samples.
Application of this RUWE selection criterion reduces the OB-star samples of the Carina Nebula, NGC 3324, and NGC 3293 by 20, 1, and 3 stars, respectively, leading to a 10.1% reduction in the combined sample size. The corresponding X-ray samples are reduced by 915, 45, and 54 objects, leading to a 10.6% reduction in the combined sample size. We repeated all our distance calculations listed in Table 2 with the RUWE selection criterion; the resulting distances are summarized in Table 4. Comparison of the distances with and without the RUWE selection criterion show only very small (and insignificant) differences for almost all subsamples.
For the Carina Nebula and the NGC 3293 OB star samples, the changes of the ML and also the Kalkayotl distances are pc. In the NGC 3324 OB star sample, which consists of only five stars, the removal of the star HD 92 206 C (which has RUWE = 5.27 and a discrepant parallax qualifying it as a “” outlier) leads to a 8 pc change in the ML mean distance and a 17 pc change in the Kalkayotl distance for this group when applying the outlier exclusion, but no change for the and outlier exclusion case. For the combined OB sample, the changes in the ML and the Kalkayotl distances are pc. Our final distance estimate for the OB stars of kpc does not change.
For the X-ray samples, the changes of the ML mean distances are always pc, and pc for the combined X-ray sample. The Kalkayotl distances for the X-ray samples change by pc, and the changes for the combined X-ray sample are pc. Our final distance estimate for the X-ray-selected stars of kpc does not change. For the vdBH 99 sample, excluding the 27 stars with RUWE this leads to a Kalkayotl distance of pc, which is only 0.1 pc smaller than without RUWE selection.
| Group | outlier exclusion: | ML parallax | ML distance | Kalkayotl distance | ||||
|---|---|---|---|---|---|---|---|---|
| fore- | back- | -range | central 68.3% quant. | |||||
| ground | [mas] | [kpc] | [kpc] | |||||
| Carina Neb. | 1 | 2 | 2.366 | |||||
| OB stars | 2 | 3 | 2.367 | |||||
| 3 | 8 | 2.363 | ||||||
| NGC 3324 | 0 | 0 | 2.338 | |||||
| OB stars | 0 | 0 | 2.338 | |||||
| 0 | 0 | 2.338 | ||||||
| NGC 3293 | 1 | 1 | 2.354 | |||||
| OB stars | 1 | 1 | 2.354 | |||||
| 2 | 1 | 2.357 | ||||||
| All | 2 | 3 | 2.362 | |||||
| OB stars | 3 | 4 | 2.363 | |||||
| 5 | 9 | 2.362 | ||||||
| CCCP | 732 | 132 | 2.343 | |||||
| X-ray | 934 | 418 | 2.339 | |||||
| 1569 | 1280 | 2.331 | ||||||
| NGC 3324 | 52 | 9 | 2.345 | |||||
| X-ray | 65 | 19 | 2.358 | |||||
| 96 | 51 | 2.357 | ||||||
| NGC 3293 | 46 | 5 | 2.344 | |||||
| X-ray | 56 | 23 | 2.340 | |||||
| 100 | 75 | 2.340 | ||||||
| All | 830 | 146 | 2.341 | |||||
| X-ray | 1055 | 460 | 2.337 | |||||
| 1765 | 1406 | 2.331 | ||||||