Rubidium atom spectral lineshapes in high intensity electric fields near an optical nanofibre
Abstract
The integration of cold atomic systems with optical nanofibres is an increasingly important experimental platform. Here, we report on the spectra observed during a strongly driven, single-frequency, two-photon excitation of cold rubidium atoms near an optical nanofibre. At resonance, two competitive processes, namely a higher excitation rate and stronger pushing of atoms from the nanofibre due to resonance scattering, need to be considered. We discuss the processes that lead to the observed two-peak profile in the fluorescence spectrum as the excitation laser is scanned across the resonance, noting that the presence of the optical nanofibre dramatically changes the fluorescence signal. These observations are useful for experiments where high electric field intensities near an ONF are needed, for example when driving nonlinear processes.
-
January 16, 2022
1 Introduction:
Interactions between atoms and laser fields have been widely studied in many different scenarios, such as a two-level atom interacting with a monochromatic laser field, a three-level atom interacting with two laser fields, multilevel atoms with multifrequency light fields [1, 2], etc. The presence of coherence in such systems can substantially enhance the optical nonlinearity, leading to many interesting effects such as electromagnetically induced transparency (EIT) and coherent population trapping [3, 4, 5]. Over the past decade, optical waveguides, including optical nanofibres (ONF), have come to the fore as an exciting platform to study interactions of atoms with light. We focus our discussion on optical nanofibres, which provide tight confinement of light beyond the Rayleigh range and also serve as an ideal channel for light propagation. Optical nanofibres have been used to efficiently probe, manipulate and trap cold, alkali atoms [6, 7, 8, 9, 10] with recent works extending atom and ONF studies to the observation of a quadrupole transition in 87Rb atoms [11], the demonstration of quadrature squeezing of nanofibre-guided light [12], and a determination of the polarization dependency of spin selection in laser-cooled atoms [13].
One particular advantage of ONFs is that they provide a means to perform high electric field intensity experiments at very low optical powers. However, there is also a disadvantage since the origin of some observed effects on spectral lineshapes due to the presence of the ONF is not always clear [14, 15, 16, 17]. In this work, we generate high electric field intensities using either an optical nanofibre or a tightly focussed free-space beam, so as to make a comparison between the observed effects on spectral line shapes. Notably, the fluorescence signal from atoms near an ONF can exhibit a two-peak profile as the frequency of the excitation laser is scanned across an atomic resonance. We explore several atomic transitions and experimental configurations to investigate this effect in detail and hypothesise on possible sources of the observed phenomenon.
2 Experiment
2.1 Experimental setup
We prepared an ensemble of trapped cold 87Rb atoms using a standard magneto-optical trap (MOT) configuration [13]. The average temperature of the atomic cloud was 200 K, with a density of 1010 atoms/cm3. The cooling beams for the MOT were 14 MHz red-detuned from the 5S1/2 F=2 5P3/2 F′=3 transition with an intensity of 11 mW/cm2 per beam. The optical nanofibre was fabricated from commercial step-index optical fibre (Fibercore, SM800-5.6-125) by heating it with an oxygen-hydrogen flame and simultaneously pulling it using computer-controlled motorised stages [18]. The final nanofibre waist was 400 nm, allowing only single-mode propagation for all the wavelengths used in the experiment, 780 nm, 795 nm, and 993 nm. Note that all optical nanofibre-guided excitation laser powers mentioned were measured at the output pigtail of the ONF and the power at the waist could be higher due to propagation losses in the fiber.
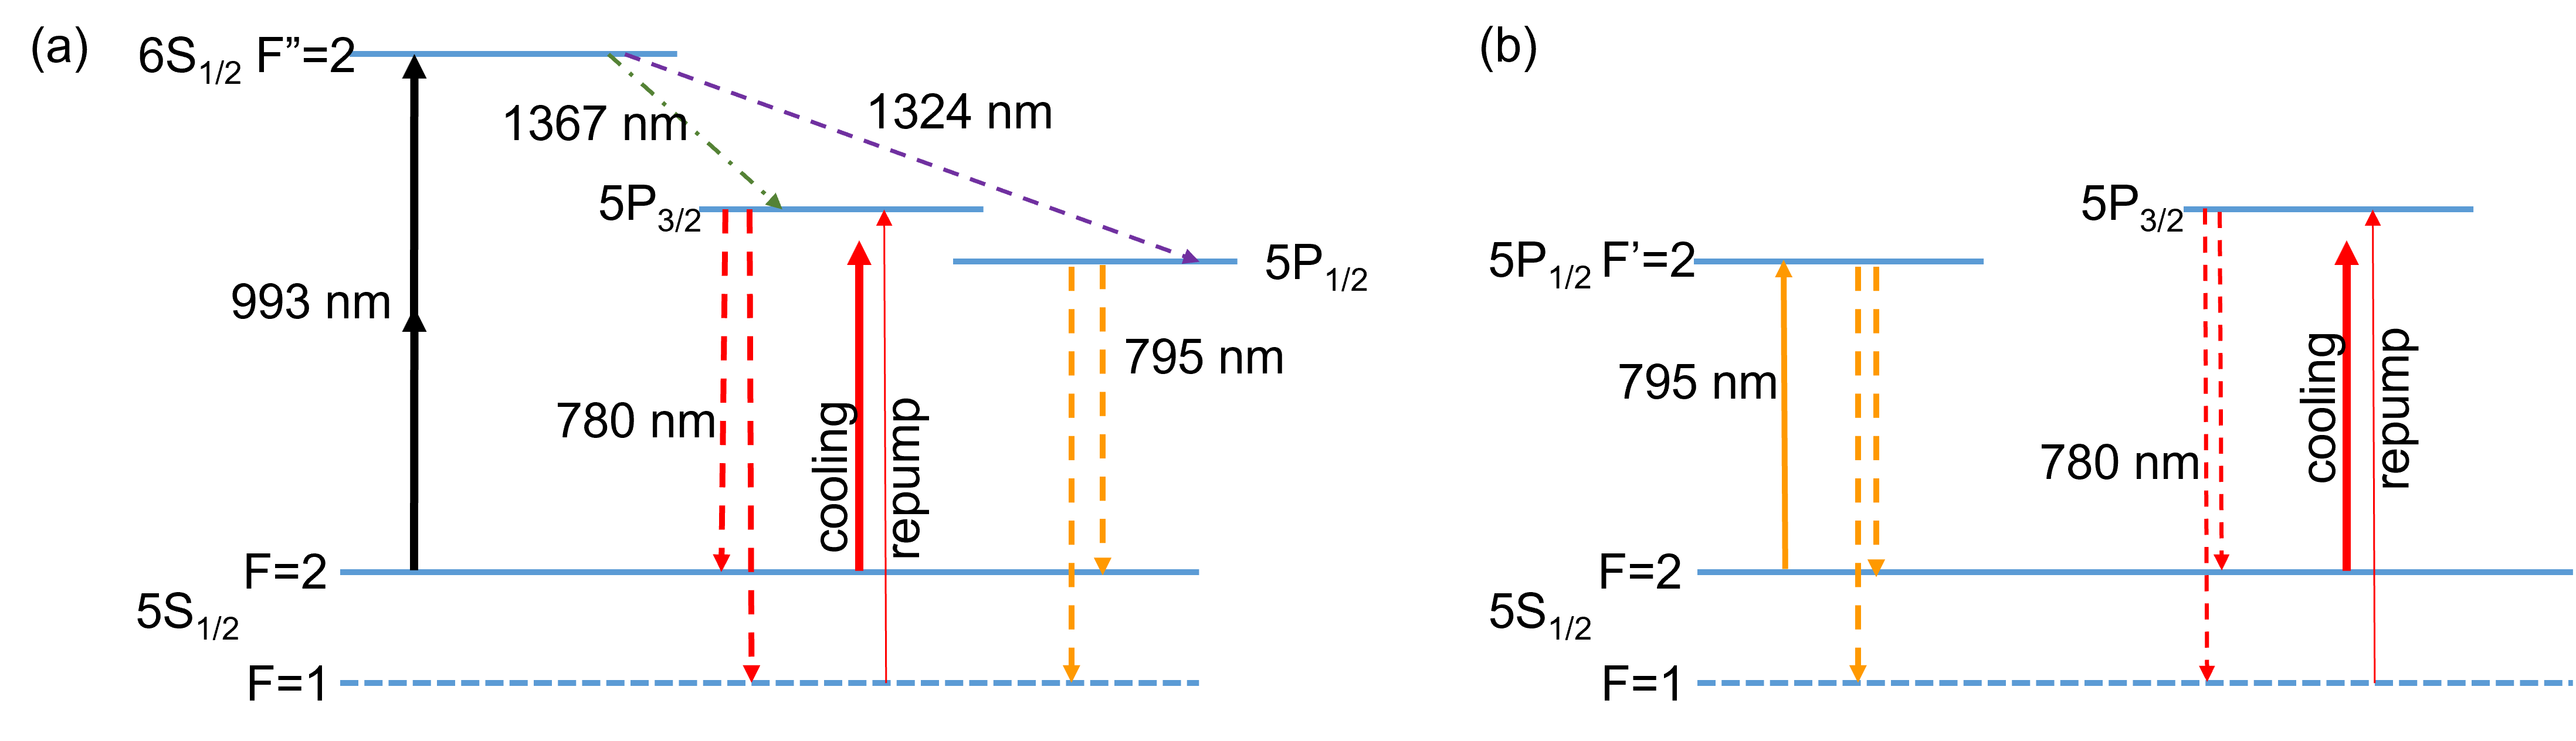
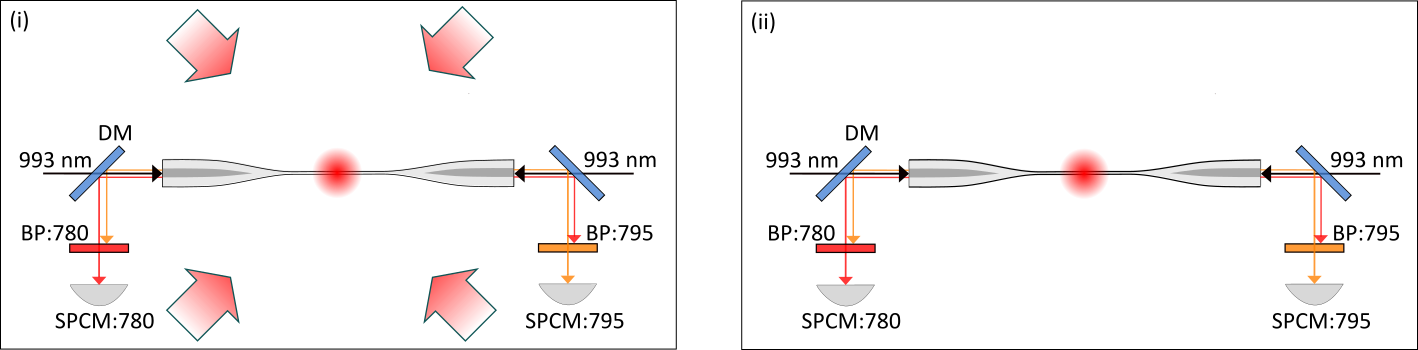
Experiments were performed in two categories: atoms were excited via (i) a two-photon transition or (ii) a one-photon transition, see Fig. 1. Resonant and near-resonant excitation of the cold atoms was achieved using a sub-MHz linewidth Ti-Sapphire laser (M Squared Lasers: SolsTis ECD-X). Fluorescence photons during the de-excitation process coupled into the ONF and propagated to the pigtail on either end where they were subsequently detected using single-photon counter modules (SPCM: Excelitas Technologies: SPCM-AQRH-14-FC), see Fig. 2. Dichroic mirrors and interference filters were used to combine and separate the different wavelengths as per experimental requirements. Additionally, the fluorescence signal from the cold atom cloud could be collected in free-space via a microscope composed of two convex lenses, with focal lengths of 125 mm and 250 mm, and was measured using a photomultiplier tube (PMT: Hamamatsu Photonics), see Fig. 3. Both the lenses and the PMT were kept outside the vacuum chamber. The fluorescence signals were collected for two different configurations as discussed in the following.
2.2 Single-frequency, two-photon excitation around the optical nanofibre
Many experiments involving two-photon processes demand minimizing the one-photon excitation. A larger detuning of the excitation laser frequency with respect to the intermediate level leads to fewer atoms in the intermediate level at the expense of a higher light field intensity requirement. In single-frequency, two-photon excitation (see Fig. 1(a)), in general, the laser frequency is very far-detuned from the intermediate levels; additional advantages are the need for only one laser and a more straightforward theoretical description. The subwavelength diameter of an ONF provides very high intensities in the evanescent field at very low powers (e.g. a few nW of propagating light can produce a Rabi frequency of tens of MHz for atoms in the evanescent field [19]), hence providing near-ideal conditions for single-frequency, two-photon excitation to occur.
In this experiment, we used 993 nm light to excite 87Rb atoms from 5S1/2 F=2 6S1/2 F′′=2 using a two-photon process, see Fig. 1(a). The 993 nm light was obtained from the Ti-Sapphire laser and could be frequency scanned or locked depending on the experiment. Excited atoms in the 6S1/2 state spontaneously decayed to the ground state, 5S1/2 F=1, 2, via (i) the intermediate state, 5P1/2, by emitting a 1324 nm photon followed by a 795 nm photon or (ii) the intermediate state, 5P3/2, by emitting a 1367 nm photon followed by a 780 nm photon. The ratio of the transition rates of 6S1/2 5P1/2 to 6S1/2 5P3/2 is 0.48 and 5P3/2 5S1/2 to 5P1/2 5S1/2 is 1.04 [20]. Hence, it is almost twice as likely that 780 nm photons are emitted in the decay process from 6S1/2 to 5S1/2 F=1, 2 than 795 nm photons.
2.2.1 Cooling beams on:
In the first configuration, 993 nm excitation light was sent through the ONF and fluorescence measurements were made in the presence of the MOT i.e. with cooling and repump beams on. The 993 nm light was frequency-scanned across the 5S1/2 F=2 6S1/2 F′′=2 resonance (301.77791 THz). The fluorescence signals at 795 nm and 780 nm coupled into the ONF and were measured at the SPCMs, see Fig. 2(\romannum1). In this scenario, fluorescence at 780 nm had contributions from both the excitation process to the 6S1/2 F′′=2 state (via one of the decay channels) and the MOT beams exciting atoms to the 5P3/2 F′ states. In contrast, detected fluorescence photons at 795 nm were solely due to the 6S1/2 F′′=2 state excitation, see the level diagram in Fig. 1(a).
2.2.2 Cooling beams off:
Here, the MOT cooling beams were turned off during the fluorescence measurement time window, see Fig. 2(\romannum2). In this configuration, the fluorescence signals at 795 nm and 780 nm were mainly from the 6S1/2 F′′=2 decay channels. Though some repump signal could contribute we assumed this was negligible. The experimental sequence was as follows: 993 nm light was sent through the ONF and its frequency was locked near or on resonance. The cold atom cloud was initially prepared in the MOT and this was followed by a polarisation gradient cooling phase (bringing the cooling power per beam from 11 mW/cm2 to 2.7 mW/cm2 and the cooling beam detuning from -14MHz to -30 MHz) for 5 ms. Subsequently, the cooling beams were turned off before the measurements. The fluorescence signal was collected during the first 700 sec and averaged over 20 cycles. A full spectrum was obtained by scanning the locking point of the 993 nm laser in steps of 2 MHz across the resonance and repeating the procedure as described above for each frequency step.
2.3 One-photon excitation in a cold atom cloud
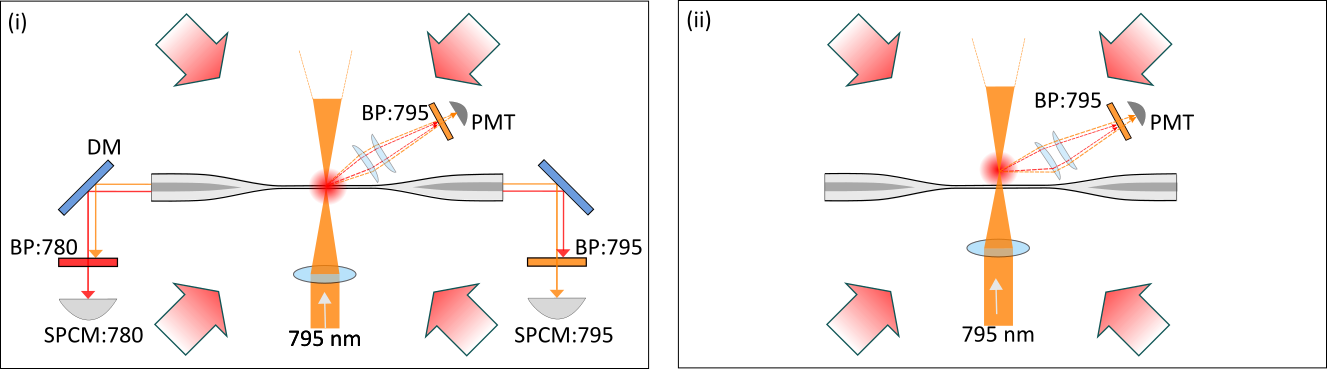
To better understand the observed features in the two-photon excitation experiments, we also performed one-photon excitation experiments as follows. Cold atoms in the MOT were excited from the 5S1/2 F=2 state to the 5P1/2 F′=2 state via 795 nm light ( 377.10519 THz), see Fig. 1(b). Since the excitation and the fluorescence light were of the same wavelength, the detection scheme used in Section 2.2, i.e. sending the excitation light through the ONF and detecting the fluorescence signal using a SPCM, was not suitable. Instead, here we used a free-space beam at 795 nm, focussed on the cold atom cloud via a convex lens (Thorlabs:LB1779-B, f=30 cm). The excitation light at 795 nm was derived from the Ti-Sapphire laser and could be scanned or locked at a fixed frequency. The experiments were conducted using the following two configurations.
2.3.1 Cold atoms around the ONF:
The MOT was formed around the ONF while the focussed excitation beam at 795 nm, transverse to the ONF, was sent through the atomic cloud, see Fig. 3(\romannum1). As the frequency of the 795 nm was scanned across the resonance, the fluorescence signals at 795 nm and 780 nm were measured using SPCMs and a PMT.
2.3.2 Cold atoms removed from the ONF:
In this case, we performed the one-photon excitation at 795 nm in a MOT when the cold atom cloud was at some distance from the ONF, see Fig. 3(\romannum2). This was achieved by changing the current in one of the MOT anti-Helmholtz coils, thereby shifting the zero of the magnetic field, hence the trap position. The excitation beam was realigned so that it passed through the atom cloud. The fluorescence signal in this configuration could only be measured by the PMT since the ONF was too far from the cold atom cloud for fluorescence coupling into the fibre.
3 Experimental Results
3.1 Single-frequency, two-photon excitation
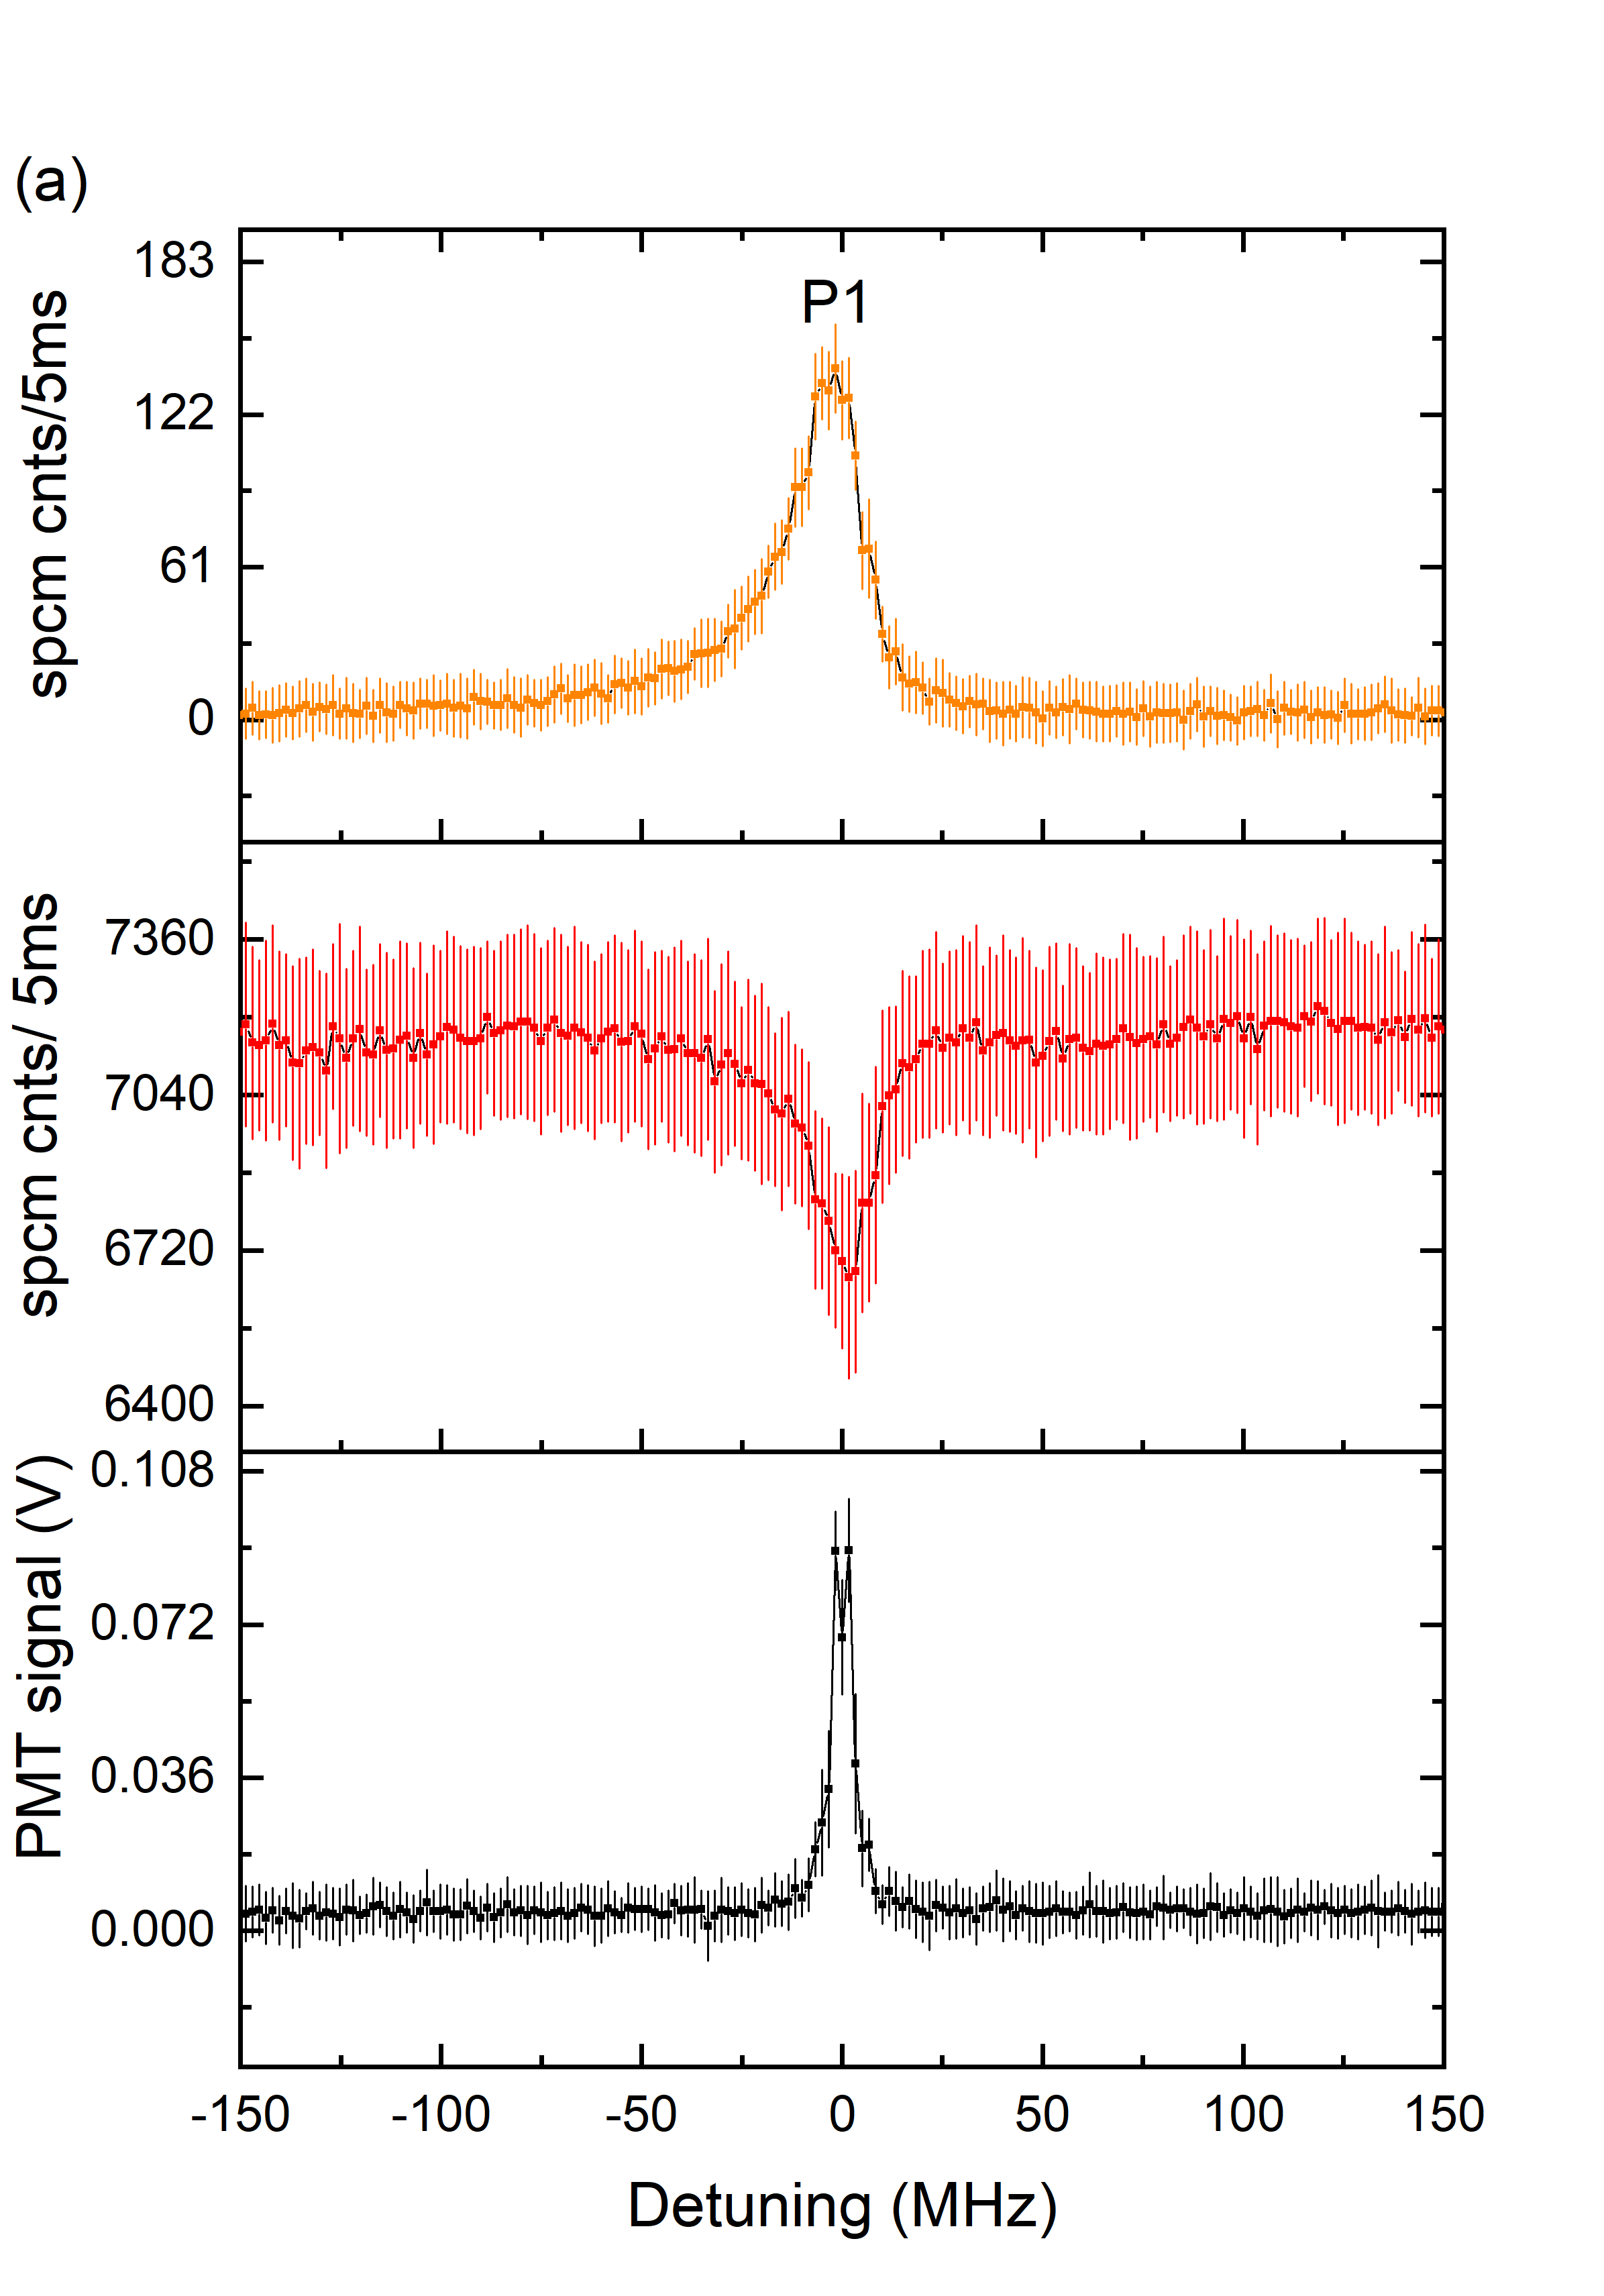
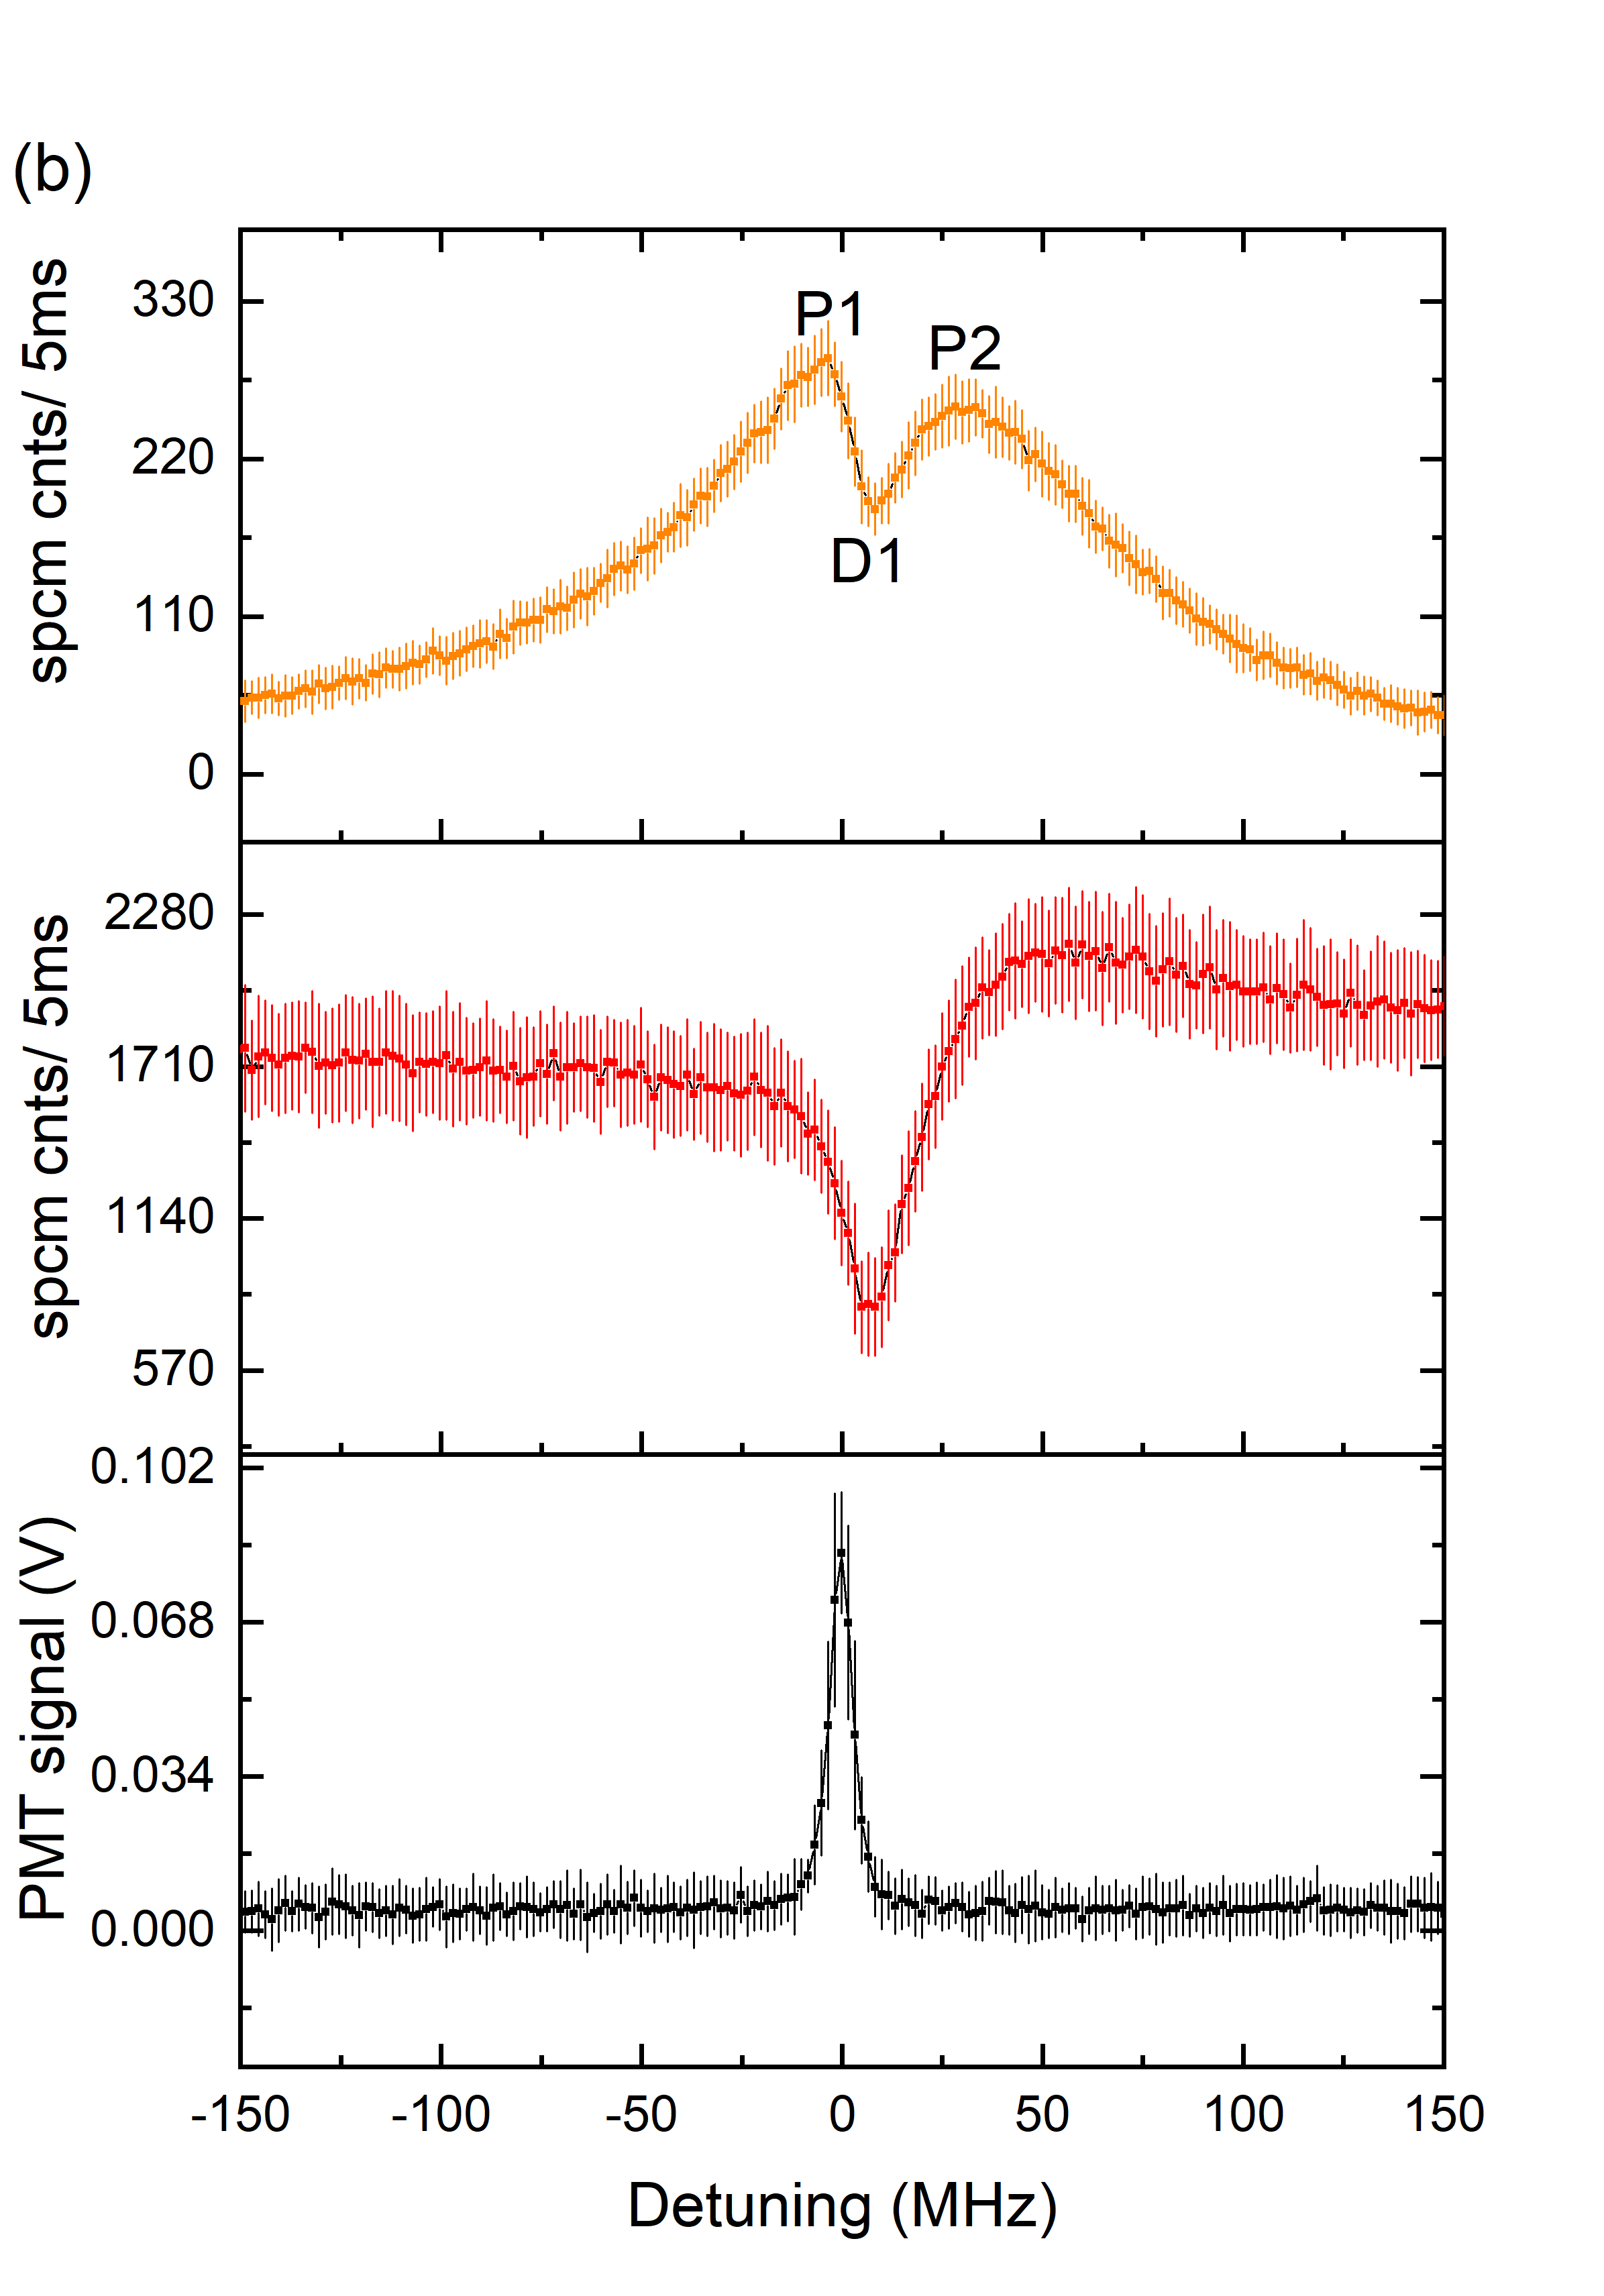
Let us first discuss the results obtained for a cloud of cold atoms in a magneto-optical trap surrounding the ONF. For a low power (0.1 mW) of the 993 nm excitation light propagating through the ONF, as the laser is tuned on-resonance with the 5S1/2 F=2 6S1/2 F′′=2 two-photon resonance condition, we observe a peak (P1) in the 795 nm fluorescence and a corresponding dip in the 780 nm fluorescence signal coupled into the nanofibre, see top and middle panels of Fig. 4(a). Detuning is defined as twice the laser frequency minus the atomic transition frequency for 5S1/2 F=2 6S1/2 F′′=2. With an increase in the 993 nm power to 2.45 mW, the 795 nm fluorescence signal shows a dip, D1, and the appearance of a second peak, P2, as shown in the top panel of Fig. 4(b). P2 becomes more pronounced with an increase in the 993 nm power; the two peaks, P1 and P2, also move further apart, i.e., the dip appears to become broader. The dip in the 780 nm signal is at exactly the same frequency as the dip in the 795 nm signal, see the top and middle panels of Fig. 4(b). The dip appears at a slightly positive detuning (by 1 to 7 MHz) (see bottom panel). Frequency calibration was obtained via simultaneous measurement using a wavemeter (HighFinesse GmbH WS8-2) in conjunction with spectroscopy performed in a Rb vapour cell with natural isotope abundance. The vapour cell was heated to 100∘C. Counterpropagating 993 nm laser beams passing through the cell cancelled the first-order Doppler shift and provided us with a Doppler-free spectroscopy peak as a precise frequency reference [21]. The full-width-at-half-maximum of the vapour cell signal is 6 MHz, see bottom panels of Fig. 4. The fluorescence signal obtained from the cold atoms near the ONF was typically much broader ( 20 MHz) than the vapour cell signal, which we attribute to surface effects from the ONF [17, 22]. We also observed that the splitting was more pronounced when the cloud was less dense (data not shown).
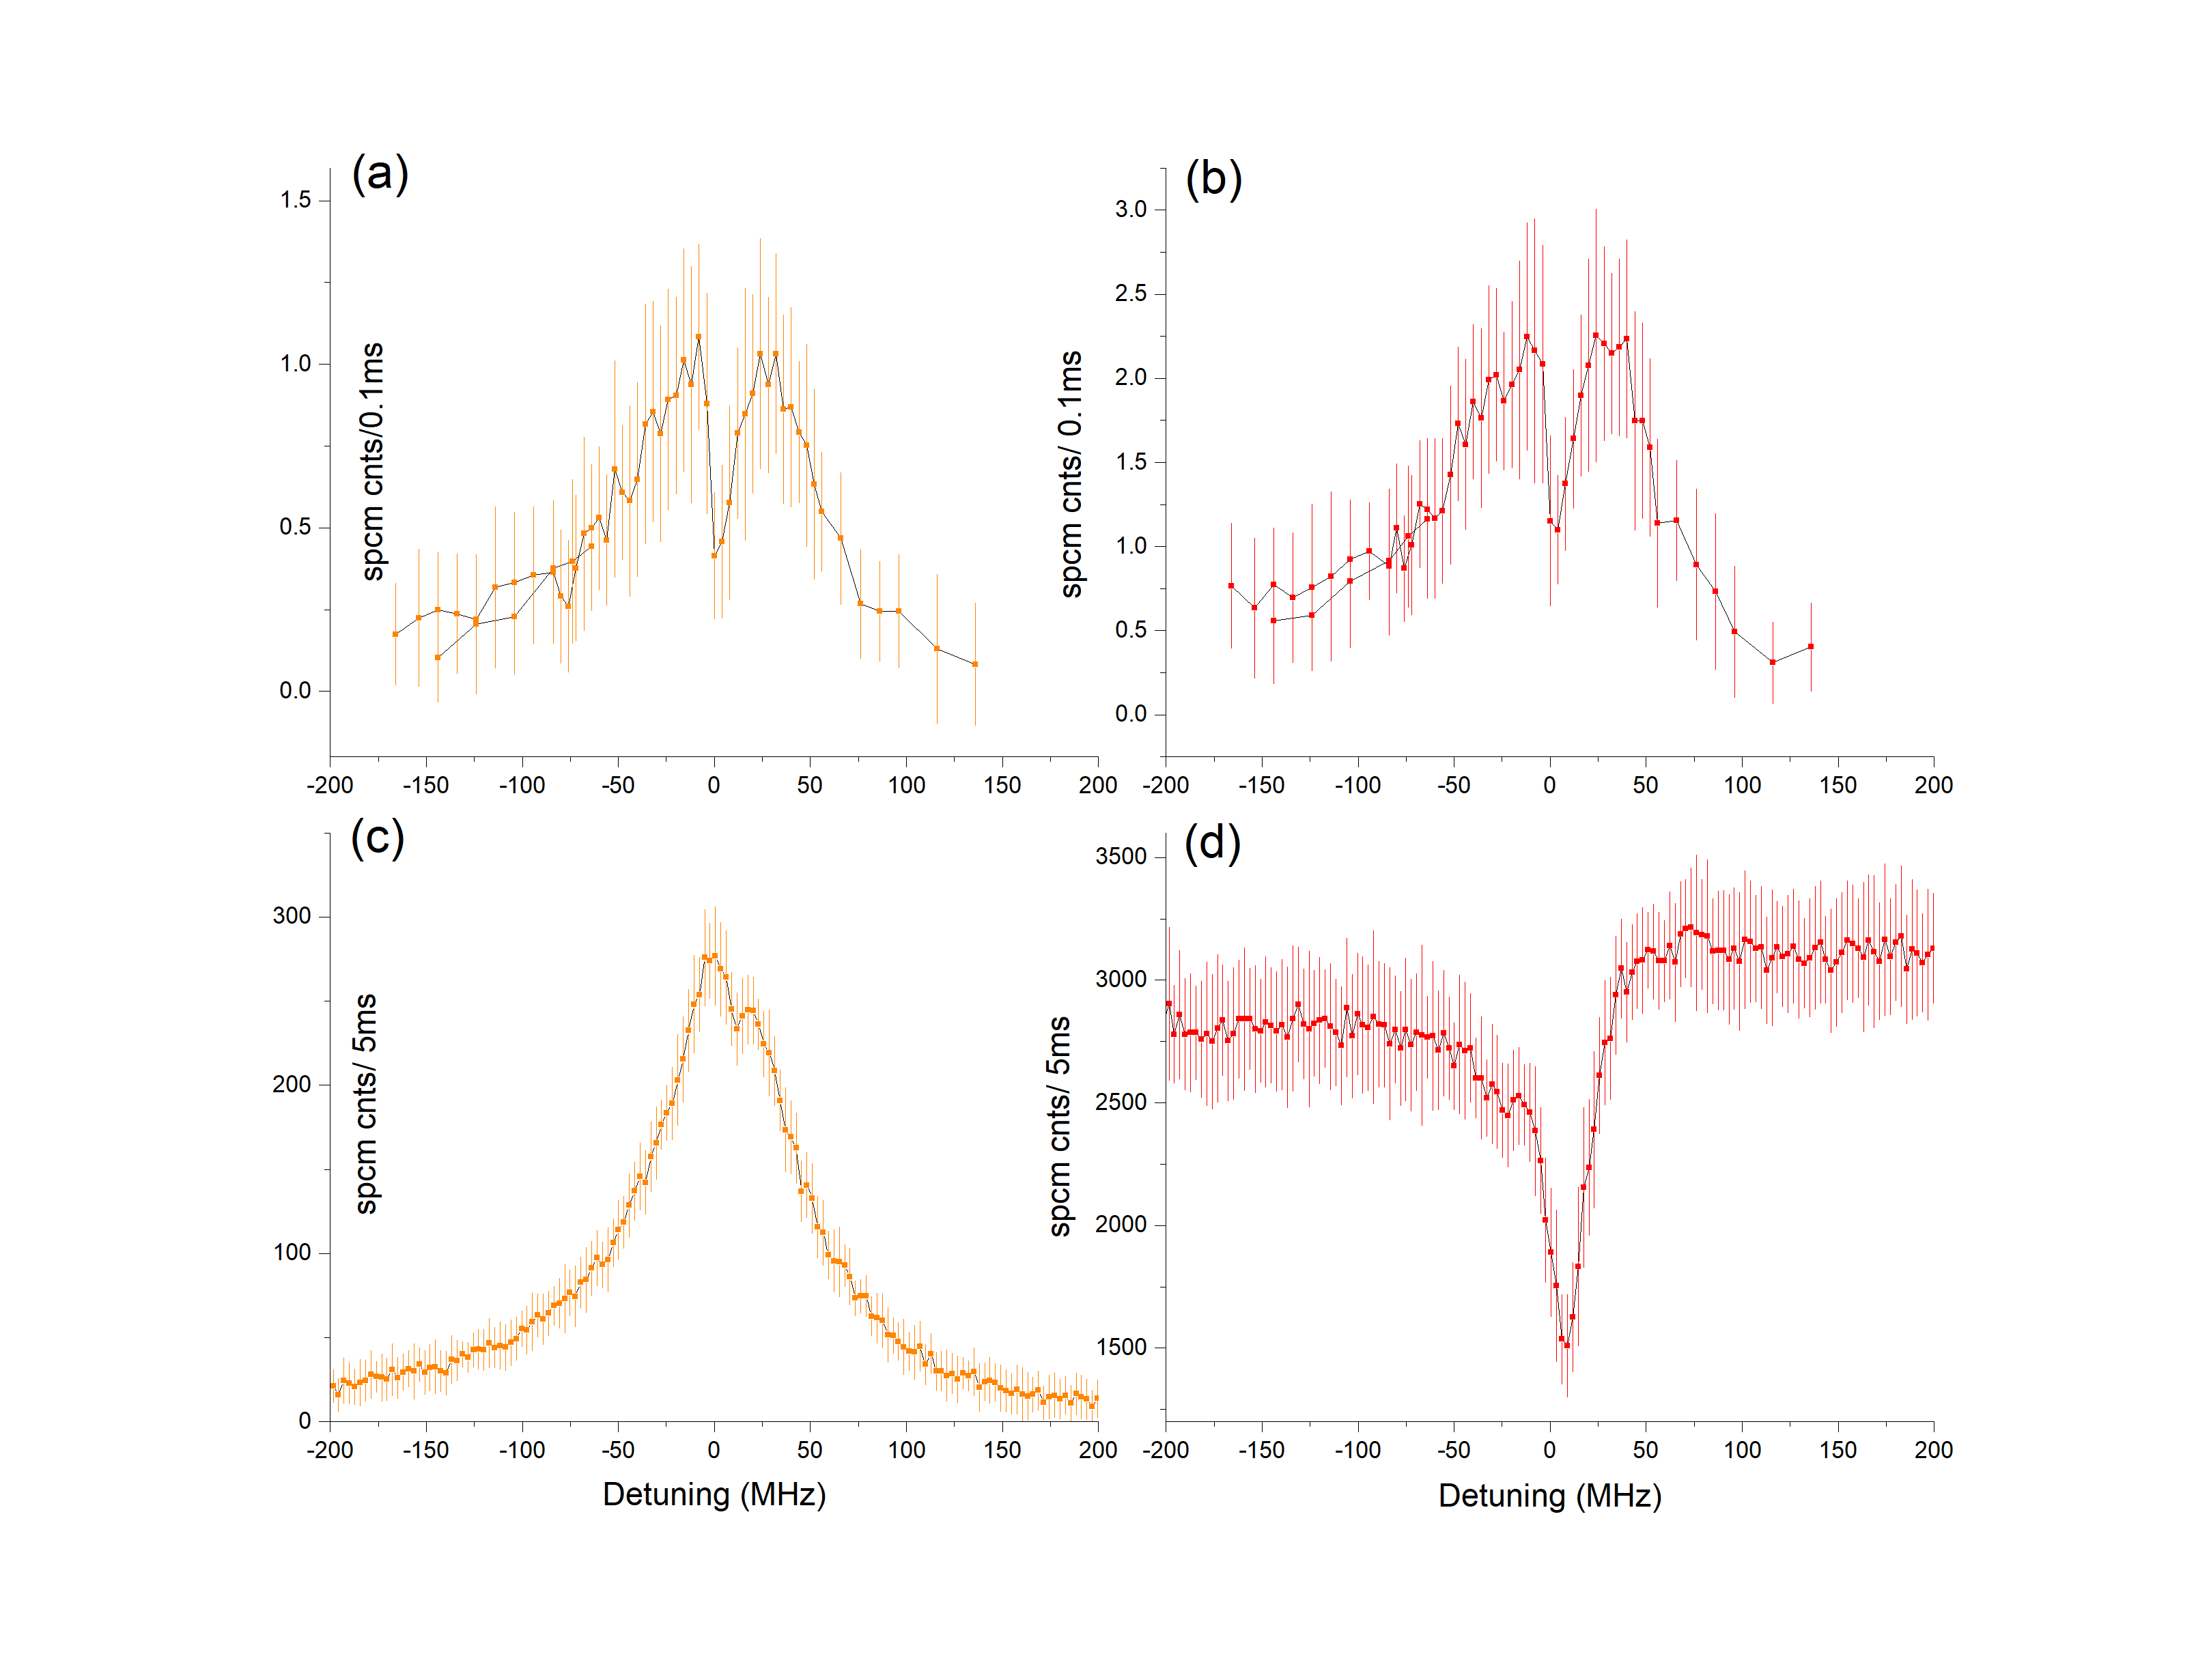

To simplify the system being studied, we next ran a series of tests with the cooling beams at 780 nm switched off during data acquisition and 2 mW of 993 nm excitation power going through the ONF. For the experiments presented in Fig. 4, the cooling beams were on at all times. By running the experiments in the absence of cooling beams, we could eliminate the possibility of Autler-Townes splitting being the cause for the observed split profiles. In the absence of the cooling beams, the observed fluorescence signals at 780 nm and 795 nm show similar trends with different amplitudes, see Fig. 5(a) and (b). This is expected since both signals are from the de-excitation of the 6S1/2 F′′=2 state to the 5S1/2 F=1, 2 states albeit with different transition probabilities (as discussed in Section 2.2). For comparison, fluorescence signals at 780 nm and 795 nm in a MOT, i.e., with the cooling beams on, are also plotted, see Fig. 5(c) and (d). Comparing Fig. 5(a) and (c), we see that the splitting is present in both the cases though it is more pronounced and the dip is deeper in the absence of cooling beams compared with the signals obtained with cooling beams.
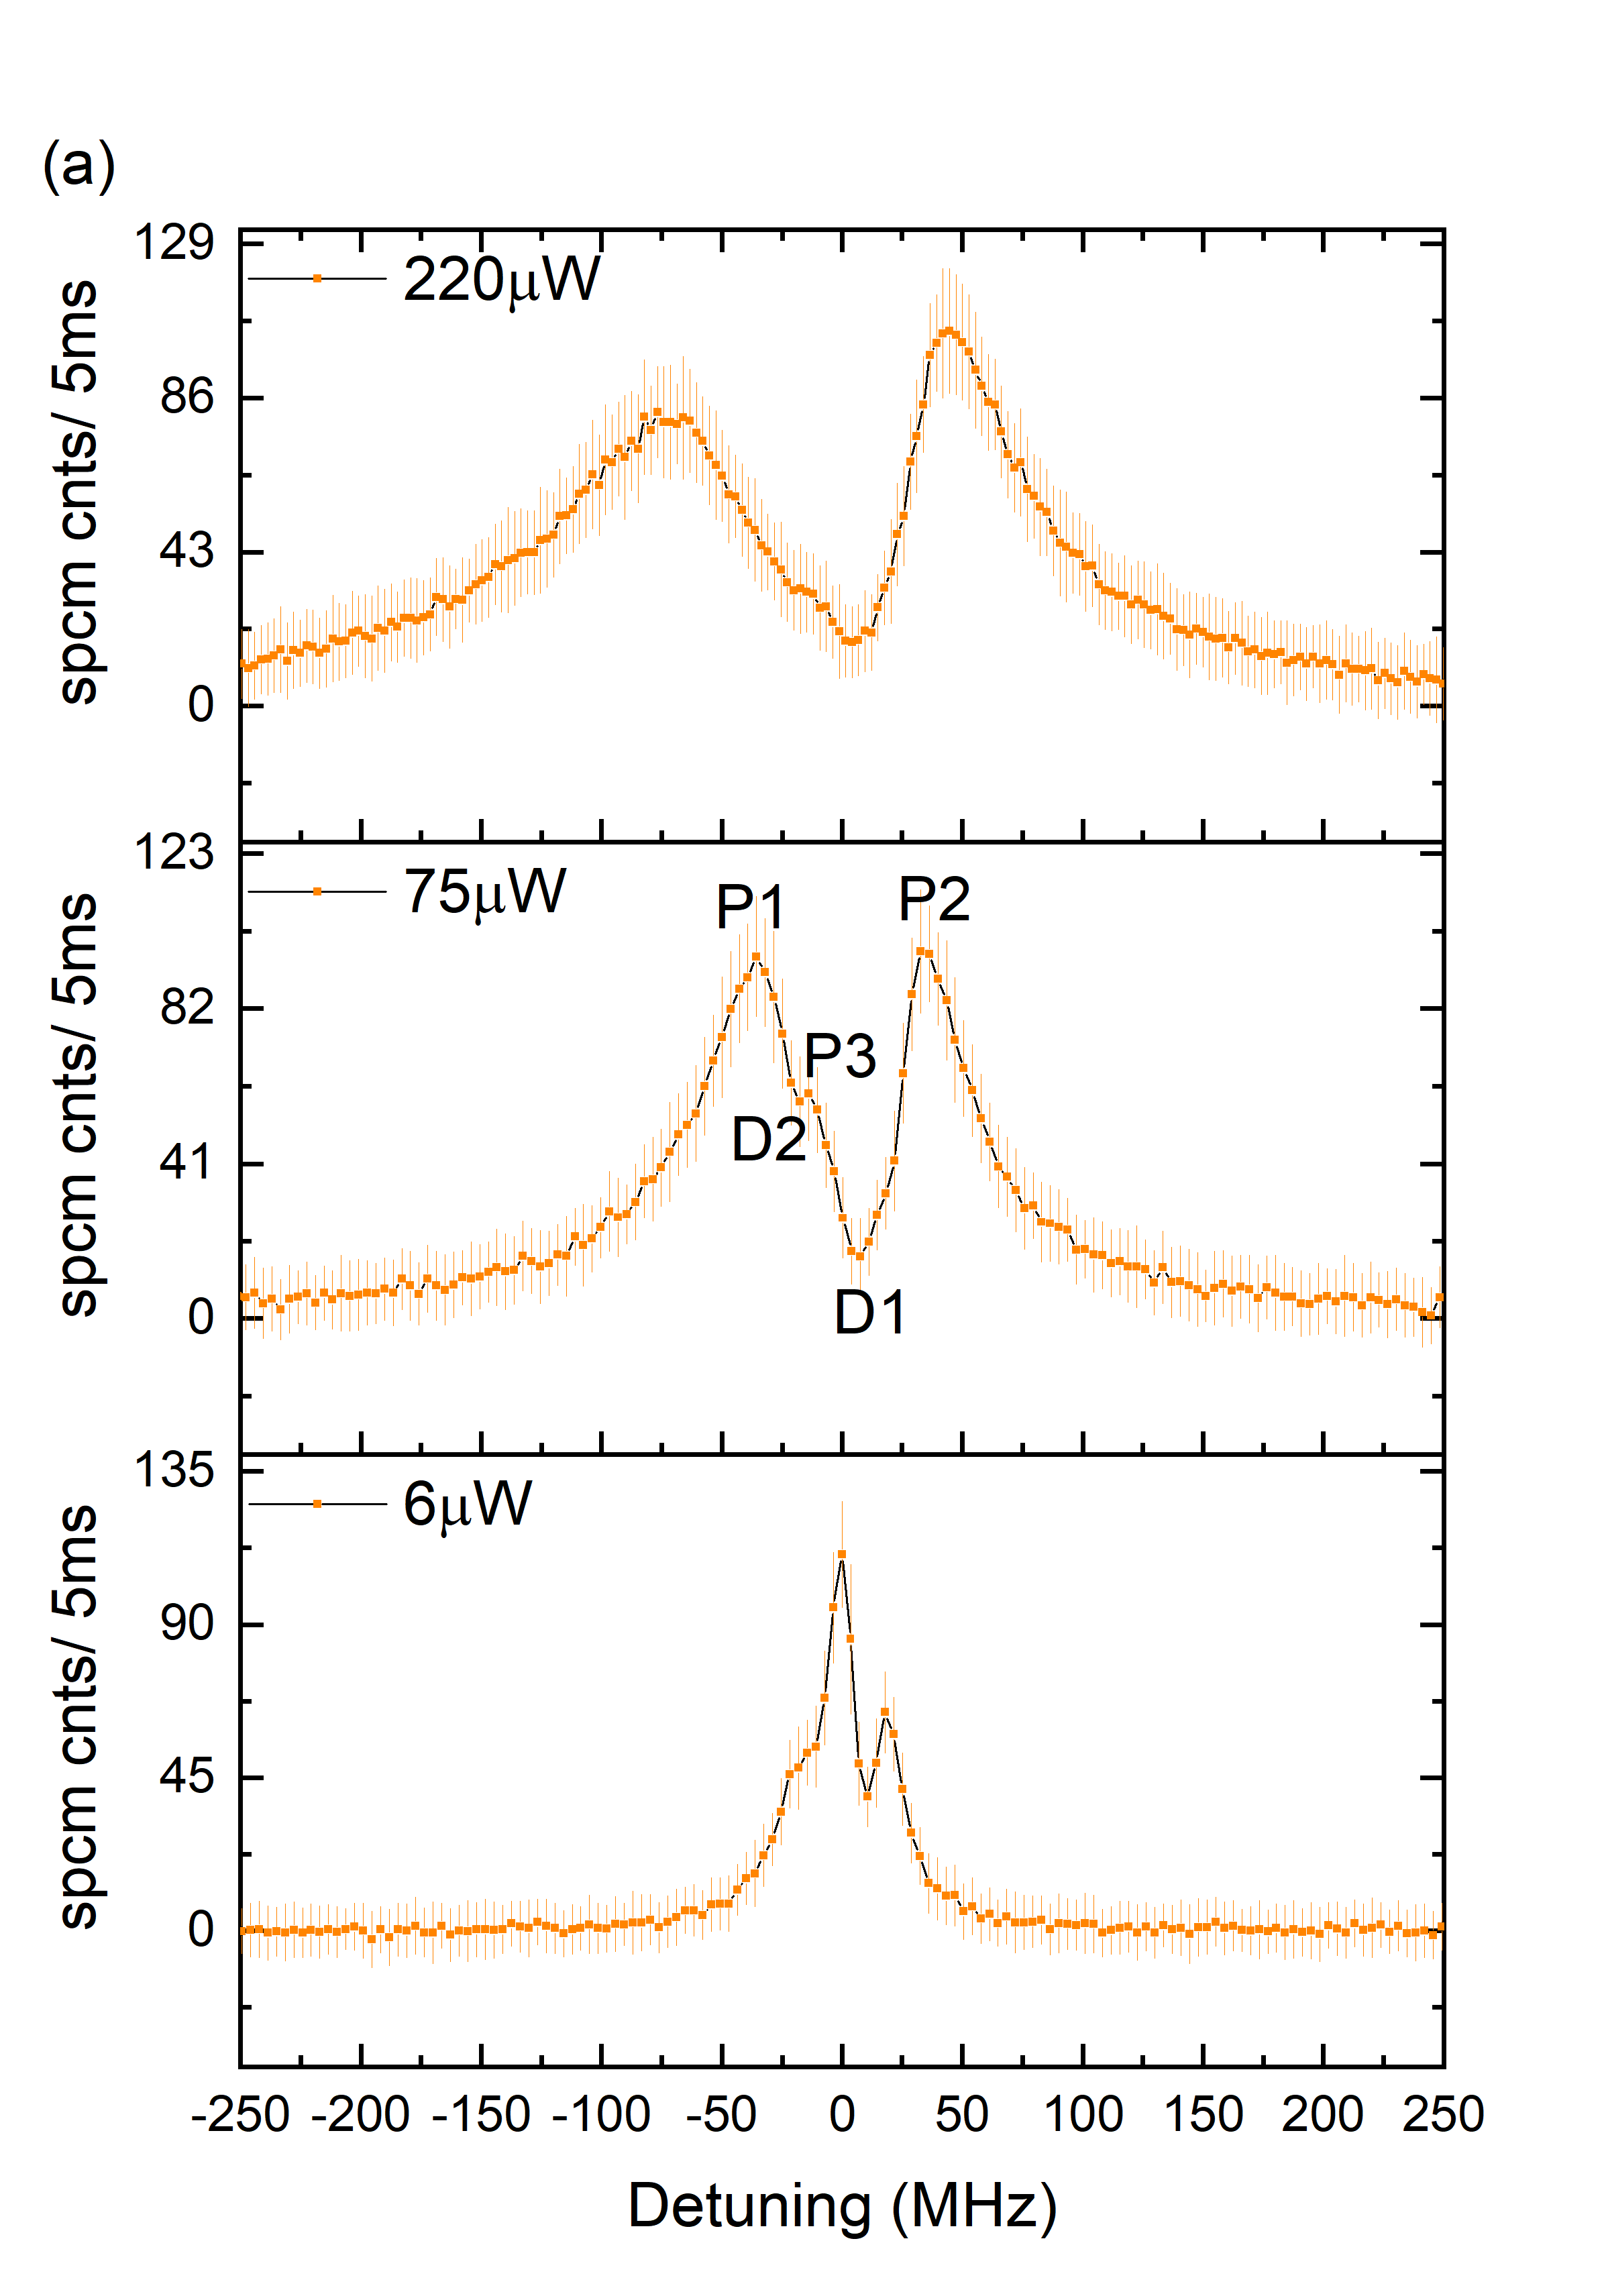
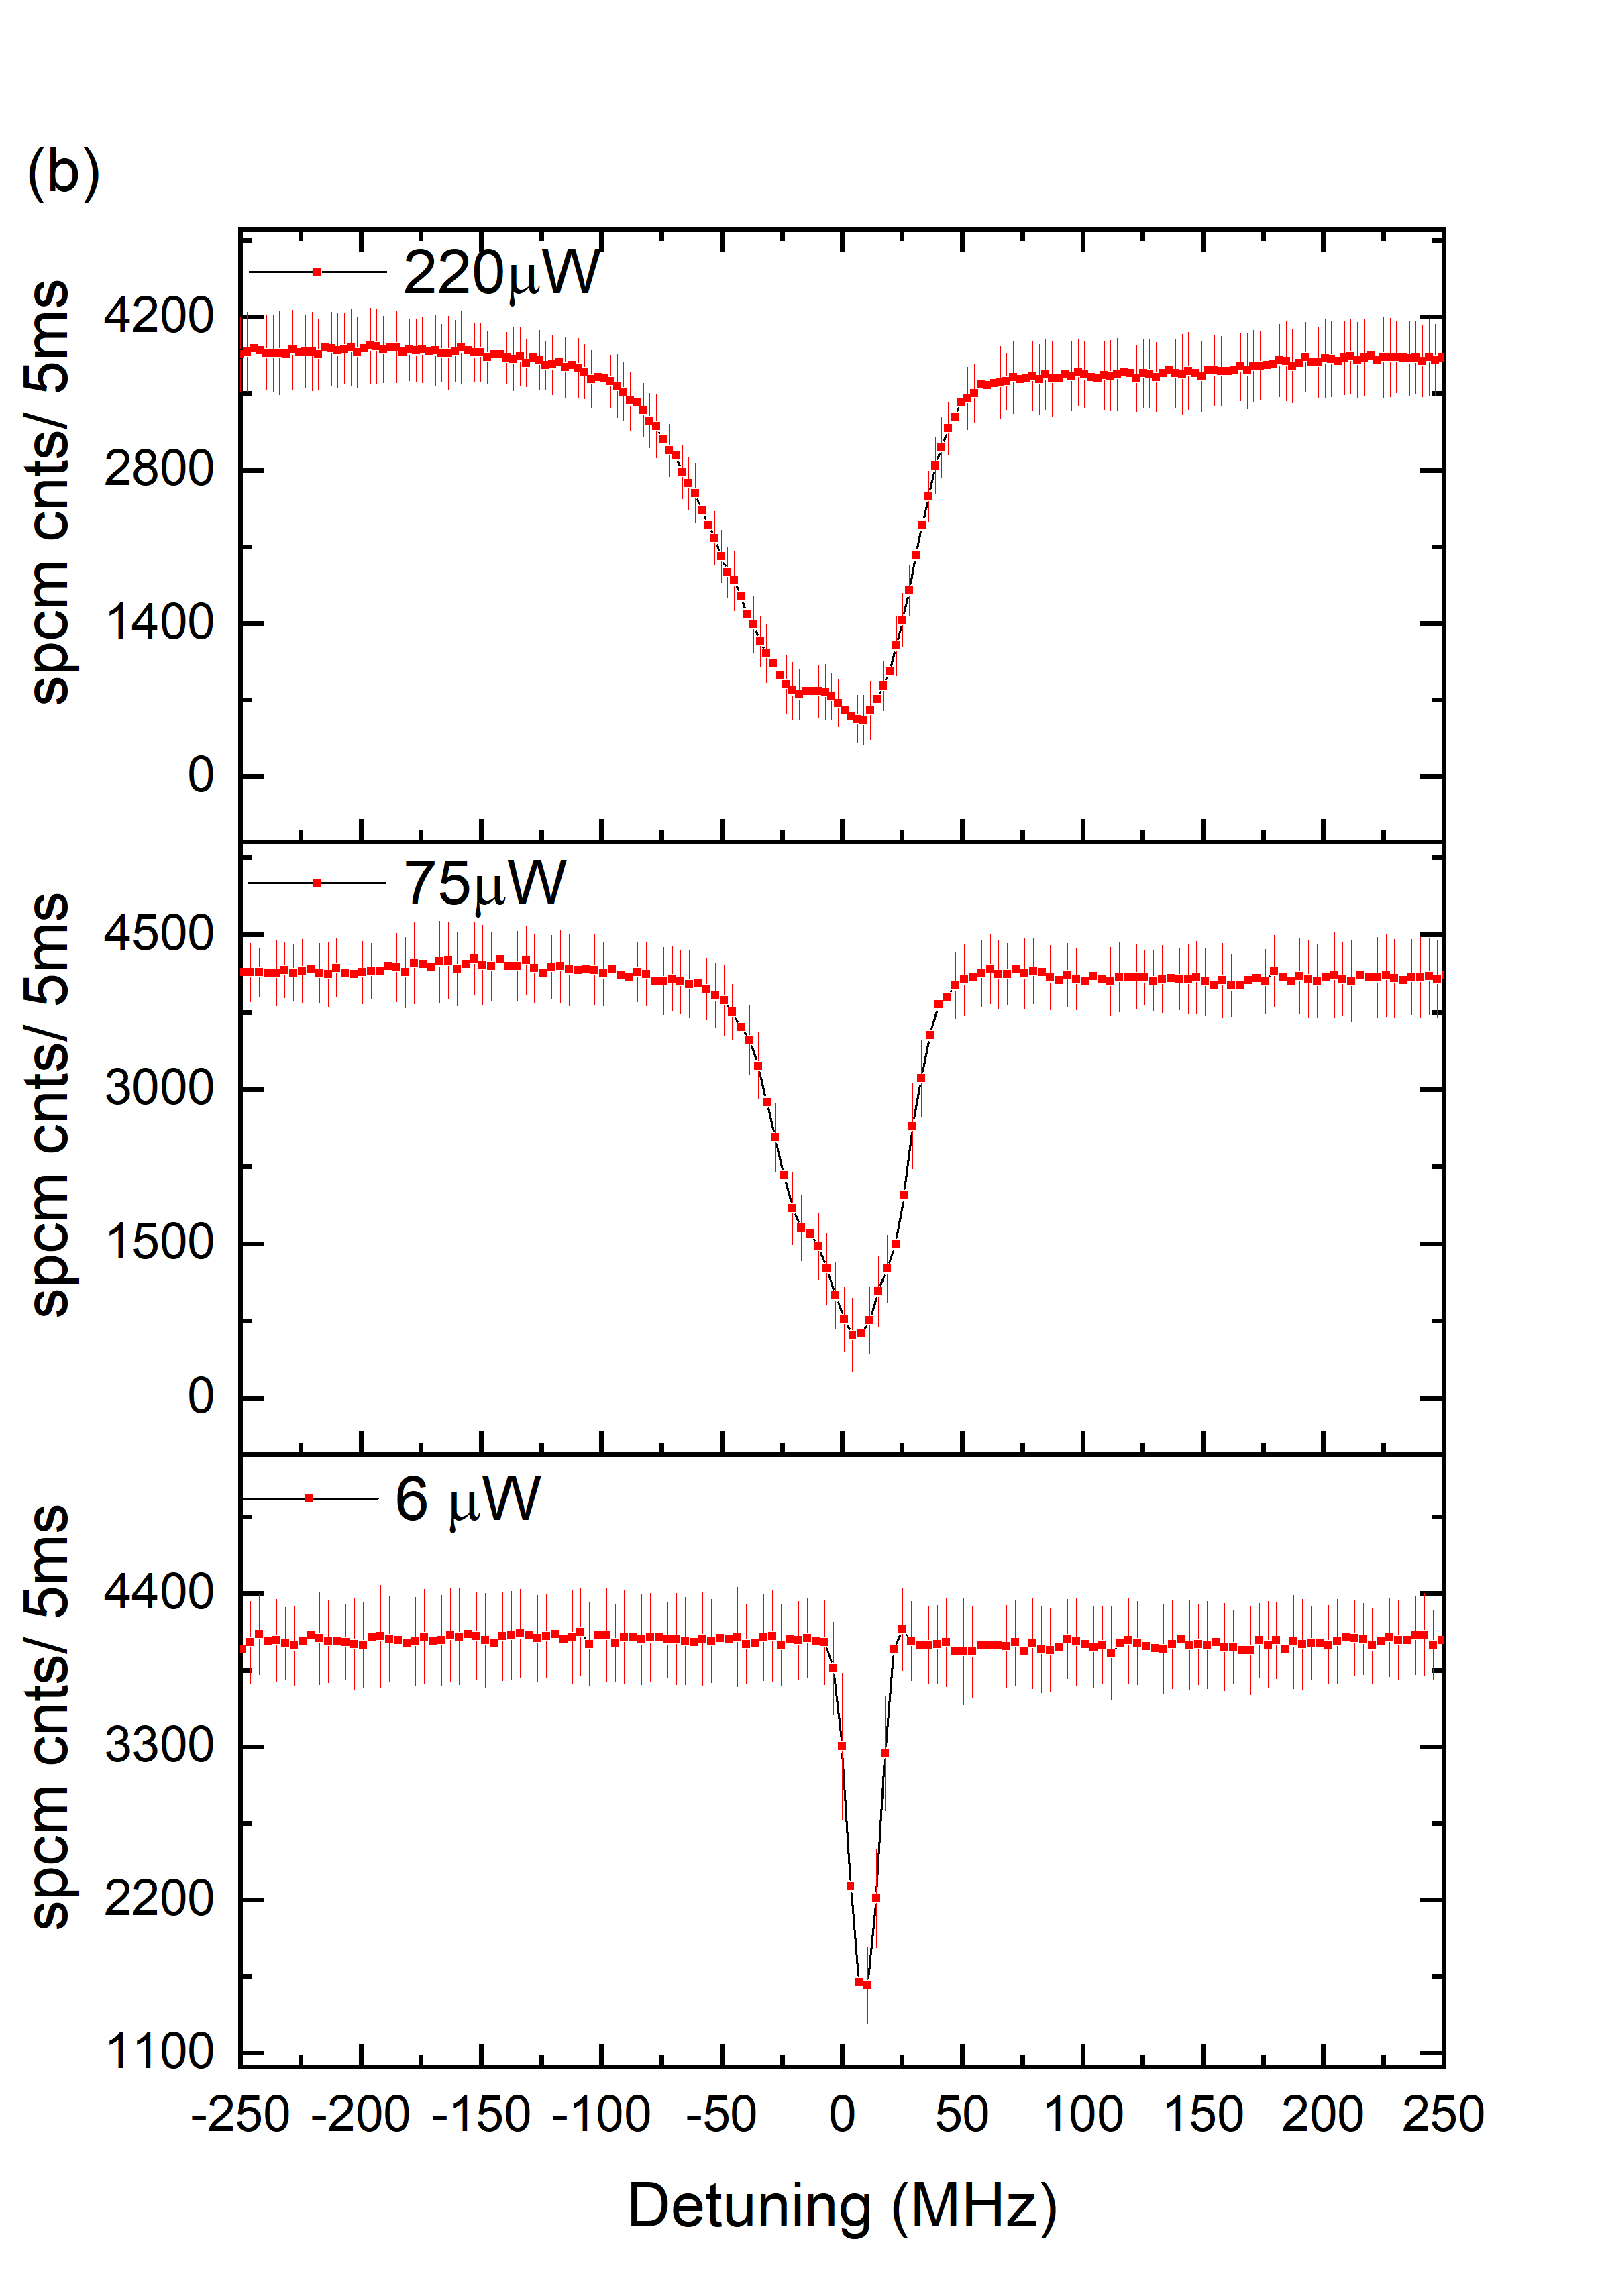
Finally, in Fig. 6, the fluorescence signal at 795 nm for different 993 nm powers, in the absence of cooling beams, is plotted. Similar to the results presented in the top panels of Fig. 4(a) and (b), we observe a two-peak profile and the dip becomes more pronounced as the 993 nm power is increased.
3.2 One-photon excitation
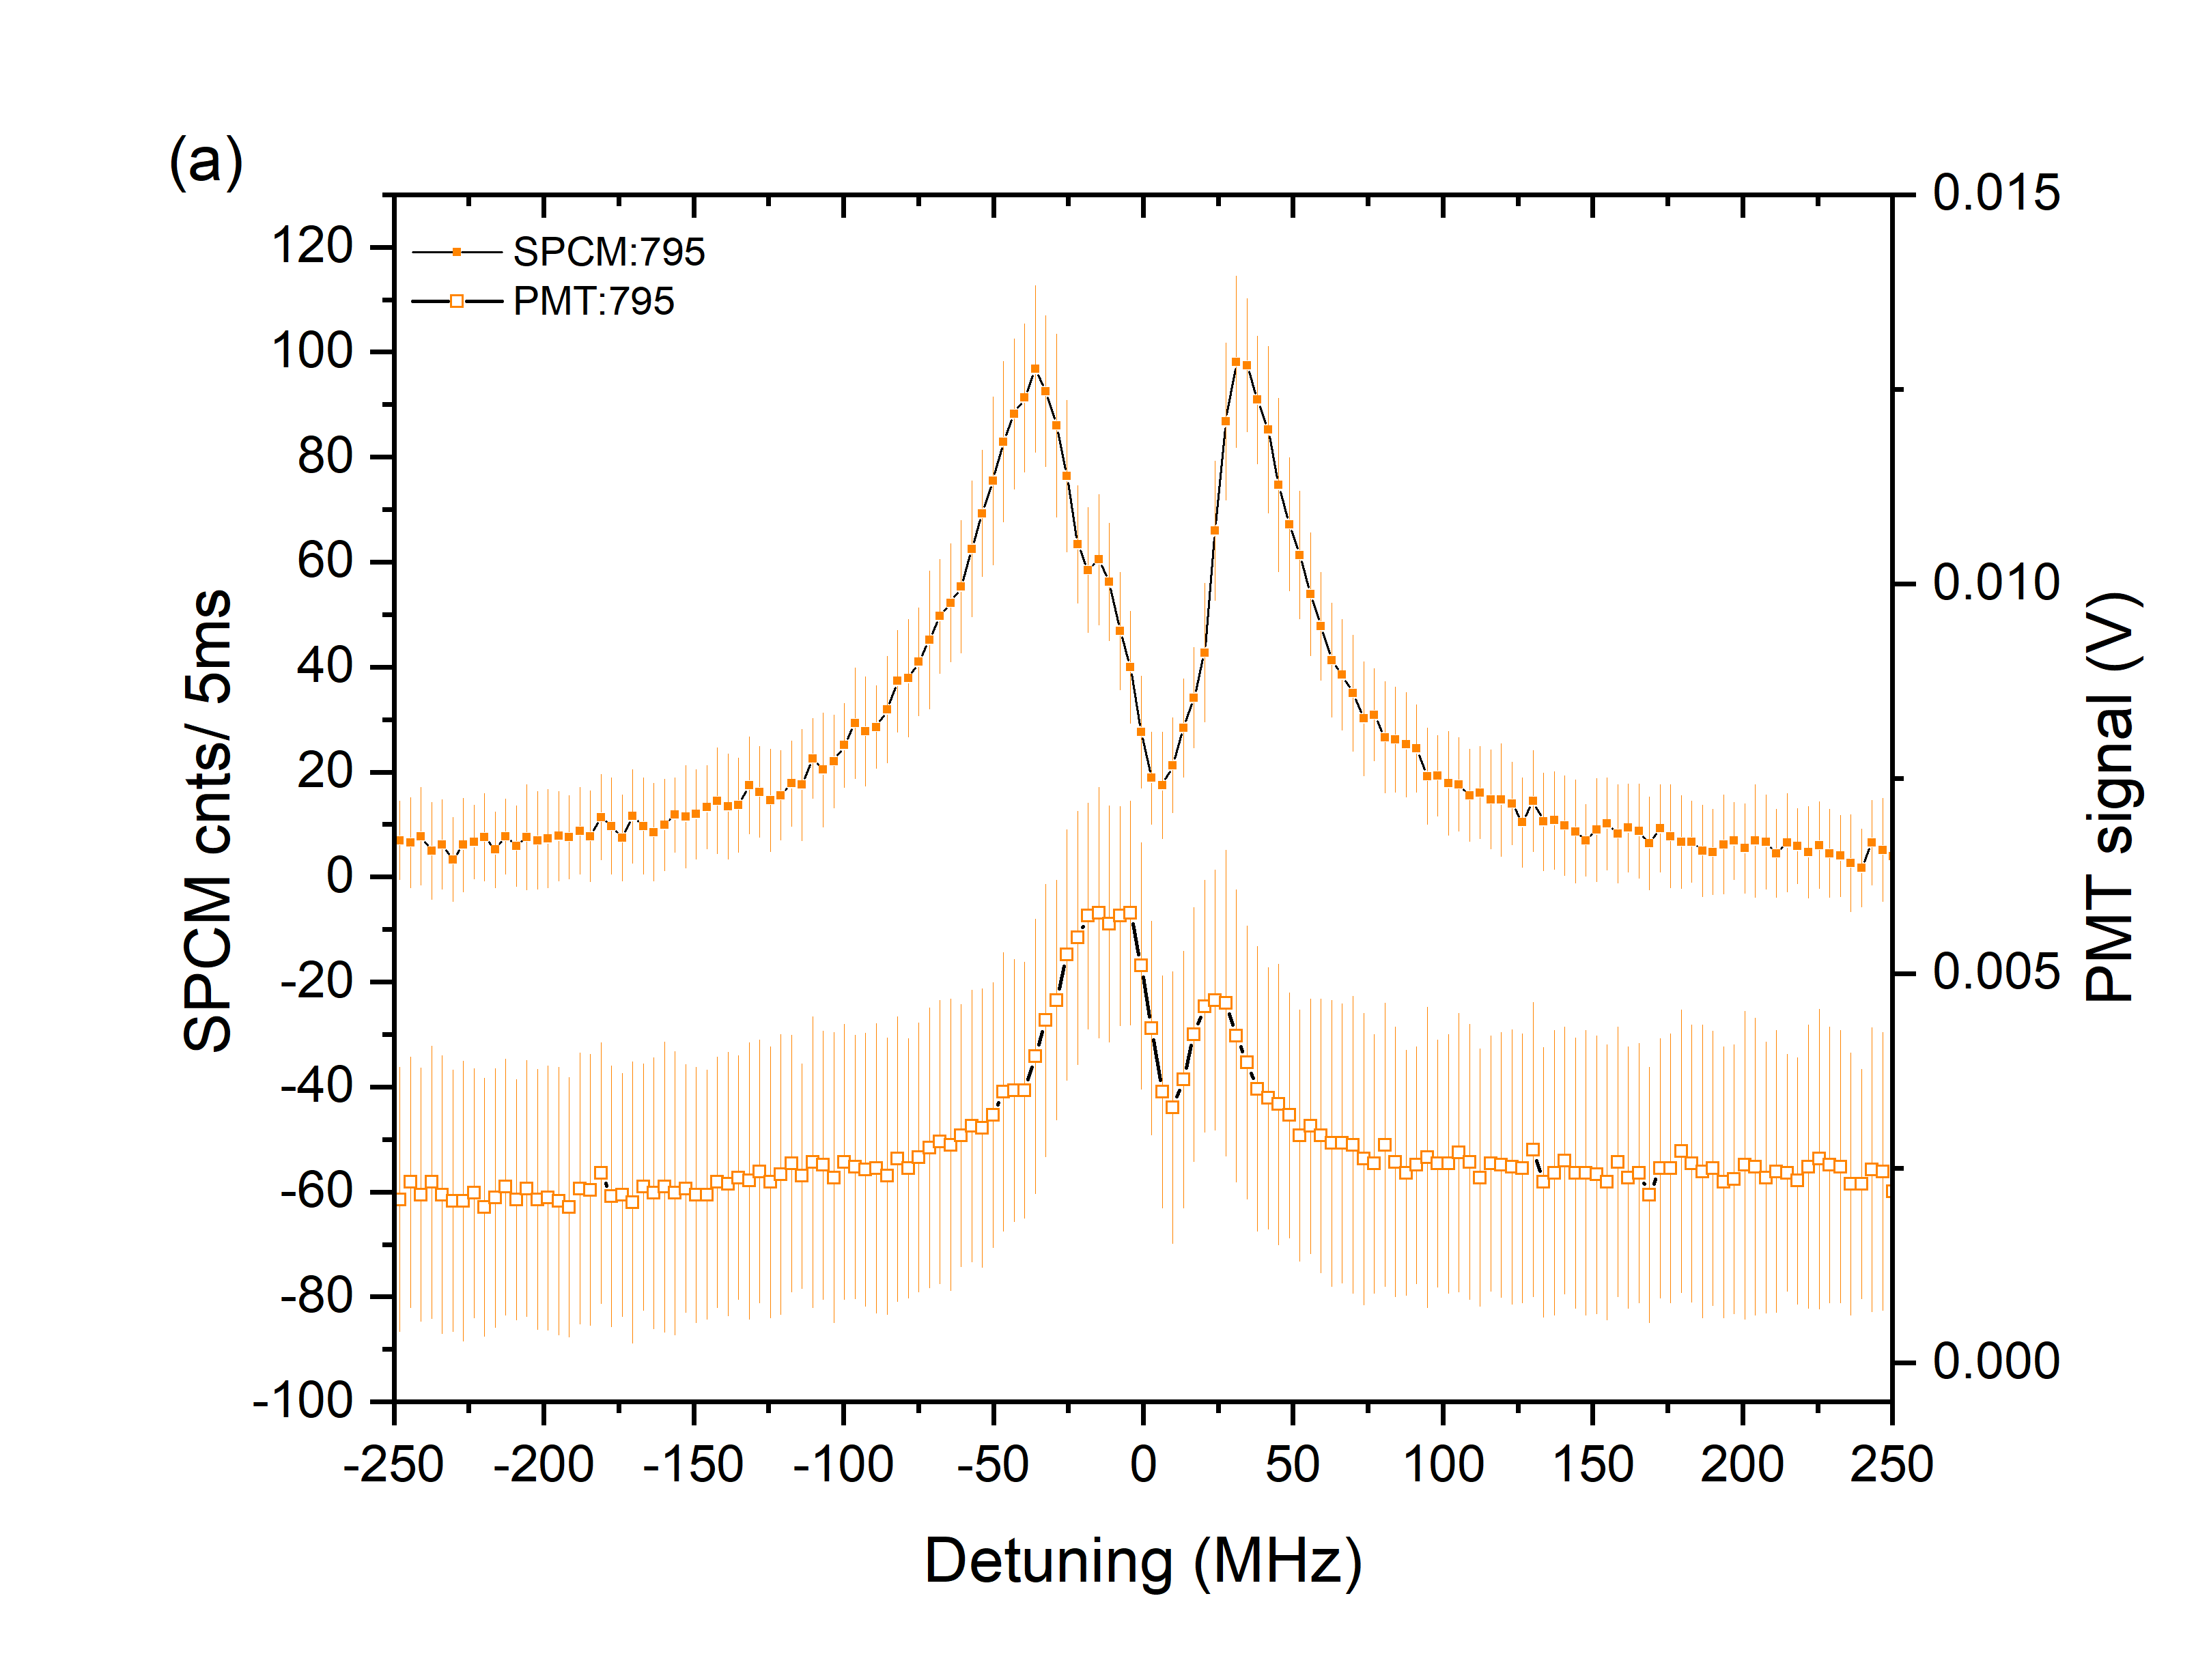
The intriguing two-peak profiles observed in the two-photon excitation experiments were investigated by comparing the results with two different, one-photon excitation configurations, discussed in the following. The first configuration was when the atom cloud surrounded the optical nanofibre. Atoms in the MOT were excited from 5S1/2 F=2 to 5P1/2 F′=2 via a focussed 795 nm light in free-space. Emitted fluorescence photons at 795 nm and 780 nm, which coupled into the ONF, were detected via the SPCM, see Fig. 3(\romannum1). The observed spectra are shown in Fig. 7(a) and (b) where detuning is defined as the laser frequency minus the atomic transition frequency for 5S1/2 F=2 5P1/2 F′=2. The fluorescence at 795 nm, see Fig. 7(a), exhibits two dominant peaks (P1 and P2) and a dip (D1) as the 795 nm excitation laser was detuned from resonance. The spectra also show a small dip (D2) and a peak (P3). Peak P2 becomes more prominent as the 795 nm excitation power is increased and P1, P2 and D1 become broader, see Fig. 7(a). Fluorescence was also measured at the PMT without being coupled to the ONF, see Fig. 3(\romannum1) for the experimental setup. When we compare the fluorescence signals measured at the PMT and the SPCM, see Fig. 8(a), we observe that the PMT signal is narrower and shows a dip at the same position as the SPCM signal. These observations show that, similar to the two-photon excitation scenario, here also the two peaks, P1 and P2, move apart or the dip, D1, becomes broader as the excitation power is increased.
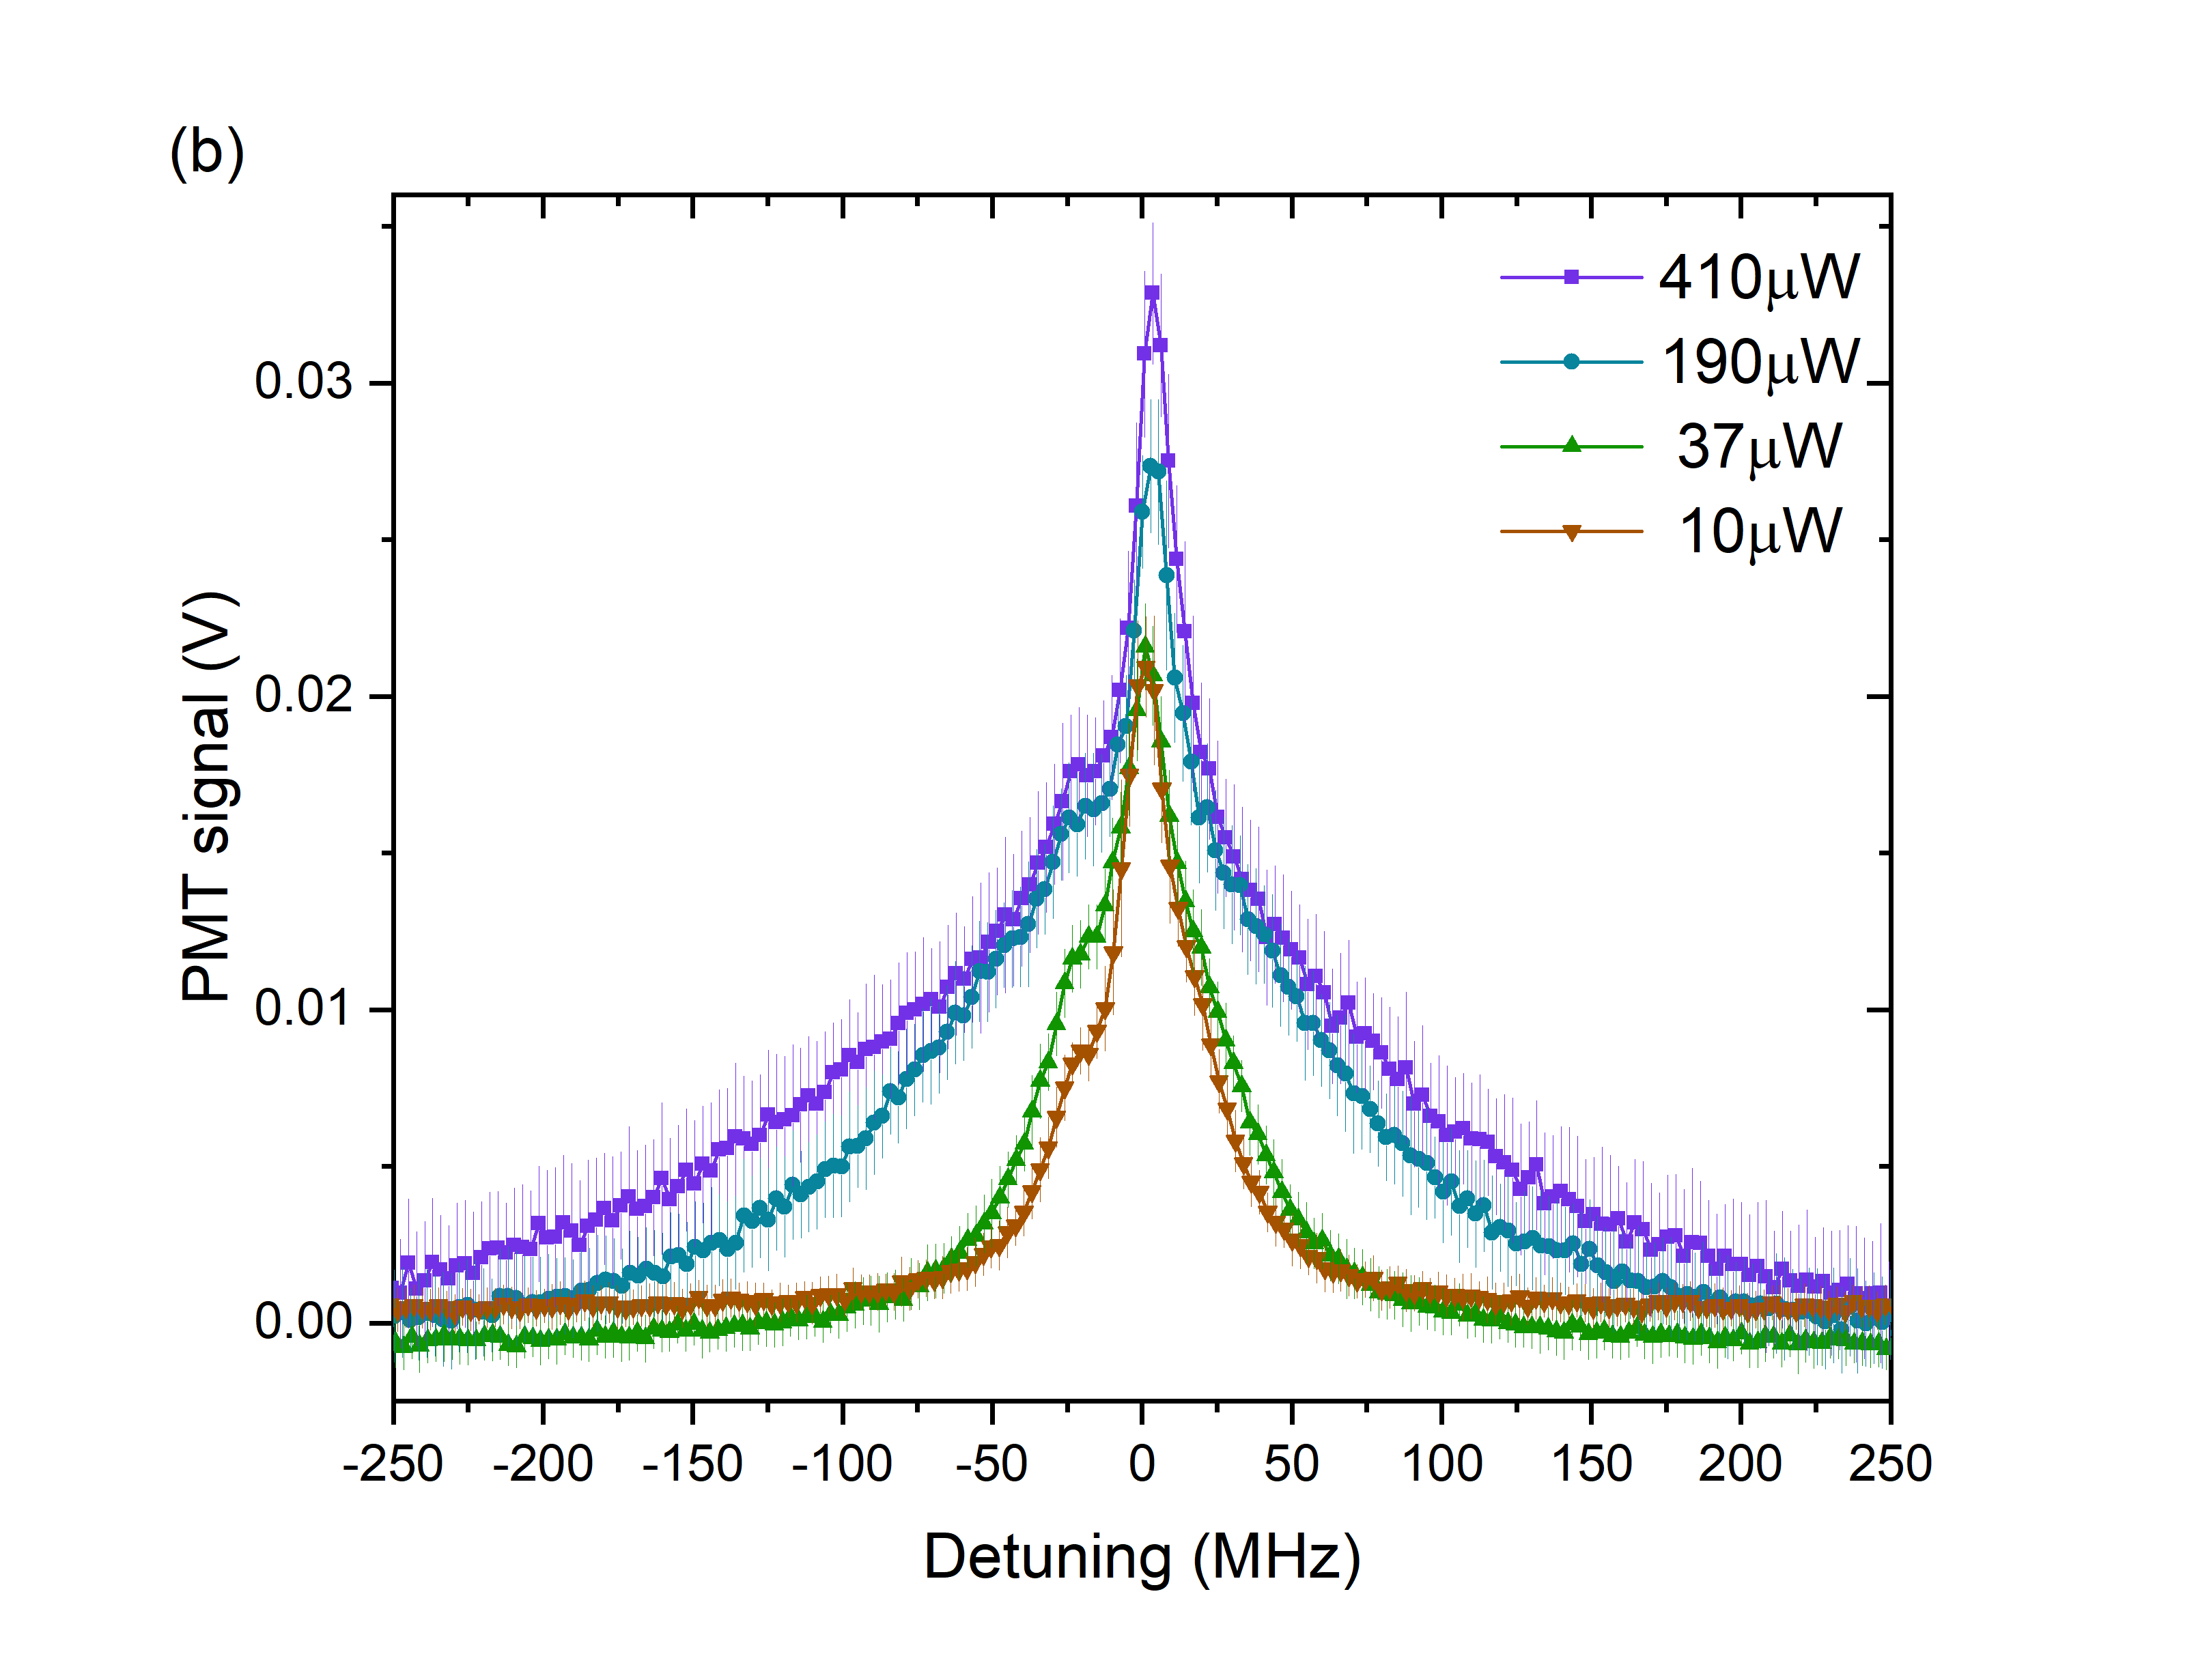
The second one-photon configuration we considered was when the cold atom cloud was distant from the ONF, see Fig. 3(\romannum2) for the setup, to ensure that there was no coupling of the fluorescence signal into the nanofibre. In this case, the fluorescence signal at 795 nm as a function of the excitation laser detuning from 5S1/2 F=2 5P1/2 F′=2 transition, see Fig. 1(b), was collected by the PMT. In Fig. 8 (b), the fluorescence signal at 795 nm while varying the 795 nm excitation laser frequency is plotted for different excitation powers. Even at higher powers (410 W) a second peak does not appear in the spectra. Additionally, the observed fluorescence profile is not Lorentzian.
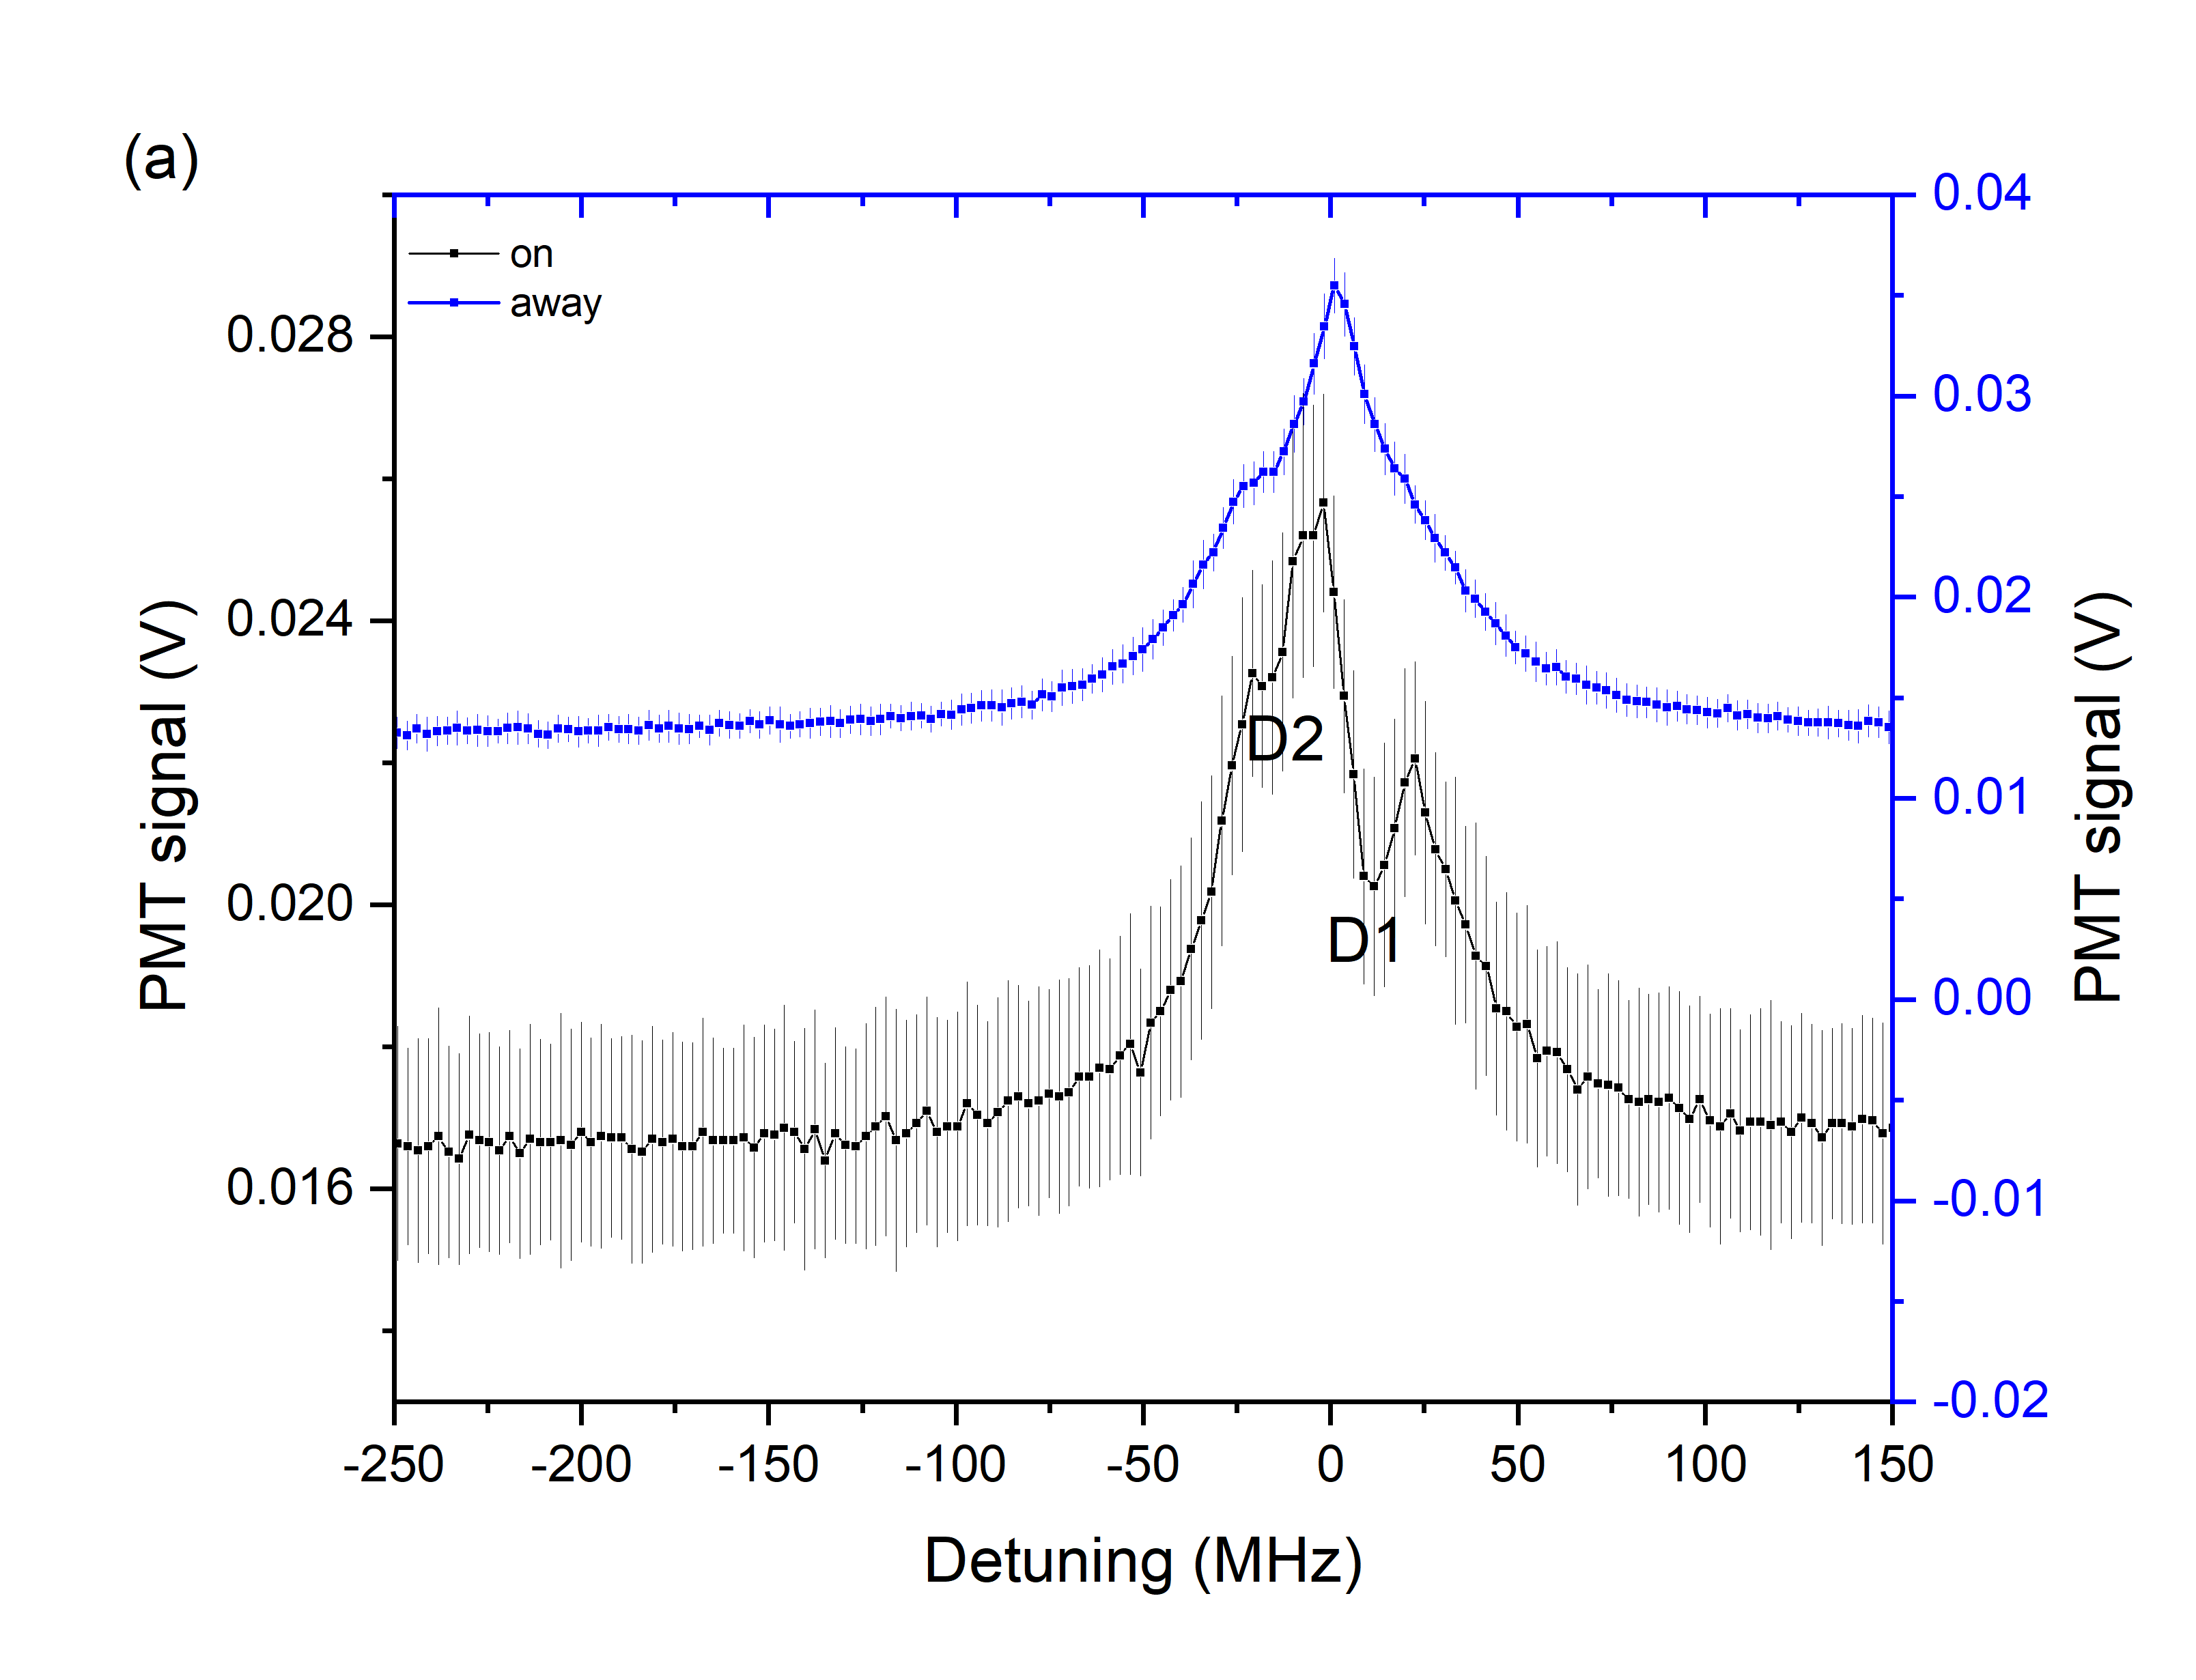
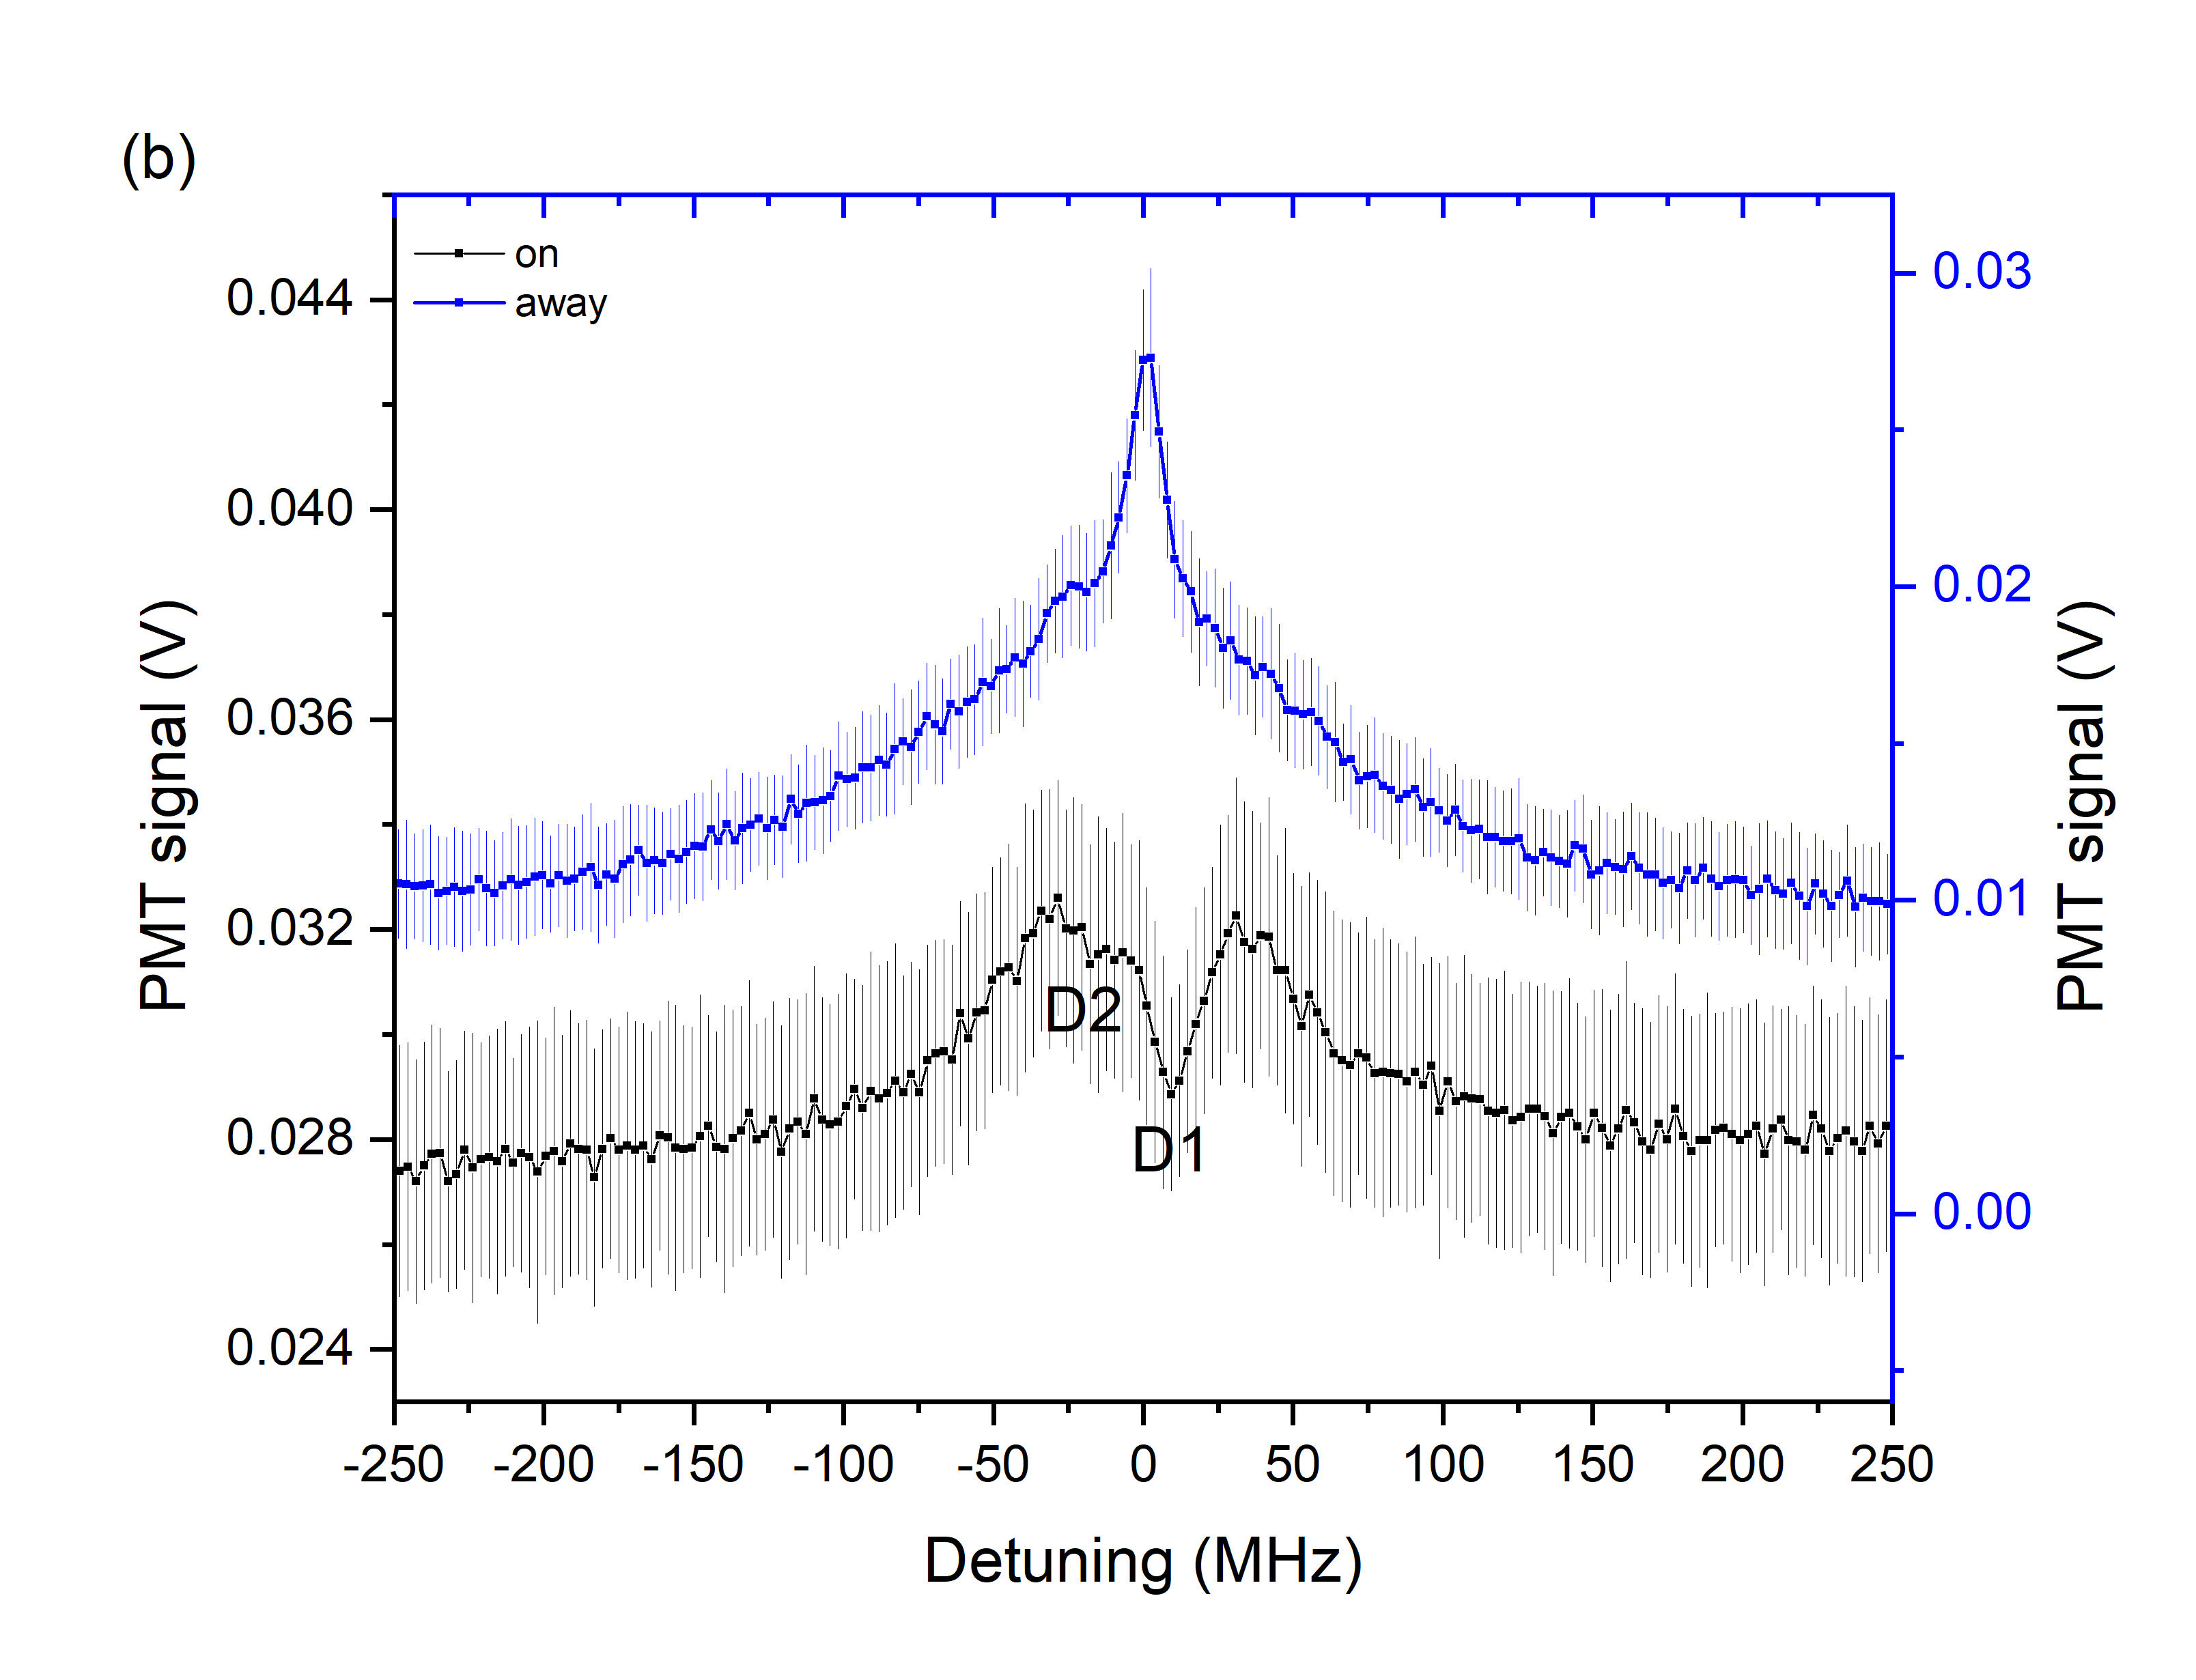
Finally, to compare the observed spectra when the atom cloud overlaps the ONF and when the cloud is removed from the ONF, we measured the 795 nm fluorescence signals for the same excitation powers. The results are plotted in Fig. 9 for two different excitation powers and show the striking contrast between the two cases. Notably, the two-peak profile is present only when both the cold atom cloud and the focussed, strong excitation beam are at the ONF. In both these cases, the 795 nm excitation light was focussed at the atom cloud via the lens.
4 Discussion
Results show that, for both one- and two-photon excitation processes near an ONF, high intensities of the evanescent field produce a two-peak profile in the fluorescence signal as a function of laser detuning. The similarity of the profiles in the two cases suggests that the origin is not linked with any process specific to the one- or two-photon excitation phenomena. To better understand the observed structure, we considered the feasibility of the shape arising from certain phenomena to hypothesise on the exact origin.
As a first line of investigation, we considered whether the lineshape could arise from interference. Subnatural linewidth spectral lines have already been investigated theoretically and experimentally both in V-type and -type atomic systems in the presence of two laser fields [23, 24]. Quantum interference between the two transition pathways plays a crucial role in producing such narrow spectral features. Interference can also be present when monochromatic light couples a single atomic ground state to two closely spaced excited states by parallel dipole moments. At an appropriate frequency of the excitation laser field, fluorescence from the excited levels can be eliminated [25]. However, the condition of parallel dipole moments cannot be fulfilled when considering two closely spaced Zeeman sublevels of a particular hyperfine state, hence making it nontrivial to achieve. It has also been proposed that anisotropy of the vacuum field could provide the necessary condition for quantum interference among closely lying states [26]. Since the two observed peaks are far-separated even at zero magnetic field, we rule out this possibility. In summary, interference cannot give a satisfactory answer for the origin of the two-peak profile.
Another possibility we considered was that of Autler-Townes splitting [19] caused by the strong laser cooling beams; however, we have also ruled this out because the splitting is present even in the absence of the cooling beams and theoretical models do not support this possibility.
We propose that the actual phenomenon is far simpler than initially assumed. The observed spectra can be explained by considering the pushing effect of the excitation light, i.e., 993 nm or 795 nm laser light, on the atoms. As the light frequency approaches the atomic resonance, the photon absorption rate increases. Atoms in the highest intensity region are pushed away maximally due to momentum kicks given by the photons. This leads to a reduced atom density locally and, thereby, reduced fluorescence. In addition, we also need to consider that the atomic resonance or the resonant transition frequency in a MOT is modified due to the ac Stark effect of the cooling beams. These new resonance frequencies will be referred henceforth as the modified resonances. The experiments in the absence of cooling beams also nitially relied on having a MOT, i.e., cooling light, in the presence of a frequency-locked excitation beam passing through the ONF (see Subsection 2.2.2). Due to the aforementioned pushing effect, the initial atom number near the ONF depends on the excitation frequency and is not the same for each frequency step during the scan. This leads to low fluorescence whenever the frequency of the excitation light matches to the modified resonances, even though fluorescence was collected in the absence of the cooling beams. In the following, to understand the frequency values or positions of the modified resonances, we consider the ac Stark effect of the cooling beams on both the ground (5S1/2 F=2) and the excited (5P3/2 F′=3) states of an 87Rb atom. The new energy eigenstates can be calculated using the dressed atom picture [1].
To compare with the bare atom energy states, we consider the specific case of a red-detuned light field, such as the MOT cooling beams in our experiments. In this case, both the ground and the excited states split into two dressed states. The two dressed ground states are shifted in frequency by and w.r.t. the bare atom ground state. Similarly, the excited dressed states are shifted by and w.r.t. the bare atom excited state. Here, is the cooling beam detuning, = , and is the on-resonant Rabi frequency due to the cooling beams. In the limit of high detunings, the ground state shifts can be approximated as and . Dressed atom spectroscopy has been investigated in detail by several groups earlier, see [27, 28]
Thus, as the frequency of the excitation laser is scanned (during the one- or two-photon excitation) within a MOT, there are two possible resonances, namely excited state ( resonance) and excited state ( resonance). In the one-photon excitation, see Fig. 7(a), we observe that the larger (D1) and smaller dips (D2) in the 795 nm fluorescence signal are approximately at the frequencies of the and resonances. From this, we speculate that the dip, which is shifted by a few MHz from the 5S1/2 F=2 5P1/2 F′=2 resonance, is due to the pushing of the atoms occurring at the resonance. The pushing effect at the resonance appears much smaller than that at .
The pushing effect is much more significant when atoms are near the ONF, probably since the field intensity is much higher and there is much more light scattering in this region. Both for the one- and two-photon excitation processes, the broad fluorescence profile with a relatively narrower dip is due to a varying power broadening and a varying pushing effect in the evanescent field due to its exponential profile. We emphasise that the two-peak profile is observed only for the excitation of atoms near a fibre surface. When the detection is also via the nanofibre, the dip is more pronounced and broader. This may be due to higher scattering and pushing near the fibre surface and probing it efficiently via the nanofibre itself. In contrast, when atoms are far away from the ONF, detection is done using a PMT which gives the collective signal from the MOT. We observe a small dip at -14MHz but the positive side dip (D1) is not visible, see the PMT signals in Fig. 9(a) and (b).
During these studies, we came to know that a similar spectrum has been observed with Cs atoms in a MOT near an optical nanofibre [17, 29] where the authors did the following experiments. For a single-atom condition near the ONF, a probe laser in a travelling wave configuration was focussed perpendicular to the fibre axis. Fluorescence collected from the ONF showed a sharp dip (narrower than the natural linewidth) as the probe frequency was scanned across the resonance. The authors speculated that the effect arose from the shifting of the MOT centre due to pushing by the probe beam, thereby changing the local density of the atom cloud. Another hypothesis for the observed spectrum was quantum interference and the result was attributed to atom trapping with motional quantisation [30]. Our results support the former hypothesis though our results are neither limited to the single-atom condition nor one-photon excitation. Additionally, our studies show that this effect is present when light propagates through the nanofibre either in a travelling wave or counter-propagating configuration.
5 Conclusion
We have experimentally investigated the origin of the two-peak profile of a fluorescence signal when intense, single-frequency two-photon excitation light interacts with cold atoms near an optical nanofibre. To understand the origin of this profile, we performed experiments using one-photon excitation for atoms both near and far from the nanofibre. Observations indicate that a similar profile is present when one-photon excitation is performed near the ONF. We speculate that, at higher excitation powers, resonance scattering induced pushing near the nanofibre becomes the dominant effect. This sharply depletes the atom number density, giving rise to a dip in the fluorescence. The frequency position of the resonance is modified due to the laser cooling beams; hence, the dip is slightly shifted from the bare atom resonance. This hypothesis also explains the similarity of profiles obtained in the presence and absence of cooling beams during two-photon excitation. This is due to pushing, or loss, of the atoms in a MOT, resulting in a lower initial atom number in the molasses phase. The dip is also observed in the molasses phase. These observations are crucial for near-resonant, high-intensity experiments based on the cold atom-nanofibre platform in order to better understand the spectral profiles obtained.
References
References
- [1] Cohen-Tannoudji C, Dupont-Roc J and Grynberg G 1998 Atom-Photon Interactions: Basic Processes and Applications (Wiley-VCH)
- [2] Agarwal G S 2012 Quantum Optics (Cambridge University Press)
- [3] Fleischhauer M, Imamoglu A and Marangos J P 2005 Rev. Mod. Phys. 77(2) 633–673
- [4] Fulton D J, Shepherd S, Moseley R R, Sinclair B D and Dunn M H 1995 Phys. Rev. A 52(3) 2302–2311
- [5] Kumar R, Gokhroo V and Nic Chormaic S 2015 New J. Phys. 17 123012
- [6] Goban A, Choi K S, Alton D J, Ding D, Lacroûte C, Pototschnig M, Thiele T, Stern N P and Kimble H J 2012 Phys. Rev. Lett. 109 033603
- [7] Lee J, Grover J A, Hoffman J E, Orozco L A and Rolston S L 2015 J. Phys. B: At. Mol. Opt. Phys. 48 165004
- [8] Nieddu T, Gokhroo V and Nic Chormaic S 2016 J. Opt. 18 053001
- [9] Le Kien F, Nic Chormaic S and Busch T 2021 Phys. Rev. A 103
- [10] Gupta R K, Everett J L, Tranter A D, Henke R, Gokhroo V, Lam P K and Nic Chormaic S 2021 Machine learner optimization of optical nanofiber-based dipole traps for cold 87Rb atoms (Preprint 2110.03931)
- [11] Ray T, Gupta R K, Gokhroo V, Everett J L, Nieddu T, Subramonian Rajasree K and Nic Chormaic S 2020 New J. Phys 22 062001
- [12] Hinney J, Prasad A S, Mahmoodian S, Hammerer K, Rauschenbeutel A, Schneeweiss P, Volz J and Schemmer M 2021 Phys. Rev. Lett. 127 123602
- [13] Subramonian Rajasree K, Gupta R K, Gokhroo V, Le Kien F, Nieddu T, Ray T, Nic Chormaic S and Tkachenko G 2020 Phys. Rev. Research 2 033341
- [14] Le Kien F, Dutta Gupta S, Balykin V I and Hakuta K 2005 Phys. Rev. A 72 032509
- [15] Sagué G, Vetsch E, Alt W, Meschede D and Rauschenbeutel A 2007 Phys. Rev. Lett. 99(16) 163602
- [16] Nayak K P, Melentiev P N, Morinaga M, Kien F L, Balykin V I and Hakuta K 2007 Opt. Express 15 5431–5438
- [17] Nayak K and Hakuta K 2008 New J. Phys. 10 053003
- [18] Ward J M, Maimaiti A, Le V H and Nic Chormaic S 2014 Rev. Sci. Instrum. 85 111501
- [19] Kumar R, Gokhroo V, Deasy K and Nic Chormaic S 2015 Phys. Rev. A 91 053842
- [20] Safronova M S and Safronova U I 2011 Phys. Rev. A 83 052508
- [21] Nieddu T, Ray T, Rajasree K S, Roy R and Nic Chormaic S 2019 Opt. Express 27 6528–6535
- [22] Russell L, Gleeson D A, Minogin V G and Nic Chormaic S 2009 J. Phys. B: At. Mol. Opt. Phys 42 185006
- [23] Zibrov A S, Lukin M D, Nikonov D E, Hollberg L, Scully M O, Velichansky V L and Robinson H G 1995 Phys. Rev. Lett. 75 1499–1502
- [24] Hopkins S, Usadi E, Chen H and Durrant A 1997 Opt. Commun. 138 185–192
- [25] Cardimona D A, Raymer M G and Stroud C R 1982 J. Phys. B: At. Mol. Phys. 15 55–64
- [26] Agarwal G 2000 Phys. Rev. Lett. 84 5500–3
- [27] Mitsunaga M, Mukai T, Watanabe K and Mukai T 1996 J. Opt. Soc. Am. B 13 2696–2700
- [28] Wu F Y, Ezekiel S, Ducloy M and Mollow B R 1977 Phys. Rev. Lett. 38 1077–1080
- [29] Nayak K P 2009 Single photon generation and spectroscopy using quantum dots on optical nanofibers Ph.D. thesis University of Electro-Communications, Tokyo Japan
- [30] Hakuta K 2008 Single atoms on an optical nanofiber: a novel work system for slow light Advances in Slow and Fast Light vol 6904 ed Shahriar S M, Hemmer P R and Lowell J R International Society for Optics and Photonics (SPIE) pp 19 – 23