PULSE PEAK MIGRATION DURING THE OUTBURST DECAY
OF THE MAGNETAR SGR 18300645:
CRUSTAL MOTION AND MAGNETOSPHERIC UNTWISTING
Abstract
Magnetars, isolated neutron stars with magnetic field strengths typically G, exhibit distinctive months-long outburst epochs during which strong evolution of soft X-ray pulse profiles, along with nonthermal magnetospheric emission components, is often observed. Using near-daily NICER observations of the magnetar SGR 1830-0645 during the first 37 days of a recent outburst decay, a pulse peak migration in phase is clearly observed, transforming the pulse shape from an initially triple-peaked to a single-peaked profile. Such peak merging has not been seen before for a magnetar. Our high-resolution phase-resolved spectroscopic analysis reveals no significant evolution of temperature despite the complex initial pulse shape. Yet the inferred surface hot spots shrink during the peak migration and outburst decay. We suggest two possible origins for this evolution. For internal heating of the surface, tectonic motion of the crust may be its underlying cause. The inferred speed of this crustal motion is m day-1, constraining the density of the driving region to g cm-3, at a depth of m. Alternatively, the hot spots could be heated by particle bombardment from a twisted magnetosphere possessing flux tubes or ropes, somewhat resembling solar coronal loops, that untwist and dissipate on the 30-40 day timescale. The peak migration may then be due to a combination of field-line footpoint motion (necessarily driven by crustal motion) and evolving surface radiation beaming. These novel dataset paints a vivid picture of the dynamics associated with magnetar outbursts, yet it also highlights the need for a more generic theoretical picture where magnetosphere and crust are considered in tandem.
1 Introduction
Magnetar outburst epochs start with an increase of the quiescent X-ray flux by as many as three orders of magnitude, accompanied by drastic spectral changes to the neutron star’s surface thermal and magnetospheric emission, as well as strong temporal variability in the form of timing noise, glitch activity, and altered pulse shape (e.g., Woods et al. 2004; Gavriil et al. 2006; Rea et al. 2009; Israel et al. 2010; Esposito et al. 2010; Gavriil et al. 2011; Scholz et al. 2014; Hu et al. 2020). The outbursts last anywhere from months to years during which the source properties typically return back to their initial state (Coti Zelati et al. 2018, but also see Younes et al. 2017a; Coti Zelati et al. 2020). Given these variability patterns, outburst epochs are thus distinctly revealing of a magnetar’s highly dynamic magnetosphere and its interplay with the surface thermal emission, both of which are governed by the decay of the super-critical internal and external B-fields (e.g., Thompson & Duncan 1995, 1996; Viganò et al. 2013).
SGR 18300645 was discovered on 2020 October 10 after a short, soft burst from its direction was detected with the Swift/BAT instrument (Page et al. 2020). Subsequent dedicated X-ray campaigns revealed the presence of a bright X-ray source with rotational properties consistent with the bulk of the magnetar family; a rotational frequency Hz undergoing a spin down at a rate of Hz s-1 (Coti Zelati et al. 2021, Younes et al. 2021, accepted, hereinafter Y21), implying a dipole field strength G at the equator and a spin-down age of 24.3 kyr. In the several months following the source discovery, its soft X-ray flux decreased by a factor 6 due to the shrinkage of the total emitting area (Y21)
In this paper, we present a study of the thermal pulse shape temporal evolution of SGR 18300645 as observed with NICER. We also perform the most detailed phase-resolved spectroscopic analysis of the soft thermal surface emission of any magnetar to date. The following section summarizes the observations and data reduction. Section 3 describes the analysis and presents the results of our campaign. We conclude in Section 4 with a discussion on the implications of the surface heat-map of this magnetar as well as the role of the crust in triggering the outburst in SGR 18300645 and perhaps in the magnetar population as a whole.
2 Observations and data reduction
NICER observed SGR 18300645 with almost daily cadence since its discovery on 2020 October 10 and up to 2020 November 17, after which the source was sun-constrained (i.e., too close to the Sun) and could not be observed. NICER restarted its monitoring campaign on 2021 February 10 with weekly observations. The details of these observations, their temporal and phase-averaged spectroscopic analyses, the burst analysis, as well as radio non-detection limits of the source are detailed in Y21. In this Letter, we focus on the phase-resolved spectroscopic analysis as well as pulse-shape temporal evolution during the first 37 days of the outburst. The near-daily cadence has allowed us to track the temporal evolution of these two elements with unprecedented detail. We complement our analysis with the data stretching from 2021 February to May for comparison purposes.
For any pulse and phase-resolved analysis we present in this Letter, we utilize the phase-coherent timing solution presented in Y21. The spectral analysis is performed using Xspec version 12.11.0m (Arnaud 1996) in the energy range 0.8–7 keV. We group all spectra to have 5 counts per bin. We determine the background spectra for each observation using the nibackgen3C50 method; we added a conservative 20% systematic uncertainty to the estimated background number counts per NICER energy channel (Remillard et al. 2021). We derive best-fit model parameters and their associated uncertainties utilizing the pgstat statistic, which is valid for the case of Poisson distributed data with background having a Gaussian distributed uncertainties, as is the case for NICER. We quote all uncertainties at the confidence level, unless otherwise noted.
3 Results

3.1 Pulse-shape evolution
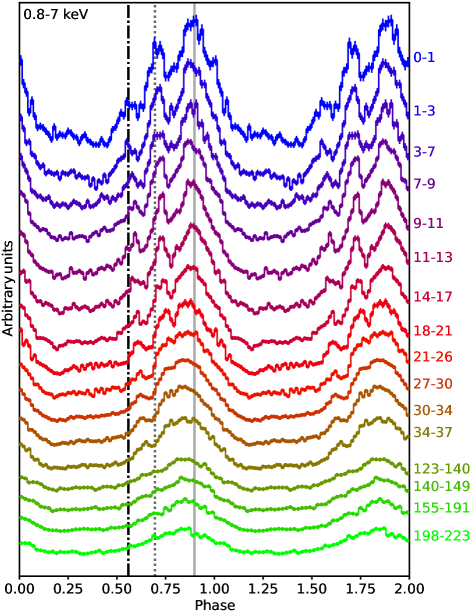
Figure 1 shows the 0.8-7 keV folded pulse profiles (two rotational cycles are plotted for clarity) at distinct epochs from source discovery, averaged over one to several days. At the early stages of the outburst, the profile is markedly triple-peaked, yet, with a clear phase shift in each pulse-peak (Y21). We resort to simple Gaussian fits to the pulse profiles to identify the centroid of each peak at different epochs. For this, we group each profile to have 150 phase bins, ensuring a minimum number of 50 counts in each. We utilize maximum-likelihood estimation to derive the best-fit model to the data, which were assumed to be Gaussian distributed. The goodness of fit is assessed from the statistics. We obtained uncertainties on the best-fit parameters by using the Markov Chain Monte Carlo sampler emcee (Foreman-Mackey et al. 2013) and assuming flat priors. Finally, we model the pulse profiles with to ensure that none of the apparent main pulses fall at the edge of our fitting parameter space.
We start by fitting the pulse profile averaged over the first day of the outburst with an increasing number of Gaussian components (plus a constant, non-pulsed component) up to the term deemed statistically significant at the confidence level through an F-test. We find that a model consisting of four Gaussians is sufficient to describe the data with a reduced of 1.27 for 137 degrees of freedom (dof); adding a fifth does not improve the quality of the fit. The left panel of Figure 2 shows this best-fit model along with the residuals in terms of . The three peaks are well sampled with the Gaussian curves, while a fourth, low-amplitude one, is required to fit the off-pulse part of the profile. In Figure 1, we display the Gaussian centroids of these three main pulses, to which we refer, hereafter, as peak 1, peak 2, and peak 3 in ascending phase order.
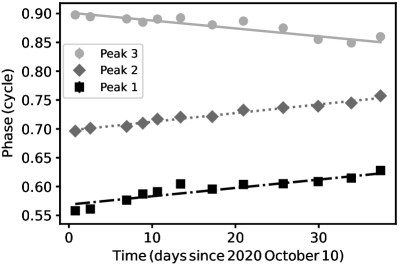
Subsequently, we fit the rest of the pulse profiles shown in Figure 1 up to day 37 with the same model, which resulted in a statistically acceptable fit for each case (). The right panel of Figure 2 presents the temporal evolution of the Gaussian centroids for the three main peaks, along with their best-fit linear trends. We find that peak 1, peak 2, and peak 3 are shifting at a rate of , , and cycle day-1, implying that the shift is occurring to simplify the pulse shape via the merging of the different peaks.
This rate of motion projected on the sky translates to a speed m day-1 assuming the motion is occurring along the orthodrome and a star radius of km. This estimate ignores gravitational light-bending, and other elements, such as reprocessing of the soft thermal emission in the highly magnetized atmosphere and the exact shape of the emitting regions. Fitting each profile with physically-motivated models is beyond the scope of the paper. Yet, the latter two elements will not have a strong impact on the centroid of each pulse peak but more so on their wings (van Adelsberg & Lai 2006; Taverna et al. 2020; Barchas et al. 2021), while gravitational light-bending tends to slightly increase the visible area over which the motion is occurring. Hence, this projected speed should be considered an order-of-magnitude estimate. We discuss these results in detail in Section 4.
3.2 Phase-resolved spectroscopy
We perform our phase-resolved spectroscopic analysis for each of the pulse profiles presented in Figure 1, grouped to 50 (20 for the post-Sun-constrained period) phase bins. This choice was driven by the balance to increase S/N in each phase bin while retaining the main features in the profiles. We fit all 50 bins of each profile with an absorbed double-blackbody (BB) model, which provided the best fit to the phase-averaged spectra of the source throughout the outburst (Y21). We fix the absorption column density to the value derived from the latter fit, cm-2 (Y21). We start by letting the temperatures () and areas of the thermally emitting regions vary freely. We find that the BB temperatures show no dependence on phase within their uncertainties. We test the level of scatter around the average by fitting a horizontal line to versus phase and measuring the reduced , which we find to be in the range of 0.9-1.5, implying little scatter. This temperature constancy with phase was also noted during the XMM-Newton observation of the source obtained on October 11 and 12 (Coti Zelati et al. 2021). Finally, we find that the temperatures matched the values derived through the phase-averaged spectroscopic analysis with NICER ( keV and keV), which also reveals constant BB temperatures throughout the outburst (Y21). Hence, we fix the temperatures of each phase-bin spectral model to these latter measurements. As an extra layer of caution, we test the goodness of this fit to each phase bin by simulating 1000 spectra drawn from the best-fit model and noting the percentage of the test statistics of these simulated spectra that are smaller than the true one. This percentage is consistently around , implying that this model provides an accurate representation of the data.
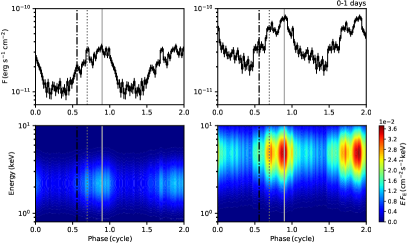

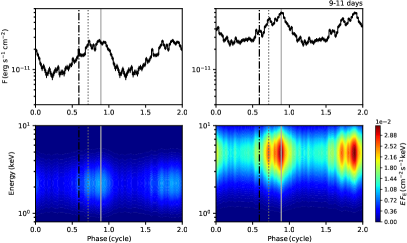

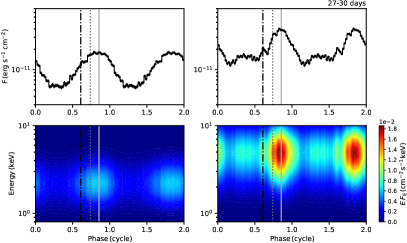
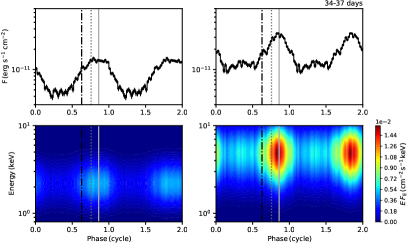
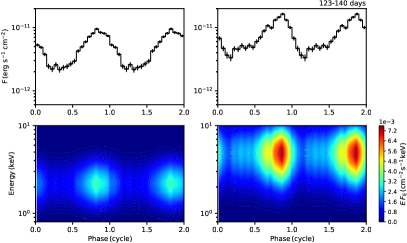

Figure 3 shows a sample of our results and can be summarized as follows. Each panel-tetrad represents the epoch during which the analysis is performed. The upper panels show the 1–10 keV fluxes as a function of phase for the warm BB (left panels) and hot BB (right panels), respectively. The lower panels display the corresponding dynamic spectral profiles (DSPs, e.g., Rea et al. 2009) which show the photon flux (in units of photons s-1 cm-2 keV) contours in phase-energy space. The integrated fluxes per phase-bin as well as the DSPs present a clear picture of the phase-variability pattern; the separate pulses in each profile are well resolved in both the warm and hot-BB components at the early stages of the outburst, though the trough between the peaks is more pronounced in the latter. The peak-separation becomes less evident with time, more quickly for the warm component. For instance, by days 18–21 post outburst, the peaks remain well resolved in the hot BB pulse profile while the warm BB profile had already simplified to a single-peak form. Interestingly, the pulse profiles of the last four epochs, 4 to 7 months later, appear stable, with a pure sinusoidal shape for the warm BB component, and a slightly more complex structure for the hot BB component, consisting of a double-peaked main pulse. Finally, the black dashed, dotted dark-gray, and solid light-gray lines in all panels prior to the Sun-constrained period represent the centroids of the Gaussian components that fit the three main peaks in the count pulse profiles as derived in Section 3.1; note their excellent agreement with the maxima of each peak as displayed in Figure 3.
We plot the hot versus warm BB fluxes for each phase bin and each epoch in Figure 4. These two parameters vary in tandem as a function of phase, maintaining a close flux ratio of . Additionally, this correlation seems to be non time-varying, with a similar correlation factor prevailing over the full length of the outburst epoch we are considering, including after the Sun-constrained period.
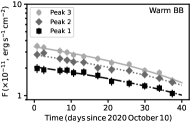
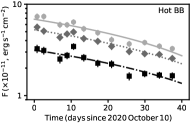
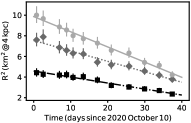
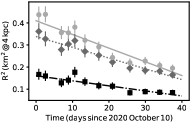
Finally, to check the time dependency of the three main pulse peaks in more detail, we extracted spectra centered on their respective Gaussian centroids and having a bin width . We fit the time-dependent spectra of each peak simultaneously with an absorbed 2BB model. Initially, we only link the hydrogen column density, and track the evolution of the warm and hot BB temperatures. Even with much improved statistics, we find that the temperatures did not vary significantly with time for any of the peaks, and hence were linked together. The upper panels of Figure 5 show the flux evolution of the warm (left) and hot (right) BB component for each peak. The straight lines are best-fit linear decay trends. We display the y-axis in log space, i.e., to represent the fractional change of the flux with time, evidently demonstrating that this quantity is constant between the three peaks and for both BB components. The lower panels are the corresponding change in area at a fiducial distance of 4 kpc.
4 Discussion
4.1 Summary of Results
The SGR 18300645 near-daily NICER monitoring campaign during the first 37 days of the outburst, enabled by the X-ray Timing Instrument’s large effective area, afforded an in-depth look at the phase-resolved spectro-temporal and pulse-shape evolution of the source soft X-ray emission, among the most detailed such study of any magnetar to date.

Our fine (50 phase bins) phase-resolved spectroscopic analysis indicates that two BBs, a warm and a hot component with temperatures of about 0.5 and 1.2 keV, respectively, are necessary to fit all phase bins. The BB temperatures show no apparent phase-variability nor do they exhibit any significant evidence of change with time, despite the complex shape and temporal evolution of the pulse profile, initially marked with a triple peaked form (see also Coti Zelati et al. 2021, for phase-resolved analysis with XMM-Newton during the first two days of the outburst). Additionally, these two fluxes maintain a close correlation throughout the rotational cycle of the star, and show an almost identical decay trend with time, driven by the linear decrease of the emitting surface area, as evidenced in Figures 4 and 5. Finally, the pulse shapes of these thermally emitting regions are comparable; the peaks appear at the same rotational phase, yet they are more pronounced for the hotter BB component, which also possesses the smaller area among the two (see Figure 3).
The apparent shift in the SGR 18300645 thermal pulse peaks during the first 37 days of the outburst, in concert with the area shrinkage and flux decay, is undoubtedly the most intriguing result of our investigation. It is important to note that the motion is occurring in the direction to significantly simplify the pulse shape from triple peaked to almost single-pulsed, through the merging of the separate peaks (see Figures 1 and 3). While this aspect of pulse reduction during the decay phase of magnetar outbursts is well documented in a few sources (e.g., Rea et al. 2013; Gavriil et al. 2011; Scholz et al. 2012), to our knowledge, this is the first time that the process with which the pulse shape simplifies is temporally and spectroscopically resolved.
4.2 Nature of Pulse-peak Motion
The nature of the pulse-peak motion is quite different from that expected from most relevant physical processes of the star, thus providing a strong constraint on its origin. For example, it is far slower than the characteristic shear speed of the crust , where are the shear modulus and mass density, respectively. Hot spot motion is discussed in the context of accreting millisecond-pulsars (e.g., Lamb et al. 2009; Patruno et al. 2010), however, the same mechanism cannot explain the behavior in SGR 18300645 considering the lack of any sign of accretion, e.g., through spin-up (Y21). Heat conduction might operate on a broadly similar timescale, but would not move local hotspots around in a way that preserves their identity.
We envisage two physical scenarios that could be responsible for the evolution of the persistent soft X-ray emission we observe during the outburst: plastic motion of the crust, and untwisting of the magnetosphere. These two scenarios are motivated by the most likely origins of surface heating during magnetar outbursts; either from energy deposition in the crust, e.g., due to Hall wave avalanches (Li et al. 2016, see also Beloborodov & Li 2016b; Deibel et al. 2017), or bombardment of the surface by accelerated particles in a twisted external B-field (Beloborodov 2009; Beloborodov & Li 2016b). In both cases the outburst is initiated by an elastic failure of the crust, yet, their evolution is dictated by different regions of the neutron star. These two scenarios, which we consider in turn next, could act separately or in concert to generate the peak merging and the hot spot area reduction.
4.2.1 Plastic Motion of the Crust
Given that the formation of the peaks and their subsequent motion coincide with high-energy bursting activity aligning in phase with the hot thermal regions (Y21), one logical scenario to explore is whether we could be witnessing plastic motion of the crust (Jones 2003; Lyutikov 2015). Crustal motion could arise when magnetic stresses gradually build up in the star’s crust, eventually exceeding its elastic yield limit and leading to a horizontal displacement in a surface area (Thompson & Duncan 1995; Thompson et al. 2000, 2002). Magnetic-field evolution due to Hall drift for internal magnetic fields G is a principal candidate for causing such large stresses to develop within young NSs like magnetars (Goldreich & Reisenegger 1992; Cumming et al. 2004; Gourgouliatos et al. 2016, but see Thompson et al. 2017 for an alternative view). Within the model of Lander (2016) (see also Lander & Gourgouliatos 2019), the rate at which supra-yield stresses are converted into plastic motion is set by the viscosity of the crust in its plastic phase , with the plastic-flow speed , where is a characteristic length scale associated with the flow. The pulse-peak motion of SGR 18300645 may, therefore, give us a probe of and the poorly understood material properties of the neutron-star crust.
Sustaining a plastic flow fast enough to power high-energy bursts requires a rough balance between the effects of Hall drift and plastic flow, corresponding to . However, this leads to a typical in the inner crust (Lander & Gourgouliatos 2019; Gourgouliatos & Lander 2021), roughly four orders of magnitude slower than the cm yr-1 motion rate we observe. Extrapolating from these results and using , the observed peak motion would need to be from a region with , suggesting a location within the lower-density, more malleable outer crust instead.
The average BB temperature of roughly keV—equivalently K—corresponds to the observed temperature of the star’s surface layers modified by the thin atmosphere. If the outburst energy is deposited internally, the envelope below would act as an efficient heat blanket, meaning that the outer crust will be considerably hotter than the BB temperature: roughly K for a typical crustal composition (see, e.g., Kaminker et al. 2014). This is above the melting temperature for most of the outer crust (Haensel et al. 2007); therefore in the emitting region of SGR 18300645, only the innermost part of the outer crust () is likely to be solid.
In lieu of a quantitative calculation for , we assume it has the same density-dependent profile as the yield stress, but with a different prefactor (see Lander & Gourgouliatos 2019, for details) to estimate for the region undergoing plastic motion. Assuming K below the heat-insulating envelope and requiring that (in order to explain the pulse-peak drift as plastic motion), we estimate , corresponding to a depth of roughly metres—comparing with our previous estimate, this is also the outermost region of the star that is likely to be solid. This is important because the liquid regions of the outer crust cannot sustain shear stresses, and so will experience motion on a fluid timescale, far faster than the pulse drift we observe. We conclude that, in the scenario of internal heating, the active region in SGR 18300645, responsible for both the X-ray bursts and thermal emission, should be the near-molten inner part of the star’s outer crust, undergoing plastic flow. Since less elastic energy can be stored here than in the inner crust, this physical picture is also consistent with the X-ray bursts being relatively weak (Y21). Interestingly, this region of the crust is typically invoked to fit the outburst decay trends with crustal thermal relaxation models (e.g., Rea et al. 2012; Scholz et al. 2014).
4.2.2 Untwisting the Magnetosphere
The spectro-temporal evolution in SGR 18300645 can alternatively be explained in connection with the paradigm of twisted magnetospheres. The addition of toroidal components to generate twisted, non-dipolar magnetar magnetospheres (Thompson et al. 2002) occurs naturally with the presence of poloidal currents. A portion of the energy involved in an impulsive dislocation process can be deposited in the magnetosphere as field line footpoints promptly shift across the stellar surface. Unfortunately, the lack of X-ray data prior to the outburst onset in SGR 18300645 prohibits observation of dislocation in action. Yet, the most constraining estimates for the outburst rise time of days, measured for several magnetars (Israel et al. 2007; Esposito et al. 2008; Younes et al. 2017b), indicate that such rupturing is abrupt.
Once energy is stored in a twisted field configuration, it is available for dissipation. Currents in twisted magnetospheres are concentrated in restricted zones, current loops often called -bundles (Beloborodov 2009), and in the axisymmetric ideal MHD approximation, these assume quasi-toroidal shapes (Chen & Beloborodov 2017). Therein, charges bombard the surface at the field line footpoints and thereby generate hot spots/zones (Beloborodov & Li 2016b). The pulse peaks observed for SGR 18300645 likely correspond to emission from such confined surface zones.
As the peaks migrate during the 37 day episode, the soft X-ray spectrum does not vary, yet the effective area(s) of the hot and cool surface emission regions monotonically decline according to Fig. 5. This behavior is commensurate with the expectation (Beloborodov & Thompson 2007; Beloborodov 2009) that twisted fields slowly unwind and the volume of the current loops declines due to Ohmic dissipation of the currents. The nominal timescale for this decay is of the order of a year (Beloborodov 2009), albeit determined for global axisymmetric twisted configurations. The phase separation of the peaks at the outset of the migration likely corresponds to a separation in the range of across the surface. This indicates that the twisted zones are flux tubes/ropes akin to those observed in the solar corona,111Images of solar prominences and coronal field loops can be found in the Solar Dynamics Observatory gallery at https://www.nasa.gov/mission_pages/sdo/images/index.html as opposed to extended quasi-toroidal volumes. The smaller area of the hotter blackbody component naturally suggests an umbral/penumbral configuration for the twisted field region as it threads the stellar surface, likely persisting along the tube to its apex: the magnetic twist energy is and is greater at the center of the tube than at its periphery. The shrinkage of the hot spots, concurrent with the peak-migration observed for SGR 18300645 may correspond to shrinking a flux tube on the -month timescale, a dynamical corona event that has not been discerned before for magnetars.
This field untwisting is accompanied by a migration of current bombardment regions across the surface (Beloborodov 2009; Chen & Beloborodov 2017), also causing a modest change in direction of the field at the footpoints of the tube’s field lines. The surface penetration depth of the bombarding pairs’ relativistic electrons is no more than a few cm due to the large optical depth in the surface magnetized atmosphere (e.g., Ho et al. 2007; González-Caniulef et al. 2019). Accordingly, the heating signatures of such bombardment will be intimately tied to the soft X-ray atmospheric emission. A strong local radiation anisotropy is expected from the surface, with a preferential beaming along B of soft X rays at frequencies well below the cyclotron fundamental (van Adelsberg & Lai 2006; Taverna et al. 2020; Barchas et al. 2021). Hence, the pulse-peak migration, in this scenario, would be a combination of physical crustal motion as the external field-lines untwist, and a non-negligible contribution from changes in the footpoint B direction. Here, the crustal motion is likely experienced at a depth where the activated field lines anchor to the rigid surface; a poorly known quantity in the case of non-dipolar field lines.
During the untwisting, the energy reservoir of the excess magnetic field is transferred to charges and radiation. The charges ( pairs) are energized by dynamical electric fields in the magnetosphere and in principle can generate hard X-ray signals via the resonant inverse Compton scattering of surface X-ray photons (e.g., Baring & Harding 2007; Beloborodov 2013; Wadiasingh et al. 2018). Such an emission component is not dominant for SGR 18300645 (Coti Zelati et al. 2021), indicating that the twist energy is ultimately deposited through bombardment in heating the surface. Thus the soft X-ray luminosity provides an observational upper limit to the untwisting field decay rate.
The twisted flux tube can be ascribed an effective volume , where is the footprint area of the tube at the stellar surface, and km is the neutron star radius. Also, describes the length along the tube for the dominant contribution to the magnetic energy stored in the twisted field configuration in excess of the dipole value. Nominally, , with poloidal and components contributing significantly (Thompson et al. 2002; Pavan et al. 2009) to this excess. The baseline energy scale for the field is the total dipolar contribution within the flux tube (ft) at the conclusion of the peak migration, which is erg for a surface polar field of G. Using this, one can then express the energy of the twisted field reservoir, , and bound it observationally by the cumulative energy radiated in the soft X-rays during the 37 day migration epoch:
Here is a factor that accounts for the added contribution of the poloidal components to the twisted field. The cumulative radiated energy assumes the luminosity erg/sec for a source distance of 4 kpc, and is herein ascribed to the umbral hot component, for which km2 from Fig. 5. For , this inequality constrains the toroidal field at the outset of the migration to , which is in keeping with theoretical expectations for moderately strong twists (Thompson et al. 2002; Chen & Beloborodov 2017). Given that is likely larger, around 10–30, the twist is correspondingly smaller. Accordingly, forging a connection of twisted fields to migrating hotspots enables important constraints on the twist morphology in SGR 18300645.
4.3 Concluding Remarks
Many reasons could have precluded us from observing this behavior during previous magnetar outbursts. For instance, daily high-throughput X-ray observations were extremely rare prior to the launch of NICER and while only a few (e.g., XMM-Newton) observations may have been able to spot the peak motion we report here, typically these are spread over the entire outburst decay period of months to years, insufficiently sampling such comparatively rapid evolution. Nonetheless, NICER has performed regular daily monitoring observations of a few more transient magnetars, Swift J1818.01607 (Hu et al. 2020), and Swift J1555.25402 (Enoto et al. 2021). Both these magnetars showed a very stable single-pulsed profile over the first months of the outburst (note, however, the lower number counts compared to SGR 18300645 due to the larger absorbing hydrogen column density in their direction). This may imply that scarcity of observations alone cannot account for the absence of pulse-peak motion, and some intrinsic properties of the outburst must be in play—e.g., the geometry of the affected regions and/or the depth at which crustal motion is occurring. Continued daily monitoring of magnetar outbursts with NICER is therefore critical to reveal the diversity of this phenomenon among the population. This in turn could guide the development of a more complete theoretical picture where magnetosphere and crust are considered in tandem, e.g., by defining how the magnetic field threads from the magnetosphere through the atmosphere to the outer crust. Such investigations will elucidate the crustal and magnetospheric physics, helping to discriminate between these scenarios as the origin for pulse peak migration.
Acknowledgments
G.Y.’s research is supported by an appointment to the NASA Postdoctoral Program at the Goddard Space Flight Center, administered by Universities Space Research Association under contract with NASA. Prior to the appointment, G.Y. was supported by funding through the NASA NICER Guest Observer program grant 80NSSC21K0233 and the NASA Fermi Guest Investigator program grant 19-19FermiC13-0021. M.G.B. acknowledges the generous support of the National Science Foundation through grant AST-1813649. ZW is partly supported by NASA under award number 80GSFC21M0002 as well as by an appointment to the NASA Postdoctoral Program at the Goddard Space Flight Center, administered by Universities Space Research Association under contract with NASA. W.C.G.H. acknowledges support through grant 80NSSC20K0278 from NASA.
References
- Arnaud (1996) Arnaud, K. A. 1996, in ASP Conf. Ser. 101: Astronomical Data Analysis Software and Systems V, 17
- Barchas et al. (2021) Barchas, J. A., Hu, K., & Baring, M. G. 2021, MNRAS, 500, 5369, doi: 10.1093/mnras/staa3541
- Baring & Harding (2007) Baring, M. G., & Harding, A. K. 2007, Ap&SS, 308, 109, doi: 10.1007/s10509-007-9326-x
- Beloborodov (2009) Beloborodov, A. M. 2009, ApJ, 703, 1044, doi: 10.1088/0004-637X/703/1/1044
- Beloborodov (2013) —. 2013, ApJ, 762, 13, doi: 10.1088/0004-637X/762/1/13
- Beloborodov & Li (2016b) —. 2016b, ApJ, 833, 261, doi: 10.3847/1538-4357/833/2/261
- Beloborodov & Thompson (2007) Beloborodov, A. M., & Thompson, C. 2007, ApJ, 657, 967, doi: 10.1086/508917
- Chen & Beloborodov (2017) Chen, A. Y., & Beloborodov, A. M. 2017, ApJ, 844, 133, doi: 10.3847/1538-4357/aa7a57
- Coti Zelati et al. (2018) Coti Zelati, F., Rea, N., Pons, J. A., Campana, S., & Esposito, P. 2018, MNRAS, 474, 961, doi: 10.1093/mnras/stx2679
- Coti Zelati et al. (2020) Coti Zelati, F., Borghese, A., Rea, N., et al. 2020, A&A, 633, A31, doi: 10.1051/0004-6361/201936317
- Coti Zelati et al. (2021) Coti Zelati, F., Borghese, A., Israel, G. L., et al. 2021, ApJ, 907, L34, doi: 10.3847/2041-8213/abda52
- Cumming et al. (2004) Cumming, A., Arras, P., & Zweibel, E. 2004, ApJ, 609, 999, doi: 10.1086/421324
- Deibel et al. (2017) Deibel, A., Cumming, A., Brown, E. F., & Reddy, S. 2017, ApJ, 839, 95, doi: 10.3847/1538-4357/aa6a19
- Enoto et al. (2021) Enoto, T., Ng, M., Hu, C.-p., et al. 2021, arXiv e-prints, arXiv:2108.02939. https://arxiv.org/abs/2108.02939
- Esposito et al. (2008) Esposito, P., Israel, G. L., Zane, S., et al. 2008, MNRAS, 390, L34, doi: 10.1111/j.1745-3933.2008.00530.x
- Esposito et al. (2010) Esposito, P., Israel, G. L., Turolla, R., et al. 2010, MNRAS, 405, 1787, doi: 10.1111/j.1365-2966.2010.16551.x
- Foreman-Mackey et al. (2013) Foreman-Mackey, D., Hogg, D. W., Lang, D., & Goodman, J. 2013, PASP, 125, 306, doi: 10.1086/670067
- Gavriil et al. (2011) Gavriil, F. P., Dib, R., & Kaspi, V. M. 2011, ApJ, 736, 138, doi: 10.1088/0004-637X/736/2/138
- Gavriil et al. (2006) Gavriil, F. P., Kaspi, V. M., & Woods, P. M. 2006, ApJ, 641, 418, doi: 10.1086/499094
- Goldreich & Reisenegger (1992) Goldreich, P., & Reisenegger, A. 1992, ApJ, 395, 250, doi: 10.1086/171646
- González-Caniulef et al. (2019) González-Caniulef, D., Zane, S., Turolla, R., & Wu, K. 2019, MNRAS, 483, 599, doi: 10.1093/mnras/sty3159
- Gourgouliatos & Lander (2021) Gourgouliatos, K. N., & Lander, S. K. 2021, MNRAS, 506, 3578, doi: 10.1093/mnras/stab1869
- Gourgouliatos et al. (2016) Gourgouliatos, K. N., Wood, T. S., & Hollerbach, R. 2016, Proceedings of the National Academy of Science, 113, 3944, doi: 10.1073/pnas.1522363113
- Haensel et al. (2007) Haensel, P., Potekhin, A. Y., & Yakovlev, D. G. 2007, Neutron Stars 1 : Equation of State and Structure, Vol. 326
- Ho et al. (2007) Ho, W. C. G., Kaplan, D. L., Chang, P., van Adelsberg, M., & Potekhin, A. Y. 2007, MNRAS, 375, 821, doi: 10.1111/j.1365-2966.2006.11376.x
- Hu et al. (2020) Hu, C.-P., Begiçarslan, B., Güver, T., et al. 2020, ApJ, 902, 1, doi: 10.3847/1538-4357/abb3c9
- Israel et al. (2007) Israel, G. L., Campana, S., Dall’Osso, S., et al. 2007, ApJ, 664, 448, doi: 10.1086/518224
- Israel et al. (2010) Israel, G. L., Esposito, P., Rea, N., et al. 2010, MNRAS, 408, 1387, doi: 10.1111/j.1365-2966.2010.17001.x
- Jones (2003) Jones, P. B. 2003, ApJ, 595, 342, doi: 10.1086/377351
- Kaminker et al. (2014) Kaminker, A. D., Kaurov, A. A., Potekhin, A. Y., & Yakovlev, D. G. 2014, MNRAS, 442, 3484, doi: 10.1093/mnras/stu1102
- Lamb et al. (2009) Lamb, F. K., Boutloukos, S., Van Wassenhove, S., et al. 2009, ApJ, 706, 417, doi: 10.1088/0004-637X/706/1/417
- Lander (2016) Lander, S. K. 2016, ApJ, 824, L21, doi: 10.3847/2041-8205/824/2/L21
- Lander & Gourgouliatos (2019) Lander, S. K., & Gourgouliatos, K. N. 2019, MNRAS, 486, 4130, doi: 10.1093/mnras/stz1042
- Li et al. (2016) Li, X., Levin, Y., & Beloborodov, A. M. 2016, ApJ, 833, 189, doi: 10.3847/1538-4357/833/2/189
- Lyutikov (2015) Lyutikov, M. 2015, MNRAS, 447, 1407, doi: 10.1093/mnras/stu2413
- Page et al. (2020) Page, K. L., Barthelmy, S. D., Klingler, N. J., Kuin, N. P. M., & Lien, A. Y. 2020, The Astronomer’s Telegram, 14083, 1
- Patruno et al. (2010) Patruno, A., Hartman, J. M., Wijnands, R., Chakrabarty, D., & van der Klis, M. 2010, ApJ, 717, 1253, doi: 10.1088/0004-637X/717/2/1253
- Pavan et al. (2009) Pavan, L., Turolla, R., Zane, S., & Nobili, L. 2009, MNRAS, 395, 753, doi: 10.1111/j.1365-2966.2009.14600.x
- Rea et al. (2009) Rea, N., Israel, G. L., Turolla, R., et al. 2009, MNRAS, 396, 2419, doi: 10.1111/j.1365-2966.2009.14920.x
- Rea et al. (2012) Rea, N., Israel, G. L., Esposito, P., et al. 2012, ApJ, 754, 27, doi: 10.1088/0004-637X/754/1/27
- Rea et al. (2013) Rea, N., Israel, G. L., Pons, J. A., et al. 2013, ApJ, 770, 65, doi: 10.1088/0004-637X/770/1/65
- Remillard et al. (2021) Remillard, R. A., Loewenstein, M., Steiner, J. F., et al. 2021, arXiv e-prints, arXiv:2105.09901. https://arxiv.org/abs/2105.09901
- Scholz et al. (2014) Scholz, P., Kaspi, V. M., & Cumming, A. 2014, ApJ, 786, 62, doi: 10.1088/0004-637X/786/1/62
- Scholz et al. (2012) Scholz, P., Ng, C.-Y., Livingstone, M. A., et al. 2012, ApJ, 761, 66, doi: 10.1088/0004-637X/761/1/66
- Taverna et al. (2020) Taverna, R., Turolla, R., Suleimanov, V., Potekhin, A. Y., & Zane, S. 2020, MNRAS, 492, 5057, doi: 10.1093/mnras/staa204
- Thompson & Duncan (1995) Thompson, C., & Duncan, R. C. 1995, MNRAS, 275, 255
- Thompson & Duncan (1996) —. 1996, ApJ, 473, 322, doi: 10.1086/178147
- Thompson et al. (2000) Thompson, C., Duncan, R. C., Woods, P. M., et al. 2000, ApJ, 543, 340, doi: 10.1086/317072
- Thompson et al. (2002) Thompson, C., Lyutikov, M., & Kulkarni, S. R. 2002, ApJ, 574, 332, doi: 10.1086/340586
- Thompson et al. (2017) Thompson, C., Yang, H., & Ortiz, N. 2017, ApJ, 841, 54, doi: 10.3847/1538-4357/aa6c30
- van Adelsberg & Lai (2006) van Adelsberg, M., & Lai, D. 2006, MNRAS, 373, 1495, doi: 10.1111/j.1365-2966.2006.11098.x
- Viganò et al. (2013) Viganò, D., Rea, N., Pons, J. A., et al. 2013, Monthly Notices of the Royal Astronomical Society, 434, 123, doi: 10.1093/mnras/stt1008
- Wadiasingh et al. (2018) Wadiasingh, Z., Baring, M. G., Gonthier, P. L., & Harding, A. K. 2018, ApJ, 854, 98, doi: 10.3847/1538-4357/aaa460
- Woods et al. (2004) Woods, P. M., Kaspi, V. M., Thompson, C., et al. 2004, ApJ, 605, 378, doi: 10.1086/382233
- Younes et al. (2017a) Younes, G., Baring, M. G., Kouveliotou, C., et al. 2017a, ApJ, 851, 17, doi: 10.3847/1538-4357/aa96fd
- Younes et al. (2017b) Younes, G., Kouveliotou, C., Jaodand, A., et al. 2017b, ApJ, 847, 85, doi: 10.3847/1538-4357/aa899a