Monte Carlo Simulation of Dust Particles in a Protoplanetary Disk: Crystalline to Amorphous Silicate Ratio in Comets
Abstract
Observationally inferred crystalline abundance in silicates in comets, which should have been formed in the outer region of a protoplanetary disk, is relatively high (–60%), although crystalline silicates would be formed by annealing of amorphous precursors in the disk inner region. In order to quantitatively address this puzzle, we have performed Monte Carlo simulation of advection/diffusion of silicate particles in a turbulent disk, in the setting based on pebble accretion model: pebbles consisting of many small amorphous silicates embedded in icy mantle are formed in the disk outer region, silicate particles are released at the snow line, crystalline silicate particles are produced at the annealing line, the silicate particles diffused beyond the snow line, and they eventually stick to drifting pebbles to come back to the snow line. In a simple case without the sticking and with a steady pebble flux, we show through the simulations and analytical arguments that crystalline components in silicate materials beyond the snow line is robustly and uniformly %. On the other hand, in a more realistic case with the sticking and with a decaying pebble flux, the crystalline abundance is raised up to –25%, depending on the ratio of decay and diffusion timescales. This abundance is consistent with the observations. In this investigation, we assume a simple steady accretion disk. The simulations coupled with the disk evolution is needed for more detailed comparison with observed data.
1 Introduction
Crystalline silicates, such as forsterite, are formed by re-condensation after sublimation at of amorphous precursors or annealing of them at (e.g., Wooden, 2008). However, they are observed in outer cold regions of protoplanetary disks and the Stardust samples (e.g., Brownlee et al., 2006; Ciesla, 2011, and references therein). Infrared observations of comets also show 10–60% of silicates are crystalline (e.g., Sitko et al., 2011; Harker et al., 2011, also see compiled data for several comets in Shinnaka et al. 2018). Comets were formed in outer region of a protoplanetary disk, such as Kuiper belt or Uranus-Neptune zone, and scattered to Oort Clouds (e.g., Dones et al., 2015). Some mechanism should have transported the crystalline silicate particles that experienced in the inner disk region to the outer region. The radial turbulent diffusion is one of available transporting mechanisms (e.g., Gail, 2001; Bockelée-Morvan et al., 2002; Cuzzi et al., 2003), while centrifugal jets (Shu et al., 1996) or global disk flow (e.g., Keller & Gail, 2004; Ciesla, 2007; Desch, 2007) could also be available. In this paper, we focus on the radial turbulent diffusion.
Ciesla (2010, 2011) developed a 3D Monte Carlo simulation code for turbulent diffusion of crystalline silicates in a protoplanetary disk to successfully show that the particles initially at au can diffuse out beyond 20 au. However, because the initial distributions of amorphous and crystalline silicates were not clear, the results were not compared quantitatively with the observed abundance of crystalline components in silicates in the comets.
Pavlyuchenkov & Dullemond (2007) numerically solved one-dimensional diffusion equation for crystalline materials formed at the formation front in the inner disk region. Arakawa et al. (2021) discussed the modulations from the Pavlyuchenkov & Dullemond (2007)’s results by silicate particle growth and by drift due to gas drag in the disks with and without a pressure bump created by magnetically driven disk winds. Both papers assumed that amorphous silicates are stationarily distributed with the uniform solid-to-gas ratio in the steady accretion disk, and Arakawa et al. (2021) concluded that the crystalline abundance is very low unless a global pressure bump is introduced. However, their setting on silicate particles is not consistent with the new model of planetary accretion called “pebble accretion” (e.g., Ormel & Klahr, 2010; Lambrechts & Johansen, 2014).
In the pebble accretion model, pebbles with cm–m size are formed in disk outer regions, drift all through the disk, and some fraction of the drifting pebbles are accreted by planetary seeds (e.g., Lambrechts & Johansen, 2014; Sato et al., 2016). The pebbles would consist of many small amorphous silicate particles embedded in icy mantle and the silicate particles are released by ice sublimation at the snow line (e.g., Saito & Sirono, 2011; Morbidelli et al., 2015; Ida & Guillot, 2016). The reason to consider this pebble structure is that the threshold velocity for fragmentation of silicates would be generally one order smaller than that of ices (e.g., Blum & Wurm, 2000; Zsom et al., 2011; Wada et al., 2011), although this conventional view is recently challenged (Kimura et al., 2015; Gundlach et al., 2018; Musiolik & Wurm, 2019; Steinpilz et al., 2019). Assuming this silicate-ice structure of pebbles, Ida et al. (2021) derived the conditions for the gravitational instability of the pile-up of the released silicate particles by local 2D () Monte Carlo simulation, following the method by Ciesla (2011).
The motivation of this paper is to apply the above setting of injection of amorphous silicate particles at the snow line for predicting the crystalline silicate ratio in the total (silicate and amorphous) silicates in disk outer regions. We find that about 5% of the released amorphous particles drifting inward from the snow line come back to disk outer regions by outward diffusion, after experiencing high temperature to be transferred to crystalline particles. To calculate the global evolution of silicate dust particle distributions, we adopt global 3D () Monte Carlo simulation by Ciesla (2011). We do not apparently incorporate a coupled silicate dust growth such as the model by Misener et al. (2019), because the results here do not change, as long as Stokes number of the silicate particles is smaller than the parameter of the turbulent mixing, while the effect of the silicate growth is discussed in Appendix. On the other hand, we include the effect of rapid inward drift of the silicate particles that coagulate with drifting pebbles, which was discussed by Misener et al. (2019). Because we can calculate surface densities both of crystalline and amorphous silicate particles as a function of orbital radius, a quantitative comparison between theoretical prediction and the observation of comets can be done.
In Section 2, we describe the protoplanetary disk model that we adopt and Monte Carlo methods for advection due to gas drag and turbulent diffusion of silicate particles in the disk. The sticking rate of the particles to drifting pebbles beyond the snow line is also evaluated. In Section 3, we describe the analytical steady solution of the radial advection-diffusion equation to explain the simulation results with and without silicates sticking to pebbles. In Section 4, we show the simulation results for the simple case neglecting the sticking (Section 4.1), the case with sticking to icy pebbles (Section 4.2), and the case with the attenuation of a pebble flux due to the depletion of solid materials in the reservoir in the outer disk (Section 4.3). While the sticking to the pebbles inhibits outward diffusion of the silicate particles, the decaying pebble flux tends to diminish the sticking effect. We show that the radial diffusion in the case with the decaying pebble flux can quantitatively explain the relatively high abundance in the comets. Section 5 is the conclusion and discussion.
2 Method
2.1 Disk model
We adopt the quasi-steady composite disk model derived by Ida et al. (2016) and Ida et al. (2019). For simplicity, the depletion due to photoevaporation is neglected and we assume that the disk evolution is regulated by turbulent viscous diffusion. In general, the viscous heating is dominant in the inner disk regions, while the irradiative heating dominates in the outer disk regions. We composite these two regions by the disk mid-plane temperature , where and are the temperature in the viscous-heating and irradiation dominated regions given respectively by
| (1) | ||||
| (2) |
and where is the gas accretion rate through the disk and is a parameter of turbulent viscosity, which are scaled by the fiducial parameters in our disk model, and .
The temperature in the viscous-heating depends on the opacity. Equation (1) corresponds to relatively low opacity with relatively large silicate particles with the size and the temperature is higher for m size particles (Oka et al., 2011). As we will show in section 4.1, as long as both the snow and the annealing lines are in the viscous-heating dominated regime, the predicted crystalline silicate abundance is not affected by the numerical factor of ; the abundance depends only on the -dependence of . From Eqs (1) and (2), the transition from to occurs at
| (3) |
The gas disk aspect ratios corresponding to Eqs. (1) and (2) are
| (4) | ||||
| (5) |
From the assumption of steady accretion, , where is the disk gas surface density and is the Keplerian frequency, the gas surface densities the viscous-heating and irradiation dominated regions are
| (6) | ||||
| (7) |
We use the gas disk aspect ratio and the gas surface density .
We simply set the snow line by . From Eqs. (1) and (2), the snowline radius is given by , where
| (8) | ||||
| (9) |
The snow line is determined by viscous heating when for . Similarly, we set the silicate line radius as the location of silicate sublimation temperature (K), and the annealing line by . When the viscous heating dominates at the snow line, it also dominates at the silicate and annealing lines and they are given by
| (10) | ||||
| (11) |
If the irradiation dominates, the radial dependence of is weaker and .
We use and . As a result, the disk parameters are only the disk accretion rate and the viscosity parameter . The fiducial values of our disk model are and . We will also show the results with . Another important parameter is the pebble to gas mass flux ratio, (where is the pebble mass flux). Because pebbles start effective drift when they grow enough that the drift timescale becomes shorter than the growth timescale, the pebble mass flux is regulated by the outward migration of the pebble formation front where the two timescales coincide (Lambrechts & Johansen, 2014; Ida et al., 2016). Ida & Guillot (2016) estimated that . Because depends on pebble growth model and disk structure, we treat as a parameter. How to reflect the value of to Monte Carlo simulation is described in section 2.3.
2.2 Monte Carlo simulation
2.2.1 Overview
Our models for gas disk and particle evolution in different disk regions are illustrated in Figure 1. Pebbles are formed in outer disk regions and drift inward all through the disk due to gas drag. When icy pebbles are formed, many small “amorphous” silicate dust particles (represented by dark blue dots) are embedded in the icy mantle (represented by light blue), because we assume that collisions between silicate and icy particles are as sticky as ice-ice collisions (the threshold collision velocity for fragmentation, (e.g., Wada et al., 2013; Gundlach & Blum, 2015), while silicate-silicate collisions are not sticky, (e.g., Wada et al., 2013). The Stokes number is given by Eq. (37) (). The typical size of pebbles is 10–100 cm (Eq. (36)).
When the pebbles drift inward to , the ice mantle is sublimated and the embedded amorphous silicates are released. During the drift, crystalline and amorphous silicate particles that diffused out from inner regions (see below) also stick to the surface of drifting icy pebbles with the probability derived in section 2.4. They are also re-released at the snow line.
The Stokes number of silicate particles is assigned to be , which we use , corresponding to the dust particle size of for . The radial drift velocity of the silicate particles is given by Eq. (22). It shows that the radial velocity of the silicate particles and the calculation results are independent of the detailed value of (equivalently, the silicate particle size), as long as (diffusion-dominated for the silicate particles) and (drift-dominated for pebbles). We adopt a relatively severe rebounding/fragmentation limit to neglect growth of silicate particles through mutual collisions. Even if the detailed silicate dust growth model is adopted, the above condition would be satisfied for – that we use in this paper. Detailed discussions on is given in the Appendix.
Once the silicates arrive at , they are identified as “crystalline” silicates (represented by orange dots). Even if they go back to the regions at , they keep the state of crystals, because crystalline silicates are stable. When the silicates arrive at , they should become gas molecules. We assign for them in this region. When they go back to the regions , they re-condense as crystalline silicates. About 5% of the crystalline silicate particles diffuse out beyond the snow line and eventually diffuse inward toward the star. If the icy pebbles are still drifting there, the crystalline silicates attach to the pebbles to rapidly return to the snow line again. Once the steady state is established, the silicate loss rate to the star is balanced with their injection rate at the snow line, although individual silicate particles have different radial (sometimes, rather complicated) travel paths. These silicate particles tracking is summarized in Table 1.
2.2.2 Detailed Monte Carlo simulation methods

| location | Stokes number | structure |
|---|---|---|
| (sticking) | amorphous/crystalline | |
| (not sticking) | ||
| amorphous/crystalline | ||
| crystalline | ||
| 0 | gas |
In order to follow the orbital evolution of silicate particles described in section 2.2.1, we employ the 3D Monte Carlo simulation method for advection and diffusion of silicate particles developed by Ciesla (2011). Ciesla (2011) showed that the surface density evolution of silicate particles determined by the concentration equation,
| (12) |
where is the surface density of the silicate particles, is their diffusivity, and is their radial advection velocity, is reproduced by the following 3D Monte Carlo simulations of many particles. The changes in the positions in Cartesian coordinates () of each particle after the timestep are given by
| (13) | ||||
| (14) | ||||
| (15) |
where is given by the inverse of the local Keplerian frequency, , and the first and second terms in the right hand sides represent the advection and diffusion. In the diffusion terms, , and are independent random numbers in a range of [-1,1] with a root mean square of . Because and the back-reaction due to silicate particle concentration is neglected (assuming the silicate to gas density ) in this paper, we identify the diffusivity of the particles, , as the gas turbulent viscosity (Hyodo et al., 2019),
| (16) |
The advection velocities are given by (Ciesla, 2010, 2011),
| (17) | ||||
| (18) | ||||
| (19) |
In the steady accretion gas disk (), the second terms in Eqs. (17) and (18) vanish. Assuming the vertically isothermal disk with gas density , the second term in Eq.(19) is . The radial drift velocity due to gas drag is given by (Ida & Guillot, 2016; Schoonenberg & Ormel, 2017)
| (20) |
where is the local Keplerian velocity, is the disk gas (inward) accretion velocity given by , and is the degree of deviation of the gas rotation angular velocity from Keplerian one, given by
| (21) |
Hereafter we approximate as , because . Substituting the expression of and Eq. (21) into Eq. (20), we obtain
| (22) |
For simplicity, we take for . The vertical drift velocity is given by (Ciesla, 2010)
| (23) |
Substituting Eqs. (17) to (23) into Eqs. (13) to (15), we obtain
| (24) | ||||
| (25) | ||||
| (26) |
We confirmed that these equations reproduce the evolution of a Gaussian-ring (Ciesla, 2011, Fig. 1), as shown in Fig. 2 in our paper.
We inject super-particles that represent a swarm of silicate particles and suffer specific drag force for realistic particles near the snow line at every timestep . The initial radii are randomly distributed in the range of and the vertical height is determined by a Gaussian distribution of the root mean square . Following Ida et al. (2021), we adopt and where is a scale-hight of pebbles given by (Dubrulle et al., 1995; Youdin & Lithwick, 2007)
| (27) |
Shorter (longer) corresponds to a larger (smaller) number of super-particles with relatively smaller (larger) individual masses in the simulations. We choose short enough to statistically calculate the silicate surface densities and large enough for numerical simulations.
When silicate particles enter the region at , we regard that the particles are lost to the central star and remove them from the simulations.
2.3 Surface density of particles
If we are concerned only with relative abundance between amorphous and crystalline silicates at each , we do not need the information of the surface density of silicate particles. However, to calculate the collision probability of silicate particles with pebbles at , we need to specify the surface density of the pebbles. Accordingly, we can also calculate the silicate particle surface density, . The surface density of the silicate particles is calculated by the mass of individual silicate (super-)particles given from the pebble mass flux by the method of Ida et al. (2021), as shown below.
The silicate injection mass rate is given by
| (28) |
where is the silicate mass fraction in drifting pebbles ( in the normal case) and is the disk gas accretion rate. The mass of an individual super-particle, , is given by
| (29) |
The surface density of silicate particles at is given with the number of particles in the radial width of around by
| (30) |
where we used .
2.4 Sticking probability to icy pebbles
While we neglect silicate particle growth due to silicate-silicate collisions, we include the effect of coagulation of silicate particles with pebbles, assuming that silicate-ice collisions are more sticky. By the sticking of diffused-out silicate particles to drifting pebbles at , the silicate components are quickly returned to the disk inner region (Misener et al., 2019). We will show later that this effect is very important for the distributions of silicates beyond the snow line.
Assuming the perfect sticking of silicate particles to icy pebbles, the probability for a silicate particle to collide with any of pebbles during , which we call “sticking probability,” is calculated by
| (31) |
where is the number density of the pebbles, is the physical radius of the pebbles, and is the relative velocity between a silicate dust particle and a pebble. For , it is dominated by turbulent mixing and is given by (Sato et al., 2016)
| (32) |
The factor, , in Eq. (31) reflects that the scale height of the pebbles, , is smaller than that of silicate dust particles, , and the collisions are possible only during the silicate particles are passing the region of . The number density of pebbles is
| (33) |
where is the surface density of pebbles. Because the scale height of the pebbles in the above equation, , cancels out with the factor in Equation (31), we obtain
| (34) |
where we used Eq. (32).
We assume that the bulk density of icy pebbles is . From Eq.(22) with replacing by and ,
| (35) |
where we used . In the Stoke regime 111In outer regions far beyond the snow line, the Epstein drag is applied and the pebble size is smaller. However, as we will show in section 4, silicate particles cannot diffuse out so much to the outer regions when the collisions with pebbles are efficient. They can significantly spread only after pebbles are significantly depleted. In that case, while the Epstein drag must be applied, the collision effect is not important. Thereby we only use the expression in the Stokes regime. , the radial drift dominates over collisional growth for pebbles, and the pebble size is approximated by an -independent form (Ida et al., 2016),
| (36) |
The corresponding Stoke number of pebbles is given by (Ida et al., 2016)
| (37) |
Substituting Eqs. (6) and (37) into Eq. (35),
| (38) |
Therefore, the sticking probability (Eq. (34)) is given by
| (39) |
where
| (40) |
3 Analytical solution of silicate surface density
In order to understand the results of our Monte Carlo simulations presented in section 4, we here derive analytical steady solutions to the advection-diffusion equation of concentration given by Eq.(12). We also derive modifications due to the effect of the sticking to pebbles.
3.1 Simple case
Equation (12) has two possible solutions in a steady state (),
| (41) | ||||
| (42) |
where
| (43) |
The former solution represents the inwardly accreting steady flow,
| (44) | |||
| (45) |
Equation (44) means . Assuming and with , Eq. (45) with shows
| (46) |
The latter (Eq. 42) is the solution of zero net flux, given by
| (47) |
which means that the radial gradient is steeper for than for . This dependence of is equivalent to Eq.(23) with () in Pavlyuchenkov & Dullemond (2007).
Setting the radial gradient of gas and dust surface densities and , the former and latter solutions are
| (48) | ||||
| (49) |
In the viscous-heating and irradiation dominated regions, (Eq. 6) and (Eq. 7), respectively. We will show in section 4.1 that the silicate distributions inside and outside the snow line correspond to and , respectively.
3.2 Case with sticking to icy pebbles
Once silicate particles stick to icy pebbles, they inwardly drift with relatively high velocity as a part of the pebbles. If the sticking is considered, Eq. (12) should additionally have an extra term at . Because it is no more exactly solved, we approximately estimate the modification to due to the sticking.
The sticking to icy pebbles is a sink of silicates beyond snow line. The sticking rate is given by in Eq. (39). Thus, the decay rate of silicate outward diffusion flux due to the sticking is
| (50) |
where and is the time at which the diffusion flux departs from the snow line. Typical diffusion length from at is
| (51) |
The solution to Eq. (50) corresponds to
| (52) |
where is the silicate outward flux at the snow line. Solving this equation in terms of ,
| (53) |
where
| (54) |
we substituted given by Eq. (40), and is given by Eq.(4) since viscous heating dominates at the snow line when for .
The effect of the decay in can be expressed as modulation to for the zero net flux solution in the simple case in section 3.1. The additional power-law index would be
| (55) |
The modified power-law index is given by
| (56) |
where we adopt .
For , , and , we obtain and at 3 au. In the viscous heating dominated regime, . For , we obtain , , and at 3 au. In the irradiation dominated regime (), is higher by 0.47. Because is insensitive to the disk parameters (Eq. 54), the modified values of are not sensitively affected by the disk parameters. In section 4.2, we will show that Eq. (56) reproduces the results of the Monte Carlo simulations.
4 Results
4.1 Simple case
We first show the results in a simple case without the sticking to pebbles and with time-constant . Figure 3 show snapshots of amorphous (the blue dots) and crystalline (the orange dots) silicate particles and their surface density evolution in a run with fiducial parameters, , , and . We always adopt , , and , in this paper. With these parameters, the disk is viscous-heating dominated at au and irradiation dominated at au. The disk gas surface density (subsection 2.1) is
| (57) |
The snow and annealing lines are at and 0.28 au. We use the injection time interval year in all the runs in this paper (in the runs with decaying pebble flux, is increased after the decay starts). The corresponding super-particle mass is .
Figure 3a-d are the snapshots at , , , and years. The characteristic radial diffusion timescale is (Eqs. 13 and 14). In the unit of , the diffusion timescale at , the time in panels a-d correspond to , , , and , respectively. Silicate particles released at the snow line diffuse both inward and outward with a net inward mean flow inside the snow line. Accordingly, the surface density distribution of silicate particles, which is calculated from the snapshot with Eq. (6), increases with time. We find that the surface density distribution at (panel d) does not change any more even if simulations are continued, implying that the distribution at is already in equilibrium in the range of in the plot ( au).
At (panel a), about a half of silicate particles released at arrive at the annealing line and the crystalline silicate surface density increases to a half of that in the equilibrium state at . This timescale is explained as follows. The radial drift timescale for silicate particles by disk gas accretion flow is . In the viscous heating dominant region, and accordingly ; the diffusion spends more time at larger . Thereby, the total timescale for particles released at to migrate to the annealing line would be , which agrees with the simulation result within a factor of 2. At (panel (b)), roughly 5 % of crystalline silicate particles come back to the snow line and the crystalline silicate surface density increases to a half of that in the equilibrium state at . The timescale to diffuse out from to is also , which is consistent with the simulation result in panel b. Although, in fact, the diffusion timescale for inward transport would be shorter than outward transport by inward disk accretion, accretion timescale may be comparable to diffusion timescale for transport from the snow line and the annealing line and the simple estimation with diffusion timescale helps to roughly interpret the simulation results. At (panel c), the crystalline silicate surface density reaches the equilibrium value at , but it has not reached the equilibrium value in outer region, because is longer for larger .
Figure 4a shows the silicate particle surface density at years of the run in Figure 3, where the equilibrium state is established. The orange and blue lines are the surface densities of crystalline and amorphous silicate particles calculated by Eq. (30) from the particle distributions obtained by the Monte Carlo simulations, In this plot, the blue dashed line represents the assumed gas surface density given by Eq. (57). The other dashed lines represent the analytically predicted surface densities of silicate particles, as explained below. These analytical predictions reproduce the simulation results very well. The magenta and olive dashed lines indicate the analytical zero net flux solutions that depart from the values of the steady accretion solution, given by Eq. (46), at the annealing and snow lines, respectively. The radial power-law index of the zero net flux solution () is given by (Eq. (49)) where and in the viscous-heating dominated regime and and in the irradiation dominated regime (Eq. 57). The sum of numerically obtained silicate surface densities of the crystalline (the orange line) and amorphous (the blue line) agrees with the analytical steady accretion solution inside the snow line. Taking account of the decrease due to the transformation from amorphous to crystalline silicates at , the simulation result shows that the amorphous and crystalline silicate surface densities individually follow the steady accretion solution inside the snow and annealing lines, respectively. On the other hand, they fit with the zero net flux solution outside the snow and annealing lines, respectively. In Figure 4b, we adopt , so that is 10 times longer and has not reached the equilibrium state beyond the snow line. Therefore, the equilibrium surface densities of crystalline silicates and the sum of crystalline and amorphous silicates obtained by the Monte Carlo simulations are fitted as
| (58) |
and
| (59) |
where
| (60) |
At , because ,
| (61) |
These surface density distributions are physically interpreted as follows. We release amorphous silicate particles at the snow line. While the outward diffusion length increases with the square root of , inward drift length due to disk gas accretion increases with . Eventually, they balance to establish an equilibrium zero net flux distribution. After that, the total mass flux of the particles injected at different times that are passing the inner edge becomes equal to the given injection mass flux at the snow line (). Thereby, amorphous silicate surface density follows the zero net flux solution outside the snow line and the steady accretion solution inside it. At the annealing line, crystalline silicate particles are generated from the drifting amorphous silicate particles with mass flux , which is similar to the injection of silicate particles at the snow line due to ice sublimation. Accordingly, crystalline silicate surface density follows the zero net flux solution outside the annealing line and the steady accretion solution inside it.
Equations (58) and (59) show that for , independent of ,
| (62) |
When the snow line is within the viscous heating dominated region, . Equation (62) shows . We note that the value of depends only on radial gradient of . It is independent of other detailed disk parameters, such as and , and pebble parameters, such as , , and as long as . This robust, predicted value of the crystalline abundance in silicates in this simple case, , is smaller than the observationally inferred abundance, in Sitko et al. (2011) and –0.6 in Shinnaka et al. (2018). It strongly suggests that the effects of sticking to drifting pebbles and time-dependent must be incorporated into the simulations to predict the crystalline abundance in comets.
4.2 Case with sticking to icy pebbles
Figure 5 shows the results with the effect of sticking to pebbles after the establishment of an equilibrium state. Comparing to the simple case without the sticking effect (section 4.1), the decay of the silicate surface densities with is faster outside the snow line, by the effect of rapid inward drift with after the sticking. The radial gradient of the silicate surface densities outside the snow line are analytically predicted by Eq. (56) as for and for in the viscous-heating dominated regime. In the irradiation dominated regime, is larger by . The numerical results agree with the analytical prediction. Silicate particles have a steeper radial gradient than that without the effect of the sticking to pebbles (the power-law index is larger by ). However, because we assume that the sticking probability is the same for crystalline and amorphous silicates, their surface density distributions are smaller by the same factor as in the non-sticking case, and is still given by Eq. (62) as .
So far, we have considered a time-independent pebble mass flux, equivalently, a time-independent sticking probability. However, the pebble flux should start decaying after the pebble formation front reaches the characteristic disk size and the solid materials in the disk are reduced. Because the sticking effect substantially modifies the silicate surface density outside the snow line, the time dependence of the pebble flux changes the ratio, which we investigate below.
4.3 Case with decaying pebble flux
Sato et al. (2016) and Ida et al. (2019) showed that icy pebble flux decays rapidly after the pebble formation front reaches the characteristic disk radius () at years, in the fast limit of pebble growth with perfect accretion. According to this result, we perform simulations in which the pebble flux starts decaying from the steady distribution in section 4.2. We set the decaying pebble flux as
| (63) |
where is the time from which the decay is switched on at and is the decay timescale with a typical value of a few years in the case of (Sato et al., 2016; Ida et al., 2019). We also perform a simulation with as an extreme case, which means sudden truncation of pebble flux. To keep the mass of individual super-particles unchanged, we inject particles with a time interval, .
As shown in section 4.1, the typical timescale for crystalline silicates to return to the snow line, after they are released at the snow line and pass the annealing line, is
| (64) |
Most of the amorphous silicates beyond the snow line may directly diffuse out from the snow line. It is expected that crystalline silicates beyond the snow line were released earlier on average by than amorphous silicates there. Because the crystalline silicate distribution would reflect an earlier pebble flux, for decaying would be higher than the ratio in the case of the time-independent (Eq. (62)).
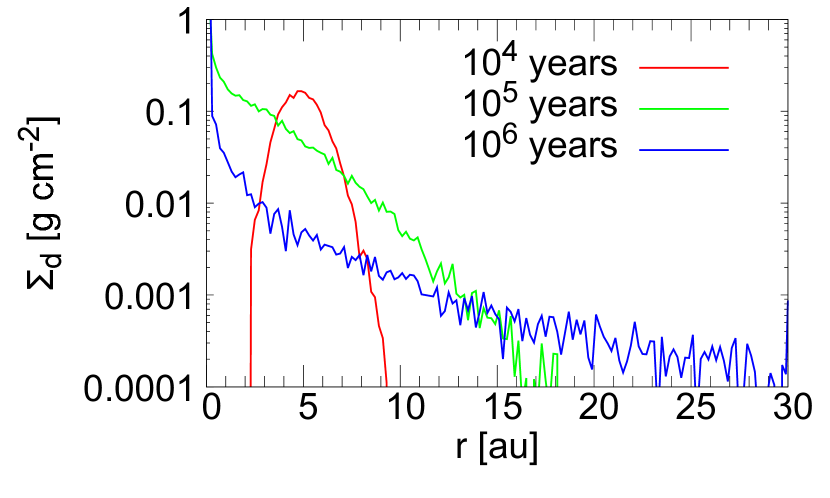
According to the above prediction, we perform simulations with various values of relative to , from the equilibrium states with . Figure 6 show the distributions of and at of (a) , (b) years (), (c) years (), and (d) years (), for and . We also show (e) the initial equilibrium state, which corresponds to . The ratio is almost independent of at in all the panels, although and individually decay according to the decay of the pebble mass flux. Because the pebbles capturing the silicate particles also decay, both the crystalline and amorphous silicates extend to outer regions with time. The asymptotic value of is (a) 0.25, (b) 0.20, (c) 0.13, (d) 0.10, and (e) 0.05. It increases with the decrease in , because the pebble fluxes reflected by the crystalline and amorphous silicate distributions are more different for more rapid pebble flux decay with smaller . Because the diffusion effect smooths out the contrast in the pebble fluxes, is saturated at even in the limit of .
The observationally inferred crystalline abundance of comets is in Sitko et al. (2011) and –0.6 in Shinnaka et al. (2018) (section1). Figure 6 show that our simulations predict the abundance of crystalline silicates is –0.25 for , while it is for . The relatively fast decay with produces the results that may be consistent with the observed abundance. Ida et al. (2019) showed that is a few years for a relatively compact disk with , which can be comparable to for (Eq. (64)). The consistency with the observed data is discussed more in the next section.
5 Conclusion and Discussion
Crystalline silicates found in comets should have been formed in the disk inner region. One of the possible transfer mechanisms of the crystalline silicates to the disk outer region where cometary cores were formed is radial diffusion of silicate dust particles due to disk gas turbulence (Ciesla, 2011). However, Ciesla (2011) did not present a quantitative estimate of the crystalline abundance for the comparison with the observations of comets has not been done, because the supply mechanism of amorphous and crystalline silicate particles during planet formation was not specified. Pavlyuchenkov & Dullemond (2007) and Arakawa et al. (2021) discussed an equilibrium radial distribution of crystalline materials. Because they assumed that amorphous silicates have a stationary distribution with the uniform solid-to-gas ratio in the steady accretion disk, they found that crystalline abundance is generally very low well beyond the snow line. However, the radial distribution of amorphous silicates must be derived by planet formation model for a qualitative estimate of crystalline abundance.
In this paper, adopting the “pebble accretion” model, we have performed Monte Carlo simulations, taking into account the release of silicate dust particles from pebbles at the snow line at , transformation of amorphous silicate particles to crystalline particles at the annealing line at , sticking of silicate particles onto drifting pebbles beyond the snow line, and attenuation of the pebble flux due to consumption of solid material reservoir in the disk outer region. For the gas disk, a steady accretion model with viscous heating and irradiation from the host star is assumed. With this setting, we can quantitatively calculate the abundance of crystalline materials in all the silicate dust particles beyond the snow line.
In the simple case without sticking silicate particles onto drifting pebbles and with a steady pebble accretion, we found through the Monte Carlo simulation and analytical argument that the surface density of crystalline silicates scaled by the total surface density of crystalline and amorphous silicates is given by uniformly beyond the snow line, independent of disk parameters and silicate particle size, as long as (where is the viscosity parameter and St is Stokes number of the silicate particles). The validity of the condition, , is discussed in Appendix. When the viscous heating dominates at , and the crystalline abundance is %. Although this robust value is substantially lower than the observationally inferred values, we found that with a more realistic condition where the sticking to icy pebbles and the pebble flux decay are included, the crystalline silicate abundance rises up to 20–25%.
Our simulation shows that the crystalline silicate abundance outside the snow line is independent of distance from the central star, . This result is different from the results by Pavlyuchenkov & Dullemond (2007) and Arakawa et al. (2021), which showed the crystalline abundance decrease as becomes larger. This difference results from the initial distribution of amorphous silicates. Because amorphous silicates are released from sublimating pebbles at the snow line, the radial gradient of the surface density is the same for both crystalline and amorphous silicates, in the framework of the pebble accretion scenario. The observationally inferred abundance has dispersion among comets of 10–60% (e.g., Shinnaka et al., 2018), although observations would include some uncertainty. There may be other factors that change the abundance, such as the evolution of a disk.
We note that annealing can proceed even if (e.g., Yamamoto & Tachibana, 2018; Ciesla, 2011, and references therein), while we assumed that amorphous silicates are annealed immediately at for simplicity. Whether or not they are annealed is determined by how long they experienced individual temperature. It could increase the crystalline silicate abundance from that obtained with the simple treatment at , as well as increase the dispersion among comets. Because we track the particle motions including random walks due to gas turbulence, we can evaluate the progress of annealing for individual particles, which is left for our next paper.
In this paper, we assume a simple steady accretion disk, in order to highlight the physics associated with the pebble accretion model. In an early disk expansion phase, the snow and annealing lines are farther from the host star and crystalline silicates can be dragged to outer regions by the expanding disk gas (Ciesla, 2011). However, if the dust particle diffusion timescale is shorter than the disk evolution timescale, the distribution of crystalline silicates would become the same as that in a steady accretion disk. The value in the local turbulent diffusion can be much smaller than the effective value for global disk gas accretion (angular momentum transfer) (e.g., Armitage et al., 2013; Hasegawa et al., 2017). The simulations coupled with the disk evolution are left to future study.
Ida et al. (2021) considered the disk model with two different effective parameters, one for disk accretion () and the other for turbulent diffusion (), because it is possible that the disk accretion is regulated by disk wind angular momentum removal rather than turbulent-diffusion angular momentum transfer. They showed that small silicate dust particles released from sublimating icy pebbles undergo gravitational collapse into rocky planetesimals just inside the snow line, if and pebble mass flux is relatively high. In the case of , crystalline silicate particles hardly diffuse out to regions much beyond the snow line. Relatively active disk wind and relatively high pebble mass flux would be realized in an early disk evolution phase, implying that rocky planetesimal formation by this mechanism is preferred to occur in the early phase. It could correspond to the formation of parent bodies of iron/stony meteorites. A later phase, in which the disk wind decays () and the pebble mass flux decreases, may correspond to the situation in Section 4.3. In this case, the rocky planetesimal formation does not occur with Ida et al. (2021)’s mechanism. If rocky protoplanets in the terrestrial planet region have not fully grown beyond the asteroid parent body size, accretion of small dust particles is inefficient (e.g., Guillot et al., 2014) and the crystalline silicate particles diffuse out to regions much beyond the snow line. If cometary cores are formed through icy planetesimal formation in this timing, the cometary cores can include crystalline particles up to 20-25%. More discussions on a consistent scenario for rocky and icy planetesimal formation are left for future work.
Appendix A Silicate dust’s Stokes number and size with the fragmentation limit
We set the silicate particle’s Stokes number as . Silicate particles can grow to some degree and accordingly their Stokes number can increase, after the release from sublimating icy pebbles. However, the results here do not change, as long as diffusion is dominated over advection due to gas drag for silicate dust particles (). Here we estimate the maximum Stokes number of silicate particles, when the fragmentation limit is applied. As explained below, is likely to be safely smaller than for a steady accretion disk with our fiducial parameters, and .
The relative velocity is regulated by turbulent diffusion for (e.g., Sato et al., 2016). In this case,
| (A1) |
Because increases with the particle physical radius , the particle growth is limited when exceeds a threshold fragmentation velocity . The maximum Stokes number for the fragmentation limit is given by as
| (A2) |
where we scale by a typical value of for silicate-silicate collisions (e.g., Wada et al., 2013). In the region near or inside the snow line that we are mainly concerned, viscous heating is dominant (see section 2.1). Substituting in the viscous heating region (Eq. (1)) into the above equation, we obtain
| (A3) |
For the fiducial parameters, and , in our disk model, inside the snow line. Even if is used, is still smaller than . Therefore, our assumption that we simply set for silicate particles is justified. We refer to this estimate in sections 1, 2.2.1, 4.1, and 5.
If and are assumed, . We note that this is at a few au and our assumption of diffusion-dominance is marginal.
The particle physical radius corresponding to is as follows. Stokes number of a particle with the bulk density which follows Epstein’s law is given by
| (A4) |
where , and are the spatial and surface densities of the disk and the pressure scale height, respectively. Substituting into this equation, the typical particle size with the fragmentation limit of in the viscous heating dominated regime is estimated as
| (A5) | ||||
| (A6) |
In outer disk regions, where pebbles are formed, irradiation would be dominated. In this case, and (section 2.1). Accordingly, . It means that silicate particles formed in outer regions to be embedded in pebbles are much smaller than that at the snow line. After their release at the snow line, they can grow up to the size given in Eq. (A6). The size released at a few au is for and for .
References
- Arakawa et al. (2021) Arakawa, S., Matsumoto, Y., & Honda, M. 2021, ApJ, 920, 27, doi: 10.3847/1538-4357/ac157e
- Armitage et al. (2013) Armitage, P. J., Simon, J. B., & Martin, R. G. 2013, ApJ, 778, L14, doi: 10.1088/2041-8205/778/1/L14
- Blum & Wurm (2000) Blum, J., & Wurm, G. 2000, Icarus, 143, 138, doi: 10.1006/icar.1999.6234
- Bockelée-Morvan et al. (2002) Bockelée-Morvan, D., Gautier, D., Hersant, F., Huré, J. M., & Robert, F. 2002, A&A, 384, 1107, doi: 10.1051/0004-6361:20020086
- Brownlee et al. (2006) Brownlee, D., Tsou, P., Aléon, J., et al. 2006, Science, 314, 1711, doi: 10.1126/science.1135840
- Ciesla (2007) Ciesla, F. J. 2007, Science, 318, 613, doi: 10.1126/science.1147273
- Ciesla (2010) —. 2010, ApJ, 723, 514, doi: 10.1088/0004-637X/723/1/514
- Ciesla (2011) —. 2011, ApJ, 740, 9, doi: 10.1088/0004-637X/740/1/9
- Cuzzi et al. (2003) Cuzzi, J. N., Davis, S. S., & Dobrovolskis, A. R. 2003, Icarus, 166, 385, doi: 10.1016/j.icarus.2003.08.016
- Desch (2007) Desch, S. J. 2007, ApJ, 671, 878, doi: 10.1086/522825
- Dones et al. (2015) Dones, L., Brasser, R., Kaib, N., & Rickman, H. 2015, Space Sci. Rev., 197, 191, doi: 10.1007/s11214-015-0223-2
- Dubrulle et al. (1995) Dubrulle, B., Morfill, G., & Sterzik, M. 1995, Icarus, 114, 237, doi: 10.1006/icar.1995.1058
- Gail (2001) Gail, H. P. 2001, A&A, 378, 192, doi: 10.1051/0004-6361:20011130
- Guillot et al. (2014) Guillot, T., Ida, S., & Ormel, C. W. 2014, A&A, 572, A72, doi: 10.1051/0004-6361/201323021
- Gundlach & Blum (2015) Gundlach, B., & Blum, J. 2015, ApJ, 798, 34, doi: 10.1088/0004-637X/798/1/34
- Gundlach et al. (2018) Gundlach, B., Schmidt, K. P., Kreuzig, C., et al. 2018, MNRAS, 479, 1273, doi: 10.1093/mnras/sty1550
- Harker et al. (2011) Harker, D. E., Woodward, C. E., Kelley, M. S., et al. 2011, AJ, 141, 26, doi: 10.1088/0004-6256/141/1/26
- Hasegawa et al. (2017) Hasegawa, Y., Okuzumi, S., Flock, M., & Turner, N. J. 2017, ApJ, 845, 31, doi: 10.3847/1538-4357/aa7d55
- Hyodo et al. (2019) Hyodo, R., Ida, S., & Charnoz, S. 2019, A&A, 629, A90, doi: 10.1051/0004-6361/201935935
- Ida & Guillot (2016) Ida, S., & Guillot, T. 2016, A&A, 596, L3, doi: 10.1051/0004-6361/201629680
- Ida et al. (2021) Ida, S., Guillot, T., Hyodo, R., Okuzumi, S., & Youdin, A. N. 2021, A&A, 646, A13, doi: 10.1051/0004-6361/202039705
- Ida et al. (2016) Ida, S., Guillot, T., & Morbidelli, A. 2016, A&A, 591, A72, doi: 10.1051/0004-6361/201628099
- Ida et al. (2019) Ida, S., Yamamura, T., & Okuzumi, S. 2019, A&A, 624, A28, doi: 10.1051/0004-6361/201834556
- Keller & Gail (2004) Keller, C., & Gail, H. P. 2004, A&A, 415, 1177, doi: 10.1051/0004-6361:20034629
- Kimura et al. (2015) Kimura, H., Wada, K., Senshu, H., & Kobayashi, H. 2015, ApJ, 812, 67, doi: 10.1088/0004-637X/812/1/67
- Lambrechts & Johansen (2014) Lambrechts, M., & Johansen, A. 2014, A&A, 572, A107, doi: 10.1051/0004-6361/201424343
- Misener et al. (2019) Misener, W., Krijt, S., & Ciesla, F. J. 2019, ApJ, 885, 118, doi: 10.3847/1538-4357/ab4a13
- Morbidelli et al. (2015) Morbidelli, A., Lambrechts, M., Jacobson, S., & Bitsch, B. 2015, Icarus, 258, 418, doi: 10.1016/j.icarus.2015.06.003
- Musiolik & Wurm (2019) Musiolik, G., & Wurm, G. 2019, ApJ, 873, 58, doi: 10.3847/1538-4357/ab0428
- Oka et al. (2011) Oka, A., Nakamoto, T., & Ida, S. 2011, ApJ, 738, 141, doi: 10.1088/0004-637X/738/2/141
- Ormel & Klahr (2010) Ormel, C. W., & Klahr, H. H. 2010, A&A, 520, A43, doi: 10.1051/0004-6361/201014903
- Pavlyuchenkov & Dullemond (2007) Pavlyuchenkov, Y., & Dullemond, C. P. 2007, A&A, 471, 833, doi: 10.1051/0004-6361:20077317
- Saito & Sirono (2011) Saito, E., & Sirono, S.-i. 2011, ApJ, 728, 20, doi: 10.1088/0004-637X/728/1/20
- Sato et al. (2016) Sato, T., Okuzumi, S., & Ida, S. 2016, A&A, 589, A15, doi: 10.1051/0004-6361/201527069
- Schoonenberg & Ormel (2017) Schoonenberg, D., & Ormel, C. W. 2017, A&A, 602, A21, doi: 10.1051/0004-6361/201630013
- Shinnaka et al. (2018) Shinnaka, Y., Ootsubo, T., Kawakita, H., et al. 2018, AJ, 156, 242, doi: 10.3847/1538-3881/aadfea
- Shu et al. (1996) Shu, F. H., Shang, H., & Lee, T. 1996, Science, 271, 1545, doi: 10.1126/science.271.5255.1545
- Sitko et al. (2011) Sitko, M. L., Lisse, C. M., Kelley, M. S., et al. 2011, AJ, 142, 80, doi: 10.1088/0004-6256/142/3/80
- Steinpilz et al. (2019) Steinpilz, T., Teiser, J., & Wurm, G. 2019, ApJ, 874, 60, doi: 10.3847/1538-4357/ab07bb
- Wada et al. (2013) Wada, K., Tanaka, H., Okuzumi, S., et al. 2013, A&A, 559, A62, doi: 10.1051/0004-6361/201322259
- Wada et al. (2011) Wada, K., Tanaka, H., Suyama, T., Kimura, H., & Yamamoto, T. 2011, ApJ, 737, 36, doi: 10.1088/0004-637X/737/1/36
- Wooden (2008) Wooden, D. H. 2008, Space Sci. Rev., 138, 75, doi: 10.1007/s11214-008-9424-2
- Yamamoto & Tachibana (2018) Yamamoto, D., & Tachibana, S. 2018, ACS Earth and Space Chemistry, 2, 778, doi: 10.1021/acsearthspacechem.8b00047
- Youdin & Lithwick (2007) Youdin, A. N., & Lithwick, Y. 2007, Icarus, 192, 588, doi: 10.1016/j.icarus.2007.07.012
- Zsom et al. (2011) Zsom, A., Sándor, Z., & Dullemond, C. P. 2011, A&A, 527, A10, doi: 10.1051/0004-6361/201015434