Spatially resolved optical spectroscopy in extreme environment of low temperature, high magnetic fields and high pressure
Abstract
We present an experimental set-up developed to perform optical spectroscopy experiments (Raman scattering and photoluminescence measurements) with a micrometer spatial resolution, in an extreme environment of low temperature, high magnetic field and high pressure. This unique experimental setup, to the best of our knowledge, allows us to explore deeply the phase diagram of condensed matter systems by tuning independently these three thermodynamic parameters, while monitoring the low-energy excitations (electronic, phononic or magnetic excitations), to spatially map the Raman scattering response or to investigate objects with low dimensions. We apply this technique to bulk FePS3, a layered antiferromagnet with a Néel temperature of K.
I Introduction
Extreme conditions of low temperatures, high magnetic field, high pressure or high doping, in condensed matter physics are sought-after as they allow us to drive electronic systems into exotic electronic ground states that cannot exist/emerge in other conditions. Relevant examples of such ground states include the appearance of superconductivity in metals at cryogenic temperatures or in ultra-doped two dimensional semiconductors Costanzo et al. (2016), magnetic orders that build up in magnetic materials below a critical temperature and once established, require high external magnetic fields to be altered Hagiwara et al. (1999), pressure induced superconductivity such as, for instance, in Fe-based compounds like FePSe3 Wang et al. (2018), or the coupling between different electronic ground states such as superconductivity and charge density wave in transition metal dichalcogenides like TaS2 Grasset et al. (2019). Particular condensed matter systems also exhibit a rich phase diagram with a triple quantum critical endpoint that can only be established in well-defined pressure-temperature-magnetic field conditions Mackenzie (2005). Reaching such extreme experimental conditions to perform spatially resolved optical spectroscopy can be a real challenge, and combining them within the same experiment is of course even more challenging.
In the last fifteen years, microscopic techniques have been implemented in low-temperature and high-magnetic-field environments produced by resistive solenoids, mainly thanks to the development of commercial piezo inertial motors Meyer et al. (2005) compatible with cryogenic temperature and high magnetic fields, and allowing for sub-micrometer displacements Berciaud, Potemski, and Faugeras (2014); Kim et al. (2013); Liu et al. (2021). This opened the possibility to perform spatially resolved experiments at low temperatures such as magneto-photoluminescence, -reflectance, -Raman scattering, also with time resolution Zhang et al. (2017). High pressures can be obtained using a Diamond Anvil Cell (DAC) Jayaraman (1983), which is also compatible with optical measurements as diamond is transparent over a broad interval of energy including the visible and infrared ranges. A recent example is the optical investigation at room temperature of a van der Waals heterobilayer in a DAC for pressures up to GPa, see Ref. [Xia et al., 2021]. Low temperatures for optical measurements with a DAC can be achieved in He4 environments with Hudl et al. (2015) or without Li et al. (2020) moderate magnetic fields.
In this manuscript, we present an experimental setup for optical measurements with a micrometer spatial resolution in an extreme environment of low temperature (He4 cryostat), high magnetic fields (compatible with -mm bore resistive magnets at LNCMI-Grenoble producing fields up to T) and high pressure with the use of a DAC. This system allows for spatial mapping of the optical response in such conditions, or to investigate the optical response at a specific location (nanostructures, patterned surface, etc …) while tuning the extreme conditions.
II Experimental setup
Our experimental setup is presented in Fig. 1a and was conceived to be used in a mm bore resistive magnet at LNCMI-G. This environment imposes a strong spatial constraint as the field center is located mm from the top of the magnet, within a bore of mm. Our setup includes a miniaturized optical table fixed at the top of the experimental probe, and a m tube with an inner diameter of mm, and hosting the sample holder. We use a monomode optical fiber, at room temperature, to connect the excitation laser source to the top of the probe in order to minimize the effect of vibrations caused by the large flow of deionized water Debray and Frings (2013) (up to m3.h-1) used to cool down resistive magnets. The excitation beam at the output of the fiber is collimated by an optical lens, cleaned by a reflection on a volume Bragg filter for photoluminescence or Raman scattering experiments, and then, it is sent to the sample holder via a carbon-fiber tube, after a reflection on a beam-splitter. For reflectivity measurement, the volume Bragg filter is replaced by a mirror and the laser source by a white lamp. Polarization optics and optical filters can be used in the excitation or in the collection path.

A circular or linear polarization can be imposed before the last reflection on the beam splitter. The collimated excitation beam is then focused on the pressure cell with a mm working distance objective of numerical aperture NA=. The spot size offers a micrometer spatial resolution. A schematic of this part of the probe is presented in Fig. 1c. The DAC is of the Tozer design Graf et al. (2011). It is made of Cu-Be and it weights around g in total (see Fig. 1b). This small weight allows us to mount it on piezo stages and to move the DAC below the laser spot with a sub-micrometer spatial resolution. Spatially resolved and hyperspectral images of the optical response of the sample within the DAC can then be reconstructed by spatially scanning the DAC below the laser spot. The optical response is collected with the same objective, goes through the beam splitter and is sent to the detection system using free beam optics. For low-energy (below cm-1) Raman scattering measurements, we use three volume Bragg filters in series before the detection system to reject the stray light. For low temperature experiments, the tube holding the objective-DAC-piezo stages is placed in a closed metallic tube ( mm diameter) filled with to mbar of helium exchange gas for an efficient thermal coupling. The tube is then immersed in a bath of liquid helium in a mm cryostat routinely used in the mm bore of resistive or superconducting magnets. A local heater/thermometer is inserted below the DAC to allow for tuning temperature up to K in the previously described conditions.

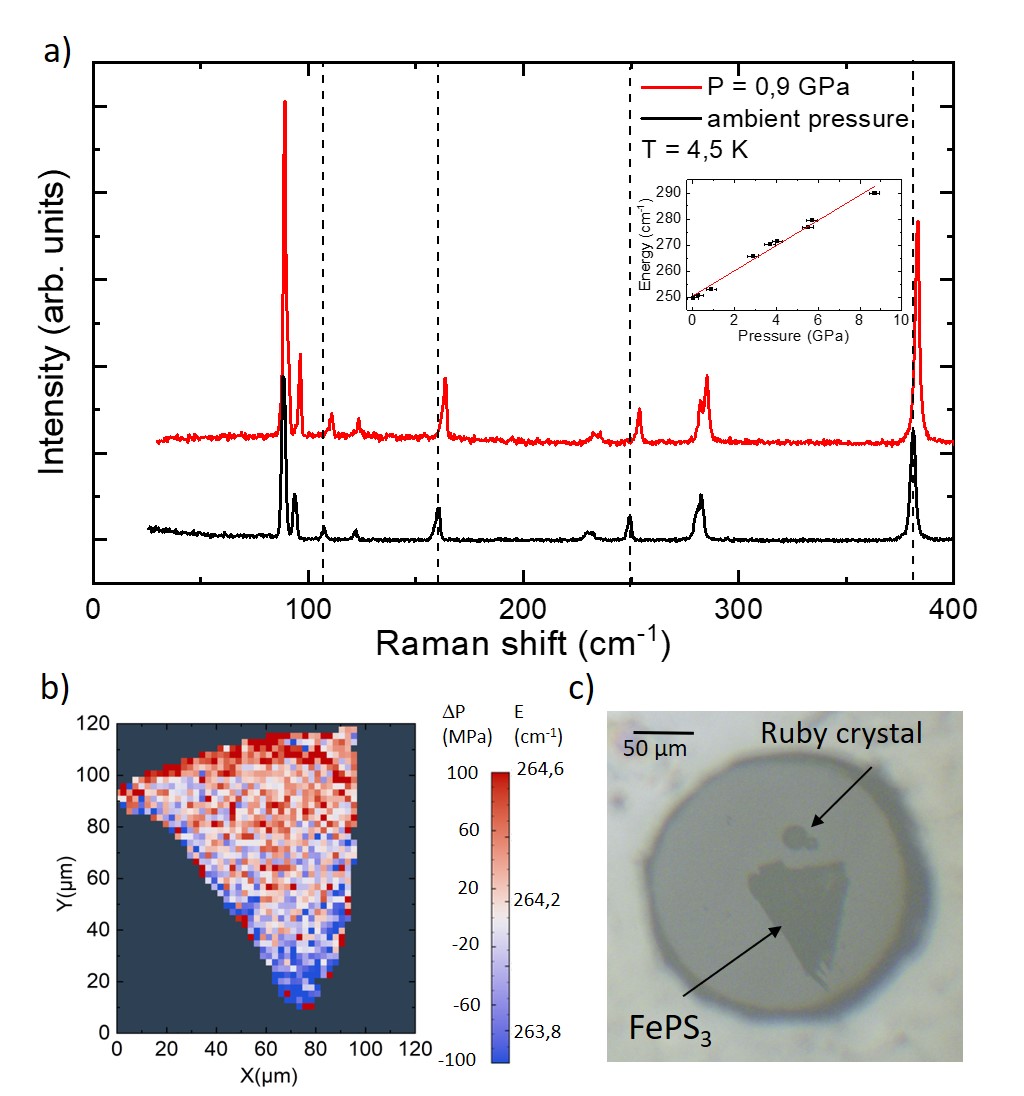
The gasket has been indented and compressed down to a thickness of m and a hole of m was drilled in its center. The test sample, a triangular flake of bulk FePS3, a layered antiferromagnet, was placed in the hole together with two ruby balls used to measure the pressure Syassen (2008). DAC require the use of a pressure transmitting medium (PTM) and we have used a liquid PTM, a mixture of ethanol and methanol (1:4 in volume) expected to remain hydrostatic up to GPa, see Ref [Klotz et al., 2009]. At K, the Raman scattering response of this PTM in the pressure cell is displayed in Fig. 2a. The phonon of diamond is clearly visible at cm-1, together with the response of the PTM Emin, Hushur, and Mamtimin (2020). Two energy bands are affected by the response of the PTM, a weak intensity band between and cm-1 and a more intense band between and cm-1. In the inset, we highlight the fact that the optical response of this PTM close to the laser line (below cm-1 where most phonon and magnon energies in condensed matter system are found) is nearly featureless, being only composed of a smooth background and allowing for low-energy Raman scattering experiments, see the inset of Fig. 2a. These signals are negligible when looking at luminescence signals from direct-band-gap semiconducting materials. The pressure value can be determined by placing the laser spot on the ruby crystal and measuring its photoluminescence signal Mao et al. (2018). Fig. 2b shows three low temperature spectra of the ruby crystal in the pressure chamber, at selected pressure values.
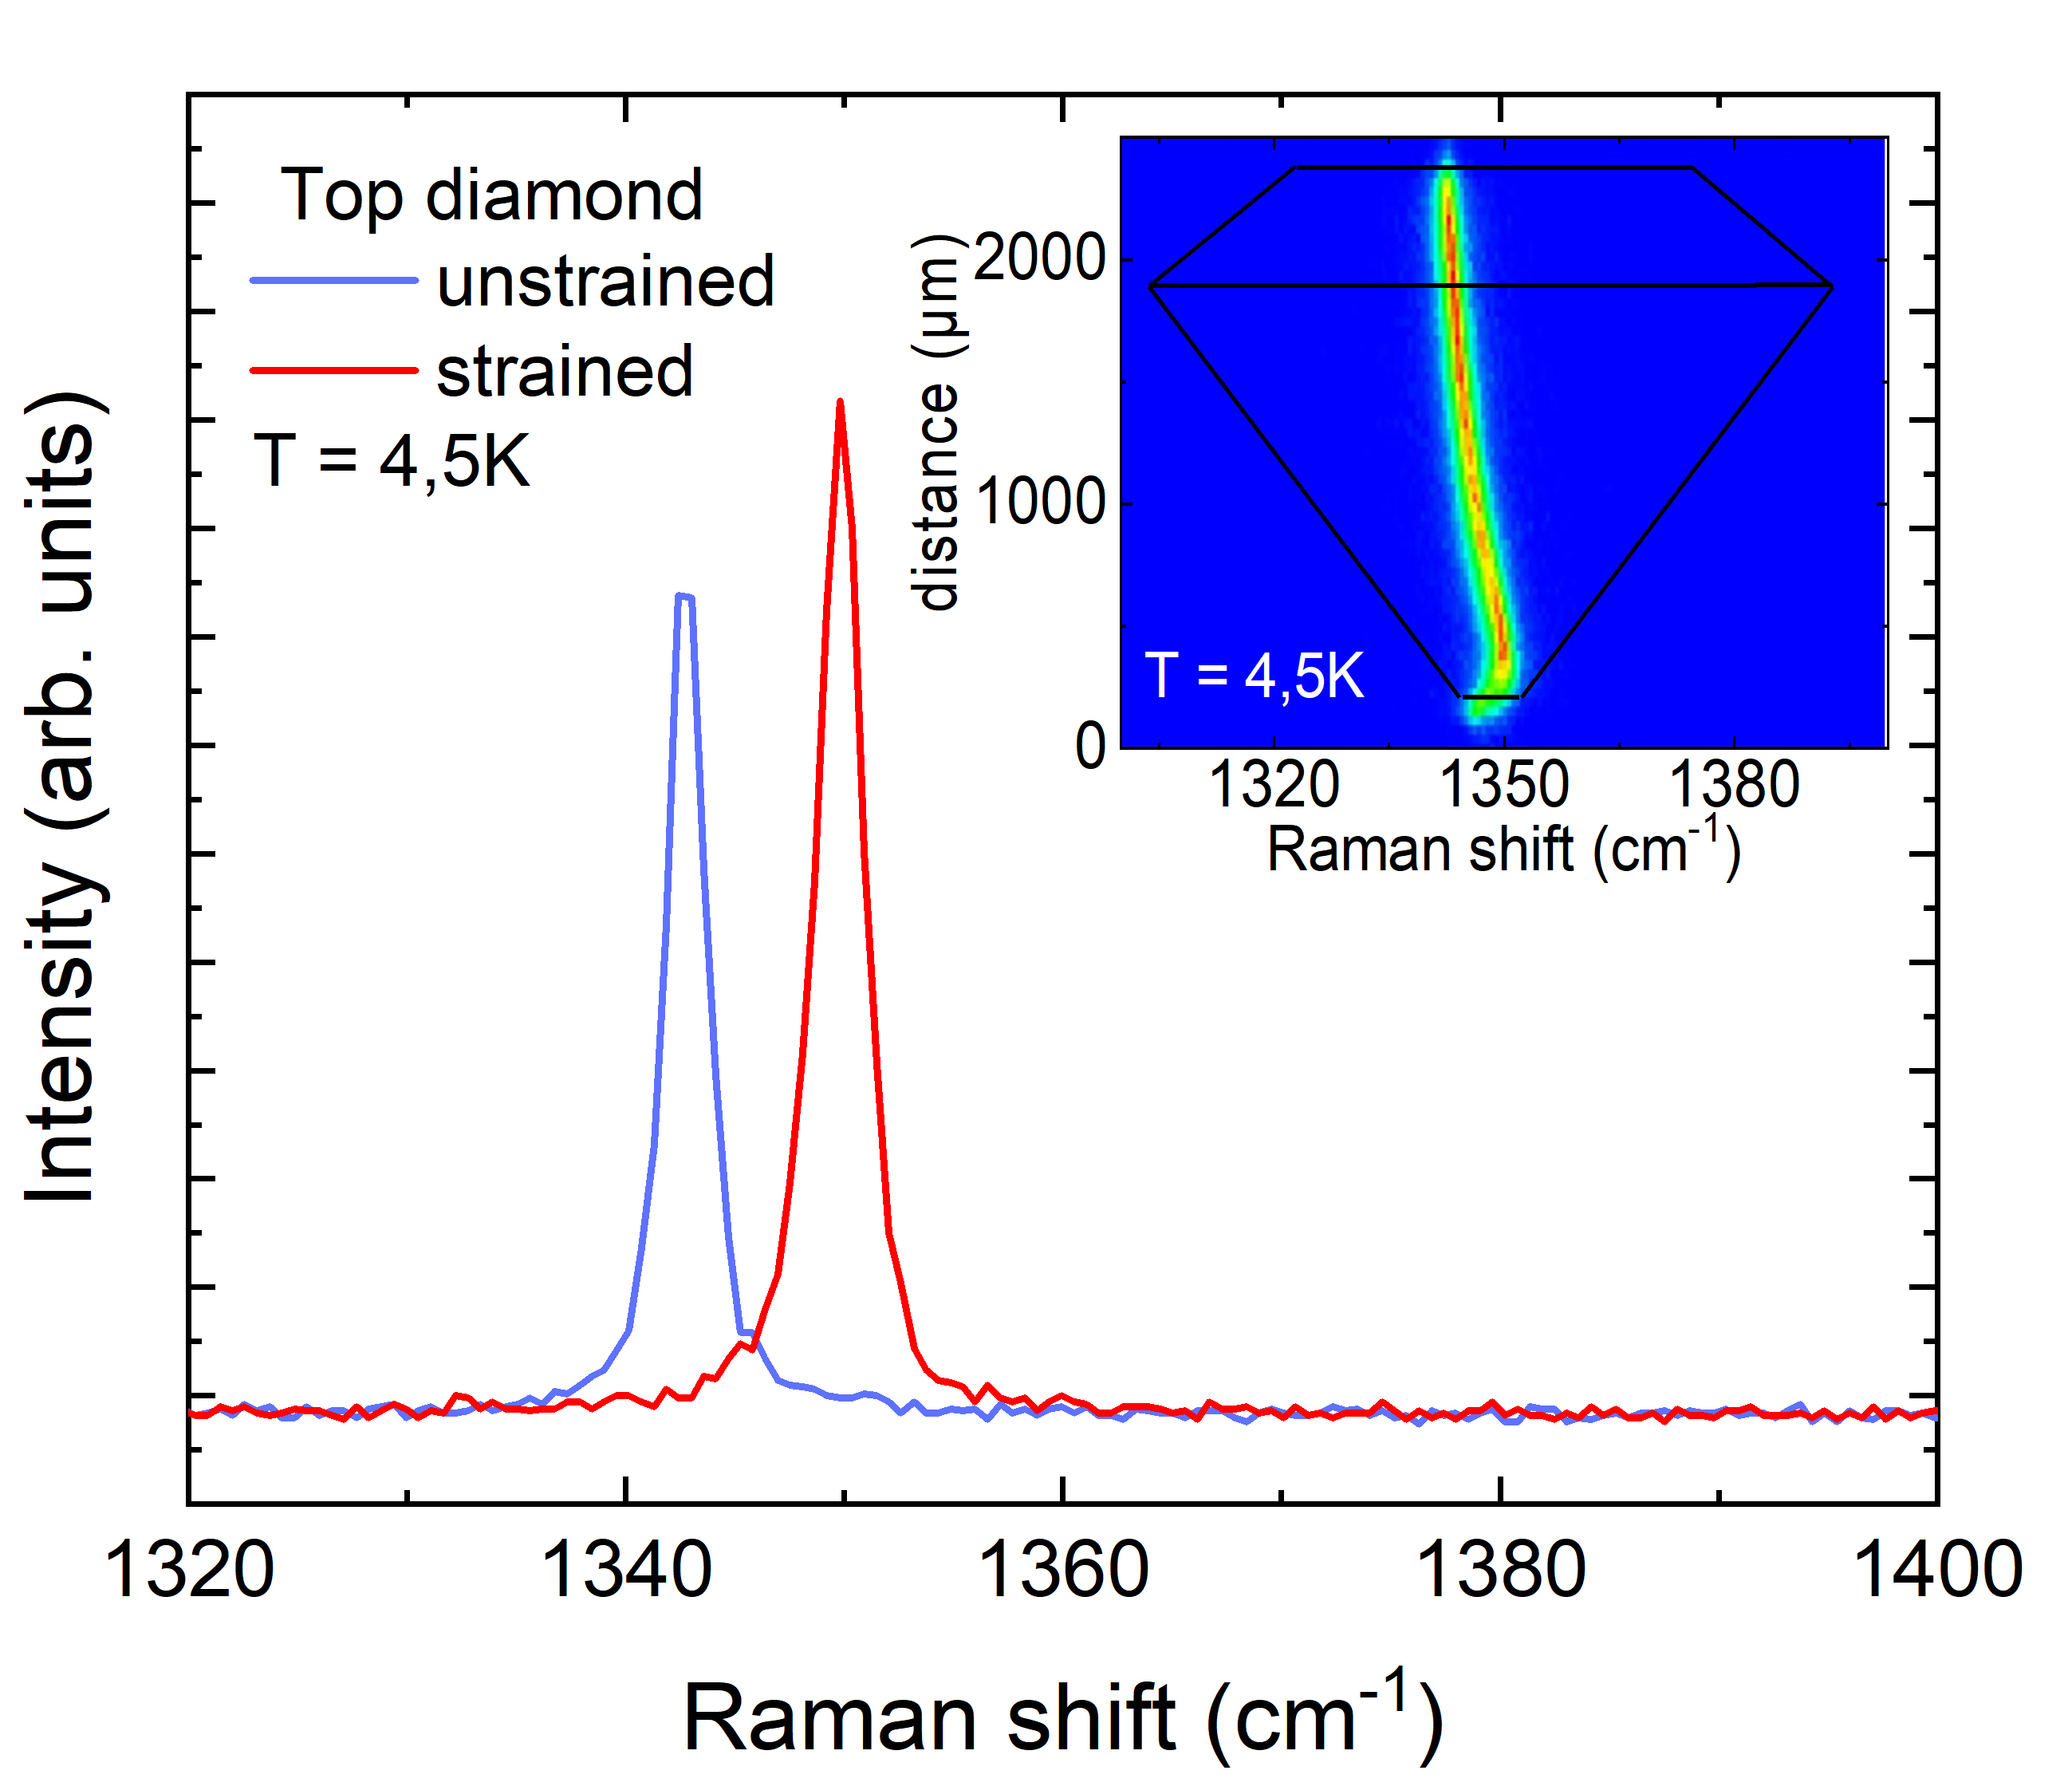
Finally, despite the fact that our experimental setup is not confocal, still, the optical response has a depth selectivity which allows us to identify, from the response, if we are focusing on the pressure chamber or not. This can be seen in Fig. 3 which displays two characteristic Raman scattering spectra of the top diamond of the DAC. At K, depending on the relative distance between the objective and the pressure cell, we can observe changes in the energy position of the doubly degenerate LO-TO phonon at the point of diamond, representative of the strain. The strain evolves continuously when focusing deeper into the top diamond, as it is shown in the inset of Fig. 3, and reaches a maximum at the pressure chamber location mm below the top surface of the top diamond of the anvil. This effect allows us to identify the correct objective-DAC distance in our experimental setup in which no optical imaging is implemented. After fixing the focus distance, one can spatially map the optical response to locate the ruby crystals in the pressure chamber.
III Results
The low-temperature Raman scattering response of FePS3 includes a doubly degenerate antiferromagnetic magnon excitation close to cm-1 identified by both its peculiar temperature dependence Sekine et al. (1990), and recently, by its evolution with an applied magnetic field McCreary et al. (2020); Liu et al. (2021); Vaclavkova et al. (2021). The properties of FePS3 under pressure have been described recently from the viewpoints of X-ray diffraction Haines et al. (2018) and of neutron scattering Coak et al. (2021). We present in Fig. 4a two low-temperature Raman scattering spectra of FePS3 measured at ambient pressure (black line), and in the DAC with an applied pressure of GPa (red line). The effect of pressure can be seen through the hardening of the phonon modes. Our experimental setup allows for a spatial mapping of the Raman scattering response and this possibility is displayed in Fig. 4b with a falsed color spatial map of the energy position of the phonon near cm-1 at GPa. One can compare this mapping of the Raman scattering response with the optical photograph of the pressure chamber in Fig. 4c. Our Raman scattering data at different pressures up to GPa presented in the inset Fig. 4a, indicate that this phonon energy changes with a rate of cm-1/GPa. One can clearly see a gradual change of the phonon energy along the flake, and hence of the effective pressure in the chamber. These data indicate that the pressure is larger in the middle of the chamber than at its borders, close to the metallic gasket, and this pressure difference is evaluated to be GPa from the center of the chamber to its edge.
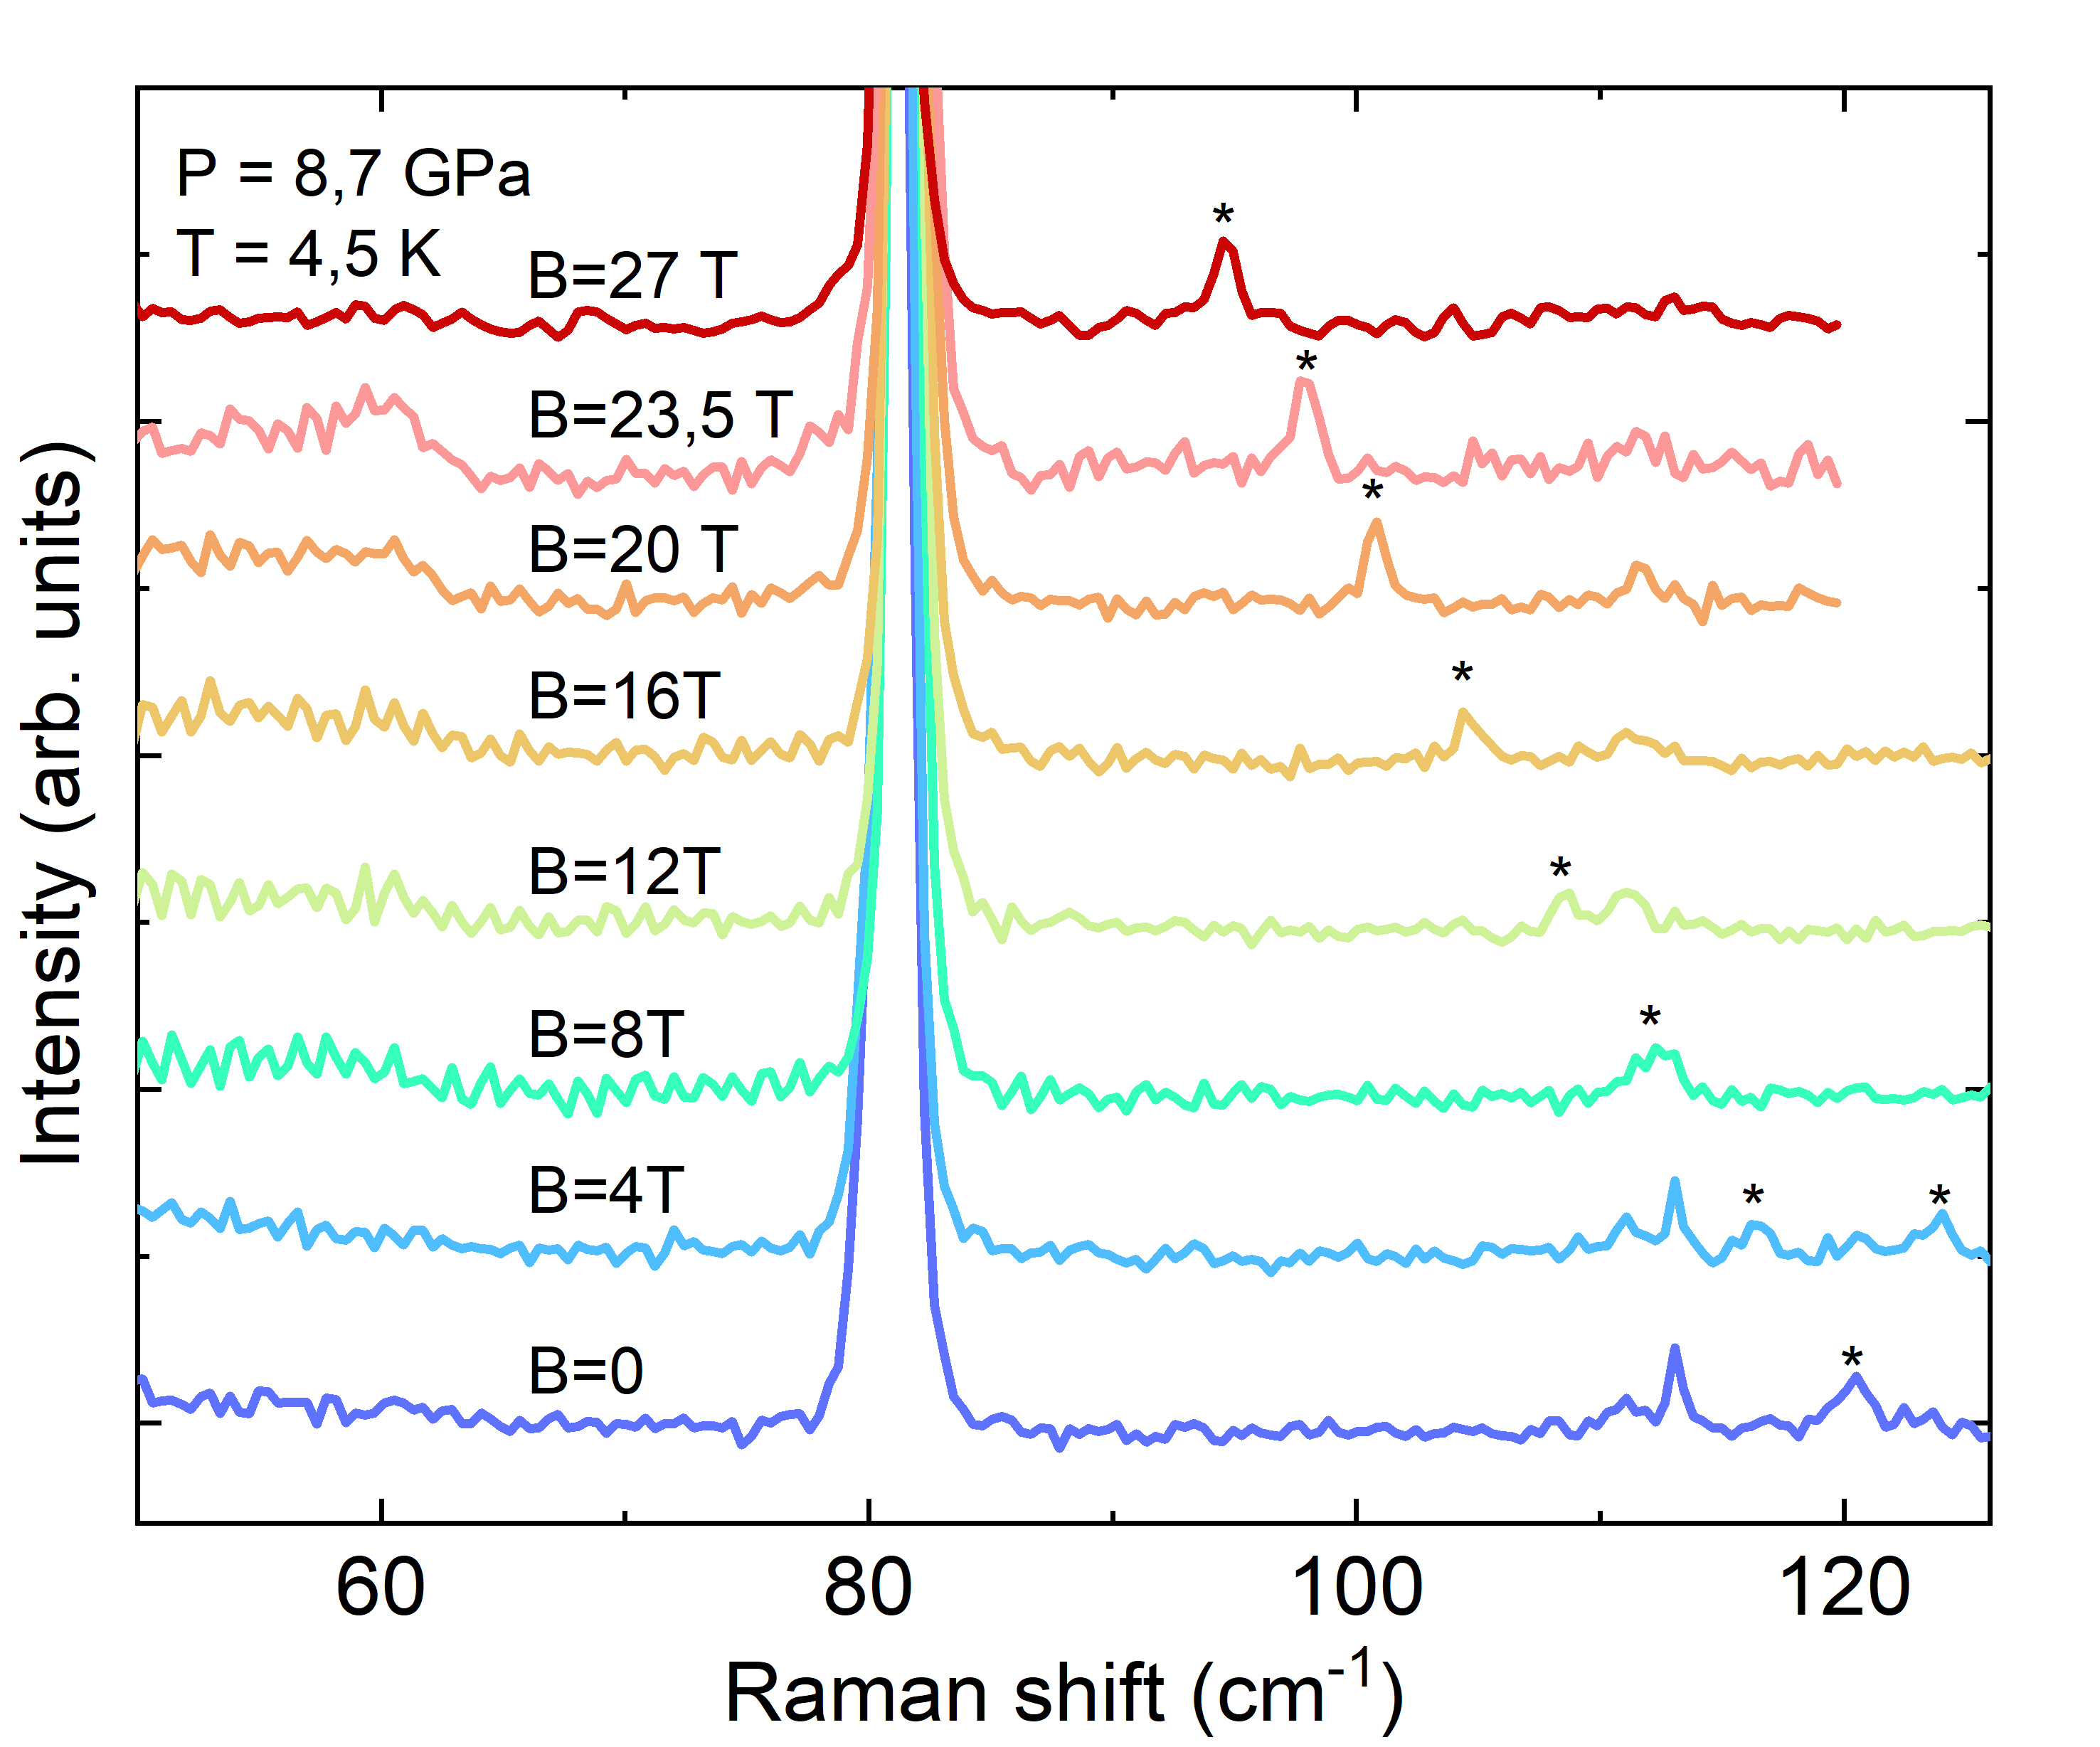
When applying a magnetic field transverse to the FePS3 layers, the two-fold degeneracy of the magnon excitation is lifted, the energy of one branch increases with the magnetic field while the energy of the other branch decreases McCreary et al. (2020). When a pressure of GPa is set in the DAC, bulk FePS3 is expected to be in the HP1 phase Haines et al. (2018). As can be seen in Fig. 5, the magnon excitation is also observed in the Raman scattering response, at an energy very close to that of the magnon at ambient pressure, but within a phonon spectrum modified by the high pressure. When applying a transverse magnetic field the magnon splits into two components and we can observe this excitation up to highest value of the magnetic field. This result illustrates the possibility to probe magnetic and phonon excitations in the very specific environment of low temperature, high pressure and high magnetic fields.
IV Conclusions
To conclude, we have presented an experimental set-up for spatially resolved optical investigations (Raman scattering, photoluminescence and reflectance) of condensed matter systems in an extreme environment of low temperature, high magnetic fields provided by the resistive magnets of LNCMI-Grenoble (France), and of high pressure produced in a diamond anvil cell. This set up allows for the spatial mapping of the optical response of the sample with a sub-micrometer resolution at or with an applied magnetic field, or to investigate a well-defined location or systems with reduced dimensions such as van der Waals heterostructures. This work unlocks for condensed matter physics the novel and exciting possibility of inducing exotic electronic ground states at low temperature and high pressure, and to trace the evolution of their elementary excitations as a function of the magnetic field produced by a superconducting or a resisitive magnet, by optical means. Additional functionalities such as measurements of reflectance or photoluminescence with a time resolution are in the process of being implemented.
V Acknowledgement
This work has been partially supported by the EC Graphene Flagship project and by the ANR projects ANR-17-CE24-0030 and ANR-19-CE09-0026. M-A. M. acknowledges the support from the ERC (H2020) (Grant agreement No. 865826). We acknowledge the support of the LNCMI-EMFL, CNRS, Univ. Grenoble Alpes, INSA-T, UPS, Grenoble, France.
VI Data availability
The data that support the findings of this study are available from the corresponding author upon reasonable request.
References
- Costanzo et al. (2016) D. Costanzo, S. Jo, H. Berger, and A. Morpurgo, “Gate-induced superconductivity in atomically thin crystals,” Nature Nanotechnology 11, 339 – 344 (2016).
- Hagiwara et al. (1999) M. Hagiwara, K. Katsumata, H. Yamaguchi, M. Tokunaga, I. Yamada, M. Gross, and P. Goy, “A complete frequency-field chart for the antiferromagnetic resonance in MnF2,” INTERNATIONAL JOURNAL OF INFRARED AND MILLIMETER WAVES 20, 617–622 (1999).
- Wang et al. (2018) Y. Wang, J. Ying, Z. Zhou, J. Sun, T. Wen, Y. Zhou, N. Li, Q. Zhang, F. Han, Y. Xiao, P. Chow, W. Yang, V. V. Struzhkin, Y. Zhao, and H.-K. Mao, “Emergent superconductivity in an iron-based honeycomb lattice initiated by pressure-driven spin-crossover,” NATURE COMMUNICATIONS 9 (2018), 10.1038/s41467-018-04326-1.
- Grasset et al. (2019) R. Grasset, Y. Gallais, A. Sacuto, M. Cazayous, S. Mañas Valero, E. Coronado, and M.-A. Méasson, “Pressure-induced collapse of the charge density wave and higgs mode visibility in ,” Phys. Rev. Lett. 122, 127001 (2019).
- Mackenzie (2005) A. P. Mackenzie, “PHYSICS: Enhanced: A quantum critical route to field-induced superconductivity,” Science 309, 1330–1331 (2005).
- Meyer et al. (2005) C. Meyer, O. Sqalli, H. Lorenz, and K. Karrai, “Slip-stick step-scanner for scanning probe microscopy,” Review of Scientific Instruments 76, 063706 (2005), https://doi.org/10.1063/1.1927105 .
- Berciaud, Potemski, and Faugeras (2014) S. Berciaud, M. Potemski, and C. Faugeras, “Probing electronic excitations in mono- to pentalayer graphene by micro magneto-raman spectroscopy,” Nano Letters 14, 4548–4553 (2014), pMID: 24955484, https://doi.org/10.1021/nl501578m .
- Kim et al. (2013) Y. Kim, J. M. Poumirol, A. Lombardo, N. G. Kalugin, T. Georgiou, Y. J. Kim, K. S. Novoselov, A. C. Ferrari, J. Kono, O. Kashuba, V. I. Fal’ko, and D. Smirnov, “Measurement of filling-factor-dependent magnetophonon resonances in graphene using raman spectroscopy,” Phys. Rev. Lett. 110, 227402 (2013).
- Liu et al. (2021) S. Liu, A. Granados del Águila, D. Bhowmick, C. K. Gan, T. Thu Ha Do, M. A. Prosnikov, D. Sedmidubský, Z. Sofer, P. C. M. Christianen, P. Sengupta, and Q. Xiong, “Direct observation of magnon-phonon strong coupling in two-dimensional antiferromagnet at high magnetic fields,” Phys. Rev. Lett. 127, 097401 (2021).
- Zhang et al. (2017) X.-X. Zhang, T. Cao, Z. Lu, Y. Lin, F. Zhang, Y. Wang, Z. Li, J. Hone, J. Robinson, D. Smirnov, S. louie, and T. Heinz, “Magnetic brightening and control of dark excitons in monolayer wse2,” Nature Nanotechnology 12, 883 – 888 (2017).
- Jayaraman (1983) A. Jayaraman, “Diamond anvil cell and high-pressure physical investigations,” Rev. Mod. Phys. 55, 65–108 (1983).
- Xia et al. (2021) J. Xia, J. Yan, Z. Wang, Y. He, Y. Gong, W. Chen, T. C. Sum, Z. Liu, P. M. Ajayan, and Z. Shen, “Strong coupling and pressure engineering in WSe2-MoSe(2)heterobilayers,” NATURE PHYSICS 17 (2021), 10.1038/s41567-020-1005-7.
- Hudl et al. (2015) M. Hudl, P. Lazor, R. Mathieu, A. Gavriliuk, and V. Struzhkin, “Ppms-based set-up for raman and luminescence spectroscopy at high magnetic field, high pressure and low temperature,” EPJ Techniques and Instrumentation 2, 3 (2015).
- Li et al. (2020) X. Li, S. E. Cooper, A. Krishnadas, D. M. Silevitch, T. F. Rosenbaum, and Y. Feng, “Optical raman measurements of low frequency magnons under high pressure,” Review of Scientific Instruments 91, 113902 (2020), https://doi.org/10.1063/5.0026311 .
- Debray and Frings (2013) F. Debray and P. Frings, “State of the art and developments of high field magnets at the “laboratoire national des champs magnétiques intenses”,” Comptes Rendus Physique 14, 2–14 (2013), physics in High Magnetic Fields / Physique en champ magnétique intense.
- Graf et al. (2011) D. E. Graf, R. L. Stillwell, K. M. Purcell, and S. W. Tozer, “Nonmetallic gasket and miniature plastic turnbuckle diamond anvil cell for pulsed magnetic field studies at cryogenic temperatures,” High Pressure Research 31, 533–543 (2011), https://doi.org/10.1080/08957959.2011.633909 .
- Syassen (2008) K. Syassen, “Ruby under pressure,” High Pressure Research 28, 75–126 (2008), https://doi.org/10.1080/08957950802235640 .
- Klotz et al. (2009) S. Klotz, J.-C. Chervin, P. Munsch, and G. L. Marchand, “Hydrostatic limits of 11 pressure transmitting media,” Journal of Physics D: Applied Physics 42, 075413 (2009).
- Emin, Hushur, and Mamtimin (2020) A. Emin, A. Hushur, and T. Mamtimin, “Raman study of mixed solutions of methanol and ethanol,” AIP Advances 10, 065330 (2020), https://doi.org/10.1063/1.5140722 .
- Mao et al. (2018) H.-K. Mao, X.-J. Chen, Y. Ding, B. Li, and L. Wang, “Solids, liquids, and gases under high pressure,” Rev. Mod. Phys. 90, 015007 (2018).
- Sekine et al. (1990) T. Sekine, M. Jouanne, C. Julien, and M. Balkanski, “Light-scattering study of dynamical behavior of antiferromagnetic spins in the layered magnetic semiconductor ,” Phys. Rev. B 42, 8382–8393 (1990).
- McCreary et al. (2020) A. McCreary, J. R. Simpson, T. T. Mai, R. D. McMichael, J. E. Douglas, N. Butch, C. Dennis, R. Valdés Aguilar, and A. R. Hight Walker, “Quasi-two-dimensional magnon identification in antiferromagnetic via magneto-raman spectroscopy,” Phys. Rev. B 101, 064416 (2020).
- Vaclavkova et al. (2021) D. Vaclavkova, M. Palit, J. Wyzula, S. Ghosh, A. Delhomme, S. Maity, P. Kapuscinski, A. Ghosh, M. Veis, M. Grzeszczyk, C. Faugeras, M. Orlita, S. Datta, and M. Potemski, “Magnon polarons in the van der waals antiferromagnet ,” Phys. Rev. B 104, 134437 (2021).
- Haines et al. (2018) C. R. S. Haines, M. J. Coak, A. R. Wildes, G. I. Lampronti, C. Liu, P. Nahai-Williamson, H. Hamidov, D. Daisenberger, and S. S. Saxena, “Pressure-induced electronic and structural phase evolution in the van der waals compound ,” Phys. Rev. Lett. 121, 266801 (2018).
- Coak et al. (2021) M. J. Coak, D. M. Jarvis, H. Hamidov, A. R. Wildes, J. A. M. Paddison, C. Liu, C. R. S. Haines, N. T. Dang, S. E. Kichanov, B. N. Savenko, S. Lee, M. Kratochvílová, S. Klotz, T. C. Hansen, D. P. Kozlenko, J.-G. Park, and S. S. Saxena, “Emergent magnetic phases in pressure-tuned van der waals antiferromagnet ,” Phys. Rev. X 11, 011024 (2021).