Redshifted methanol absorption tracing infall motions of high-mass star formation regions
Abstract
Context. Gravitational collapse is one of the most important processes in high-mass star formation. Compared with the classic blue-skewed profiles, redshifted absorption against continuum emission is a more reliable method to detect inward motions within high-mass star formation regions.
Aims. We aim to test if methanol transitions can be used to trace infall motions within high-mass star formation regions.
Methods. Using the Effelsberg-100 m, IRAM-30 m, and APEX-12 m telescopes, we carried out observations of 37 and 16 methanol transitions towards two well-known collapsing dense clumps, W31C (G10.60.4) and W3(OH), to search for redshifted absorption features or inverse P-Cygni profiles.
Results. Redshifted absorption is observed in 14 and 11 methanol transitions towards W31C and W3(OH), respectively. The infall velocities fitted from a simple two-layer model agree with previously reported values derived from other tracers, suggesting that redshifted methanol absorption is a reliable tracer of infall motions within high-mass star formation regions. Our observations indicate the presence of large-scale inward motions, and the mass infall rates are roughly estimated to be 10-3 yr-1, which supports the global hierarchical collapse and clump-fed scenario.
Conclusions. With the aid of bright continuum sources and the overcooling of methanol transitions leading to enhanced absorption, redshifted methanol absorption can trace infall motions within high-mass star formation regions hosting bright HII regions.
Key Words.:
star: formation — ISM: kinematics and dynamics — ISM: individual object: W31C (G10.60.4) and W3(OH) — ISM: molecules — ISM: structure — radio lines: ISM1 Introduction
Infall motions provide direct evidence of mass accretion and their observation plays a crucial role in star formation research. The classic blue-skewed profile is commonly taken as evidence of infall motions (e.g. Leung & Brown 1977; Zhou et al. 1993). However, the interpretation of the blue-skewed profile as an infall signature can be impaired by kinematic peculiarities (e.g. outflow and rotation) and chemical abundance variations (Evans 2003). This situation becomes even more severe when analysing spectra obtained towards complex high-mass star formation regions by single-dish observations with a resolution 10 (corresponding to 0.24 pc at a distance of 5 kpc), because they incorporate emission which is statistically located at farther distances.
Detecting redshifted absorption or inverse P-Cygni profiles towards background continuum sources turns out to be a more straightforward and reliable method to identify infall motions associated with high-mass young stellar objects. Such redshifted absorption has already been detected in lines from a few molecules (e.g. NH3, Keto et al. 1987a, 1988; Ho & Young 1996; Zhang & Ho 1997; HCO+, Welch et al. 1987; CS, Zhang et al. 1998; H2CO, Di Francesco et al. 2001) against strong radio- and millimetre-wavelength continuum emission. However, to date, such absorption has only been found in a couple of sources with interferometric observations (with typical angular resolutions of 10). Redshifted absorption in sub-millimetre-wavelength rotational lines from NH3 and H2O against dust continuum emission has been detected in a number of objects (Wyrowski et al. 2012, 2016; van der Tak et al. 2019). However, these transitions are not easily observed using ground-based telescopes because their frequencies are largely blocked by the Earth’s atmospheric absorption. Furthermore, these high frequency measurements by Herschel and SOFIA are rather expensive and only a very limited number of sources have been studied so far, leaving extensive searches of these redshifted absorption features towards a larger sample of sources unfeasible. Therefore, salient tracers that are more accessible by ground-based telescopes can help to gauge reliable infall motions in a much larger sample of high-mass star formation regions.
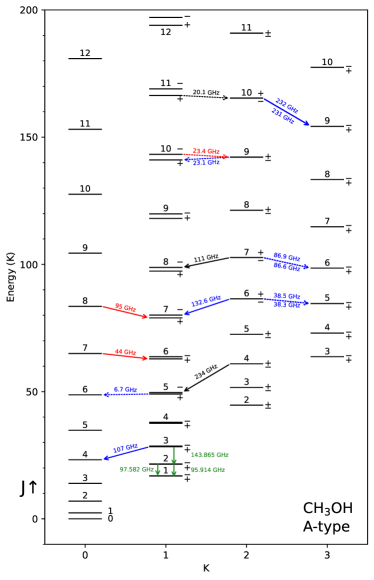
The methanol (CH3OH) molecule has numerous transitions, including many maser lines, within the centimetre- and millimetre-wavelength ranges and hence provides a powerful tool to investigate star-forming regions. Early studies divided CH3OH masers into two categories (Batrla et al. 1987; Menten 1991b) based on their different observational properties and pumping mechanisms. Class II CH3OH masers are found in close proximity to infrared sources, OH masers, and ultracompact Hii (UCHii) regions, and radiative pumping is believed to be responsible for their pumping (e.g. Menten 1991a; Cragg et al. 2005). In contrast, class I CH3OH masers are thought to trace shocked regions and are produced by collisional pumping (e.g. Leurini et al. 2016). Experimentally determined rate coefficients for collisions between CH3OH and H2 or helium (Lees & Haque 1974; Rabli & Flower 2010) have shown a tendency for the final state of a collisional excitation process of a CH3OH molecule to have the same -quantum number as the initial state, that is a propensity for = 0 collisions. This leads, for type CH3OH111Methanol exists in two separate (non-interconverting) symmetry species: -type and -type CH3OH. Its energy levels are described by the total angular momentum quantum number and its projection on the near symmetry (O–C) axis, which for the double degenerate type levels is lower case (with ). This leads to ladders of levels that have the same , but (bottom to top) an increasing value of . For type CH3OH, upper case is used for the latter quantum number (with ) and, except for the ladder, the levels are split in pairs with opposite parity., to an overpopulation of the energy levels in the ladder relative to the levels in the (or the ) ladder that they can radiatively decay to (see Fig. 1). For transitions originating in the ladder that have their upper energy levels in this ladder, that is, those with (line numbers 3–8 in Table 1), this results in maser emission, while for and 1, it leads to enhanced absorption (anti-inversion or overcooling), in particular for the 12.2 GHz E line (line number 2). An analogous situation attains for type CH3OH, for which the levels in the ladder are overpopulated relative to those in the ladder (see Fig. 1), causing maser action for levels with (line numbers 27 and 28) and enhanced absorption in the 6.7 GHz (line number 26) transition. In the presence of a strong mid-infrared field, radiative pumping to torsionally excited states disturbs this simple picture and causes class II methanol maser action (Sobolev & Deguchi 1994; Sobolev et al. 1997). We note that the two strongest class II CH3OH lines show, as explained above, absorption in regions that are conducive to class I maser excitation, which are often significantly removed from centres of activity marked by strong compact radio or IR sources (see, e.g. Menten et al. 1986a). The actual observational picture can be more complex, since in a single dish telescope beam, the signals from different regions can be merged, which is, among others, the case for the 12.2 GHz line in W31C, which shows absorption in addition to maser emission (see Sec. 3.1). These effects successfully explain the observed bright class I methanol masers (e.g. Leurini et al. 2016) and overcooling, which enhances the absorption lines’ detectability, in particular when strong background continuum emission is present, although even absorption against the cosmic microwave background radiation is observed in the 12.2 GHz line (Walmsley et al. 1988) and even the 6.7 GHz line, whose lower energy level is 49 K above the ground (Pandian et al. 2008). Absorption in the 6.7 GHz and 12.2 GHz CH3OH transitions is indeed detected towards several sources, several of which host I methanol masers (e.g. NGC2264 and DR21-W; Menten 1991a; Ortiz-León et al. 2021), dark clouds (TMC1 and L183; Walmsley et al. 1988), hot corinos (NGC1333; Pandian et al. 2008), molecular clouds and Hii region complexes (Peng & Whiteoak 1992), and the Galactic Centre regions (Sgr B2, Sgr A and G1.60.025; Whiteoak et al. 1988; Peng & Whiteoak 1989; Whiteoak & Peng 1989; Houghton & Whiteoak 1995). These facts suggest that methanol transitions that show absorption could have potential to aid in studying infall motions in high-mass star formation regions.
Two high-mass star formation regions, W31C and W3(OH), have been selected for this work. W31C, also known as G10.60.4, is an UCHii region located at a distance of 4.95 kpc (Sanna et al. 2014). Based on previous dust spectral energy distribution (SED) fitting, this region is found to have a mass of 2 M⊙ and a luminosity of 3 L⊙ (e.g. Lin et al. 2016). W31C shows evidence for infall motions in both molecular gas (e.g. NH3, Ho & Haschick 1986; Keto et al. 1987a, 1988; Sollins & Ho 2005; HCO+, Klaassen & Wilson 2008; high- CO, Wyrowski et al. 2006) and ionised gas (in the H66 radio recombination line, Keto 2002), which is well modelled by the gravitational collapse of a centrally condensed and centrally heated core (e.g. Keto et al. 1987a; Sollins et al. 2005). A series of high resolution observations present the overall picture of a hierarchically collapsing system for W31C (Liu et al. 2010a, b, 2011, 2012; Liu 2017).
The W3(OH) complex is located at a distance of 1.950.04 kpc (Xu et al. 2006), and consists of two high-mass objects W3(OH) and W3(H2O). W3(OH) is associated with an UCHii region ionised by an O7 star (e.g. Dreher & Welch 1981). In contrast, W3(H2O), located 6 (0.06 pc) east of W3(OH) (e.g. Zapata et al. 2011; Qin et al. 2015) is in an earlier stage of massive star formation and hosts a (double) hot molecular core (Wyrowski et al. 1999; Ahmadi et al. 2018). On larger ( pc size) scales, both single-pointing spectral line observations and mapping reveal infall motions in the W3(OH) complex (e.g. Wu & Evans 2003; Sun & Gao 2009; Wu et al. 2010). Keto et al. (1987b) reported that the velocity, density and temperature structure in the W3(OH) complex is similar to that in W31C. That a blue-skewed profile is observed in the HCN (32) line over a region of 110 ( pc), Qin et al. (2016) further supports the notion that the W3(OH) complex is overall undergoing large-scale collapse like W31C. These properties make W31C and W3(OH) excellent test beds to examine the suitability of other spectral lines for tracing infall.
In this work, we present observations of multiple methanol transitions towards W31C and W3(OH) to test whether methanol transitions can trace infall motions. These data were collected using the Effelsberg-100 m, the IRAM-30 m, and the Atacama Pathfinder Experiment (APEX) 12 metre telescopes. We note that both W3(OH) and W3(H2O) are covered within the same beam of single-dish observations. Here we use W3(OH) to refer to the W3(OH) complex. Our observations and data reductions are described in Sec. 2. Sec. 3 presents the results which are discussed in Sec. 4. A summary of this work is presented in Sec. 5
2 Observations and data reduction
We observed 37 CH3OH transitions towards W31C with rest frequencies ranging from 6 GHz to 236 GHz. The observations were undertaken between 2011 and 2021 using the Effelsberg-100 m, IRAM-30 m, and APEX-12 m telescopes. Information on the observed transitions is given in Table 1, and these transitions are denoted by arrows in the methanol energy level diagram (see Fig. 1). We adopt the most accurate available rest frequencies, most of which are taken from Müller et al. (2004). We note that a given error in frequency will lead to a larger error in velocity for transitions with a lower rest frequency. For all transitions in Table 1, the corresponding errors in velocity range between 0.002 km s-1 (at 25.294 GHz) and 0.392 km s-1 (at 38.3 GHz). We adopt the prescription of Shirley (2015) to estimate the optically thin critical density for each methanol transition. The spectroscopic data for the CH3OH lines are taken from the Leiden Atomic and Molecular Database (LAMDA222https://home.strw.leidenuniv.nl/~moldata/) with a data file version of 2021 April 12. Because the gas kinetic temperatures of W31C and W3(OH) are about 100 K (Mangum & Wootten 1993; Tang et al. 2018), the optically thin critical density is calculated by assuming a gas kinetic temperature of 100 K for this work. The optically thin critical densities are determined to be 2–6 cm-3, spanning two orders of magnitude. Observational parameters are given in Table 2. Four CH3OH transitions, those at 84, 95, 108 and 111 GHz, were targeted towards an ATLASGAL source (AGAL010.62400.384, at =18h10m286, =19∘5546) near W31C, the other 33 transitions were observed towards the UCHii region G010.62340.3837 at =18h10m2870, =19∘55498 (Yang et al. 2019, 2021). The angular offset between the two positions is 4 which is less than one fifth of the IRAM-30 m beam size at 3 mm.
We carried out K-band (18–26 GHz) observations towards W3(OH) in 2021 May 13 using the Effelsberg-100 m. The telescope was pointed towards the position, =02h27m0438, =61∘52205, used by (Menten et al. 1986a), who reported absorption in the 25 GHz CH3OH lines. The methanol transitions at 95.914, 97.582 and 143.865 GHz were observed in 2019 June 11 using the IRAM-30 m. The telescope was pointed towards the position of the UCHii region W3(OH), that is =02h27m0390, =61∘52240, which is about 5 offset (nearly one seventh of the Effelsberg-100 m beam size at 25 GHz) from the position that we used in the K-band observations.
Given that the offsets between different positions are much smaller than the beam sizes of our observations, the position offsets are neglected in the following analysis. Details of the observations and data reduction for each telescope are described below.
2.1 Effelsberg-100m observations
Using the dual-polarisation S7mm Double Beam RX secondary receiver on the Effelsberg-100 m telescope333The 100-m telescope at Effelsberg is operated by the Max-Planck Institut für Radioastronomie (MPIfR) on behalf of the Max-Planck Gesellschaft (MPG)., we conducted Q band observations towards W31C (=18h10m2870, =19∘55498) to observe methanol transitions ranging from 34.5 to 39.5 GHz on 2020 September 14 and from 40 to 45 GHz on 2020 May 30 (project id: 77-19). Towards W31C, the 6.7 GHz and 12.2 GHz methanol transitions were observed on 2021 January 5 using the S45mm and S20mm secondary focus receivers, while K-band observations (18 – 26 GHz) were performed towards both W3(OH) (=02h27m0438, =61∘52205) and W31C on 2021 May 13 and 14 (project id: 17-21). All these observations were made in the position switching mode with an off-position offset of 10 in right ascension. Fast Fourier Transform Spectrometers (FFTSs) were used as the backend to record signals. For the 6.7 GHz and 12.2 GHz methanol transitions, we used high spectral resolution FFTSs which provide a channel separation of 3.1 kHz and 4.6 kHz at 6.7 GHz and 12.2 GHz, corresponding to a velocity spacing of 0.14 km s-1 and 0.11 km s-1, respectively. For other methanol transitions, we adopted broad-bandwidth FFTSs which cover an instantaneous bandwidth of 2.5 GHz with 65536 channels, yielding a channel separation of 38.1 kHz and a corresponding velocity spacing of 0.33 km s-1at 35 GHz (multiply by 1.16 to convert to velocity resolution, see Klein et al. 2012).
NGC 7027 and 3C 286 were used for pointing, focus and flux density calibration, and the pointing uncertainty was better than 10, 5, 5, and 10 at 6.7 GHz, 12.2 GHz, 24 GHz, and 40 GHz, respectively. The observed methanol transitions, corresponding observation dates, full width at half maximum (FWHM) beam sizes, velocity resolutions, the 1 rms noise levels at the corresponding velocity resolutions, main beam efficiencies, , and the scaling factors to convert antenna temperature, , to flux density, , are listed in Table 2.
2.2 IRAM-30 m observations
We observed multiple methanol transitions within the frequency ranges of 84.6–92.4 GHz and 100.3–108.1 GHz towards W31C (=18h10m2870, =19∘55498) using the Eight MIxer Receiver (EMIR, Carter et al. 2012) of the IRAM 30m telescope on 2019 June 29 (project id: 043-19). The methanol transitions at 95.914, 97.582 and 143.865 GHz were observed towards W3(OH) (=02h27m0390, =61∘52240) on 2019 June 11 (project id: 045-19) using the EMIR receivers (E090 and E150). The dual-polarisation EMIR receivers provide nearly 8 GHz bandwidth per sideband, which is connected to two 4 GHz wide FFTSs. These FFTSs provide a channel width of 195 kHz, resulting in a velocity spacing of 0.6 km s-1 at 95 GHz. The wobbler switching mode, through small movements of the sub-reflector to change the optical path from antenna to the receiver, was used for pointing towards the source with a throw of 120 in azimuth. Additional methanol line data at 84, 95, 108 and 111 GHz towards W31C were taken from an unbiased line survey towards ATLASGAL sources at =18h10m286, =19∘5546. The observations were carried out during 2011 April 8 to 11 (see Csengeri et al. 2016 for details, project id: 181-10). The observational parameters including the main beam efficiency, the scaling factor, and the 1 rms noise level of each transition are listed in Table 2.
2.3 APEX-12 m observations
We observed methanol transitions ranging from 209.2 to 220.9 GHz and from 225 to 236.7 GHz towards W31C (=18h10m2870, =19∘55498) with the PI230 receiver at the APEX444This publication is based on data acquired with the Atacama Pathfinder Experiment 12 m sub-millimetre telescope (APEX). APEX is a collaboration between the Max-Planck-Institut für Radioastronomie, the European Southern Observatory, and the Onsala Space Observatory. telescope (Güsten et al. 2006) on 2019 June 1 and June 9 (project id: 0103.F-9516A). The PI230 receiver555https://www.eso.org/public/teles-instr/apex/pi230/ is a dual polarisation and sideband-separating heterodyne system that covers a frequency range of 200270 GHz. The FFTS backend provides 65536 channels over 4 GHz bandwidth, and an overlap of 0.2 GHz between the two backends results in a total 7.8 GHz coverage for each sideband and polarisation per tuning. The wobbler switching mode with a throw of 120 in azimuth was used for our observations. The pointing was accurate to 2. The main beam efficiency, the scaling factor, and the rms noise level after an on-source integration time of 5 minutes are listed in Table 2.
2.4 Data reduction
The CLASS programme that is part of the GILDAS package (Pety 2005; Gildas Team 2013) was used for processing all of our data. For the observations performed with the 7 mm dual-beam receiver, we only analysed the data for the beam that tracked the selected targeted positions. Because radio frequency interference caused a poor baseline for 12.2 GHz spectrum (for W31C), a fourth order polynomial baseline was subtracted within the baseline parameters determined over a velocity range of 60 km s-1 around the systemic velocity. A low-order (4) polynomial baseline was subtracted from the other spectra. To improve the signal-to-noise ratios (S/Ns), Hanning smoothing was performed on the spectra obtained with the APEX-12 m telescope. Velocities are given with respect to the local standard of rest (LSR) throughout this work.

3 Results
Our observations resulted in the detection of 37 methanol transitions in W31C and 16 methanol transitions in W3(OH). The observational results for the two sources are given separately in the following.
3.1 Detection of 14 redshifted methanol absorption lines towards W31C
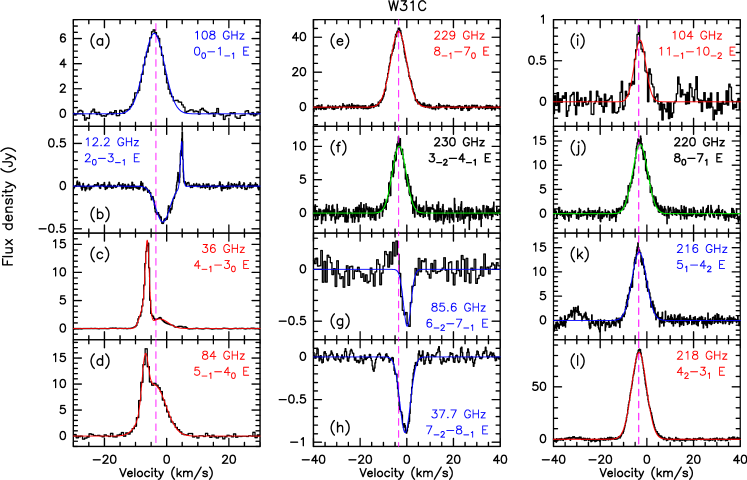
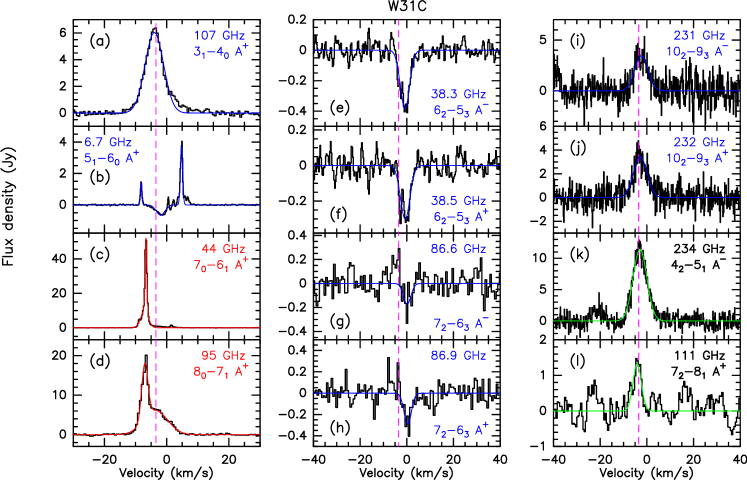
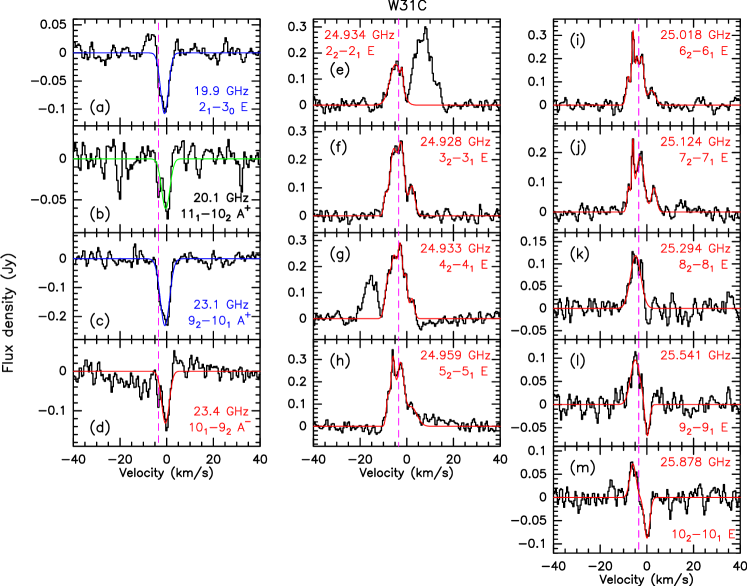
Figures 2–4 present the observed spectra of 37 CH3OH transitions observed towards W31C, showing diverse line shapes. Gaussian fitting was performed to characterise the spectral features of each transition. Single-peaked spectra observed in emission are fitted with a single Gaussian component.
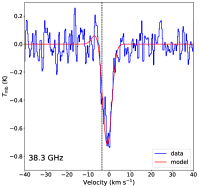
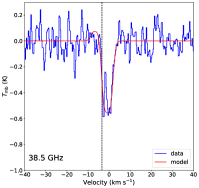
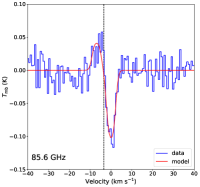
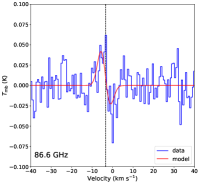
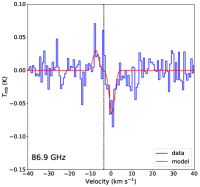
We used a single Gaussian component to fit the absorption signal for the transitions at 19.9, 20.1, 23.4, 37.7, 38.3, 38.5, 85.6, 86.6 and 86.9 GHz, in order to clearly characterise the absorption feature. For other spectra with multiple emission peaks and absorption dips, we employed multiple Gaussian components for the fitting. The results of the fitting are listed in Table 3.
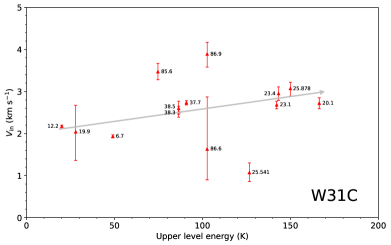
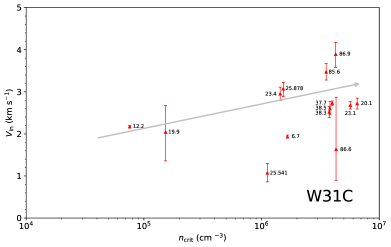
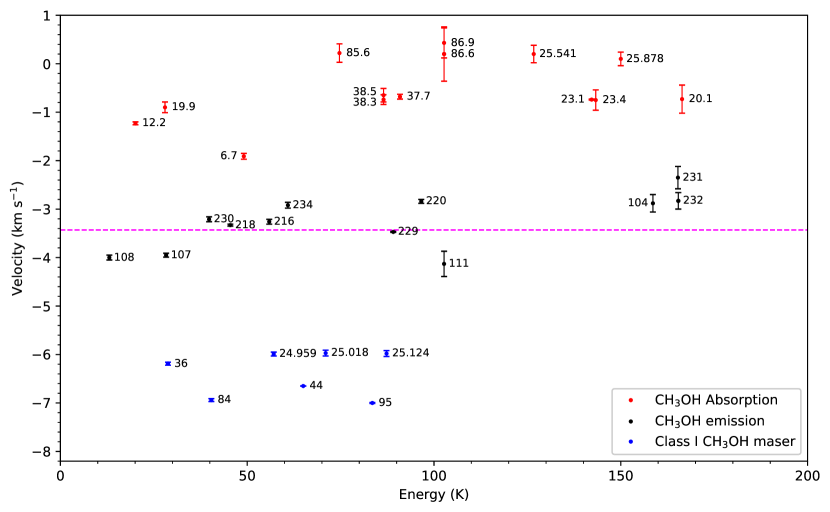
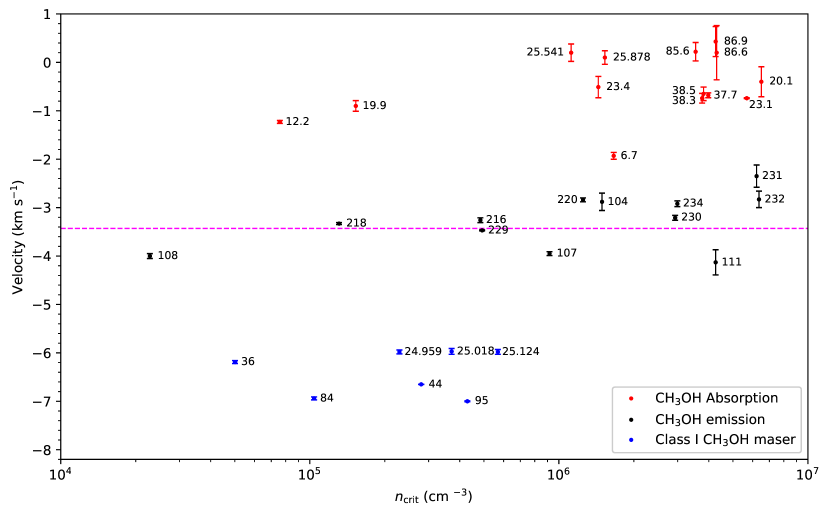
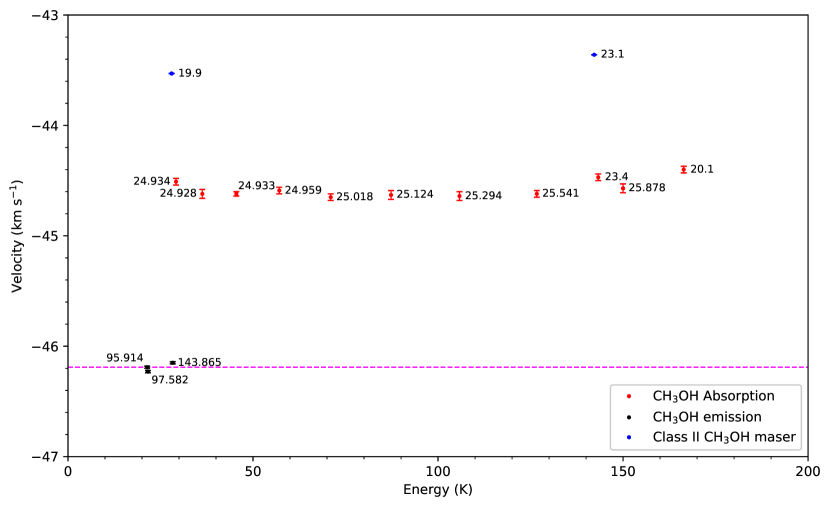
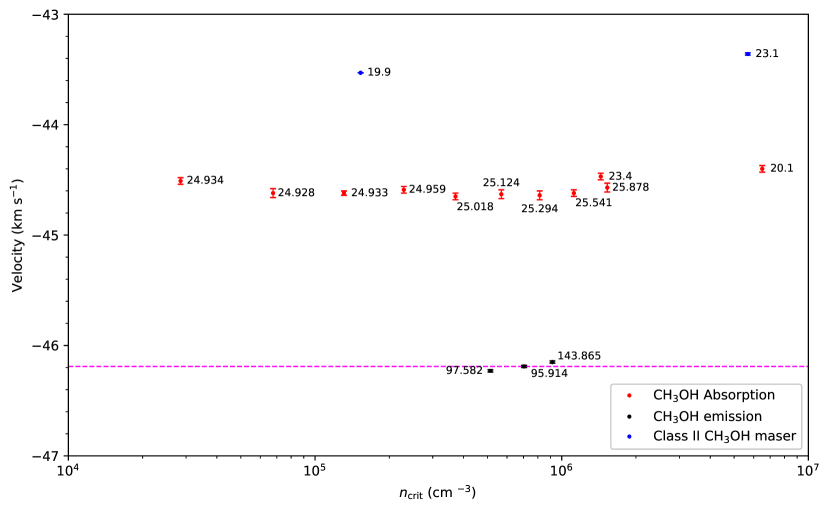
Among the observed spectra, we find 12 methanol transitions showing single-peaked emission profiles. These are the 104, 107, 108, 111, 216, 218, 220, 229, 230, 231, 232, and 234 GHz lines. Although the 104, 107, 108, 216, 218, 229, 231 and 232 GHz lines have been found to show maser action towards other sources (e.g. Val’tts et al. 1999; Slysh et al. 2002; Salii & Sobolev 2006; Voronkov et al. 2006; Ellingsen et al. 2012; Hunter et al. 2014), the observed broad widths of the lines are similar to the widths of lines from other species, which indicates that they are dominated by thermally excited emission towards W31C. Therefore, we use the fitted velocities of these 12 transitions to derive the systemic velocity of W31C. Adopting inverse-variance weighting, we use the weighted mean velocity as the systemic velocity, and it is determined to be =3.430.44 km s-1. The systemic velocity we adopt is consistent with the value of 3 km s-1 used in previous studies (e.g. Keto 1990; Liu et al. 2010a; Kim et al. 2020). In Figure 5, it can be seen that the velocity centroids of these 12 methanol transitions become more redshifted with increasing energy level and critical density, which indicates that there is a velocity gradient from the outer envelope to the centre.
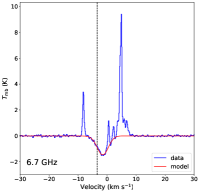
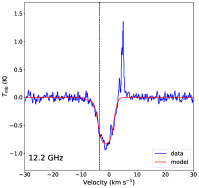
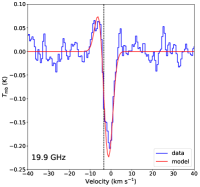
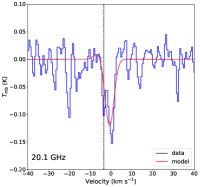
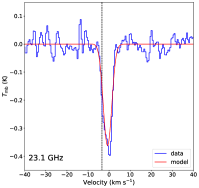
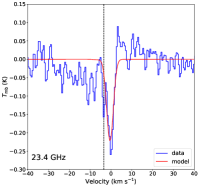
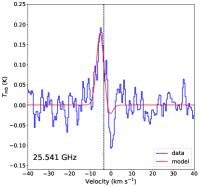
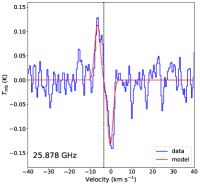
Absorption features are detected in 14 transitions, the 6.7, 12.2, 19.9, 20.1, 23.1, 23.4, 25.541, 25.878, 37.7, 38.3, 38.5, 85.6, 86.6 and 86.9 GHz lines (see Column 3 in Table 1). Absorption in five of these transitions (6.7, 12.2, 19.9, 23.1 and 23.4 GHz) towards W31C has been discussed in previous studies (Wilson et al. 1984, 1985; Menten 1991b; Peng & Whiteoak 1992; Caswell et al. 1995b; Breen et al. 2010, 2014). The remaining nine absorption profiles at 20.1, 25.541, 25.878, 37.7, 38.3, 38.5, 85.6, 86.6 and 86.9 GHz are reported here for the first time. Furthermore, the CH3OH transitions at 19.9, 25.541, 25.878 and 85.6 GHz show a typical inverse P-Cygni profile. The absorption features have a large scatter in their LSR velocities, ranging from 1.91 km s-1 to 0.43 km s-1 (see Table 3 and Fig. 5). Nevertheless, all 14 absorption features are redshifted with respect to the systemic velocity (=3.430.44 km s-1, see also Fig. 5).
Both the and lines at 6.7 (Fig. 3b) and 12.2 GHz (Fig. 2b) show broad absorption and maser features. The absorption features in these two transitions lie in the velocity range 2 to 1 km s-1 and are therefore redshifted with respect to the systemic velocity of the source. The line width of the absorption feature at 12.2 GHz is the broadest we have detected for absorption towards W31C. The 6.7 GHz spectral profile shows absorption sandwiched between two maser features, which is consistent with previous observations (Menten 1991b; Caswell et al. 1995b). Breen et al. (2010, 2014) reported the detection of a 12.2 GHz maser. In their spectra obtained in 2008, the intensity of the absorption feature is about 0.5 Jy, similar to our result. On the other hand, the peak flux density of the maser feature at 4.6 km s-1 is 1.4 Jy, which is nearly three times our value. This indicates that the 12.2 GHz maser flux density has declined over the past 13 years.
The 19.9 GHz line (Fig. 4a) shows an inverse P-Cygni profile with an emission feature at about 6.6 km s-1 and an absorption feature at about 0.9 km s-1. The 23.1 GHz line (Fig. 4c) exhibits one prominent absorption feature at about 0.74 km s-1. These two spectra are consistent with previous studies (Wilson et al. 1984, 1985). We adopted a rest frequency of 23444.778 MHz (Mehrotra et al. 1985; Voronkov et al. 2011) for the line, which is 42 kHz lower than the value used by Menten et al. (1986b). Thus, to compare with the velocity of the absorption feature observed by Menten et al. (1986b), a value of 0.54 km s-1should be subtracted from the velocity they reported, which shifts the peak absorption to 0.26 km s-1and reduces the difference with our result to 0.77 km s-1. The remaining difference may be due to the noisy spectra and slightly different fitting methods. Despite the low S/N ratio in the 20.1 GHz line (Fig. 4b), its absorption feature has a similar velocity as those of the 19.9, 23.1, 23.4 GHz lines, indicating that it is a reliable detection.
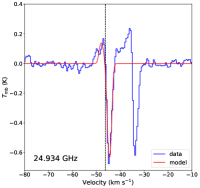
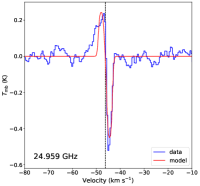
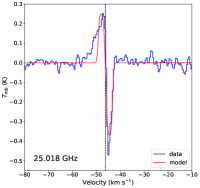
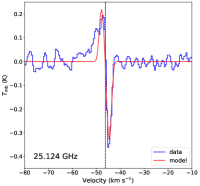
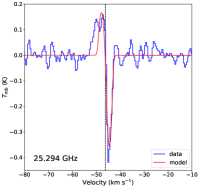
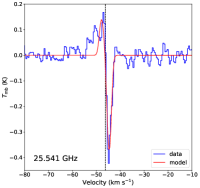
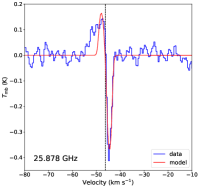
A series of nine lines ( from 2 to 10) of -type methanol near 25 GHz are detected by our observations. Both the line at 25.541 GHz (Fig. 4l) and the line at 25.878 GHz (Fig. 4m) exhibit typical inverse P-Cygni profiles with the absorption dips at about 0.1 km s-1. We note that such absorption dips are also present in other lines at a nearly identical velocity but blended with emission, which make them deviate from the typical inverse P-Cygni profile. The dips appear to become more prominent with increasing . The presence of narrow 25 GHz Class I methanol maser emission also makes the profiles more complex for the line at 24.959 GHz, the line at 25.018 GHz and the line at 25.124 GHz (see Figs. 4h–4j). Menten et al. (1986a) reported the detection of five lines ( = 2, 3, 4, 5, 6) towards W31C, but the maser emission peaks at a location 9 offset from our pointing centre. Nevertheless, the masers should be covered by our Effelsberg beam of 34, and they give rise to the observed narrow spikes between 6.0 km s-1 and 8.0 km s-1 in our spectra of the , and transitions (see Figs. 4h–4j). On the other hand, likely influenced by our offset position, the flux densities are much lower than the values reported in Menten et al. (1986a). In addition to the position difference, our low spectral resolution may be further reducing the measured peak flux densities.
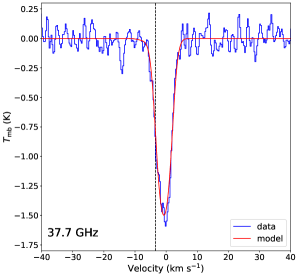
An absorption feature with a velocity of 0.68 km s-1 was detected in the line at 37.7 GHz (see Fig. 2g), and, with a flux density of 0.89 Jy. This is the strongest absorption feature among our detected absorption lines. Both lines (from levels of different parity) at 38.3 and 38.5 GHz (see Figs. 3e–3f) have a narrow emission spike with a velocity of 1.9 km s-1 that is superimposed on a broad absorption feature. Similar to the and the methanol transitions near 25 GHz in W3(OH) (Menten et al. 1986a), the narrow spike may arise from a weak maser. The velocities of the absorption features in the 38.3 and 38.5 GHz transitions match that of the 37.7 GHz line. The line widths of the absorption features in the 38.3 and 38.5 GHz transitions are 4.8 km s-1, which is slightly narrower than the line width (5.35 km s-1) of the 37.7 GHz line. Ellingsen et al. (2011) also searched for the 37.7, 38.3 and 38.5 GHz CH3OH lines towards W31C but nothing was detected, owing to their rms noise of 1.2 Jy with a channel width of 0.27 km s-1. On the other hand, Ellingsen et al. (2018) discovered an absorption feature in the 37.7, 38.3 and 38.5 GHz transitions towards G337.7050.053, but their velocities are not redshifted with respect to its systemic velocity traced by NH3 (1,1) (Purcell et al. 2012). Our observations are therefore the first detection of redshifted absorption in these three lines.
Absorption features of methanol transitions at 85.6, 86.6 and 86.9 GHz in this work are detected for the first time. The CH3OH transition at 85.6 GHz (Fig. 2g) clearly shows an inverse P-Cygni profile. The emission feature peaks at about 4 km s-1, and the absorption feature lies at a velocity of about 0.22 km s-1. Despite the low S/N ratios in the CH3OH spectra at 86.6 and 86.9 GHz (Figs. 3g–3h), their shapes are indicative of an inverse P-Cygni profile. The velocities and line widths of the absorption features of the 86.6 and 86.9 GHz lines are similar to that of the 85.6 GHz line, but their absorption line strengths are much weaker than that of the 85.6 GHz line. This could be due to a lower excitation temperature of the 85.6 GHz line.
The most common class I CH3OH transitions at 36, 44, 84 and 95 GHz show strong and narrow maser features, and the velocities of these maser features range from 7 to 6 km s-1 (see Table 3). Therefore, all the class I methanol masers are significantly blueshifted with respect to the systemic velocity (see Fig. 5). These masers have been already reported by previous studies. The peak velocity and flux density of the 84 and 95 GHz CH3OH masers from our observations are consistent with previous observations (Chen et al. 2012; Breen et al. 2019). However, the flux densities of the 36 and 44 GHz CH3OH masers of our Effelsberg-100 m observations are about 2–3 times lower than previous single-dish measurements (Haschick & Baan 1989; Kang et al. 2016; Breen et al. 2019; Kim et al. 2019). The discrepancy might arise from the different beam sizes, spectral resolutions, and pointing positions. On the other hand, maser variability may also contribute to the observed difference. To our knowledge, there are few published variability studies of class I methanol masers in the Galaxy. Despite previous claims to the contrary, Menten et al. (1988), using the Effelsberg 100 m telescope, found no significant variability in the 25 GHz class I CH3OH maser lines ( = 2 – 8) in the Orion Kleinmann-Low Nebula, neither on a time baseline of 2 years nor over 13 years, comparing their data with those that Hills et al. (1975) obtained with the same telescope. Because class I methanol masers are often distributed over larger scales than the class II masers, it is more difficult to infer variability from observations using different telescopes with different spatial and spectral resolutions. For example, in Orion KL the 25 GHz masers arise from different location spread over an area that is comparable to the Effelsberg beam (″).
3.2 Detection of 11 redshifted methanol absorption lines towards W3(OH)
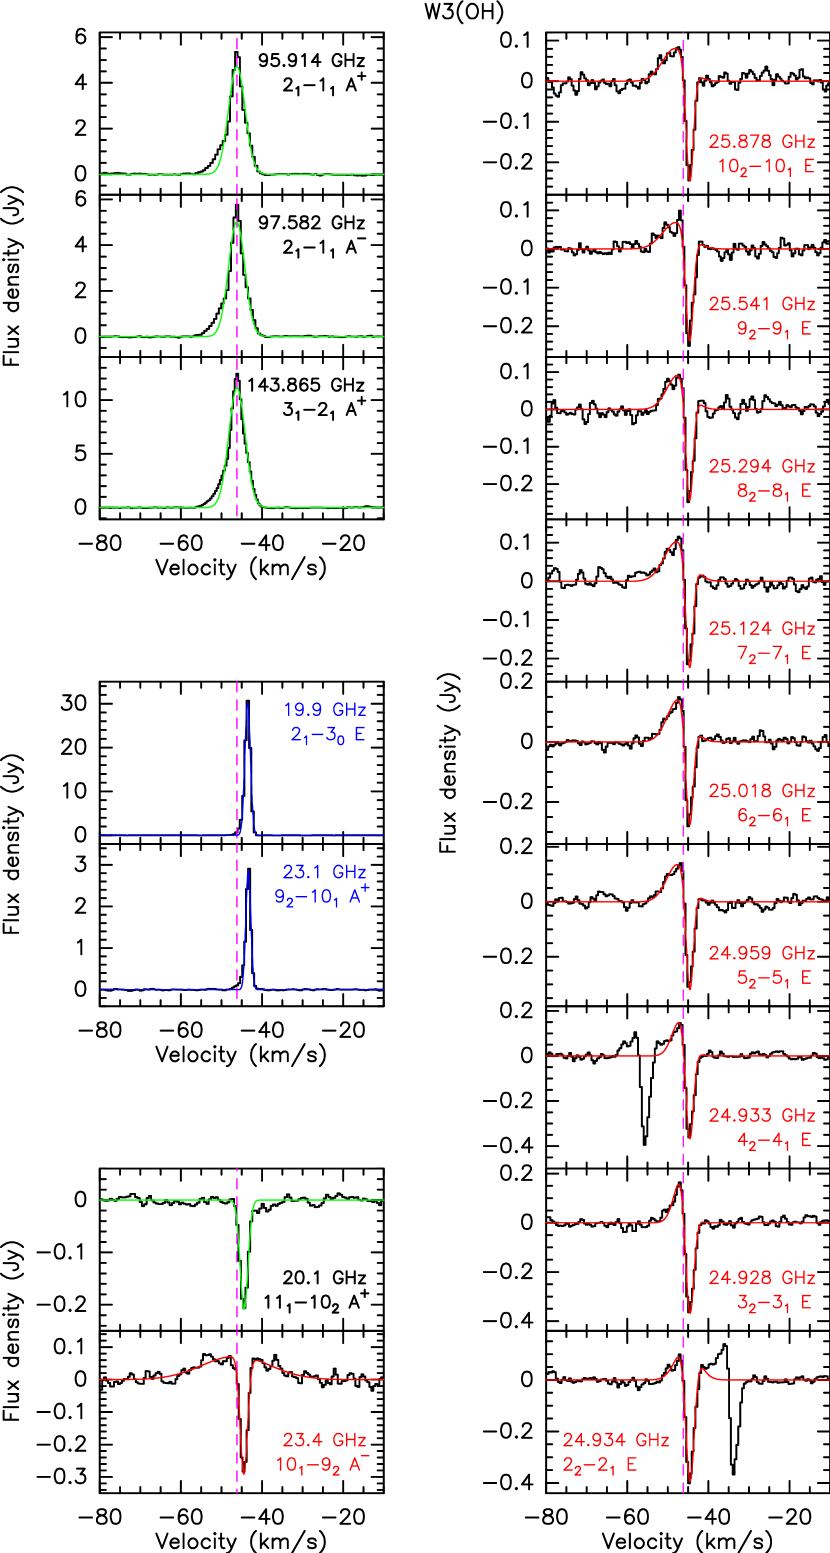
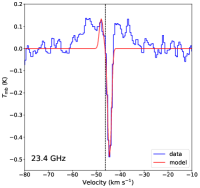
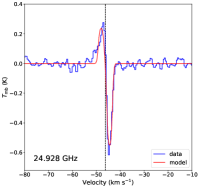
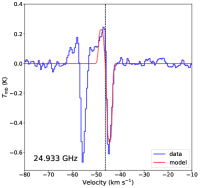
Figure 6 shows the spectra of 16 methanol transitions observed towards W3(OH). The 19.9, 23.1, 95.914, 97.582, 143.865 GHz transitions appear to be single-peaked. The 20.1 and 23.4 GHz lines show absorption features, while the nine lines ( from 2 to 10) of -type methanol near 25 GHz show inverse P-Cygni profiles. We fitted the emission and absorption features using two Gaussian components for the 23.4 GHz and the line series near 25 GHz. One Gaussian component is assumed for the other transitions. The fitted line parameters are given in Table 4. The systemic velocity of the W3(OH) complex is derived from three thermal methanol transitions at 95.914, 97.582 and 143.865 GHz. Similar to W31C, the weighted mean velocity is = 46.190.02 km s-1. This velocity is consistent with previous high angular resolution observations of the W3(OH) region whose systemic velocity is determined to range from 46.5 km s-1 to 46.0 km s-1 (Keto et al. 1995; Zapata et al. 2011). In this work, we simply take =46.190.02 km s-1 from our single-dish observations as the systemic velocity for the subsequent analysis.
The nine lines ( from 2 to 10) of -type methanol near 25 GHz show inverse P-Cygni profiles. The emission features peak at about 47.1 km s-1 for all lines, while the absorption features lie at about 44.6 km s-1. In the nine transitions, the systemic velocity is nearly at the point where the emission feature transits to the absorption feature. The intensities of the absorption features show a descending trend with increasing (see Fig. 6), which appears to be opposite to the case in W31C (see Fig. 4). Because the difference between the rest frequencies of these lines is small, the continuum levels should be almost identical. Hence, the trend strongly suggests that the excitation temperatures of these transitions decreases with increasing in W3(OH). Our results are generally consistent with the line profiles of the (=2, 3, 4, 5, 6, 9) lines in Menten et al. (1986a) except that different line profiles are found in the and lines. Their observations revealed double absorption features in these two transitions, but only one single absorption component is seen in our observations. The double absorption features were interpreted as a weak maser at a velocity of 44 km s-1 that partially covers the absorption trough (Menten et al. 1986a). The non-detection of the double absorption features by our observations may indicate temporal variation of this weak maser.
The absorption feature in both the 20.1 and 23.4 GHz lines has an LSR velocity of about 44.4 km s-1 with a line width of 2 km s-1, which is in good agreement with the results reported by Menten et al. (1986b). Despite the different intensities that might be caused by different spectral resolutions and calibrations, the line profiles of the observed masers at 19.9 and 23.1 GHz are also consistent with the spectra obtained more than 30 years ago (Wilson et al. 1984, 1985). The line at 28.3 GHz and the maser line at 19.9 GHz belong to the same series, but absorption features were detected in the former line by Slysh et al. (1992) and Wilson et al. (1993), and the absorption features appear to be nearly at the same velocity as those at 20.1 and 23.4 GHz.
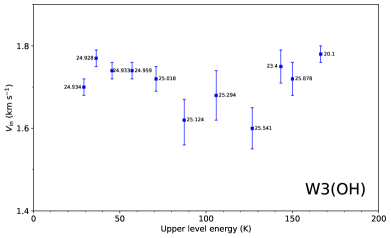
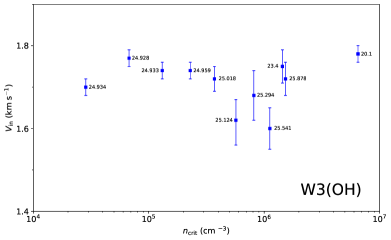
Figure 7 shows the line velocity as a function of the upper energy level and critical density of each transition for W3(OH). We find that all detected absorption features have a velocity of about 44.6 km s-1, which is redshifted with respect to the systemic velocity. The detected class II methanol masers at 19.9 and 23.1 GHz are even more redshifted than the absorption features. The three types of methanol emission indicate the presence of three distinct groups of lines in Fig. 7, and the velocities of the three groups seem to be independent of the energy level of the respective transitions and the critical density.
4 Discussion
4.1 Modelling redshifted methanol absorption
Our observations have shown that redshifted methanol absorption is more prominent in the lower frequency (radio wavelength) transitions than in those at higher frequencies. This is expected since the two sources host UCHII regions, whose free-free continuum emission becomes optically thin regime at higher frequencies, which results in a reduction of the continuum brightness temperature (e.g. Kurtz 2005; Yang et al. 2021). Furthermore, the observed absorption is mainly caused by cool gas that lies in the foreground of the free-free continuum emission. Therefore, low frequency lines that are absorbed from levels with low energy above the ground state tend to be more prominent. We also note that the absorption features of methanol lines from transitions at nearby frequencies can exhibit quite different intensities, indicating different excitation temperatures. This suggests that their populations deviate from local thermodynamic equilibrium (LTE). As discussed in Sec. 1, such non-LTE effects can be easily achieved for various methanol lines by collisional pumping (e.g. Leurini et al. 2016), and such effects could lead to very low excitation temperatures (even 2.73 K) in methanol transitions.
Our single-dish spectra are likely tracing large-scale inward motions, but the large-scale density, temperature, and velocity structures might not be well described by simple analytical solutions. Hence, we use a simple two-layer model for this study instead of more sophisticated radiative transfer models. In order to demonstrate the feasibility of using redshifted methanol absorption to quantify infall motions, we make use of a modified two-layer model as discussed by Myers et al. (1996); Di Francesco et al. (2001) to fit the observed redshifted methanol absorption profiles. In this model, the two layers lie along the line of sight. The “front” layer lies between the observer and the continuum source with an excitation temperature , while the “rear” layer lies behind the source with an excitation temperature . The continuum source is assumed to be optically thick with a blackbody temperature , and the cosmic background radiation is also included. Each layer has a peak optical depth, , velocity dispersion, , and infall velocity, , towards the source. The Planck-corrected brightness temperature at the rest frequency is defined as , where , is Planck’s constant, and is Boltzmann’s constant. , , , and are the Planck-corrected brightness temperature of the “front” layer, “rear” layer, central continuum source, and the cosmic background radiation, respectively. The central continuum source fills a fraction of of the observing beam with and is the systemic LSR velocity of the source. According to this model (Di Francesco et al. 2001), the observed line brightness temperature can be expressed as,
| (1) |
where
| (2) |
| (3) |
| (4) |
In order to reduce the number of free parameters, we fixed =3.43 km s-1 for W31C and =46.19 km s-1 for W3(OH), while =2.73 K and =0.9 are adopted for both sources. The fixed parameter is arbitrarily selected. However, we tested the model with =0.1–0.9, and the resulting , and stayed nearly identical, while and changed dramatically. For each transition, the model inputs also include the corresponding rest frequency and the radiation from the central continuum source (). The continuum flux densities contributed by the central UCHii region were obtained from interferometric radio continuum measurements (see Yang et al. 2021 for W31C, see Wilson et al. 1991 for W3(OH)), and corresponding values are thus calculated by adopting different frequencies and beam sizes. After fixing these parameters, there are still five free parameters , , , , which will be determined by comparison with our spectra.
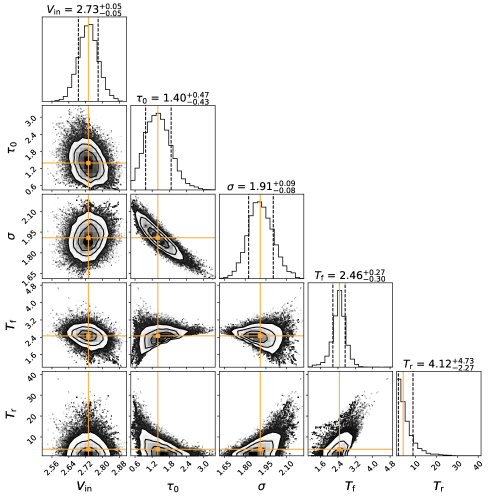
In order to derive the free parameters in the model together with their uncertainties, we used the emcee code (Foreman-Mackey et al. 2013) to perform Monte Carlo Markov chain (MCMC) calculations with the affine-invariant ensemble sampler (Goodman & Weare 2010). Uniform priors are assumed for the five free parameters. The likelihood function is assumed to be , and is defined as:
| (5) |
where and are the observed and modelled brightness temperatures for each channel, and is the standard deviation of . The posterior distribution of these parameters is estimated by the product of the prior and likelihood functions. For the MCMC calculations, we run 20 walkers and 10000 steps after the burn-in phase. The 1 errors in the fitted parameters are estimated by the 16th and 84th percentiles of the posterior distribution. In order to help the convergence, the parameter spaces are set to be 0.5–10 km s-1 for , 0.05–30 for , 0.5–3 km s-1 for , 0–150 K for and . The MCMC fitting to the 37.7 GHz CH3OH line in W31C is shown in Fig. 8. The same method is applied to all the methanol transitions showing redshifted absorption, and the fitted spectra are presented in Figs. 9–10 for W31C and W3(OH), respectively, and Table 5 shows the fitting parameters.
We note that the infall velocity is the key parameter in deriving the infall rates, which are of central interest for understanding mass accretion in star formation. We tested the model with different fixed parameters to study how is affected. We find that the derived infall velocity is nearly independent of the assumed parameters. This is generally in line with previous studies (Pineda et al. 2012) in which such behaviour was verified using a different method (i.e. minimised- fitting). However, we also note that the presence of maser emission components in the redshifted velocity range might lead to underestimation of . Furthermore, the uncertainties in the assumed systemic velocity will propagate to , so there may be additional uncertainties of 0.44 km s-1 and 0.02 km s-1 in for W31C and W3(OH) (see Secs. 3.1 and 3.2). On the other hand, , and are coupled (see Eqs. 1–4), so their values can be significantly affected by varying the fixed parameters.
The value of 1.07 km s-1 in the 25.541 GHz transition may be underestimated, because the observed spectrum is not well fitted by the model (see Fig. 9). The cause of the anomaly may be due to an inaccurate for the 25.541 GHz line. If we use a velocity of 2 km s-1, around which velocity the emission transits to absorption, we can reproduce a better fit giving km s-1. derived from the 86.6 and 86.9 GHz lines has a large uncertainty due to poor S/N ratios.
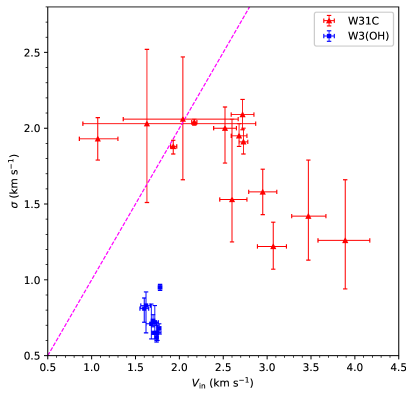
Except for the 25.541, 86.6 and 86.9 GHz transitions, the derived in W31C ranges from 2.0 to 3.5 km s-1 at corresponding linear scales of 0.3–1.0 pc, which is generally consistent with the infall velocities derived by other tracers at a linear scale of 0.2–0.3 pc (e.g. Liu et al. 2013; Liu 2017). Good agreement with other estimates of the infall velocity is also seen in W3(OH). Our derived in W3(OH) lies in the range 1.6–1.8 km s-1 at a linear scale of 0.4 pc, consistent with previously reported infall velocities (Keto et al. 1987b; Wilson et al. 1991). These results suggest that redshifted methanol absorption can reliably estimate the infall velocities. Further discussion of the relationship between the infall velocity and the upper level, critical density and velocity dispersion can be found in Appendix B.
The values we obtain are lower than the infall velocities (4.5–6.5 km s-1) measured on smaller scales of 0.02–0.05 pc in W31C (Keto et al. 1987a, 1988; Keto 2002; Sollins et al. 2005). As already mentioned, our beams cover both W3(H2O) and W3(OH). High angular HCO+ (3–2) resolution observations suggest that the infall velocity of W3(H2O) is 2.70.3 km s-1 at a linear scale of 0.02 pc (Qin et al. 2016), higher than our values of 1.5–1.8 km s-1. Both cases suggest that the infall velocities are lower at larger scales. This is readily explained by gravity-dominated velocity fields that are commonly assumed to follow a power-law distribution (Keto et al. 1988; Evans 2003; Li 2018), for instance, the free-fall velocity follows . Therefore, our observations are likely to trace the large-scale inward motions of the two sources. Our spectra of W31C indicate that inward motions may be present on scales larger than previously reported. However, our observations can only loosely constrain the linear scale (1 pc) with the beam size, so further mapping observations are needed to better constrain the scale of inward motions.
Assuming a uniform density sphere undergoing spherically symmetric free fall for both sources (e.g. Pineda et al. 2012), we estimate the mass infall rates to be (3–15) yr-1 for W31C and (1–2) yr-1 for W3(OH), similar to the values estimated for massive clumps in other studies (e.g, Schneider et al. 2010). Mass infall rates of this magnitude are able to overcome the radiation pressure due to the luminosity of the central star during the high-mass star formation process (McKee & Tan 2003). The large-scale inward motions and the high mass infall rates favour a global collapse for both sources, consistent with the global hierarchical collapse and clump-fed scenario (e.g. Motte et al. 2018; Vázquez-Semadeni et al. 2019) that is different from the low-mass star formation picture (see also Appendix B).

4.2 Methanol absorption in different environments
Our observations have revealed redshifted absorption in multiple methanol transitions towards both W31C and W3(OH). However, absorption features are not always observed in the same transitions for different sources. For example, redshifted absorption features are detected in the line at 19.9 GHz and the line at 23.1 GHz towards W31C, but these two transitions are found to show (class II) maser emission in W3(OH), and thus may also affect absorption of W31C, towards which also the 6.7 and 12.1 GHz transitions show absorption as well as maser features.
Furthermore, towards W3(OH), the nine lines all show (apparent) inverse P-Cygni profiles towards W3(OH). These resemble very closely the profiles of the 24/25 GHz inversion transitions of NH3 observed towards this region (like us) with the Effelsberg 100 m telescope by Wilson et al. (1978); Mauersberger et al. (1986). Mapping of the line by Mauersberger et al. (1986) (with the Effelsberg beam) showed that the emission component arises from a position east of the absorption, which arises from the UCHII region. Consequently, Mauersberger et al. (1986) persuasively argued that the emission arises from the hot core(s) discussed in Sec. 1, which actually was one of the very first hot molecular cores ever identified (by Turner & Welch 1984) at the site of H2O maser emission in the region (Forster et al. 1977).
Because of this source-by-source variation, it might not be straightforward to use a single methanol transition to systematically search for infall motions towards high-mass star formation regions. Abundant methanol transitions that are accessible by ground-based telescopes cover a broad range of energy levels and critical densities (see Table 1). This allows us to investigate inward motions at different scales and for different environments. Therefore, observations of multiple methanol transitions provide a suitable choice for such studies.
Based on K-band single-dish observations, NGC7538 IRS1 shows methanol maser emission and absorption features similar to W3(OH), but the absorption velocities with respect to their respective systemic velocities are different. In both sources, absorption features have been detected in the (=2,3,4,5,6,9) lines near 25 GHz (Menten et al. 1986a), the line at 23.4 GHz, and the line at 20.1 GHz (Menten et al. 1986b), while maser emission has been detected in the line at 19.9 GHz (Wilson et al. 1985) and the line at 23.1 GHz (Wilson et al. 1984). The systemic velocity of NGC7538 IRS1 is about 57.4 km s-1 derived from the thermal methanol quartet lines near 96 GHz (Minier & Booth 2002). The methanol transitions at 20.1, 23.4 GHz and six lines near 25 GHz show absorption and the velocities of these absorption features range from 59.9 to 59.1 km s-1, revealing that the absorption features are actually blueshifted with respect to the systemic velocity. This result is also in line with previous NH3 (1,1), (2,2), (3,3) measurements (e.g. Wilson et al. 1983; Henkel et al. 1984; Keto 1991). These blueshifted absorption lines are indicative of expansion in NGC7538 IRS1 which is likely caused by its associated powerful outflows (e.g. Qiu et al. 2011). This is in stark contrast to our observed redshifted absorption in W3(OH). This indicates that these two sources have very different dominant large-scale motions on the clump-scales probed by single-dish observations. Therefore, our single-dish methanol observations support that both W31C and W3(OH) host ongoing large-scale inward motions, although both sources also show outflows on smaller scales (Liu et al. 2010a; Zapata et al. 2011; Qin et al. 2016). On the other hand, higher angular resolution (02) observations of the high-energy line HCN (43) =1 ( = 1050 K) shows redshifted absorption towards NGC7538 IRS1, indicating infall motions in its innermost regions (Beuther et al. 2013). Therefore, one might need high energy and high critical density methanol transitions to disentangle the infall motions and outflows in sources exhibiting complex velocity structures. Nevertheless, the single-dish redshifted methanol absorption measurements have been demonstrated to be a good tracer of the large-scale inward motions for high-mass star-formation regions, providing motivation for follow-up studies with higher angular resolution observations.
It is important to note that CH3OH absorption in the 6.7 and 12.1 GHz lines has also been detected in low-mass star formation regions including TMC1, L183, and NGC 1333 (Walmsley et al. 1988; Pandian et al. 2008). These generally do not show centimetre continuum radiation. Instead, the absorption is produced by overcooling against the cosmic microwave background (see Sec. 1). In these sources the absorption dips are at the systemic velocity, that is, the absorption is neither redshifted nor blueshifted, although they are known to show infall motions from other studies (e.g. Di Francesco et al. 2001; Schnee et al. 2007; Kirk et al. 2009). There are two possible explanations for this. One is that the relatively compact size will cause a significant dilution in single-dish observations. Unlike the case of high-mass star formation regions, which can show large-scale collapse, low-mass star formation regions usually exhibit local collapse, that is, collapse only becomes prominent towards compact dense cores. For the NGC1333 IRAS4A observations, the beam size was about 40 for the 6.7 GHz methanol absorption observations (Pandian et al. 2008), while the collapsing region is known to have an angular scale of 5–7 from interferometric observations of H2CO and N2H+ (10) (Di Francesco et al. 2001). This implies that the filling factor was only 2%–3%. On the other hand, anti-inversion of the 6.7 GHz methanol transition is expected in a more extended region with densities of cm-3 (Pandian et al. 2008). Therefore, the redshifted methanol absorption might be largely diluted by the large beam of the single-dish observations. The second possible explanation is that the infall velocities of these low-mass star formation regions are 0.5 km s-1 (e.g. Di Francesco et al. 2001; Schnee et al. 2007), generally lower than those of their high-mass counterparts. The low infall velocities will result in small velocity shifts in the spectra which are difficult to disentangle. For example, the velocity shift is as small as 0.15 km s-1 in TMC1 (Schnee et al. 2007). Interferometric observations of CH3OH absorption with high spectral resolution are therefore required to determine whether redshifted methanol absorption can trace infall motions towards low-mass star formation.
4.3 Redshifted methanol absorption is common or not in high-mass star formation regions
As discussed in Sec. 4.1, the two studied objects contain UCHII regions with high free-free continuum flux densities. If bright continuum sources are required to be able to detect the absorption, then redshifted methanol absorption can only be observed in a limited number of sources at a late evolutionary stage where they host a bright UCHII region. In order to roughly estimate the number of potential sources, we have used the results from the Coordinated Radio “N” Infrared Survey for High-mass star formation (CORNISH) project that covers 110 deg2 of the northern sky (10, 1∘) using the VLA in B and BnA configurations at 5 GHz (Hoare et al. 2012; Purcell et al. 2013). Based on the CORNISH survey, Kalcheva et al. (2018) compiled a catalogue of 239 UCHii regions. In this catalogue, the flux density of W31C(G10.62340.3837) at 5 GHz is measured to be 1952.22 mJy. We find only 10 out of 239 sources (including W31C) have flux densities of 1952.22 mJy and if we adopt that as the threshold criterion, it implies that redshifted methanol absorption may be detected in only 4% of the UCHii regions, if we neglect the collisional pumping effects. It is worth noting that the CORNISH survey is only sensitive to compact UCHii regions due to the missing short spacing problem. Given the single-dish measurements that could be pointed against extended Hii regions, the estimated percentage of 4% based on the CORNISH survey should be underestimated. On the other hand, the W31C flux threshold appears to contradict the observations of Peng & Whiteoak (1992) who reported a detection rate of 66% (38/58) for methanol absorption at 12.2 GHz towards bright southern Hii regions and some selected dark clouds. This suggests that the criteria of using the flux density of W31C is an unnecessarily high threshold, however, the detection of methanol absorption towards sources without UCHII regions suggests that collisional pumping effects cannot be neglected in at least a handful of cases (e.g. Walmsley et al. 1988; Pandian et al. 2008). This is also supported by our observations that the absorption intensities differ for different transitions with similar rest frequencies. The overcooling of methanol transitions due to collisional pumping can greatly aid in the detection of methanol absorption.
Based on our current work, we can only give a lower limit of 4% for the fraction of potential UCHII regions showing methanol absorption. For many regions the overcooling of methanol transitions may also enhance absorption, as is observed towards low-mass sources and dark clouds, but this requires specific physical conditions (e.g. Walmsley et al. 1988; Pandian et al. 2008; Leurini et al. 2016). The work undertaken to date suggests that redshifted methanol absorption may be most suitable for studying infall motions towards high-mass star formation regions hosting bright HII regions.
5 Summary
We have performed observations of multiple methanol transitions towards two well-known collapsing dense clumps, W31C(G10.60.4) and W3(OH), with the Effelsberg-100 m, IRAM-30 m, and APEX-12 m telescopes. We detected 14 and 11 redshifted methanol absorption towards W31C and W3(OH), respectively. Redshifted methanol absorption in the 20.1, 25.541, 25.878, 37.7, 38.3, 38.5, 85.6, 86.6 and 86.9 GHz transitions are reported towards W31C for the first time. The infall velocities estimated using a two-layer model agree with previously reported values derived from other tracers, suggesting that redshifted methanol absorption is a reliable tracer of infall motions within high-mass star formation regions hosting bright HII regions. Furthermore, our observations indicate the presence of large-scale (1 pc) inward motions, and the mass infall rates are estimated to be 10-3 yr-1, which supports the global hierarchical collapse and clump-fed scenario.
ACKNOWLEDGMENTS
We greatly thank Dr. Yuxin Lin for her help on the critical density calculations and discussions about the multi-layer view of global collapse. We acknowledge the IRAM-30 m, APEX-12 m, and Effelsberg-100 m staff for their assistance with our observations. IRAM is supported by INSU/CNRS (France), MPG (Germany) and IGN (Spain). The research leading to these results has received funding from the European Union’s Horizon 2020 research and innovation programme under grant agreement No 730562 [RadioNet]. APEX is a collaboration between the Max-Planck-Institut für Radioastronomie, the European Southern Observatory, and the Onsala Space Observatory. This work is also based on observations with the 100-m telescope of the MPIfR (Max-Planck-Institut für Radioastronomie) at Effelsberg. This work made use of Python libraries including Astropy666https://www.astropy.org/ (Astropy Collaboration et al. 2013), NumPy777https://www.numpy.org/ (van der Walt et al. 2011), SciPy888https://www.scipy.org/ (Jones et al. 2001), Matplotlib999https://matplotlib.org/ (Hunter 2007), APLpy (Robitaille & Bressert 2012), emcee101010https://emcee.readthedocs.io/en/stable/ (Foreman-Mackey et al. 2013), and corner.py (Foreman-Mackey 2016). This paper was prepared using the Overleaf111111https://www.overleaf.com web application.
References
- Ahmadi et al. (2018) Ahmadi, A., Beuther, H., Mottram, J. C., et al. 2018, A&A, 618, A46
- Astropy Collaboration et al. (2013) Astropy Collaboration, Robitaille, T. P., Tollerud, E. J., et al. 2013, A&A, 558, A33
- Batrla et al. (1987) Batrla, W., Matthews, H. E., Menten, K. M., & Walmsley, C. M. 1987, Nature, 326, 49
- Beuther et al. (2013) Beuther, H., Linz, H., & Henning, T. 2013, A&A, 558, A81
- Breen et al. (2019) Breen, S. L., Contreras, Y., Dawson, J. R., et al. 2019, MNRAS, 484, 5072
- Breen et al. (2014) Breen, S. L., Ellingsen, S. P., Caswell, J. L., et al. 2014, MNRAS, 438, 3368
- Breen et al. (2010) Breen, S. L., Ellingsen, S. P., Caswell, J. L., & Lewis, B. E. 2010, MNRAS, 401, 2219
- Carter et al. (2012) Carter, M., Lazareff, B., Maier, D., et al. 2012, A&A, 538, A89
- Caswell (2009) Caswell, J. L. 2009, PASA, 26, 454
- Caswell et al. (1995a) Caswell, J. L., Vaile, R. A., Ellingsen, S. P., & Norris, R. P. 1995a, MNRAS, 274, 1126
- Caswell et al. (1995b) Caswell, J. L., Vaile, R. A., Ellingsen, S. P., Whiteoak, J. B., & Norris, R. P. 1995b, MNRAS, 272, 96
- Chen et al. (2012) Chen, X., Ellingsen, S. P., He, J.-H., et al. 2012, ApJS, 200, 5
- Coudert et al. (2015) Coudert, L. H., Gutlé, C., Huet, T. R., Grabow, J. U., & Levshakov, S. A. 2015, J. Chem. Phys., 143, 044304
- Cragg et al. (2005) Cragg, D. M., Sobolev, A. M., & Godfrey, P. D. 2005, MNRAS, 360, 533
- Csengeri et al. (2016) Csengeri, T., Leurini, S., Wyrowski, F., et al. 2016, A&A, 586, A149
- Di Francesco et al. (2001) Di Francesco, J., Myers, P. C., Wilner, D. J., Ohashi, N., & Mardones, D. 2001, ApJ, 562, 770
- Dreher & Welch (1981) Dreher, J. W. & Welch, W. J. 1981, ApJ, 245, 857
- Ellingsen et al. (2011) Ellingsen, S. P., Breen, S. L., Sobolev, A. M., et al. 2011, ApJ, 742, 109
- Ellingsen et al. (2012) Ellingsen, S. P., Sobolev, A. M., Cragg, D. M., & Godfrey, P. D. 2012, ApJ, 759, L5
- Ellingsen et al. (2018) Ellingsen, S. P., Voronkov, M. A., Breen, S. L., Caswell, J. L., & Sobolev, A. M. 2018, MNRAS, 480, 4851
- Elmegreen & Scalo (2004) Elmegreen, B. G. & Scalo, J. 2004, ARA&A, 42, 211
- Evans (2003) Evans, Neal, I. 2003, in SFChem 2002: Chemistry as a Diagnostic of Star Formation, ed. C. L. Curry & M. Fich, 157
- Foreman-Mackey (2016) Foreman-Mackey, D. 2016, Journal of Open Source Software, 1, 24
- Foreman-Mackey et al. (2013) Foreman-Mackey, D., Hogg, D. W., Lang, D., & Goodman, J. 2013, PASP, 125, 306
- Forster et al. (1990) Forster, J. R., Caswell, J. L., Okumura, S. K., Hasegawa, T., & Ishiguro, M. 1990, A&A, 231, 473
- Forster et al. (1977) Forster, J. R., Welch, W. J., & Wright, M. C. H. 1977, ApJ, 215, L121
- Gildas Team (2013) Gildas Team. 2013, GILDAS: Grenoble Image and Line Data Analysis Software
- Goodman & Weare (2010) Goodman, J. & Weare, J. 2010, Communications in Applied Mathematics and Computational Science, 5, 65
- Green et al. (2010) Green, J. A., Caswell, J. L., Fuller, G. A., et al. 2010, MNRAS, 409, 913
- Güsten et al. (2006) Güsten, R., Nyman, L. Å., Schilke, P., et al. 2006, A&A, 454, L13
- Haschick & Baan (1989) Haschick, A. D. & Baan, W. A. 1989, ApJ, 339, 949
- Henkel et al. (1984) Henkel, C., Wilson, T. L., & Johnston, K. J. 1984, ApJ, 282, L93
- Hills et al. (1975) Hills, R., Pankonin, V., & Landecker, T. L. 1975, A&A, 39, 149
- Ho & Haschick (1986) Ho, P. T. P. & Haschick, A. D. 1986, ApJ, 304, 501
- Ho & Young (1996) Ho, P. T. P. & Young, L. M. 1996, ApJ, 472, 742
- Hoare et al. (2012) Hoare, M. G., Purcell, C. R., Churchwell, E. B., et al. 2012, PASP, 124, 939
- Houghton & Whiteoak (1995) Houghton, S. & Whiteoak, J. B. 1995, MNRAS, 273, 1033
- Hunter (2007) Hunter, J. D. 2007, Computing in Science & Engineering, 9, 90
- Hunter et al. (2014) Hunter, T. R., Brogan, C. L., Cyganowski, C. J., & Young, K. H. 2014, ApJ, 788, 187
- Jones et al. (2001) Jones, E., Oliphant, T., Peterson, P., et al. 2001, SciPy: Open source scientific tools for Python
- Kalcheva et al. (2018) Kalcheva, I. E., Hoare, M. G., Urquhart, J. S., et al. 2018, A&A, 615, A103
- Kang et al. (2016) Kang, J.-h., Byun, D.-Y., Kim, K.-T., et al. 2016, ApJS, 227, 17
- Keto (2002) Keto, E. 2002, ApJ, 568, 754
- Keto (1990) Keto, E. R. 1990, ApJ, 355, 190
- Keto (1991) Keto, E. R. 1991, ApJ, 371, 163
- Keto et al. (1987a) Keto, E. R., Ho, P. T. P., & Haschick, A. D. 1987a, ApJ, 318, 712
- Keto et al. (1988) Keto, E. R., Ho, P. T. P., & Haschick, A. D. 1988, ApJ, 324, 920
- Keto et al. (1987b) Keto, E. R., Ho, P. T. P., & Reid, M. J. 1987b, ApJ, 323, L117
- Keto et al. (1995) Keto, E. R., Welch, W. J., Reid, M. J., & Ho, P. T. P. 1995, ApJ, 444, 765
- Kim et al. (2019) Kim, W.-J., Kim, K.-T., & Kim, K.-T. 2019, ApJS, 244, 2
- Kim et al. (2020) Kim, W. J., Wyrowski, F., Urquhart, J. S., et al. 2020, A&A, 644, A160
- Kirk et al. (2009) Kirk, J. M., Crutcher, R. M., & Ward-Thompson, D. 2009, ApJ, 701, 1044
- Klaassen & Wilson (2008) Klaassen, P. D. & Wilson, C. D. 2008, ApJ, 684, 1273
- Klein et al. (2012) Klein, B., Hochgürtel, S., Krämer, I., et al. 2012, A&A, 542, L3
- Kurtz (2005) Kurtz, S. 2005, in Massive Star Birth: A Crossroads of Astrophysics, ed. R. Cesaroni, M. Felli, E. Churchwell, & M. Walmsley, Vol. 227, 111–119
- Kurtz et al. (2004) Kurtz, S., Hofner, P., & Álvarez, C. V. 2004, ApJS, 155, 149
- Larson (1981) Larson, R. B. 1981, MNRAS, 194, 809
- Lees & Haque (1974) Lees, R. M. & Haque, S. S. 1974, Canadian Journal of Physics, 52, 2250
- Leung & Brown (1977) Leung, C. M. & Brown, R. L. 1977, ApJ, 214, L73
- Leurini et al. (2016) Leurini, S., Menten, K. M., & Walmsley, C. M. 2016, A&A, 592, A31
- Li (2018) Li, G.-X. 2018, MNRAS, 477, 4951
- Lin et al. (2016) Lin, Y., Liu, H. B., Li, D., et al. 2016, ApJ, 828, 32
- Liu (2017) Liu, H. B. 2017, A&A, 597, A70
- Liu et al. (2010a) Liu, H. B., Ho, P. T. P., & Zhang, Q. 2010a, ApJ, 725, 2190
- Liu et al. (2010b) Liu, H. B., Ho, P. T. P., Zhang, Q., et al. 2010b, ApJ, 722, 262
- Liu et al. (2012) Liu, H. B., Quintana-Lacaci, G., Wang, K., et al. 2012, ApJ, 745, 61
- Liu et al. (2011) Liu, H. B., Zhang, Q., & Ho, P. T. P. 2011, ApJ, 729, 100
- Liu et al. (2013) Liu, T., Wu, Y., Wu, J., Qin, S.-L., & Zhang, H. 2013, MNRAS, 436, 1335
- Mangum & Wootten (1993) Mangum, J. G. & Wootten, A. 1993, ApJS, 89, 123
- Mauersberger et al. (1986) Mauersberger, R., Wilson, T. L., & Walmsley, C. M. 1986, A&A, 166, L26
- McKee & Tan (2003) McKee, C. F. & Tan, J. C. 2003, ApJ, 585, 850
- Mehrotra et al. (1985) Mehrotra, S. C., Dreizler, H., & Mäder, H. 1985, Zeitschrift Naturforschung Teil A, 40, 683
- Menten (1991a) Menten, K. M. 1991a, in Astronomical Society of the Pacific Conference Series, Vol. 16, Atoms, Ions and Molecules: New Results in Spectral Line Astrophysics, ed. A. D. Haschick & P. T. P. Ho, 119–136
- Menten (1991b) Menten, K. M. 1991b, ApJ, 380, L75
- Menten et al. (1986a) Menten, K. M., Walmsley, C. M., Henkel, C., & Wilson, T. L. 1986a, A&A, 157, 318
- Menten et al. (1988) Menten, K. M., Walmsley, C. M., Henkel, C., & Wilson, T. L. 1988, A&A, 198, 267
- Menten et al. (1986b) Menten, K. M., Walmsley, C. M., Henkel, C., et al. 1986b, A&A, 169, 271
- Minier & Booth (2002) Minier, V. & Booth, R. S. 2002, A&A, 387, 179
- Motte et al. (2018) Motte, F., Bontemps, S., & Louvet, F. 2018, ARA&A, 56, 41
- Müller et al. (2004) Müller, H. S. P., Menten, K. M., & Mäder, H. 2004, A&A, 428, 1019
- Müller et al. (2005) Müller, H. S. P., Schlöder, F., Stutzki, J., & Winnewisser, G. 2005, Journal of Molecular Structure, 742, 215
- Myers et al. (1996) Myers, P. C., Mardones, D., Tafalla, M., Williams, J. P., & Wilner, D. J. 1996, ApJ, 465, L133
- Ortiz-León et al. (2021) Ortiz-León, G. N., Menten, K. M., Brunthaler, A., et al. 2021, A&A, 651, A87
- Pandian et al. (2008) Pandian, J. D., Leurini, S., Menten, K. M., Belloche, A., & Goldsmith, P. F. 2008, A&A, 489, 1175
- Peng & Whiteoak (1989) Peng, R. S. & Whiteoak, J. B. 1989, PASA, 8, 204
- Peng & Whiteoak (1992) Peng, R. S. & Whiteoak, J. B. 1992, MNRAS, 254, 301
- Pety (2005) Pety, J. 2005, in SF2A-2005: Semaine de l’Astrophysique Francaise, ed. F. Casoli, T. Contini, J. M. Hameury, & L. Pagani, 721
- Pineda et al. (2012) Pineda, J. E., Maury, A. J., Fuller, G. A., et al. 2012, A&A, 544, L7
- Purcell et al. (2013) Purcell, C. R., Hoare, M. G., Cotton, W. D., et al. 2013, ApJS, 205, 1
- Purcell et al. (2012) Purcell, C. R., Longmore, S. N., Walsh, A. J., et al. 2012, MNRAS, 426, 1972
- Qin et al. (2016) Qin, S.-L., Schilke, P., Wu, J., et al. 2016, MNRAS, 456, 2681
- Qin et al. (2015) Qin, S.-L., Schilke, P., Wu, J., et al. 2015, ApJ, 803, 39
- Qiu et al. (2011) Qiu, K., Zhang, Q., & Menten, K. M. 2011, ApJ, 728, 6
- Rabli & Flower (2010) Rabli, D. & Flower, D. R. 2010, MNRAS, 406, 95
- Robitaille & Bressert (2012) Robitaille, T. & Bressert, E. 2012, APLpy: Astronomical Plotting Library in Python
- Salii & Sobolev (2006) Salii, S. V. & Sobolev, A. M. 2006, Astronomy Reports, 50, 965
- Sanna et al. (2014) Sanna, A., Reid, M. J., Menten, K. M., et al. 2014, ApJ, 781, 108
- Schnee et al. (2007) Schnee, S., Caselli, P., Goodman, A., et al. 2007, ApJ, 671, 1839
- Schneider et al. (2010) Schneider, N., Csengeri, T., Bontemps, S., et al. 2010, A&A, 520, A49
- Shirley (2015) Shirley, Y. L. 2015, PASP, 127, 299
- Slysh et al. (1992) Slysh, V. I., Kalenskii, S. V., & Val’tts, I. E. 1992, ApJ, 397, L43
- Slysh et al. (1999) Slysh, V. I., Kalenskii, S. V., Val’TTS, I. E., Golubev, V. V., & Mead, K. 1999, ApJS, 123, 515
- Slysh et al. (2002) Slysh, V. I., Kalenskiĭ, S. V., & Val’tts, I. E. 2002, Astronomy Reports, 46, 49
- Sobolev et al. (1997) Sobolev, A. M., Cragg, D. M., & Godfrey, P. D. 1997, A&A, 324, 211
- Sobolev & Deguchi (1994) Sobolev, A. M. & Deguchi, S. 1994, A&A, 291, 569
- Sollins & Ho (2005) Sollins, P. K. & Ho, P. T. P. 2005, ApJ, 630, 987
- Sollins et al. (2005) Sollins, P. K., Zhang, Q., Keto, E., & Ho, P. T. P. 2005, ApJ, 624, L49
- Sun & Gao (2009) Sun, Y. & Gao, Y. 2009, MNRAS, 392, 170
- Tang et al. (2018) Tang, X. D., Henkel, C., Wyrowski, F., et al. 2018, A&A, 611, A6
- Turner & Welch (1984) Turner, J. L. & Welch, W. J. 1984, ApJ, 287, L81
- Val’tts et al. (1999) Val’tts, I. E., Ellingsen, S. P., Slysh, V. I., et al. 1999, MNRAS, 310, 1077
- van der Tak et al. (2019) van der Tak, F. F. S., Shipman, R. F., Jacq, T., et al. 2019, A&A, 625, A103
- van der Walt et al. (2011) van der Walt, S., Colbert, S. C., & Varoquaux, G. 2011, Computing in Science Engineering, 13, 22
- Vázquez-Semadeni et al. (2019) Vázquez-Semadeni, E., Palau, A., Ballesteros-Paredes, J., Gómez, G. C., & Zamora-Avilés, M. 2019, MNRAS, 490, 3061
- Voronkov et al. (2006) Voronkov, M. A., Brooks, K. J., Sobolev, A. M., et al. 2006, MNRAS, 373, 411
- Voronkov et al. (2011) Voronkov, M. A., Walsh, A. J., Caswell, J. L., et al. 2011, MNRAS, 413, 2339
- Walmsley et al. (1988) Walmsley, C. M., Batrla, W., Matthews, H. E., & Menten, K. M. 1988, A&A, 197, 271
- Welch et al. (1987) Welch, W. J., Dreher, J. W., Jackson, J. M., Terebey, S., & Vogel, S. N. 1987, Science, 238, 1550
- Whiteoak et al. (1988) Whiteoak, J. B., Gardner, F. F., Caswell, J. L., et al. 1988, MNRAS, 235, 655
- Whiteoak & Peng (1989) Whiteoak, J. B. & Peng, R. S. 1989, MNRAS, 239, 677
- Wilson et al. (1978) Wilson, T. L., Bieging, J., & Downes, D. 1978, A&A, 63, 1
- Wilson et al. (1993) Wilson, T. L., Huettemeister, S., Dahmen, G., & Henkel, C. 1993, A&A, 268, 249
- Wilson et al. (1991) Wilson, T. L., Johnston, K. J., & Mauersberger, R. 1991, A&A, 251, 220
- Wilson et al. (1983) Wilson, T. L., Mauersberger, R., Walmsley, C. M., & Batrla, W. 1983, A&A, 127, L19
- Wilson et al. (1985) Wilson, T. L., Walmsley, C. M., Menten, K. M., & Hermsen, W. 1985, A&A, 147, L19
- Wilson et al. (1984) Wilson, T. L., Walmsley, C. M., Snyder, L. E., & Jewell, P. R. 1984, A&A, 134, L7
- Wu & Evans (2003) Wu, J. & Evans, Neal J., I. 2003, ApJ, 592, L79
- Wu et al. (2010) Wu, J., Evans, Neal J., I., Shirley, Y. L., & Knez, C. 2010, ApJS, 188, 313
- Wyrowski et al. (2016) Wyrowski, F., Güsten, R., Menten, K. M., et al. 2016, A&A, 585, A149
- Wyrowski et al. (2012) Wyrowski, F., Güsten, R., Menten, K. M., Wiesemeyer, H., & Klein, B. 2012, A&A, 542, L15
- Wyrowski et al. (2006) Wyrowski, F., Heyminck, S., Güsten, R., & Menten, K. M. 2006, A&A, 454, L95
- Wyrowski et al. (1999) Wyrowski, F., Schilke, P., Walmsley, C. M., & Menten, K. M. 1999, ApJ, 514, L43
- Xu et al. (2006) Xu, Y., Reid, M. J., Zheng, X. W., & Menten, K. M. 2006, Science, 311, 54
- Yang et al. (2019) Yang, A. Y., Thompson, M. A., Tian, W. W., et al. 2019, MNRAS, 482, 2681
- Yang et al. (2021) Yang, A. Y., Urquhart, J. S., Thompson, M. A., et al. 2021, A&A, 645, A110
- Zapata et al. (2011) Zapata, L. A., Rodríguez-Garza, C., Rodríguez, L. F., Girart, J. M., & Chen, H.-R. 2011, ApJ, 740, L19
- Zhang & Ho (1997) Zhang, Q. & Ho, P. T. P. 1997, ApJ, 488, 241
- Zhang et al. (1998) Zhang, Q., Ho, P. T. P., & Ohashi, N. 1998, ApJ, 494, 636
- Zhou et al. (1993) Zhou, S., Evans, Neal J., I., Koempe, C., & Walmsley, C. M. 1993, ApJ, 404, 232
Appendix A Tables
| No. | CH3OH | Rest frequency | Line | Class | W31C | Note | ||
| Transition | (MHz) | (GHz) | (K) | (cm-3) | Reference | |||
| series | ||||||||
| 1 | 108 893.963(7)∗ | 108 | II | 13.1 | 2.28104 | this work | maser?/thermal | |
| 2 | 12 178.597(4)∗ | 12.2 | II | 20.1 | 7.58104 | this work,(1)(3) | maser & absorption | |
| 3 | 36 169.265(30)∗ | 36 | I | 28.8 | 5.01104 | this work,(4),(5) | maser | |
| 4 | 84 521.169(10)∗ | 84 | I | 40.4 | 1.04105 | this work,(5) | maser | |
| 5 | 132 890.692(10)∗ | 132.9 | I | 54.3 | 1.88105 | (6) | maser?/thermal | |
| 6 | 229 758.760(50)∗ | 229 | I | 89.1 | 4.92105 | this work | maser?/thermal | |
| series | ||||||||
| 7 | 230 027.047(11)α | 230 | - | 39.8 | 2.93106 | this work | thermal | |
| 8 | 133 605.439(11)α | 133.6 | II | 60.7 | 3.19106 | (6) | maser?/thermal | |
| 9 | 85 568.084(10)∗ | 85.6 | II | 74.7 | 3.54106 | this work | inverse P-Cygni | |
| 10 | 37 703.700(30)∗ | 37.7 | II | 90.9 | 3.98106 | this work | absorption | |
| 11 | 104 300.414(7)∗ | 104 | I | 158.6 | 1.49106 | this work | maser?/thermal | |
| series | ||||||||
| 12 | 19 967.3961(2)∗ | 19.9 | II | 28.0 | 1.53105 | this work,(7) | inverse P-Cygni(a) | |
| 13 | 220 078.561(8)α | 220 | - | 96.6 | 1.25106 | this work | thermal | |
| @25 GHz series | ||||||||
| 14 | 24 934.3801(16)β | 24.934 | I | 29.2 | 2.85104 | this work,(8) | maser?/thermal(b) | |
| 15 | 24 928.6994(8)β | 24.928 | I | 36.3 | 6.76104 | this work,(8) | maser?/thermal(b) | |
| 16 | 24 933.4693(8)β | 24.933 | I | 45.5 | 1.31105 | this work,(8) | maser?/thermal(b) | |
| 17 | 24 959.0789(4)∗ | 24.959 | I | 57.1 | 2.29105 | this work,(8) | maser(b) | |
| 18 | 25 018.1225(4)∗ | 25.018 | I | 71.0 | 3.71105 | this work,(8) | maser(b) | |
| 19 | 25 124.8719(4)∗ | 25.124 | I | 87.3 | 5.69105 | this work | maser(b) | |
| 20 | 25 294.4165(2)∗ | 25.294 | I | 105.8 | 8.14105 | this work | maser(b) | |
| 21 | 25 541.3979(4)∗ | 25.541 | I | 126.7 | 1.12106 | this work | inverse P-Cygni(b) | |
| 22 | 25 878.2661(4)∗ | 25.878 | I | 150.0 | 1.53106 | this work | inverse P-Cygni(b) | |
| 23 | 216 945.521(12)α | 216 | II | 55.9 | 4.84105 | this work | maser?/thermal | |
| 24 | 218 440.063(13)α | 218 | I | 45.5 | 1.31105 | this work | maser?/thermal | |
| series | ||||||||
| 25 | 107 013.803(5)∗ | 107 | II | 28.3 | 9.17105 | this work | maser?/thermal | |
| 26 | 6 668.5188(4)β | 6.7 | II | 49.1 | 1.66106 | this work,(9)(12) | maser & absorption | |
| 27 | 44 069.410(10)∗ | 44 | I | 65.0 | 2.80105 | this work,(13)(15) | maser | |
| 28 | 95 169.463(10)∗ | 95 | I | 83.5 | 4.29105 | this work,(16) | maser | |
| series | ||||||||
| 29 | 38 293.268(50)∗ | 38.3 | II | 86.5 | 3.76106 | this work | absorption | |
| 30 | 38 452.677(50)∗ | 38.5 | II | 86.5 | 3.81106 | this work | absorption | |
| 31 | 86 615.600(5)∗ | 86.6 | II | 102.7 | 4.30106 | this work | absorption | |
| 32 | 86 902.949(5)∗ | 86.9 | II | 102.7 | 4.26106 | this work | absorption | |
| 33 | 231 281.100(12)α | 231 | II | 165.3 | 6.22106 | this work | maser?/thermal | |
| 34 | 232 418.521(12)α | 232 | II | 165.4 | 6.36106 | this work | maser?/thermal | |
| series | ||||||||
| 35 | 234 683.370(12)α | 234 | - | 60.9 | 2.99106 | this work | thermal | |
| 36 | 132 621.824(12)α | 132.6 | II | 86.5 | 3.76106 | (6) | maser?/thermal | |
| 37 | 23 444.778(2)γ | 23.4 | I | 143.3 | 1.44106 | this work,(17) | absorption(c) | |
| series | ||||||||
| 38 | 111 289.550(10)∗ | 111 | - | 102.7 | 4.26106 | this work | thermal | |
| 39 | 23 121.0242(5)∗ | 23.1 | II | 142.2 | 5.68106 | this work,(18) | absorption(a) | |
| 40 | 20 171.089(2)γ | 20.1 | - | 166.4 | 6.50106 | this work | absorption(c) | |
| series | ||||||||
| 41 | 95 914.309(5)∗ | 95.914 | - | 21.4 | 7.04105 | - | -(d) | |
| 42 | 97 582.804(7)∗ | 97.582 | - | 21.6 | 5.14105 | - | -(d) | |
| 43 | 143 865.801(10)∗ | 143.865 | - | 28.3 | 9.17105 | - | -(d) |
| Line | Obs. date | beam size | rms | Scaling factor | ||
| (GHz) | (yyyymmdd) | () | (km s-1) | (Jy) | (Jy/K) | |
| W31C | ||||||
| Effelsberg-100 m observations | ||||||
| 6.7 | 20210105 | 109 | 0.16 | 0.02 | 0.69 | 0.66 |
| 12.2 | 20210105 | 62 | 0.13 | 0.02 | 0.67 | 0.70 |
| 19.9 | 20210514 | 40 | 0.66 | 0.01 | 0.62 | 0.83 |
| 20.1 | 20210514 | 40 | 0.66 | 0.01 | 0.62 | 0.83 |
| 23.1 | 20210514 | 36 | 0.57 | 0.02 | 0.60 | 0.97 |
| 23.4 | 20210514 | 36 | 0.57 | 0.02 | 0.60 | 0.97 |
| 25 series | 20210514 | 34 | 0.53 | 0.02 | 0.58 | 1.02 |
| 36 | 20200914 | 24 | 0.37 | 0.04 | 0.47 | 1.19 |
| 37.7 | 20200914 | 23 | 0.35 | 0.04 | 0.44 | 1.27 |
| 38.3 | 20200914 | 23 | 0.35 | 0.04 | 0.44 | 1.27 |
| 38.5 | 20200914 | 23 | 0.34 | 0.05 | 0.44 | 1.27 |
| 44 | 20200530 | 20 | 0.30 | 0.04 | 0.39 | 1.47 |
| IRAM-30 m observations | ||||||
| 84 | 20110408 | 29 | 0.80 | 0.26 | 0.81 | 5.82 |
| 85.6 | 20200629 | 29 | 0.79 | 0.08 | 0.81 | 5.82 |
| 86.6 | 20200629 | 28 | 0.78 | 0.09 | 0.81 | 5.82 |
| 86.9 | 20200629 | 28 | 0.78 | 0.08 | 0.81 | 5.82 |
| 95 | 20110409 | 26 | 0.71 | 0.16 | 0.81 | 5.82 |
| 104 | 20200629 | 24 | 0.65 | 0.10 | 0.78 | 5.98 |
| 107 | 20200629 | 23 | 0.61 | 0.13 | 0.78 | 5.98 |
| 108 | 20110411 | 23 | 0.62 | 0.20 | 0.78 | 5.98 |
| 111 | 20110411 | 22 | 0.61 | 0.29 | 0.78 | 5.98 |
| APEX-12 m observations | ||||||
| 216 | 20190612 | 29 | 0.17 | 0.60 | 0.72 | 40 |
| 218 | 20190612 | 29 | 0.17 | 0.71 | 0.72 | 40 |
| 220 | 20190612 | 28 | 0.17 | 0.64 | 0.72 | 40 |
| 229 | 20190601 | 27 | 0.16 | 0.74 | 0.72 | 40 |
| 230 | 20190601 | 27 | 0.16 | 0.72 | 0.72 | 40 |
| 231 | 20190601 | 27 | 0.16 | 1.14 | 0.72 | 40 |
| 232 | 20190601 | 27 | 0.16 | 0.73 | 0.72 | 40 |
| 234 | 20190601 | 27 | 0.16 | 0.88 | 0.72 | 40 |
| W3(OH) | ||||||
| Effelsberg-100 m observations | ||||||
| 19.9 | 20210513 | 40 | 0.66 | 0.01 | 0.62 | 0.83 |
| 20.1 | 20210513 | 40 | 0.66 | 0.01 | 0.62 | 0.83 |
| 23.1 | 20210513 | 36 | 0.57 | 0.01 | 0.60 | 0.97 |
| 23.4 | 20210513 | 36 | 0.57 | 0.01 | 0.60 | 0.97 |
| 25 series | 20210513 | 34 | 0.53 | 0.01 | 0.58 | 1.02 |
| IRAM-30 m observations | ||||||
| 95.914 | 20190629 | 26 | 0.71 | 0.03 | 0.81 | 5.82 |
| 97.582 | 20190629 | 25 | 0.70 | 0.02 | 0.81 | 5.82 |
| 143.865 | 20190629 | 17 | 0.47 | 0.03 | 0.73 | 6.32 |
| Line | ||||
|---|---|---|---|---|
| (GHz) | (km s-1) | (km s-1) | (Jy) | (Jy km s-1) |
| 6.7 | 8.19 (0.01) | 0.59 (0.03) | 1.42 (0.21) | 0.89 (0.04) |
| 6.7 | 1.93 (0.07) | 3.34 (0.16) | 0.65 (0.21) | 2.31 (0.09) |
| 6.7 | 4.78 (0.01) | 0.88 (0.02) | 3.70 (0.21) | 3.45 (0.05) |
| 12.2 | 1.23 (0.03) | 5.40 (0.05) | 0.42 (0.05) | 2.39 (0.02) |
| 12.2 | 4.84 (0.01) | 0.96 (0.02) | 0.53 (0.05) | 0.55 (0.01) |
| 19.9 | 0.90 (0.11) | 3.99 (0.21) | 0.11 (0.01) | 0.46 (0.03) |
| 20.1 | 0.40 (0.31) | 4.18 (0.63) | 0.06 (0.02) | 0.27 (0.03) |
| 23.1 | 0.74 (0.01) | 4.69 (0.16) | 0.23 (0.02) | 1.15 (0.04) |
| 23.4 | 0.51 (0.22) | 3.87 (0.49) | 0.13 (0.03) | 0.54 (0.05) |
| 24.928 | 9.25 (0.13) | 1.34 (0.36) | 0.04 (0.01) | 0.06 (0.02) |
| 24.928 | 5.18 (0.03) | 4.88 (0.31) | 0.24 (0.01) | 1.26 (0.07) |
| 24.928 | 1.90 (0.07) | 2.37 (0.15) | 0.18 (0.01) | 0.46 (0.04) |
| 24.928 | 2.08 (0.13) | 3.31 (0.32) | 0.11 (0.01) | 0.37 (0.03) |
| 24.933 | 8.04 (0.01) | 2.79 (0.29) | 0.15 (0.01) | 0.44 (0.03) |
| 24.933 | 5.40 (0.04) | 2.71 (0.18) | 0.23 (0.01) | 0.66 (0.04) |
| 24.933 | 2.90 (0.01) | 2.19 (0.13) | 0.25 (0.01) | 0.59 (0.04) |
| 24.933 | 0.52 (0.05) | 2.74 (0.48) | 0.15 (0.01) | 0.45 (0.07) |
| 24.933 | 2.64 (0.26) | 1.85 (0.40) | 0.07 (0.01) | 0.14 (0.04) |
| 24.934 | 4.77 (0.14) | 5.85 (0.31) | 0.16 (0.01) | 0.98 (0.05) |
| 24.934 | 1.99 (0.12) | 1.03 (0.46) | 0.06 (0.01) | 0.06 (0.04) |
| 24.959 | 8.02 (0.11) | 1.57 (0.18) | 0.13 (0.01) | 0.22 (0.01) |
| 24.959 | 5.98 (0.04) | 1.89 (0.20) | 0.28 (0.01) | 0.56 (0.07) |
| 24.959 | 2.80 (0.15) | 3.74 (0.17) | 0.28 (0.01) | 1.11 (0.03) |
| 24.959 | 2.09 (0.14) | 5.36 (1.01) | 0.08 (0.01) | 0.48 (0.07) |
| 25.018 | 8.00 (0.13) | 2.20 (0.32) | 0.12 (0.01) | 0.28 (0.03) |
| 25.018 | 5.97 (0.06) | 1.12 (0.15) | 0.30 (0.01) | 0.35 (0.07) |
| 25.018 | 4.44 (0.11) | 1.67 (0.42) | 0.19 (0.01) | 0.33 (0.12) |
| 25.018 | 2.18 (0.14) | 2.49 (0.32) | 0.21 (0.01) | 0.56 (0.09) |
| 25.018 | 2.21 (0.24) | 3.04 (0.62) | 0.07 (0.01) | 0.22 (0.04) |
| 25.124 | 7.78 (0.12) | 1.69 (0.75) | 0.08 (0.01) | 0.15 (0.04) |
| 25.124 | 5.98 (0.05) | 1.08 (0.17) | 0.20 (0.01) | 0.23 (0.05) |
| 25.124 | 2.92 (0.11) | 4.14 (0.33) | 0.19 (0.01) | 0.82 (0.05) |
| 25.124 | 3.10 (0.17) | 2.59 (0.46) | 0.08 (0.01) | 0.22 (0.03) |
| 25.294 | 4.78 (0.14) | 5.30 (0.27) | 0.12 (0.02) | 0.67 (0.03) |
| 25.541 | 4.93 (0.18) | 4.83 (0.60) | 0.10 (0.01) | 0.49 (0.05) |
| 25.541 | 0.20 (0.18) | 2.21 (0.32) | 0.07 (0.01) | 0.17 (0.04) |
| 25.878 | 5.97 (0.17) | 3.10 (0.34) | 0.07 (0.01) | 0.24 (0.03) |
| 25.878 | 0.10 (0.14) | 2.73 (0.31) | 0.09 (0.01) | 0.26 (0.03) |
| 36 | 7.35 (0.04) | 2.64 (0.03) | 3.52 (0.41) | 9.91 (0.25) |
| 36 | 6.19 (0.03) | 1.43 (0.01) | 12.70 (0.41) | 19.31 (0.31) |
| 36 | 2.84 (0.03) | 7.59 (0.15) | 1.69 (0.41) | 13.67 (0.21) |
| 37.7 | 0.68 (0.05) | 5.35 (0.11) | 0.89 (0.05) | 5.05 (0.09) |
| 38.3 | 0.74 (0.10) | 4.77 (0.22) | 0.38 (0.04) | 1.94 (0.08) |
| 38.5 | 0.65 (0.14) | 4.81 (0.28) | 0.30 (0.06) | 1.54 (0.08) |
| 44 | 7.26 (0.03) | 2.86 (0.05) | 7.58 (0.69) | 23.11 (0.03) |
| 44 | 6.65 (0.00) | 0.76 (0.01) | 44.87 (0.69) | 36.51 (0.33) |
| 84 | 6.94 (0.03) | 2.36 (0.09) | 9.05 (0.39) | 22.70 (1.16) |
| 84 | 3.82 (0.08) | 8.41 (0.13) | 9.77 (0.39) | 87.38 (1.64) |
| 85.6 | 0.22 (0.19) | 3.80 (0.35) | 0.55 (0.08) | 2.22 (0.21) |
| 86.6 | 0.20 (0.56) | 3.79 (1.12) | 0.17 (0.10) | 0.70 (0.20) |
| 86.9 | 0.43 (0.31) | 3.72 (0.88) | 0.29 (0.07) | 1.17 (0.21) |
| 95 | 7.00 (0.01) | 2.33 (0.03) | 13.87 (0.70) | 34.32 (0.55) |
| 95 | 3.65 (0.07) | 9.29 (0.09) | 6.13 (0.70) | 60.54 (0.80) |
| 104 | 2.88 (0.18) | 5.81 (0.51) | 0.75 (0.12) | 4.65 (0.33) |
| 107 | 3.95 (0.04) | 7.00 (0.11) | 6.03 (0.32) | 44.98 (0.58) |
| 108 | 4.00 (0.05) | 7.83 (0.12) | 6.41 (0.28) | 53.43 (0.64) |
| 111 | 4.13 (0.26) | 4.23 (0.68) | 1.32 (0.24) | 5.96 (0.75) |
| 216 | 3.26 (0.05) | 7.26 (0.12) | 14.10 (0.79) | 108.72 (1.47) |
| 218 | 3.33 (0.02) | 7.54 (0.02) | 82.92 (1.70) | 665.33 (1.36) |
| 220 | 2.84 (0.04) | 7.56 (0.09) | 14.30 (0.86) | 114.85 (1.15) |
| 229 | 3.47 (0.01) | 8.18 (0.03) | 43.30 (1.09) | 376.80 (1.24) |
| 230 | 3.21 (0.05) | 6.96 (0.12) | 10.00 (0.78) | 74.41 (1.14) |
| 231 | 2.35 (0.23) | 6.43 (0.52) | 3.37 (0.91) | 23.12 (1.72) |
| 232 | 2.83 (0.17) | 6.87 (0.47) | 3.45 (0.74) | 25.19 (1.35) |
| 234 | 2.92 (0.06) | 7.03 (0.15) | 11.41 (0.99) | 84.74 (1.38) |
| Line | ||||
|---|---|---|---|---|
| (GHz) | (km s-1) | (km s-1) | (Jy) | (Jy km s-1) |
| 19.9 | 43.53 (0.00) | 1.61 (0.01) | 30.16 (0.96) | 51.65 (0.10) |
| 20.1 | 44.40 (0.03) | 2.31 (0.07) | 0.21 (0.01) | 0.51 (0.01) |
| 23.1 | 43.36 (0.00) | 1.45 (0.01) | 2.86 (0.15) | 4.42 (0.03) |
| 23.4 | 46.41 (0.47) | 19.84 (1.02) | 0.07 (0.01) | 1.53 (0.07) |
| 23.4 | 44.47 (0.03) | 2.16 (0.08) | 0.36 (0.01) | 0.83 (0.03) |
| 24.928 | 46.43 (0.24) | 4.56 (0.34) | 0.19 (0.02) | 0.93 (0.11) |
| 24.928 | 44.62 (0.04) | 2.44 (0.09) | 0.49 (0.02) | 1.27 (0.11) |
| 24.933 | 46.78 (0.19) | 4.87 (0.28) | 0.16 (0.03) | 0.84 (0.07) |
| 24.933 | 44.62 (0.02) | 2.26 (0.07) | 0.46 (0.03) | 1.10 (0.06) |
| 24.934 | 45.20 (0.18) | 6.26 (0.50) | 0.14 (0.02) | 0.95 (0.09) |
| 24.934 | 44.51 (0.03) | 2.51 (0.08) | 0.53 (0.02) | 1.42 (0.08) |
| 24.959 | 47.50 (0.26) | 6.51 (0.41) | 0.14 (0.02) | 0.94 (0.07) |
| 24.959 | 44.59 (0.03) | 2.12 (0.09) | 0.40 (0.02) | 0.90 (0.06) |
| 25.018 | 47.24 (0.21) | 6.58 (0.34) | 0.14 (0.02) | 1.00 (0.06) |
| 25.018 | 44.65 (0.03) | 2.21 (0.09) | 0.37 (0.02) | 0.87 (0.05) |
| 25.124 | 47.66 (0.30) | 7.45 (0.57) | 0.10 (0.01) | 0.82 (0.07) |
| 25.124 | 44.63 (0.04) | 2.14 (0.10) | 0.29 (0.01) | 0.66 (0.04) |
| 25.294 | 47.36 (0.42) | 6.66 (0.53) | 0.09 (0.02) | 0.66 (0.08) |
| 25.294 | 44.64 (0.04) | 2.14 (0.13) | 0.30 (0.02) | 0.69 (0.06) |
| 25.541 | 47.90 (0.36) | 7.94 (0.56) | 0.07 (0.02) | 0.58 (0.05) |
| 25.541 | 44.62 (0.03) | 2.17 (0.09) | 0.28 (0.02) | 0.65 (0.03) |
| 25.878 | 48.12 (0.39) | 7.39 (0.59) | 0.08 (0.01) | 0.64 (0.06) |
| 25.878 | 44.57 (0.04) | 2.15 (0.10) | 0.29 (0.01) | 0.66 (0.05) |
| 95.914 | 46.19 (0.01) | 4.81 (0.03) | 4.72 (0.39) | 24.13 (0.13) |
| 97.865 | 46.23 (0.01) | 4.76 (0.03) | 5.01 (0.42) | 25.39 (0.11) |
| 143.865 | 46.15 (0.01) | 4.81 (0.02) | 11.13 (0.73) | 56.91 (0.15) |
| Line | Fixed parameters | Output parameters | ||||
|---|---|---|---|---|---|---|
| (GHz) | (K) | (km s-1) | (km s-1) | (K) | (K) | |
| W31C | ||||||
| 6.7 | 6.83 | 1.93 | 0.15 | 1.88 | 1.41 | 57.36 |
| 12.2 | 6.39 | 2.17 | 0.24 | 2.04 | 1.85 | 2.05 |
| 19.9 | 5.53 | 2.04 | 0.25 | 2.06 | 7.35 | 39.41 |
| 20.1 | 5.42 | 2.72 | 0.11 | 2.09 | 3.82 | 2.50 |
| 23.1 | 5.03 | 2.68 | 0.14 | 1.95 | 2.79 | 9.88 |
| 23.4 | 4.90 | 2.95 | 0.11 | 1.58 | 2.60 | 3.08 |
| 25.541 | 4.62 | 1.07 | 0.31 | 1.93 | 11.83 | 88.35 |
| 25.878 | 4.53 | 3.07 | 0.39 | 1.22 | 6.28 | 29.61 |
| 37.7 | 4.52 | 2.73 | 1.40 | 1.91 | 2.46 | 4.12 |
| 38.3 | 4.38 | 2.52 | 0.39 | 2.00 | 5.16 | 37.05 |
| 38.5 | 4.35 | 2.60 | 3.57 | 1.53 | 3.54 | 2.84 |
| 85.6 | 0.48 | 3.47 | 2.21 | 1.42 | 3.27 | 19.93 |
| 86.6 | 0.48 | 1.63 | 0.17 | 2.03 | 6.24 | 51.23 |
| 86.9 | 0.48 | 3.89 | 0.25 | 1.26 | 4.32 | 32.12 |
| W3(OH) | ||||||
| 20.1 | 5.82 | 1.78 | 0.13 | 0.95 | 2.90 | 9.41 |
| 23.4 | 5.32 | 1.75 | 1.26 | 0.65 | 4.62 | 7.05 |
| 24.928 | 5.28 | 1.77 | 3.18 | 0.68 | 5.23 | 13.00 |
| 24.933 | 5.27 | 1.74 | 4.37 | 0.62 | 5.07 | 11.15 |
| 24.934 | 5.27 | 1.70 | 1.51 | 0.73 | 4.54 | 8.05 |
| 24.959 | 5.26 | 1.74 | 3.70 | 0.65 | 5.25 | 12.24 |
| 25.018 | 5.24 | 1.72 | 4.53 | 0.65 | 5.28 | 11.93 |
| 25.124 | 5.20 | 1.62 | 0.68 | 0.83 | 7.20 | 36.31 |
| 25.294 | 5.12 | 1.68 | 2.14 | 0.71 | 4.65 | 6.44 |
| 25.541 | 5.03 | 1.60 | 0.76 | 0.81 | 5.40 | 18.47 |
| 25.878 | 4.89 | 1.72 | 1.90 | 0.72 | 4.69 | 9.23 |
Appendix B Infall velocity as a function of the upper energy level, critical density, and velocity dispersion
In this Appendix, we compare the derived infall velocity with the upper energy level, critical density as well as velocity dispersion.
Figures 11 and 12 show the infall velocity in W31C and W3(OH) as a function of the upper energy level and critical density, respectively. In W31C, apart from the CH3OH transitions at 25.541, 86.6 and 86.9 GHz (which may have inaccurate or poor S/N ratio), the derived shows an increasing trend with increasing upper energy level and critical density. While in W3(OH), distributes within a narrow velocity range and shows no clear trend with the upper energy level and critical density.
Figure 13 shows that there is a different behaviour between W31C and W3(OH) when comparing with that are derived from the MCMC fitting. We find that is comparable to in W31C for 2.5 km s-1, indicating that the collapse can sustain the turbulence in W31C at a large scale. For 2.5 km s-1, becomes lower than . Because the higher is derived from lines with high energies and critical densities, the behaviour is likely to occur at small scales. This is also the case for W3(OH). At the small scales, the dissipation rate should be higher because of higher densities (e.g. Elmegreen & Scalo 2004). The more efficient dissipation rate may explain the observed behaviour that is lower than . If the observed follows the typical line width-size scaling relation (e.g. Larson 1981), the lower corresponds to the smaller scale. Hence, the trend that increases with decreasing might indicate a multi-layer view of global collapse with hierarchical inflows in W31C.