A tale of two double quasars:
Hubble constant tension or biases?
Abstract
For a flat CDM (standard) cosmology, a small sample of gravitationally lensed quasars with measured time delays has recently provided a value of the Hubble constant in tension with the Planck flat CDM result. Trying to check if this tension is real or not, we used basic observational constraints for two double quasars of the GLENDAMA sample (SBS 0909+532 and SDSS J1339+1310) to discuss the underlying value of in a standard cosmology. For SBS 0909+532, we were not able to obtain a reliable measurement of . However, the current data of SDSS J1339+1310 are consistent with around 67.8 km s-1 Mpc-1 and 10%. Although the formal uncertainty is still large and mainly due to the lack of details on the mass density profile of the main lens galaxy, the central value of coincides with that of the TDCOSMO+SLACS collaboration (using gravitational lens systems) and is within the 1 interval from Planck cosmic microwave background data. After getting these preliminary encouraging results through only one double quasar, we are currently planning to use several GLENDAMA systems to accurately measure the Hubble constant and put constraints on other cosmological parameters.
keywords:
gravitational lensing: strong; quasars: individual (SBS 0909+532, SDSS J1339+1310); cosmological parameters.1 Introduction
Optical photometric monitoring of gravitationally lensed quasars (GLQs) brings plenty of astrophysical information[1]. For example, time delays between correlated brightness variations of their multiple images are used to estimate the current expansion rate of the Universe (the so-called Hubble constant ), provided lensing mass distributions can be constrained by observational data[2, 3]. Throughout this paper, is expressed in standard units of km s-1 Mpc-1, so units only are explicitly given in tables and figures.
Very recently, the H0LiCOW collaboration performed a joint analysis of six GLQs with measured time delays[4]. For a flat CDM standard cosmology, they obtained = 73.3, in good agreement with = 74.03 1.42 from SNe data by the SH0ES collaboration[5], but in apparent tension with Cosmic Microwave Background (CMB) data[6]. Planck observations of the CMB suggested a narrow 1 interval ranging from 66.9 to 67.9, which is clearly inconsistent with H0LiCOW/SH0ES results. It is also worth noting that Freedman et al.[7] obtained an intermediate value of = 69.8 1.9.
The big question is whether the tension between early and late-Universe probes is due to systematic errors or has a physical origin. Possible systematic errors in some methods may fix this issue, avoiding hasty rejection of the standard cosmological model. Thus, we use two doubly imaged quasars of the Gravitational LENses and DArk MAtter (GLENDAMA) sample[8] to discuss the influence of observational constraints, and hypotheses and priors on the mass model in the estimation of the Hubble constant in a standard cosmology. \Srefgoico:sec2 briefly presents the GLENDAMA project and the framework of time-delay cosmography through double quasars, while \srefgoico:sec3 and \srefgoico:sec4 include preliminary results for the GLQs SBS 0909+532 and SDSS J1339+1310, respectively. A discussion of results and future prospects appear in \srefgoico:sec5.
2 GLENDAMA project and from doubles
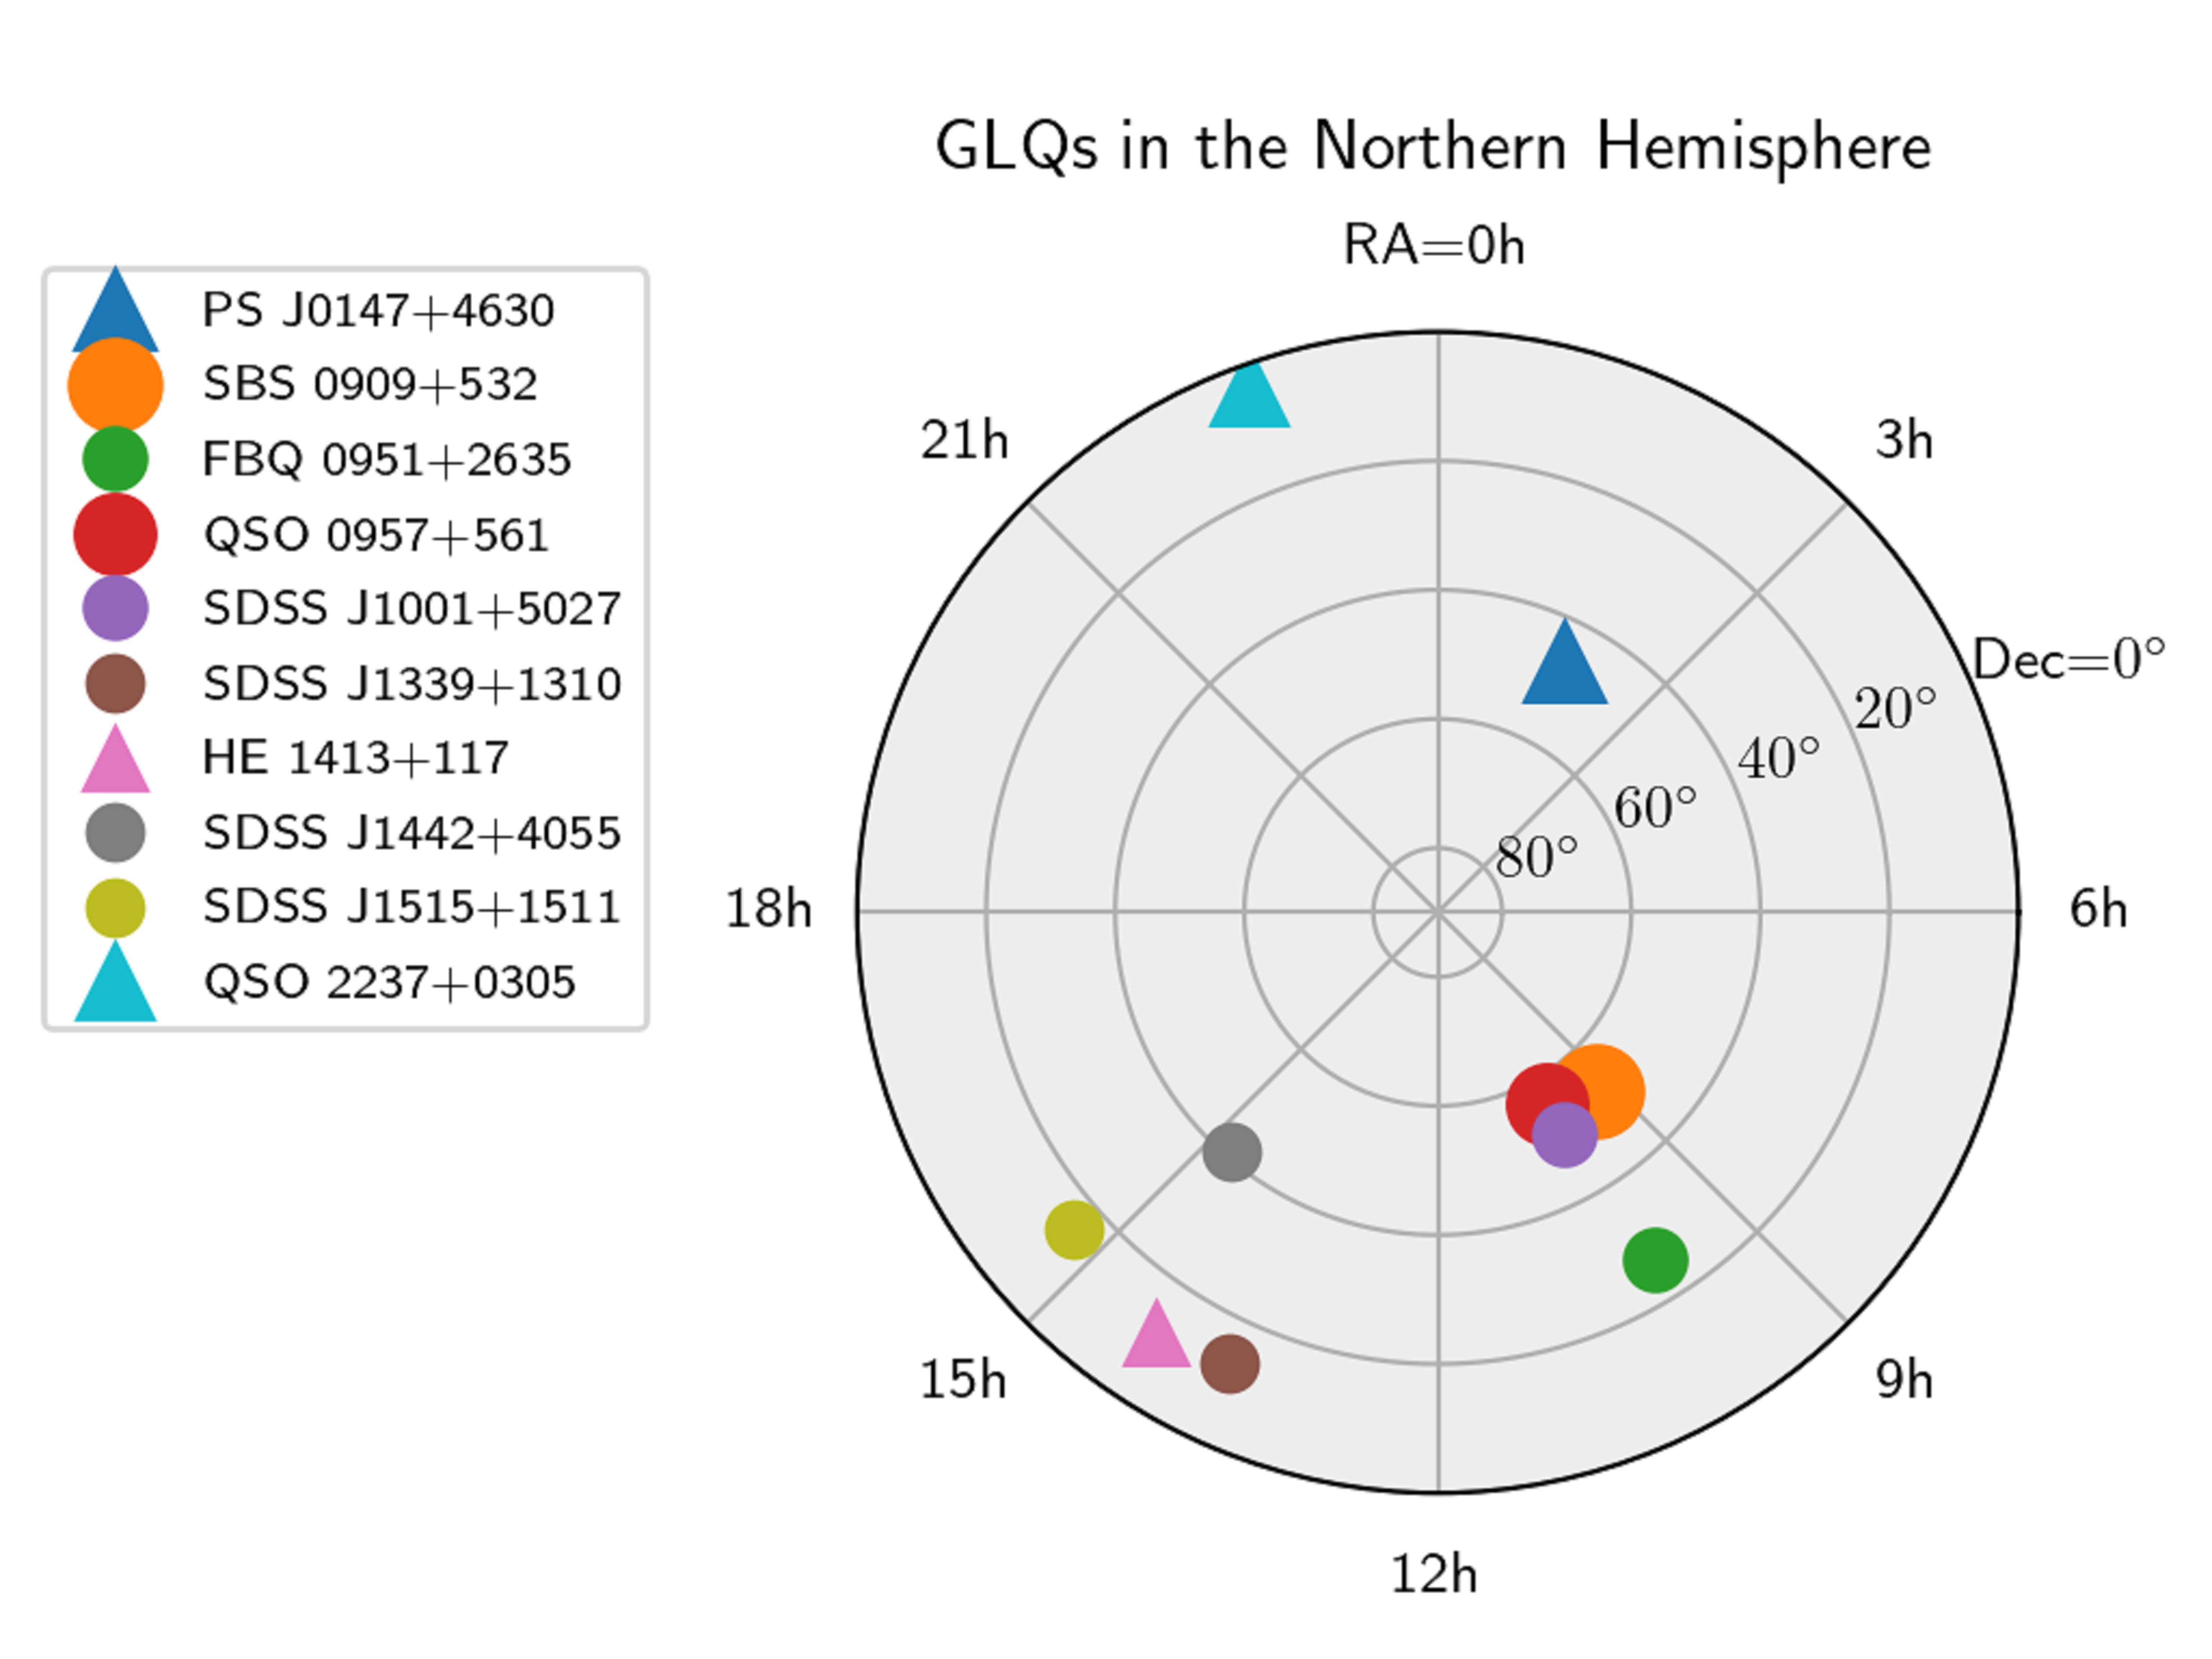
The GLENDAMA project111https://gravlens.unican.es/. is aimed to accurately study a sample of ten GLQs in the Northern Hemisphere over a period of about 25 years, basically covering the first quarter of this century[8]. The sample includes seven double quasars with two images (A and B) each, and three quads having four images (A, B, C and D) each. \Frefgoico:fig1 shows the distribution on the sky of the selected, optically bright GLQs. The Gran Telescopio CANARIAS (GTC) is being used to obtain deep spectroscopy of the lens systems, while the optical variability of quasar images is traced from light curves mainly based on observations with the Liverpool Telescope (LT). These optical light curves are allowing us to measure the time delay in doubles, and three independent delays , and in quads (see results in \trefgoico:tbl1). Current GLENDAMA delays have been estimated to a typical accuracy of about 5%, with only two exceptions: the relative error in the delay of QSO 0957+561 is well below 5%, and the three delays of the quad HE 1413+117 have larger relative uncertainties.
GLENDAMA time delays from light curves in the SDSS band.
\topruleGLQ
Reference
(days)
(days)
(days)
\colrulePS J0147+4630
pm
pm
pm
—
SBS 0909+532
50
—
—
Ref. 9
FBQ 0951+2635
pm
—
—
—
QSO 0957+561
420.6 1.9
—
—
Ref. 10
SDSS J1339+1310
48 2
—
—
Ref. 11
HE 1413+117
17 3
20 4
23 4
Ref. 12
SDSS J1442+4055
25.0 1.5
—
—
Ref. 13
SDSS J1515+1511
211 5
—
—
Ref. 14
\botrule
{tabnote}
pm = preliminary measure.
The time delay between the two images of a double quasar can be expressed in terms of the so-called time-delay distance , the speed of light and a dimensionless factor , so that[3] . Here, depends on the source (quasar) and deflector (main lens galaxy) redshifts, as well as cosmological parameters. Measuring the redshifts, and assuming a flat CDM cosmological model with = 0.3 (matter density) and = 0.7 (dark energy density), is given as a known constant divided by 222The time-delay distance does not appreciably change when matter and dark energy densities are slightly different to 0.3 and 0.7, respectively.. Additionally, depends on the position of both images and the source, and the lens potential at the image positions[2, 3]. Hence, the lensing mass distribution determines the value of the multiplicative factor .
We used a lens model to describe the primary lensing mass in SBS 0909+532 and SDSS J1339+1310. For each of these two double quasars, our lens model consisted of an elliptical surface mass density to account for the main lens galaxy G and an external shear due to the gravitational action of other galaxies around the lens system. The surface mass density of G was modeled as a singular power-law distribution since a composite model (treating baryons and dark matter individually) leads to similar results[15, 16]. In this preliminar study, instead of using high-resolution imaging to put constraints on the power-law index of G, we focused on an isothermal distribution, i.e., a singular isothermal ellipsoid (SIE). Such distribution is consistent with stellar and gas motions in the Milky Way, as well as observations of many spiral and elliptical galaxies. We also did not use the stellar kinematics of G[17].
We considered constraints on the time delay, the relative astrometry and the flux ratio between images, along with some observationally-motivated priors on SIE+ lens model parameters. These constraints/priors and the LENSMODEL software[18] allowed us to simultaneously fit lens model parameters, position and flux of the source quasar, and with dof = 0, where ”dof” means degrees of freedom. In addition to the mass that is explicitly included in the lens model (main deflector plus external shear), we must take the mass along the line of sight to G into account. This additional effect can be approximated as an external convergence in the lens plane , which may be positive or negative depending on the mass distribution along the sightline. The true time-delay distance relates to that derived from the lens model and measured delay by (e.g., see Eq. (4) of Ref. 4), which leads to . Therefore, when accounting for an external convergence, the Hubble constant decreases/increases in a factor . The two next sections deal with estimates of from observations of SBS 0909+532 and SDSS J1339+1310.
3 SBS 0909+532
SBS 0909+532 is a doubly imaged quasar in which the background source (quasar) and the foreground early-type lens galaxy (main deflector) have redshifts = 1.377 and = 0.830, respectively[19, 20, 21]. Our first set of observational constraints consisted of the SBS 0909+532 time delay in \trefgoico:tbl1 taking a symmetric uncertainty (50 3 days)333Despite 49 3 days is fully consistent with the measurement in \trefgoico:tbl1, initially we have preferred to keep its central value and divide the error bar into two identical halves., the relative astrometry of B and G (their positions with respect to A at the origin of coordinates) and the flux of B in units such that the flux of A is equal to one. These last astro-photometric constraints were taken from the near-IR data in Table 3 of Ref. 22. We also considered priors on the ellipticity and external shear of the SIE+ lens model described in \srefgoico:sec2: 0.5 (see Table 3 of Ref. 23) and 0.1 (see Table 4 of Ref. 22).
Although the data fit yielded a best solution for of 68.4 (see \trefgoico:tbl2), unfortunately, the relative astrometry of Lehár et al.[22] is not so good as would be desirable. For instance, the relative position of the faint lens galaxy G was determined with a large uncertainty of about 100 mas (1 mas = 0.′′001). The insufficiently accurate astrometric measures were responsible for a broad valley in the curve (see the black solid line in \frefgoico:fig2), so the 1 confidence interval for included values below 55 and above 80. If we were able to improve the Lehár et al.’s astrometry, e.g., reducing errors in relative positions of B and G in factors 3 and 10, respectively, the best solution of would be practically the same, but its uncertainty would be dramatically decreased to about 10%. Using ”achievable” uncertainties of 1 mas in B and 10 mas in G, we obtained the black dashed-dotted line in \frefgoico:fig2 and = 68.5 7.5.
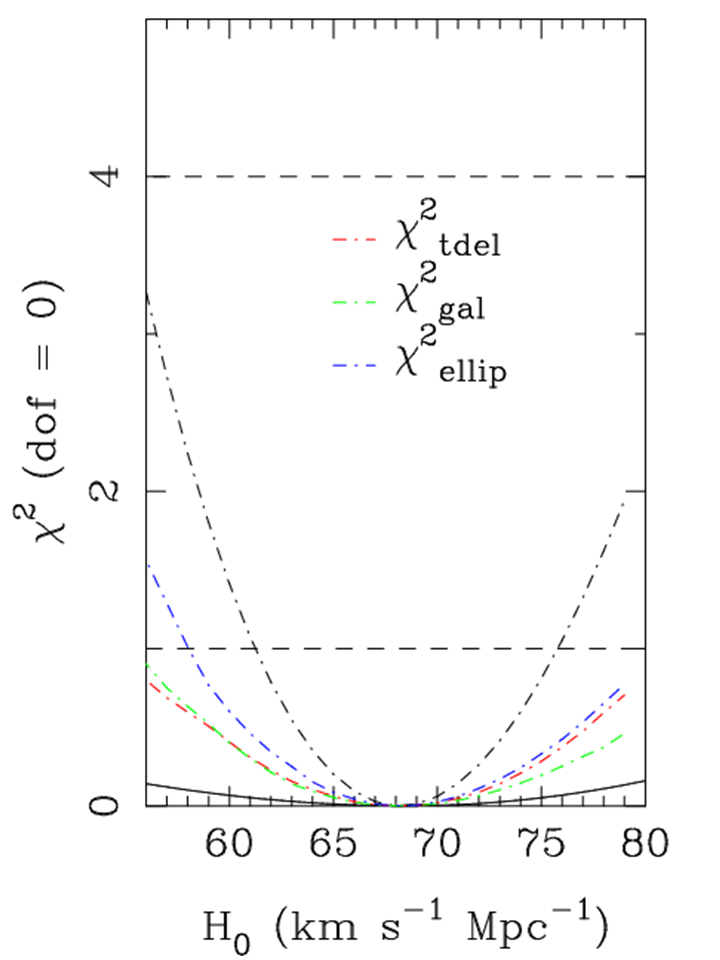
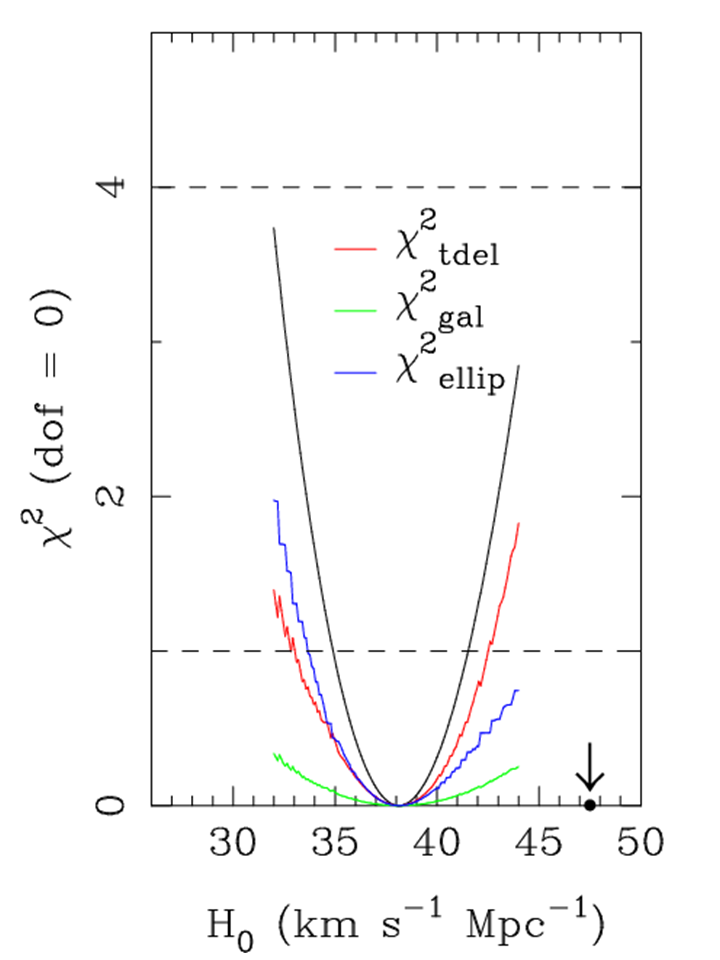
In addition to new observations of the lens system, a reanalysis of the available frames of SBS 0909+532 might produce a better astrometry for the system, and thus provide an accurate measure of the Hubble constant. This is a promising task that we and other astronomers are exploring. Sluse et al.[23] have reanalysed the available near-IR frames, obtaining a formally improved astrometry and even details on the structure of G. The error in the relative position of G was only 3 mas; about 3040 times smaller than the uncertainty derived by Lehár et al. We also considered these new constraints to measure . Using the SBS 0909+532 time delay with symmetric error (see above) and the astro-photometric solutions in Table 4 of Sluse et al., along with the ellipticity and position angle of G in Table 3 of Sluse et al. (priors on the SIE+ lens model), we found = 38.2 3.3 (see \trefgoico:tbl2 and the black solid line in \frefgoico:fig3). Even the 2 confidence interval only includes values below 45. Although a moderate increase in the best solution of is found when taking the previous priors 0.5 and 0.1 (see the black dot and vertical arrow in \frefgoico:fig3), the Sluse et al.’s relative astrometry leads to best solutions below 50. Hence, either such astrometry is biased or the near-IR fluxes of the quasar images (optical emission) are strongly affected by microlensing in the lens galaxy[24].
Results for using a SIE+ lens model (see main text).
\toprule
Observational constraints
Priors on model parameters
GLQ
best
1
SBS 0909+532
50 3
0.987 0.003
0.498 0.003
0.415 0.100
0.004 0.100
0.89 0.10
0.5
—
0.1
68.4
—
0.987 0.001
0.498 0.001
0.415 0.010
0.004 0.010
68.3
68.5 7.5
0.9868 0.0006
0.4973 0.0006
0.464 0.003
0.055 0.003
0.88 0.10
0.11 0.08
48.1 16.9
—
38.1
38.2 3.3
0.5
—
0.1
47.5
—
SDSS J1339+1310
47.0 5.5
+1.419 0.001
+0.939 0.001
+0.981 0.010
+0.485 0.010
0.175 0.015
0.18 0.05
32 10
—-
69.1
69
48 2
67.6
67.8 4.4
\Hline
{tabnote}
Time delay between both images in days. Some errors have been made symmetric.
Relative positions of B and G with respect to A at the origin of coordinates. Here,
and are given in arc seconds, and their positive directions are defined by west and north,
respectively. For SBS 0909+532, some errors have been conveniently approximated.
Flux ratio. For SBS 0909+532, errors are enlarged to 10% to account for moderate microlensing
effects.
Ellipticity and position angle of the SIE. The position angle () is measured east of
north.
External shear strength.
Best solution and 1 confidence interval for . We use standard units of
km s-1 Mpc-1.
Plausible but not real measurement. Astrometric errors have been reduced to ”achievable” values
(see next row).
Real measurement, but based on a biased astrometry or an inappropriate (strongly affected by
microlensing) flux ratio.
Measurement relying on an old, innacurate time delay.
4 SDSS J1339+1310
The gravitational lens system SDSS J1339+1310 was discovered by Inada et al.[25]. It consists of two quasar images (A and B) at = 2.231 and an early-type galaxy G at = 0.607 acting as main deflector[26]. The first set of observational constraints included the relative astrometry of B and G in the last column of Table 1 of Ref. 27, the macrolens magnification ratio from narrow-line/line-core flux ratios and a standard extinction law (based on emission lines in GTC spectra)[26], and an old time delay from LT light curves[26]. We note that the first time delay we used (47.0 5.5 days) is more inaccurate than the updated delay in \trefgoico:tbl1. Additionally, we have taken the ellipticity and position angle of G in the last column of Table 1 of Shalyapin et al.[27] as priors on the SIE+ lens model. The data fit led to an 1 confidence interval = 69 (accuracy of 13%; see \trefgoico:tbl2 and the black line in \frefgoico:fig4). The observational constraint on the time delay is the primary contribution to the curve (see the red line in \frefgoico:fig4), while other constraints/priors (e.g., the position of G; see the green line in \frefgoico:fig4) play a secondary role.

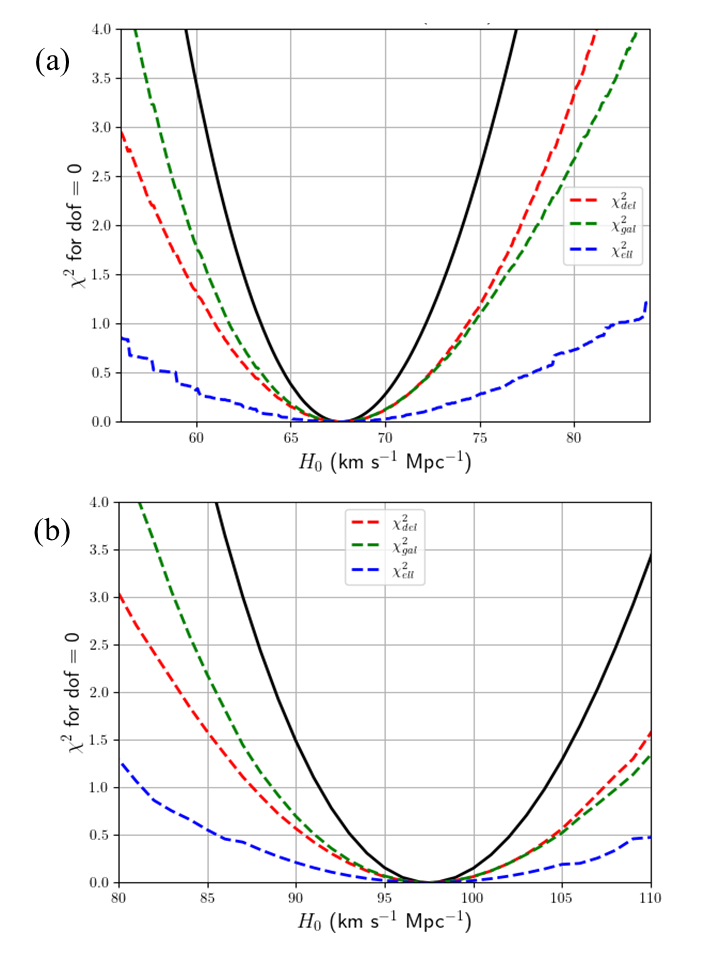
Results in \frefgoico:fig4 suggest that a tighter constraint on the time delay would produce a more accurate determination of the Hubble constant. Therefore, in a second approach, we used the updated time delay with a 4% error that appears in \trefgoico:tbl1 to more accurate estimate . The new curve in \frefgoico:fig5(a) indicates that = 67.8 4.4 (see also \trefgoico:tbl2). This is a quite robust measurement of because its relative error is small (only 6.5%), and the priors on and do not play a relevant role (see the blue dashed line in \frefgoico:fig5(a)). In addition, the macrolens magnification ratio is not affected by microlensing/extinction effects, and only one major issue must be addressed: the hypothesis about an isothermal mass distribution for G. Using 58 gravitational lens systems from the SLACS Survey, Koopmans et al.[28] concluded that massive early-type galaxies have close to isothermal total density profiles, with a scatter between their logarithmic density slopes below 10%. For a particular lens galaxy, a small deviation from the isothermal power-law index is plausible, and this potential deviation can be taken into account by increasing the error in (see a more complete discussion in \srefgoico:sec5).
It is easy to demonstrate the need for dark matter (e.g., a power-law mass distribution) and the fact that a model in which light traces mass produces biased results. To this end, we again considered the updated time delay in \trefgoico:tbl1 and added a new prior, i.e., we worked with three priors instead two. Assuming that light traces mass of G, i.e., a de Vaucouleurs (DV) mass distribution instead a singular isothermal one, in a self-consistent way, the optical structure of G in the last column of Table 1 of Ref. 27 (effective radius, ellipticity and position angle) was used to describe the structure of its mass. This scheme led to a biased value of about 100 (97.7 6.4; see \frefgoico:fig5(b)). Even the 2 lower limit is above 85.
5 Discussion and future prospects
Using two double quasars of the GLENDAMA sample (see \frefgoico:fig1), we focused on the role that some observational constraints and hypotheses/priors on the mass model play in estimating in a standard cosmology. The main lens galaxies in SBS 0909+532 and SDSS J1339+1310 were modelled with a singular isothermal ellipsoid, in agreement with observations in the Milky Way and SLACS Survey results for massive early-type galaxies acting as gravitational lenses[28]. Adding the external shear that is caused by galaxies around a lens system, we initially considered a SIE+ lens (mass) model.
For SBS 0909+532, there are two different astrometric solutions based on the same near-IR data. While the Lehár et al.’s solution[22] led to a best value of equal to 68.4 and a broad 1 interval for this parameter, the Sluse et al.’s solution[23] provided an 8.6% measurement of around a central value of 38.2 (we derived biased results making different choices of priors). Assuming that the time delay and flux ratio between quasar images that we used are right, the last astrometry would be biased. However, the observed near-IR fluxes correspond to optical emission from the quasar accretion disk, so they could be strongly affected by microlenses (stars) in the main lens galaxy[24]. Hence, an accurate and reliable astrometric solution along with a detailed analysis of the macrolens magnification ratio (flux ratio free from extinction and microlensing effects) is required before robustly measuring for a SIE+ scenario.
Results for SDSS J1339+1310 are really encouraging because its current astrometry, updated time delay and macrolens magnification ratio through GTC spectra allowed us to accurately measure (67.8 4.4), with priors on the ellipticity and position angle of the SIE not playing a relevant role. It is also noteworthy that our 1 interval is not in tension with other recent estimates from GLQs[4] and the CMB[6] (see also Ref. 7), and the central value practically coincides with the upper limit of the Planck collaboration. Accounting for a potential microlensing effect on the time delay[29] (1 day) would only modify by 2%. Additionally, the use of a main galaxy mass model with an unrealistic density profile may have a significant impact on and be responsible for an error of about 10%[30, 31, 32]. At present, we do not know details about the mass density profile of the main deflector in SDSS J1339+1310, and thus we should adopt an uncertainty in greater than that obtained with a SIE. Very recently, assuming that the deflectors of the H0LiCOW GLQs and the SLACS lenses share the same mass density properties, Birrer et al.[33] have obtained = 67.4. This new GLQ-based result is in excellent agreement with ours and the CMB-based estimation of , notably reduces tension between early and late-Universe probes, and illustrates the importance of assumptions on mass distributions.
Future time-domain observations of large collections of GLQs will lead to robust constraints on , and the matter and dark energy components of the Universe[3]. The GLENDAMA project includes the first initiative to robotically monitor a small sample of 10 GLQs for about 20 years[8]. This project and the associated robotic monitoring with the LT will end in 2025, after providing accurate time delays for several GLQs and discussing their cosmological implications. In next few years, other ongoing monitoring projects will also measure accurate delays for small/medium samples of GLQs (see the paper by Geoff Chih-Fan Chen in these proceedings), which will contribute to a rich database of tens of measured delays. Despite this optimistic perspective about time-domain results, some issues must be fixed before sheding light on unbiased values of cosmological parameters from such delay database. Deep spectroscopy, high-resolution imaging and other complementary observations will be required. For example, unaccounted mass along GLQ sightlines may produce overestimated/underestimated values of (see the end of \srefgoico:sec2), so accurate estimates cannot ignore external convergences. Here, although we ignored the external convergence for SDSS J1339+1310, the unaccounted mass is expected to translate to a few percent relative uncertainty in [33, 34], noticeably less than that related to the mass density profile of G (see above).
Acknowledgments
We thank the organizers of Sixteenth Marcel Grossmann Meeting for planning a very interesting event and allowing us to give a talk in the parallel session ”Cosmography with Gravitational Lensing”. We also thank the chairs of such parallel session for creating a pleasant environment. We acknowledge Claudio Grillo, Mimoza Hafizi and Sherry Suyu for helpful comments that have significantly contributed to prepare the final text of this contribution. Among other things, the Gravitational LENses and DArk MAtter (GLENDAMA) project aims to construct accurate optical light curves of SBS 0909+532 and SDSS J1339+1310, and measure robust time delays for both systems. Although these optical variability studies mainly rely on observations with the Liverpool Telescope (LT), we are particularly grateful to our collaborators working in several institutions, who provide us with complementary data from the Maidanak Astronomical Observatory and the US Naval Observatory, and participate actively in the project development. The LT is operated on the island of La Palma by the Liverpool John Moores University (with financial support from the UK Science and Technology Facilities Council), in the Spanish Observatorio del Roque de los Muchachos of the Instituto de Astrofísica de Canarias. We thank the staff of the telescope for a kind interaction before, during and after the observations. This research has been supported by the grant AYA2017-89815-P funded by MCIN/AEI/10.13039/501100011033 and by “ERDF A way of making Europe”, and the grant PID2020-118990GB-I00 funded by MCIN/AEI/10.13039/501100011033.
References
- [1] P. Schneider, C. S. Kochanek and J. Wambsganss, Gravitational Lensing: Strong, Weak and Micro (Springer-Verlag, Berlin, 2006).
- [2] N. Jackson, The Hubble constant, Living Rev. Relativ. 18, 2 (2015), https://doi.org/10.1007/lrr-2015-2.
- [3] T. Treu and P. J. Marshall, Time delay cosmography, Astron. Astrophys. Rev. 24, 11 (2016).
- [4] K. C. Wong, S. H. Suyu, G. C.-F. Chen et al., H0LiCOW XIII. A 2.4% measurement of from lensed quasars: 5.3 tension between early and late-Universe probes, Mon. Notices Royal Astron. Soc. 498, 1420 (2020).
- [5] A. G. Riess, S. Casertano, W. Yuan, L. M. Macri and D. Scolnic, Large Magellanic Cloud cepheid standards provide a 1% foundation for the determination of the Hubble constant and stronger evidence for physics beyond CDM, Astrophys. J. 876, 85 (2019).
- [6] Planck Collaboration, Planck 2018 results. VI. Cosmological parameters, Astron. Astrophys. 641, 6 (2020).
- [7] W. L. Freedman, B. F. Madore, D. Hatt et al., The Carnegie-Chicago Hubble program. VIII. An independent determination of the Hubble constant based on the tip of the red giant branch, Astrophys. J. 882, 34 (2019).
- [8] R. Gil-Merino, L. J. Goicoechea, V. N. Shalyapin and A. Oscoz, New database for a sample of optically bright lensed quasars in the northern hemisphere, Astron. Astrophys. 616, 118 (2018).
- [9] L. J. Hainline, C. W. Morgan, C. L. MacLeod et al., Time delay and accretion disk size measurements in the lensed quasar SBS 0909+532 from multiwavelength microlensing analysis, Astrophys. J. 774, 69 (2013).
- [10] V. N. Shalyapin, L. J. Goicoechea and R. Gil-Merino, A 5.5-year robotic optical monitoring of Q0957+561: substructure in a non-local cD galaxy, Astron. Astrophys. 540, 132 (2012).
- [11] V. N. Shalyapin, L. J. Goicoechea, C. W. Morgan, M. A. Cornachione and A. V. Sergeyev, Resolving the inner accretion flow towards the central supermassive black hole in SDSS J1339+1310, Astron. Astrophys. 646, 165 (2021).
- [12] L. J. Goicoechea and V. N. Shalyapin, Time delays in the gravitationally lensed quasar H1413+117 (Cloverleaf), Astrophys. J. 708, 995 (2010).
- [13] V. N. Shalyapin and L. J. Goicoechea, Gravitationally lensed quasar SDSS J1442+4055: redshifts of lensing galaxies, time delay, microlensing variability, and intervening metal system at z 2, Astrophys. J. 873, 117 (2019).
- [14] V. N. Shalyapin and L. J. Goicoechea, Doubly imaged quasar SDSS J1515+1511: time delay and lensing galaxies, Astrophys. J. 836, 14 (2017).
- [15] S. H. Suyu, T. Treu, S. Hilbert et al., Cosmology from gravitational lens time delays and Planck data, Astrophys. J. 788, L35 (2014).
- [16] M. Millon, A. Galan, F. Courbin et al., TDCOSMO. I. An exploration of systematic uncertainties in the inference of H0 from time-delay cosmography, Astron. Astrophys. 639, 101 (2020).
- [17] D. Paraficz and J. Hjorth, Gravitational lenses as cosmic rulers: , from time delays and velocity dispersions, Astron. Astrophys. 507, L49 (2009).
- [18] C. R. Keeton, Computational methods for gravitational lensing, https://arxiv.org/pdf/astro-ph/0102340.pdf (2001).
- [19] C. S. Kochanek, E. E. Falco, R. Schild et al., SBS 0909+532: A new double gravitational lens or binary quasar?, Astrophys. J. 479, 678 (1997).
- [20] A. Oscoz, M. Serra-Ricart, E. Mediavilla, J. Buitrago and L. J. Goicoechea, Support for the gravitational lens interpretation of SBS 0909+532, Astrophys. J. 491, L7 (1997).
- [21] L. M. Lubin, C. D. Fassnacht, A. C. S. Readhead, R. D. Blandford and T. Kundić, A Keck survey of gravitational lens systems. I. Spectroscopy of SBS 0909+532, HST 1411+5211, and CLASS B2319+051, Astron. J. 119, 451 (2000).
- [22] J. Lehár, E. E. Falco, C. S. Kochanek et al., Hubble Space Telescope observations of 10 two-image gravitational lenses, Astrophys. J. 536, 584 (2000).
- [23] D. Sluse, V. Chantry, P. Magain, F. Courbin and G. Meylan, COSMOGRAIL: the COSmological MOnitoring of GRAvItational Lenses. X. Modeling based on high-precision astrometry of a sample of 25 lensed quasars: consequences for ellipticity, shear, and astrometric anomalies, Astron. Astrophys. 538, 99 (2012).
- [24] E. Mediavilla, J. A. Muñoz, C. S. Kochanek et al., The first precise determination of an optical-far-ultraviolet extinction curve beyond the Local Group ( = 0.83), Astrophys. J. 619, 749 (2005).
- [25] N. Inada, M. Oguri, M. Shin et al., Five new high-redshift quasar lenses from the Sloan Digital Sky Survey, Astron. J. 137, 4118 (2009).
- [26] L. J. Goicoechea and V. N. Shalyapin, Gravitational lens system SDSS J1339+1310: microlensing factory and time delay, Astron. Astrophys. 596, 77 (2016).
- [27] V. N. Shalyapin and L. J. Goicoechea, Deep optical imaging and spectroscopy of the lens system SDSS J1339+1310, Astron. Astrophys. 568, 116 (2014).
- [28] L. V. E. Koopmans, A. Bolton, T. Treu et al., The structure and dynamics of massive early-type galaxies: on homology, isothermality, and isotropy inside one effective radius, Astrophys. J. 703, L51 (2009).
- [29] S. S. Tie and C. S. Kochanek, Microlensing makes lensed quasar time delays significantly time variable, Mon. Notices Royal Astron. Soc. 473, 80 (2018).
- [30] P. Schneider and D. Sluse, Mass-sheet degeneracy, power-law models and external convergence: Impact on the determination of the Hubble constant from gravitational lensing, Astron. Astrophys. 559, 37 (2013).
- [31] C. S. Kochanek, Overconstrained gravitational lens models and the Hubble constant, Mon. Notices Royal Astron. Soc. 493, 1725 (2020).
- [32] H. R. Stacey, C. M. O’Riordan, S. Vegetti et al., The inner density profile of an elliptical galaxy at = 1.15 from gravitational lensing, submitted to Mon. Notices Royal Astron. Soc., https://arxiv.org/pdf/2109.10929.pdf (2021).
- [33] S. Birrer, A. J. Shajib, A. Galan et al., TDCOSMO IV: Hierarchical time-delay cosmography - joint inference of the Hubble constant and galaxy density profiles, Astron. Astrophys. 643, 165 (2020).
- [34] C. E. Rusu, C. D. Fassnacht, D. Sluse et al., H0LiCOW – III. Quantifying the effect of mass along the line of sight to the gravitational lens HE 04351223 through weighted galaxy counts, Mon. Notices Royal Astron. Soc. 467, 4220 (2017).