Titanium based oxides are abundant, chemically stable, non-toxic, and highly versatile materials, with applications ranging from photovoltaics to catalysis. For rutile and anatase phases of TiO2, the bandgap ranges from 3.0–3.2 eV, which are too large to absorb in the visible range (400 nm - 700 nm), resulting in poor photo-catalytic efficiency. Nitrogen doping into TiO2 has been able to narrow it’s bandgap, forming an absorption tail in the visible-light region. However, TiO2 has limits to which it can be doped, suggesting investigations of the oxygen-deficient Ti2O3. Using the state-of-the-art Density Functional Theory (DFT) as implemented in the Quantum ESPRESSO package, we report on the structural and electronic properties of corundum-type Ti2N2O (an example TinN2O2n-3 compound with n=2). The most stable sample of the oxynitride (Ti2N2O-P1), has a bandgap of 2.2 eV, which is clearly near the middle of visible light, and has no in-gap states, suggesting that they are more efficient visible-light-driven materials for photocatalytic applications compared to TiO2, TiO2: N and Ti2O3.
Key words: DFT, Ti2O3,Ti2N2O, structural and electronic properties.
The Impact of Nitrogen Doping on Structural and Electronic Properties of Titanium Sesquioxide, Ti2O3 : An ab-initio Study
I Introduction
Due to increasing global energy demands and the harmful environmental pollution caused by the combustion of fossil fuels, the quest for sustainable alternative energy resources has become a major area of researchShaffer (2019). Ti-based oxides have been intensively investigated as photo-catalysts due to their wide applications in environmental remediation and solar energy conversion Daghrir et al. (2013); Agustina et al. (2005). Despite having wide bandgaps of 3.0 eV and 3.2 eV, respectively, rutile and anatase phases of titanium dioxide (TiO2) still attracts considerable attention Aoki et al. (2019); Agustina et al. (2005); Atambo et al. (2019); Carlo ; Fujishima et al. (2000); Li (2016); Wu et al. (2013); Shirai et al. (2018). To improve the solar application efficiency of Ti-based oxides, there has been an attempt to narrow their bandgap to absorb a major part of the solar spectrum Khan et al. (2012). Doping is considered to be one of the promising methods of narrowing the bandgap of the Ti-based oxides Guo et al. (2011).
Previous ab-initio works have been reported on doped TiO2 compounds. V, Cr, Mn, Fe, and Ni have been doped into TiO2 at the Ti sitesInturi et al. (2014); Umebayashi et al. (2002), such cationic doping leads to the localized d-states deep in the bandgap of TiO2, which would act as the recombination centers for photoexcited electrons and holes, lowering photocatalytic activity. An anion doping in TiO2 with N, C, S, and B has been equally explored Morikawa et al. (2001); Fujishima et al. (2008); Sakthivel and Kisch (2003); Schneider et al. (2014); Morikawa et al. (2001), such resulted in the p-states near the valence band being similar to other deep donor levels in the semiconductorSchneider et al. (2014). Owing to the finite number of oxygen vacancies, TiO2 has limits to which it can be dopedShevlin and Woodley (2010). In this work, we increase nitrogen concentrations in titanium oxide systems by considering compounds having the composition Tin O2n-1, rather than TiO2 with a finite number of oxygen vacancies. These systems can be viewed as ordered oxygen-deficient TiO2 variants with a lot of oxygen vacancies which allows nitrogen substitutions, hence, should be able to accommodate far greater nitrogen concentrations than TiO2.
In search of novel photocatalytic materials that are stable, efficient, and capable of being visible light driven, Wu and his co-workersWu et al. (2013), using high throughput screening method within density functional theory (DFT)Kohn and Sham (1965), discovered TinN2O2n-3 compound for the n=3 case (Ti3N2O3), which they predicted to be synthesizable, suitable for visible light (or UV light) absorption, and energetically favorable to catalyze the water-splitting reaction.
Corundum Ti2O3, a Ti based oxide with nominal Tin O2n-1, n=2 configuration together with its oxynitrides TinN2O2n-3, n=2, (Ti2N2O), has been much less investigated. Here, we explore the structural and electronic properties of Corundum Ti2O3 using Density Functional Theory (DFT) and Density Functional Theory with the inclusion of Hubbard U correction (DFTU) Himmetoglu et al. (2014) studies. In particular, we employ nitrogen substitutional doping at oxygen sites. The structural and electronic properties of the pristine and doped oxides, with and without the inclusion of Hubbard U, are simulated and analyzed. This study provides complementary theoretical data on structural and electronic properties of anionic doping of Ti2O3 with nitrogen.
II Computational details
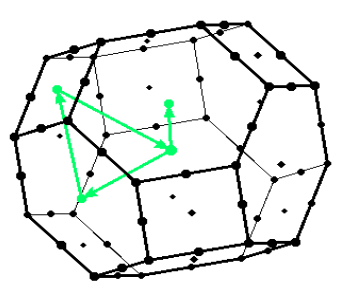
We have carried out simulations on trigonal Ti2O3 with a= b=c, 900 within density functional theory (DFT)Kohn and Sham (1965) using the generalized gradient approximation (GGA) as implemented in the Quantum ESPRESSO(QE) codeGiannozzi et al. (2009). The electron-ion interactions are described by ultra-soft pseudo-potentialsKresse and Joubert (1999) drawn from the 2.0.1 version of the library of Dal Corso et al,(2001)Carlo . For the exchange-correlation interaction, the enhanced Perdew-Burke- Ernzerhof functional of the generalized gradient approximation, for solids (GGA-PBEsol) Perdew et al. (1996) are employed. This exchange-correlation is selected because it is computationally efficient and no adjustable parameter is required. An extra Hubbard U term is included to account for the strong electron correlations, with U values tested in the range of 1 eV - 7 eV, applied only to the Ti-3d orbitals in Ti2O3. The wave functions for valence electrons are expanded through a plane-wave basis set within the energy cut-off of 30 Ry. The atomic coordinates are relaxed until the forces are less than 0.01 eV/Å. The crystal structures are then viewed using the X-window Crystalline and Molecular Structure Visualization (XCrysDen)Kokalj and Causà (2001) program where the lattice parameters a and c for the pristine and doped structures with and without the inclusion of the hubbard U, are determined. A Monkhorst-Pack mesh sampling Monkhorst and Pack (1976) equivalent to are employed.For band structure calculations, explicit positions along the high symmetry axes are described on the path Setyawan and Curtarolo (2010) shown in Fig 1.
III Results and discussions
III.1 Structural Properties: Lattice Parameters
By fitting the energy volume relationship to the Murnaghan equation of stateMurnaghan (1944), the volume that yields the minimum energy value are obtained. From table 1 the calculated lattice parameters a and c (at U=0 eV) lie slightly above the experimental dataLi et al. (2018). It is well known that GGA tends to overestimate the lattice parametersNiu et al. (2011). The slight deviations are attributed to the fact that simulations have not taken into account the existence of intrinsic and other defects occurring in actual situations. To check on the feasibility of the doped systems, the structural properties of pure and doped Ti2O3 are compared. After the doping process, the lattice constants of doped systems are found to be slightly deformed, showing lattice strain due to the difference in radius between the dopant N atom(s) and the substituted O atom(s). The optimized lattice parameters for undoped Ti2O3 are a=b=c 5.274 Å, while for doped systems are a=b=c 5.271 Å. This result is consistent with the experimental resultsLi et al. (2018), as well as other theoretical studiesAoki et al. (2019), demonstrating the accuracy and dependability of the structural optimization parameters and method used.
To account for the strong electron correlations, an extra Hubbard-U term is added, with a Ueff of 1 eV - 7 eV applied only to the Ti-3d orbitals. As seen in Table 1, there are some slight changes in the lattice parameter. To be more exact, the c/a ratio is seen to be decreasing with increasing values of U at some point. The inclusion of the U values in this computation is likely to have resulted in changes in the lattice parameters due to the correction of hybridization between O-2p and Ti-3d orbitalsPersson and Mirbt (2006). As a result, the ideal value of U is determined by seeking a fair agreement with experimental data for both structural and electronic properties.
| U Values | |||
|---|---|---|---|
| (eV) | Lattice Parameters | Band gaps (eV) | |
| a(Å) | c/a | ||
| 0 | 5.27 | 1.03 | No gap |
| 1 | 5.22 | 1.03 | 0.11 |
| 2 | 5.24 | 1.02 | 0.49 |
| 3 | 5.25 | 1.02 | 0.87 |
| 4 | 5.19 | 1.01 | 1.36 |
| 5 | 5.16 | 1.00 | 1.63 |
| 6 | 5.38 | 1.00 | 1.76 |
| 7 | 5.35 | 1.03 | 1.86 |
| ExptLi et al. (2018) | 5.15 | 1.01 | 1.65 |
III.2 Choice of Hubbard U for Ti2O3
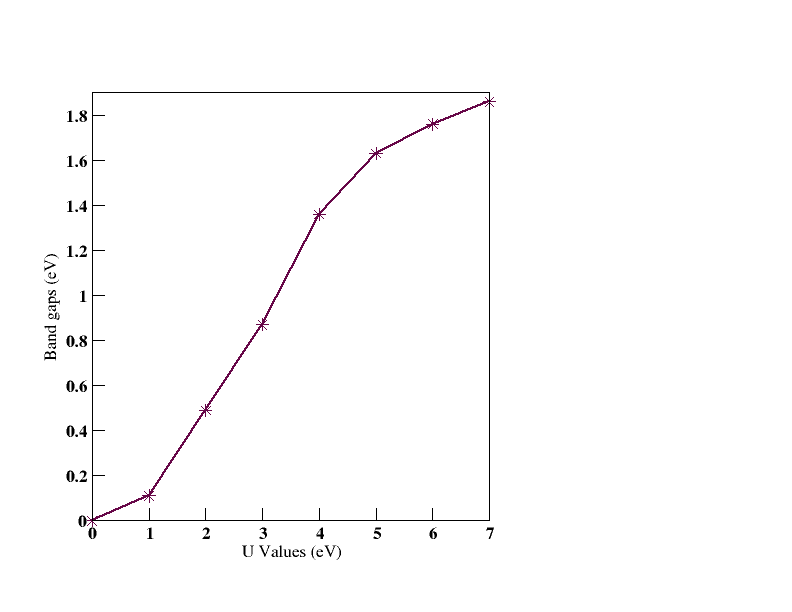
Corundum Ti2O3, appeared metallic, as shown in Fig 7(a), this is consistent with other DFT findings Aoki et al. (2019). Experimental studies by Li et al (2018)Li et al. (2018), however, show that Corundum Ti2O3 has a bandgap of 1.65 eV. As expected, Kohn-Sham DFT calculations could not predict this small gap since it is known to underestimate the bandgaps of systems with d and f orbitals Hu and Metiu (2011). A moderated Hubbard potential,U, applied to the calculations of electronic structures leads to more precise electronic band gaps. The U values are optimized empirically by tuning the values of U when seeking an agreement with the experimental results of the properties of the Ti2O3Hu and Metiu (2011), as well as checking on the impact on lattice parameters as indicated in Table 1. One thing that came out clear was that the value of the energy gap kept increasing in an almost linearly manner with the U values as shown in Fig 2. Corundum Ti2O3 opened a 1.638 eV band gap by DFT+U (U=5 eV) studies, supporting the experimental data that this structure has semiconducting properties. The lattice parameter at U=5 eV presented in Table 1 is also in good agreement with the experimental lattice parameterLi et al. (2018) of 5.15 eV. The value, U = 5 eV, is therefore considered as the optimal value and inferred for improved prediction of the band gap of the corundum based Ti2N2O structures.
III.3 Nitrogen substituted Ti2O3 (Ti2N2O)
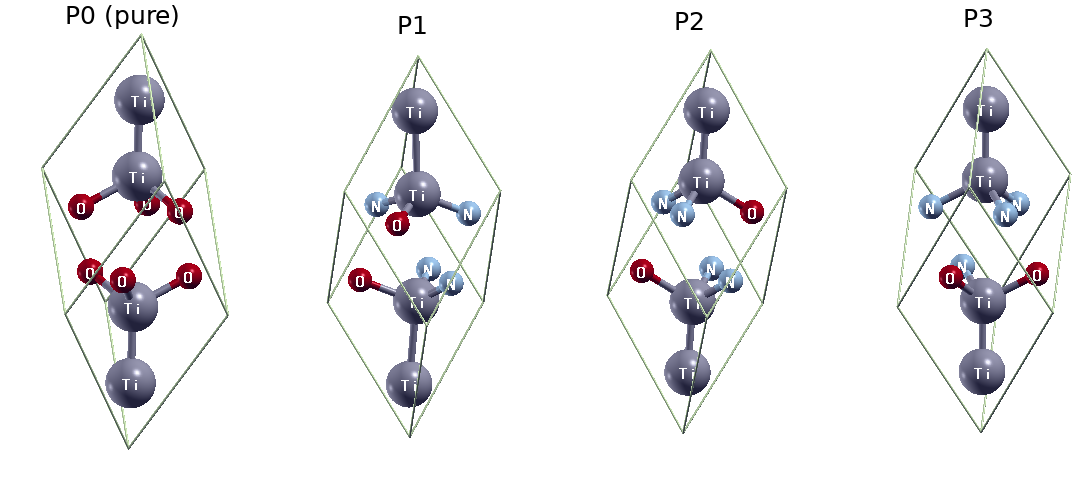
By substituting two of the oxygen atoms of TinO2n-1 compounds with nitrogen, a series of Ti2N2O oxynitrides are modelled. Four out of six oxygen atoms are substituted with nitrogen to obtain Ti2N2O compounds. Due to the symmetry of the parent material, only three types (P1, P2, and P3) shown in Fig 3 are considered.
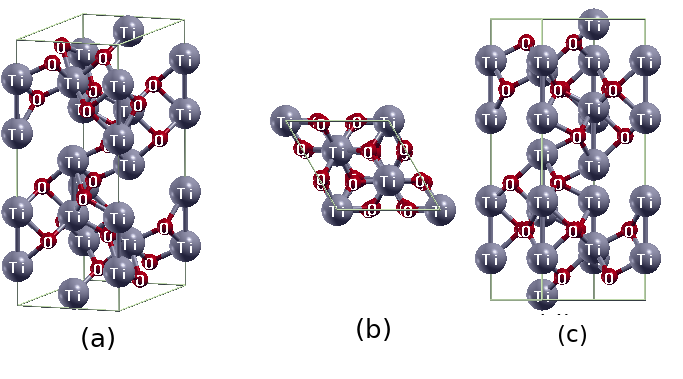
The other alternative is to model the oxynitrides in the hexagonal convectional cells of Ti2O3 containing 30 atoms (twelve titanium and eight oxygen atoms)Aoki et al. (2019). This is as well considered and viewed at three different angles of projection in Fig 4. Twelve out of eighteen oxygen atoms are replaced by nitrogen in seven different ways to form seven samples of Ti2N2O oxynitrides, projected in the a+b direction (for a clearer view), and arranged according to their stability as S1-S7, (S1 being the most stable sample) as shown in Fig 5.
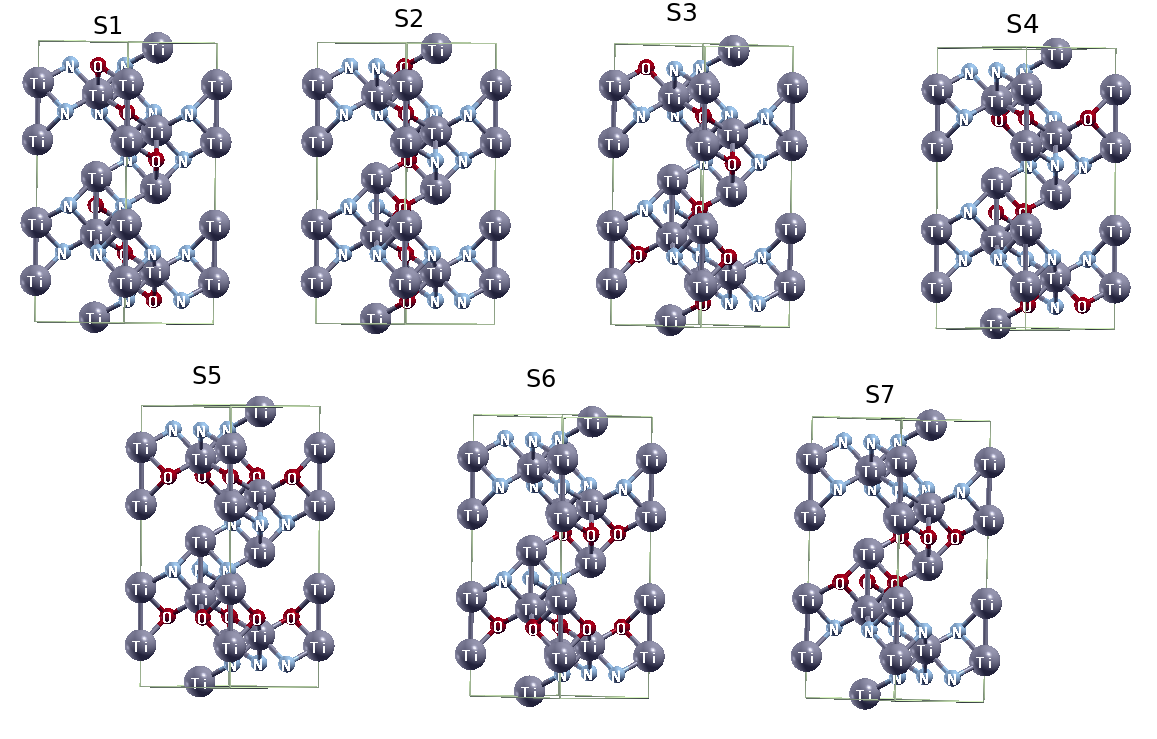
The stability of Ti2N2O (P and S) corundum based structures, are then compared as shown in Fig 6.
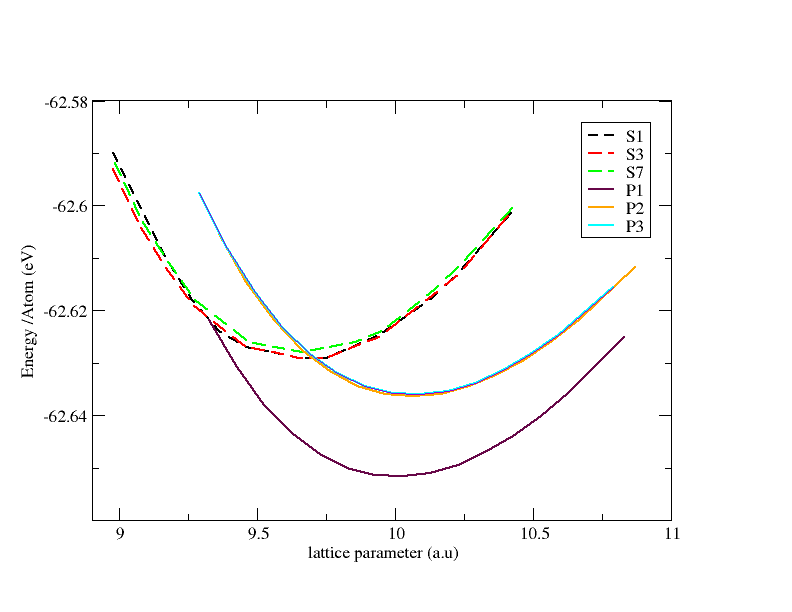
P-structures have lower formation energies than S-structures from Fig 6, hence more stable, with P1 being the most stable sample of all. This is well in agreement with the theory of Aoki et al.(2019)Aoki et al. (2019), where GW studies were employed to study the structures. Therefore, the P structures are considered for further analysis of the band structures and projected density of state (PDOS) shown in Fig 7.
III.4 Band structures and Projected Density of States
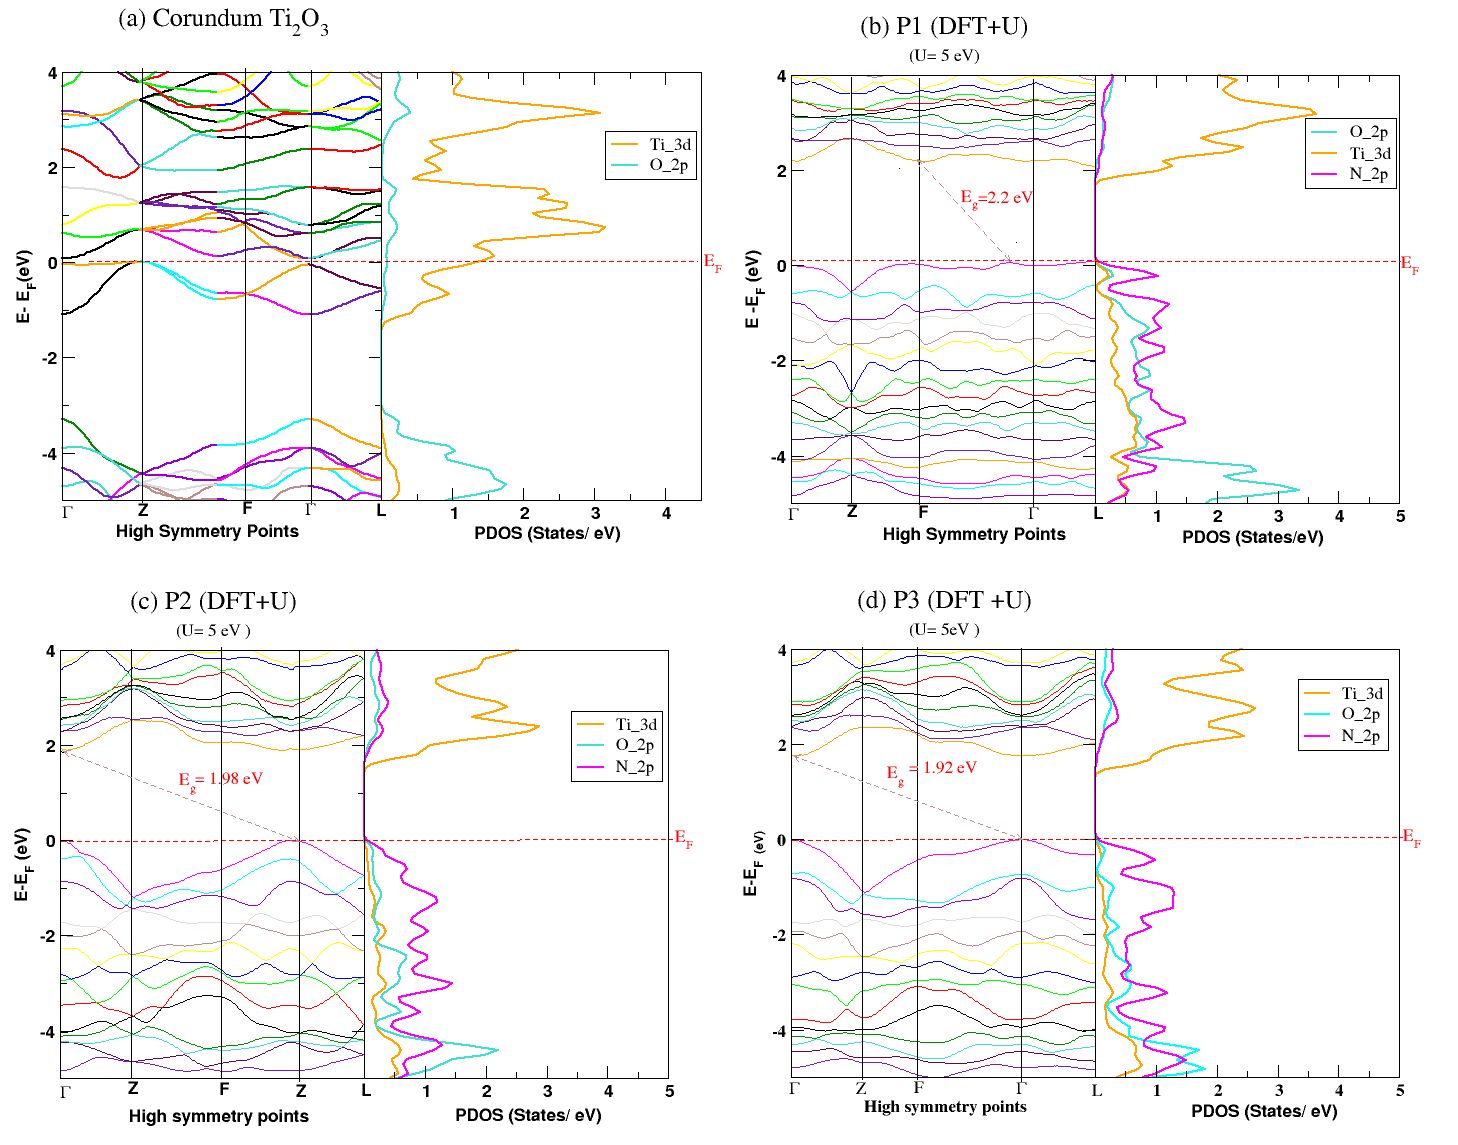
To explore the effect of doping on the electronic properties of Ti2O3 and clarify the origin of improved visible light photo activity, the band structures and projected density of states (PDOS) are calculated as given in Fig 7. For ease of comparison, the Fermi level (Ef) is set at zero. With Ti-3d/ O-2p orbitals dominant in the entire band structure, Corundum Ti2O3 appeared metallic, as shown in Fig 7(a).
Fig 7(b)-(d) shows that nitrogen substitution into corundum Ti2O3 opens up a gap of 2.2 eV by DFT+U studies with U=5 eV in the P1 sample (most stable) while the P2 and P3 samples have band gaps of 1.98 eV and 1.92 eV, respectively. The electronic structure of Ti2O3 changes as the lattice parameters and deformation around the dopants changes, modifying their photocatalytic activity. In all three (P1, P2 and P3) samples, indirect bandgaps with bandgap character of Ti-3d/N-2p orbitals are observed. Some hybridization between N-2p and Ti-3d states is also observed in the valence band, although there are no in-gap states within the intrinsic gap, as there are in TiO2 doped nitrogen Persson and Mirbt (2006), thus the absorption threshold is unlikely to be affected. We have obtained a Ti-based oxide with a reduced band gap compared to the highly investigated TiO2, without necessarily creating the in-gap states which are known to serve as recombination centers for the photo-excited electrons and holes. This study suggests that, relative to pristine TiO2, Ti2O3 and TiO2: N compounds, Ti2N2O structures are more promising photo-catalytic/photo-voltaic materials. Table 2 offers a description of a comparison of the calculated and experimental bandgap for the oxides.
| MATERIAL | ENERGY BAND GAP (eV) | ||||||||||
|---|---|---|---|---|---|---|---|---|---|---|---|
|
|
|
EXPERIMENTAL | ||||||||
| Corundum Ti2O3 | No gap | No gap Aoki et al. (2019) | 1.64(U=5 eV) | 1.65Li et al. (2018) | |||||||
|
|
||||||||||
IV Conclusion
Using the DFT and DFT+U approach, we have investigated the effect of nitrogen substitution on the geometry and electronic structure of corundum Ti2O3 in order to enhance its photo-catalytic performance. Significant structure information which may be useful in guiding experimental work as well as identifying appropriate applications for the material has been obtained. Structural and electronic properties of corundum Ti2O3 and the oxynitrides Ti2N2O have been analysed in this work. With regard to the impact of the Hubbard U parameter on both structural and electronic properties, the best value of U is found to be 5 eV. Even though these calculations assume defect-free structures, the lattice parameters and band gap obtained for this value of U are in good agreement with other DFT results and experimental data. The oxygen deficient corundum Ti2O3, which showed metal-like properties opens up a bandgap of 1.638 eV by DFT+U (U= 5 eV) studies, agreeing well with reported experimental data. To enhance photo-activity of Ti-based oxides, without creating mid-gap states, we aimed at reducing the band gaps of the oxides. This was achieved in Ti2N2O structures, which had a bandgap of 2.2 eV (563.56 nm), in the most stable sample_P1, and had no in-gap states. In principle, Ti2N2O materials are found to be better for photo-catalytic/ photo-voltaic applications, compared to TiO2, TiO2:N and Ti2O3 materials.
V Acknowledgments
This research was supported by the International Science Program (UON 500-661-127, PI- Prof. Aduda Bernard O.), through condensed matter thematic group of the Department of Physics, University of Nairobi. The Centre of High-Performance Computing (CHPC) through the project MATS862, Rosebank Cape Town Republic of South Africa is appreciated for providing access to the HPC cluster facility used in this research. Much appreciation to the Materials Modeling Group at the Technical University of Kenya for support.
VI conflicts of interest
There is no conflict of interest.
References
- Shaffer (2019) B. Shaffer, MRS Energy & Sustainability 6 (2019).
- Daghrir et al. (2013) R. Daghrir, P. Drogui, and D. Robert, Industrial & Engineering Chemistry Research 52, 3581 (2013).
- Agustina et al. (2005) T. E. Agustina, H. M. Ang, and V. K. Vareek, Journal of Photochemistry and Photobiology C: Photochemistry Reviews 6, 264 (2005).
- Aoki et al. (2019) Y. Aoki, M. Sakurai, S. Coh, J. R. Chelikowsky, S. G. Louie, M. L. Cohen, and S. Saito, Physical Review B 99, 075203 (2019).
- Atambo et al. (2019) M. O. Atambo, D. Varsano, A. Ferretti, S. S. Ataei, M. J. Caldas, E. Molinari, and A. Selloni, Physical Review Materials 3, 045401 (2019).
- (6) Q. M. Carlo, .
- Fujishima et al. (2000) A. Fujishima, T. N. Rao, and D. A. Tryk, Journal of photochemistry and photobiology C: Photochemistry reviews 1, 1 (2000).
- Li (2016) Y. Li, Investigation of Titanium Sesquioxide Ti2O3: Synthesis and Physical Properties, Ph.D. thesis (2016).
- Wu et al. (2013) Y. Wu, P. Lazic, G. Hautier, K. Persson, and G. Ceder, Energy & environmental science 6, 157 (2013).
- Shirai et al. (2018) K. Shirai, G. Fazio, T. Sugimoto, D. Selli, L. Ferraro, K. Watanabe, M. Haruta, B. Ohtani, H. Kurata, C. Di Valentin, et al., Journal of the American Chemical Society 140, 1415 (2018).
- Khan et al. (2012) M. Khan, J. Xu, N. Chen, and W. Cao, Journal of Alloys and Compounds 513, 539 (2012).
- Guo et al. (2011) W. Guo, L. Wu, Z. Chen, G. Boschloo, A. Hagfeldt, and T. Ma, Journal of Photochemistry and Photobiology A: Chemistry 219, 180 (2011).
- Inturi et al. (2014) S. N. R. Inturi, T. Boningari, M. Suidan, and P. G. Smirniotis, Applied Catalysis B: Environmental 144, 333 (2014).
- Umebayashi et al. (2002) T. Umebayashi, T. Yamaki, H. Itoh, and K. Asai, Journal of Physics and Chemistry of Solids 63, 1909 (2002).
- Morikawa et al. (2001) T. Morikawa, R. Asahi, T. Ohwaki, K. Aoki, and Y. Taga, Japanese Journal of Applied Physics 40, L561 (2001).
- Fujishima et al. (2008) A. Fujishima, X. Zhang, and D. A. Tryk, Surface science reports 63, 515 (2008).
- Sakthivel and Kisch (2003) S. Sakthivel and H. Kisch, Angewandte Chemie International Edition 42, 4908 (2003).
- Schneider et al. (2014) J. Schneider, M. Matsuoka, M. Takeuchi, J. Zhang, Y. Horiuchi, M. Anpo, and D. W. Bahnemann, Chemical reviews 114, 9919 (2014).
- Shevlin and Woodley (2010) S. Shevlin and S. Woodley, The Journal of Physical Chemistry C 114, 17333 (2010).
- Kohn and Sham (1965) W. Kohn and L. J. Sham, Phys. Rev. 140, A1133 (1965).
- Himmetoglu et al. (2014) B. Himmetoglu, A. Floris, S. De Gironcoli, and M. Cococcioni, International Journal of Quantum Chemistry 114, 14 (2014).
- Giannozzi et al. (2009) P. Giannozzi, S. Baroni, N. Bonini, M. Calandra, R. Car, C. Cavazzoni, D. Ceresoli, G. L. Chiarotti, M. Cococcioni, I. Dabo, A. D. Corso, S. de Gironcoli, S. Fabris, G. Fratesi, R. Gebauer, U. Gerstmann, C. Gougoussis, A. Kokalj, M. Lazzeri, L. Martin-Samos, N. Marzari, F. Mauri, R. Mazzarello, S. Paolini, A. Pasquarello, L. Paulatto, C. Sbraccia, S. Scandolo, G. Sclauzero, A. P. Seitsonen, A. Smogunov, P. Umari, and R. M. Wentzcovitch, Journal of Physics: Condensed Matter 21, 395502 (2009).
- Kresse and Joubert (1999) G. Kresse and D. Joubert, Phys. Rev. B 59, 1758 (1999).
- Perdew et al. (1996) J. P. Perdew, K. Burke, and M. Ernzerhof, Phys. Rev. Lett. 77, 3865 (1996).
- Kokalj and Causà (2001) A. Kokalj and M. Causà, “Xcrysden:(x-window) crystalline structures and densities,” (2001).
- Monkhorst and Pack (1976) H. J. Monkhorst and J. D. Pack, Phys. Rev. B 13, 5188 (1976).
- Setyawan and Curtarolo (2010) W. Setyawan and S. Curtarolo, Computational materials science 49, 299 (2010).
- Murnaghan (1944) F. Murnaghan, Proceedings of the national academy of sciences of the United States of America 30, 244 (1944).
- Li et al. (2018) Y. Li, Y. Yang, X. Shu, D. Wan, N. Wei, X. Yu, M. B. Breese, T. Venkatesan, J. M. Xue, Y. Liu, et al., chemistry of materials 30, 4383 (2018).
- Niu et al. (2011) M. Niu, W. Xu, X. Shao, and D. Cheng, Applied Physics Letters 99, 203111 (2011).
- Persson and Mirbt (2006) C. Persson and S. Mirbt, Brazilian journal of physics 36, 286 (2006).
- Hu and Metiu (2011) Z. Hu and H. Metiu, The Journal of Physical Chemistry C 115, 5841 (2011).