Star cluster formation from giant molecular clouds in the Small Magellanic Cloud about 2 Gyr ago: their origin, structures, and kinematics
Abstract
Recent observations have found that the age distribution of star clusters (SCs) in the Small Magellanic Cloud (SMC) shows a sharp peak around 2 Gyr ago. However, it is theoretically unclear what physical processes are responsible for such sudden formation of SCs in the SMC. Here we investigate whether massive SCs with initial masses more than can be formed during tidal interaction of the SMC with the Large Magellanic Cloud (LMC) about 2 Gyr ago, based on our new simulations, which include molecular hydrogen formation on dust grains and SC formation within giant molecular clouds (GMCs). We find that the formation of GMCs with masses more than can be dramatically enhanced due to the tidal force of the LMC-SMC interaction. We also find that gravitationally bound massive SCs can be formed within these GMCs, though their mean stellar densities ( ) are systematically lower than those of the genuine globular clusters (GCs). All simulated SCs have diffuse extended stellar envelopes that were formed from multiple merging of sub clusters within their natal GMCs. Furthermore, we find that some of the simulated SCs can have considerable global internal rotation and substructures surrounding them. Based on these simulation results, we discuss the origin of the observed diverse properties of SCs in the SMC and the physical roles of galaxy interaction in the formation of massive SCs from GMCs.
keywords:
ISM: dust, extinction – galaxies: ISM – galaxies: evolution – infrared: galaxies – stars: formation1 Introduction
The Large and Small Magellanic Clouds, due to their proximity to our Galaxy, offer a unique opportunity to examine the roles of their tidal interactions in the formation and evolution of various stellar and gaseous objects (e.g.,Westerlund 1997; D’Onghia & Fox 2016). The two irregular dwarf galaxies are interacting with the Galaxy, which could have influenced the evolution of these three systems (e.g., Murai & Fujimoto 1980; Weinberg 2000, Yoshizawa & Noguchi 2003; Besla et al. 2012; Diaz & Bekki 2012). Two of the most recent LMC-SMC interactions that possibly occurred , and Gyr ago (e.g., Yoshizawa & Noguchi 2003; Harris & Zaritsky 2004; Rafelski & Zaritsky 2005; Bekki & Chiba 2007a; Bekki & Chiba 2009; Bitsakis et al. 2018; Nayak et al. 2018) have been investigated by astronomers in the contexts of the formation of the Magellanic Stream (Gardiner & Noguchi 1996; Sawa et al. 1999; Pardy et al. 2018), its leading arms (Cullinane et al. 2021) and the Bridge (Zivick et al. 2019), as well as the chemical and dynamical evolution of the Clouds (Bekki & Chiba 2005; Patel et al. 2020).
The LMC and SMC are ideal for studying the origin of star clusters (SCs), because their various physical properties such as size, dynamical mass, stellar kinematics, stellar populations, age and metallicity have been observed by many previous works (e.g., Grebel et al. 1999; Da Costa 2002; Glatt et al. 2010; Perren et al. 2017; Piatti 2020). Despite these works on SCs, there are a number of key problems yet to be resolved. For example, SCs with ages from 4-12 Gyrs in the LMC ("age gap"; Da Costa 1991) have minimal observations (only ESO 121-SC03), and the origin is yet to be fully resolved, though numerical simulations of the LMC suggested that reactivation of SC formation due to LMC-SMC interaction could be the origin. The SCs of the SMC are useful for studying how tidal interaction of galaxies can influence the formation and evolution of SCs, given that the SMC has had clear interactions with the LMC. There are many previous studies which look specifically at SMC SCs.
For example, in Bitsakis et al. (2018), there are SCs surveyed in the central and outer regions of the SMC. Their catalog shows the SCs to have an average radius of pc, with values ranging from pc to pc. From further analysis of the SC’s ages, peaks of cluster formation at , and Gyr are detected for outskirts of the SMC, and peaks of , and Gyr ago in the bar region. Their peak periods also demonstrate the tendency for younger SCs to be in the central bar region, and older SCs to be in the halo (Rafelski & Zaritsky 2005; Nayak et al. 2018). In comparison, Piatti et al. (2008) looks at SCs in the SMC’s central region, and notes a large number of clusters aged between and Gyr, further supported by Rafelski & Zaritsky (2005), who found with their survey of 195 SCs in the SMC the same peak at Gyr ago occurred.
Despite the correlation between enhanced SC formation periods and the LMC-SMC interactions being noted (e.g., Grebel et al. 1999; Parmentier et al. 2003; Rafelski & Zaritsky 2005; Chiosi et al. 2006; Glatt et al. 2010; Maji et al. 2017; Bitsakis et al. 2018; Nayak et al. 2018), only a few theoretical studies on SC formation in the Magellanic Clouds (MCs) have been done. For example, Murai & Fujimoto (1980) suggested that interactions between the LMC and SMC could result in bursts of star formation. Through analysis of the MCs amongst other galaxies, Kumai et al. (1993) found most galaxies with Globular Clusters (GCs) less than Gyr old (young GCs) have strong interactions in their history. Formation of single or binary SCs due to high-speed cloud-cloud collisions triggered by LMC-SMC interaction was numerically investigated in detail by Bekki et al. (2004). However, these previous studies did not resolve well the formation of SCs from GMCs in their galaxy-scale models and simulations. It is thus unclear how gravitationally bound SCs consisting of many individual stars can really form in the interacting Clouds.
.
| Physical properties | Parameter values |
|---|---|
| Dark matter structures (LMC and SMC) | NFW |
| Total halo mass (LMC) | |
| Galaxy virial radius (LMC) | 60.1 kpc |
| parameter of galaxy halo | |
| Stellar disk mass (LMC) | |
| Disk scale height (LMC) | kpc |
| Disk scale length (LMC) | kpc |
| Total halo mass (SMC) | |
| Stellar disk mass (SMC) | |
| Stellar disk size (SMC) | kpc |
| Gas disk size (SMC) | kpc |
| Disk scale length (SMC) | kpc |
| Gas fraction in a disk | 0.5 |
| Mass resolution | |
| Size resolution | 18.9 pc |
| Star formation law | The KS law |
| with | |
| Initial central metallicity | |
| Initial metallicity gradient | dex kpc-1 |
| Chemical yield | T95 for SN, |
| VG97 for AGB | |
| Dust yield | B13 |
| Dust formation model | Gyr, |
| Gyr | |
| Initial dust/metal ratio | 0.4 |
| formation | Dependent on dust |
| abundance (B13) | |
| Feedback | SNIa and SNII (no AGN) |
The question of why and how such a large number of SCs were suddenly formed in the SMC Gyr ago is of particular importance theoretically, because 2 Gyr ago might be a major epoch of LMC-SMC interaction (e.g., Gardiner & Noguchi 1996; Yoshizawa & Noguchi 2003). Also, 2 Gyr ago might be the period when the SMC started to be influenced by warm halo gas of the Galaxy, which might have further influenced the evolution of GMCs of the SMC: ram pressure of the Galactic halo gas can trigger the enhanced star formation in the LMC gas disk (Mastropietro et al. 2009). Firstly, we need to understand the physical mechanisms by which the formation of massive SCs became possible in the SMC Gyr ago, and secondly, why 2 Gyr ago is the particular epoch for the SC formation in the SMC based on realistic numerical simulations that include SC formation from GMCs.
Internal rotation and velocity dispersion of SCs in the LMC and SMC can provide useful information on the formation processes of SCs, however, there are only a few observational studies which investigated the internal stellar kinematics. For example, Mackey et al. (2013) investigated the line of sight velocities of 21 stars in the LMC SC NGC 1846 with its extended main-sequence turnoff, which is a sign of multiple stellar populations (e.g., Keller et al. 2011), and thereby found a clear sign of internal rotation in the cluster. Although such rotational dynamics have been discussed by recent observational works on the Galactic GCs (e.g., Bianchini et al. 2018; Barth et al. 2020), the origin of internal rotation in the SCs of the LMC and the SMC has not been discussed: it is not observationally clear whether SCs of the SMC have such internal rotation. Therefore, it would be important for the theory of SC formation in the SMC to investigate whether the simulated SCs can have such rotation, and in what physical conditions the SC can have rotation.
We have already investigated a number of key physical processes related to SC formation such as GMC collisions during the LMC-SMC collision (e.g., Bekki et al. 2004), gas accretion onto SCs (e.g., Bekki & Mackey 2009; Armstrong et al. 2018), new star formation within massive globular clusters accreting gas from ISM (e.g., McKenzie & Bekki 2018; McKenzie & Bekki 2021a), and the roles of gas infall from the SMC to the LMC in SC formation (Bekki & Chiba 2007b; Tsuge et al. 2019). We have not yet investigated the entire formation processes of SC formation from their natal GMCs.
In this paper, we aim to investigate both the formation of GMCs in the gaseous disk of the SMC and the subsequent SC formation within the GMCs in a self-consistent way, using our new original numerical simulations of the LMC-SMC tidal interaction. These new simulations include the formation of molecular hydrogen on dust grains (Bekki 2013; Bekki 2015) so that they can predict the formation processes of GMCs consisting largely of molecular gas. Furthermore, we introduce a new two-stage SC formation model in which the formation of a SC with many () individual stellar particles (with a mass resolution of the order of 1 ) in a GMC can be investigated in detail. In the present study, we assume that the LMC-SMC interaction happened Gyr ago and thereby investigate how LMC-SMC tidal interactions can enhance the formation of GMCs, and thus the formation of the massive SCs with masses more than in the SMC.
Although the long-term evolution of SCs through stellar encounters (two-body relaxation effects) is quite important for the dynamical evolution of SCs (such as tidal disruption by their host galaxies; Lamers et al. 2005) and age/mass distribution of SCs (e.g., Baumgardt et al. 2013 for the LMC case), we do not investigate this key issue in the present study. This is mainly because we need to focus on the formation processes of SCs in the SMC triggered by the LMC-SMC interaction. There are several key observational results that we do not address, such as the age or metallicity radial gradients of SCs in the SMC (e.g., Parisi et al. 2015; Dias et al. 2016), various cluster core radii in the SMC SCs (Santos et al. 2020), new SC populations in the Magellanic Bridge (e.g., Bica et al. 2020). We will discuss these other observations in our future papers, because discussing these in the same paper would be too complicated and excessive.
The plan of this paper is as follows. In §2, we describe in detail the new two-step numerical model for the formation of SCs of the SMC. In §3, we present the effect of tidal interactions on the creation of GMCs, and the physical properties of the simulated SCs where such interactions were present; such as their internal structures and kinematics. In §4, we discuss the physical origins of the 2 Gyr burst SC population of SCs and the observational implications of the present new results. We summarize our new results in §5.
2 The Model
2.1 Two-step investigation
It is not practical for the present study to investigate the formation of every single SC with the total number of stars () being in the SMC, owing to strong limitations in mass and size resolutions of galaxy-scale simulations. Therefore, we adopt the following two-step investigation in the present study. We first try to identify the possible formation sites of massive SCs in the SMC by investigating whether each local region of the SMC (e.g., 50 pc 50pc) contains a clump of stars with the total mass more than . In this first step, the dynamical evolution of individual stars (i.e., with masses of ) cannot be resolved in the galaxy-scale simulations. However, the possible total number and locations of massive SCs can be investigated in detail for each model.
Our second step is to investigate just one SC from its formation within a Giant Molecular Cloud to its stripping processes. In this second step, the formation of a high-density GMC is identified, and the GMC is converted into numerous stars with to achieve better resolution. Accordingly, the early dynamical evolution of the new SC within their natal GMC can be investigated, though the long-term evolution of the SC through two-body relaxation effects cannot be investigated owing to the adopted simulation code. The total mass, size, shape, and stellar kinematics of a SC can be derived in this second step so that we can discuss whether the simulated bound SCs can be similar to the observed ones in the SMC for various physical properties. The selection process of a possible SC-forming GMC in a simulation is described later in this paper.
2.2 Chemodynamics in the SMC
We assume that the SMC is a disk galaxy embedded in a massive dark matter halo, though it is observationally unclear whether the SMC contains a significant amount of dark matter within its optical radius of 3 kpc (Bekki & Stanimirović 2009). The SMC is accordingly composed of dark matter halo, stellar disk, and gaseous disk (without a bulge) in the present study. The total masses of its dark matter, stars, and gas are denoted as , , and , respectively. We mainly investigate the model with the total mass of the SMC () being , the dark matter fraction of 0.8, and the gas mass fraction () of 0.5. As adopted in our previous simulations of the SMC interacting with the LMC and the Galaxy (Bekki & Chiba 2007a; Bekki & Chiba 2008; Diaz & Bekki 2012), the SMC’s dark matter is truncated around kpc, owing to its interaction with the LMC. The lower dark matter fraction allows the SMC disk to form a stellar bar within several dynamical timescales in the present study. We also investigate the models with different just for comparison.
The ‘NFW’ profile for the dark matter halo (Navarro et al. 1996) suggested from cold dark matter simulations is adopted for all models in the present study. We assume that the stellar and gaseous disks of the SMC are represented by the standard exponential profile, and the radial () and vertical () density profiles of the adopted disk are assumed to be proportional to with scale length and to with scale length , respectively, where is the stellar disk size of the SMC. The gas disk with a size has the radial and vertical scale lengths of and , respectively. We investigate the models with kpc, which is similar to the observed size of the present-day SMC. The more extended gas disk ( kpc) is required to explain the observed spatial distribution of the Magellanic Stream (Diaz & Bekki 2012), though it is larger than the present-day gas disk size of the SMC. The initial radial and azimuthal velocity dispersion’s are assigned to the SMC disk according to the epicyclic theory with Toomre’s parameter = 1.5.
The present study uses our original simulation code developed by Bekki (2013) and Bekki (2015), which is a Nbody/SPH simulation code and includes various physical processes of interstellar medium (ISM) in galaxies. Therefore, the present simulations include star formation, chemical evolution, dust evolution, metallicity-dependent radiative cooling, feedback effects of supernovae, and formation of molecular gas in a fully self-consistent manner. Since the details of these models are given in the above two papers, we will only briefly describe these in the present study. The Kennicutt-Schmidt law for galaxy-wide star formation (Kennicutt 1998) is adopted with the threshold gas density for star formation being 100 atom cm-3. The initial central metallicity of gas in a disk ([Fe/H]0) in the SMC is set to be and the radial metallicity gradient is dex kpc-1, which is a bit shallower than the Galactic value () (Choudhury et al. 2018).
Since the formation of SC-forming GMCs is key in the present simulations, the formation of molecular hydrogen from neutral hydrogen on dust grains is included, using the dust abundance of gas and the interstellar radiation field around the gas, and estimated for each SPH gas particle. Chemical yields for SNIa and SNII and those for AGB stars are adopted from (Tsujimoto et al., 1995, T95) and (van den Hoek & Groenewegen, 1997, VG97) respectively. The dust growth () and destruction () timescales are set to Gyr and Gyr. The canonical Salpeter initial mass function (IMF) of stars with the exponent of IMF being is adopted. These parameter values are all the same as those adopted in our previous works (Bekki 2013). The photoelectric heating effects, which are included in our others studies of luminosity disk galaxies (Osman et al. 2020), are not included in the present study.
2.3 The fixed gravitational potential of the LMC
The LMC is assumed to influence the orbit of the SMC through a fixed gravitational potential of the two components: a disk, and an extended dark matter halo. The dark matter halo is the dominant component of the LMC and it is modeled by using the NFW density distribution:
| (1) |
where is the spherical radius, is the characteristic density, is the concentration parameter, and is the virial radius. The total mass within is called the virial mass and is given by
| (2) |
The concentration parameter of the NFW profile is assumed to be 12 and and are set to be free parameters. We mainly investigate the LMC models with kpc and .
The LMC disk is assumed to be represented by the Miyamoto & Nagai (1975) potential
| (3) |
where is the total mass of the disk, and are scale parameters that control the radial and vertical extent of the disk respectively, and . We investigate the models with kpc, kpc, and . The combination of these parameters can give a reasonable and realistic rotation curve for the LMC. Since our major focus is to investigate how the LMC-SMC interaction about 2 Gyr ago influenced the formation processes of SCs in the SMC, we do not model the gravitational potential of the Galaxy; we have avoided introducing unnecessary complication of the LMC-SMC-Galaxy dynamical modeling, despite this being required in the Magellanic Stream formation (Diaz & Bekki 2012). We mainly investigate the fiducial model, and the parameters are summarized in Table 1.
2.4 The SMC orbits
We investigate the orbital evolution of the SMC around the LMC for Gyr in order to investigate whether the LMC-SMC interaction can induce the formation of massive SCs in the SMC disk, and how it does so. We consider that the SMC is initially located at it apocentre distance in all of our simulations, and therefore, the SMC has only the tangential velocity component (); . , which is fixed at 3 kpc, meaning that the SMC’s orbit plane is close to the LMC disk.
Since we adopt the axisymmetric gravitational potential of the LMC, we consider that the -component of the velocity of the SMC is the most important free parameter for the SMC orbit. We investigate the models with , and 50 in the present study. The larger means a more circular orbit for the SMC. The SMC disk is inclined by 30 degrees with respect to the orbital plane of the SMC in all models of the present study.
2.5 Simulating SC formation from GMCs
2.5.1 First step: SC formation sites
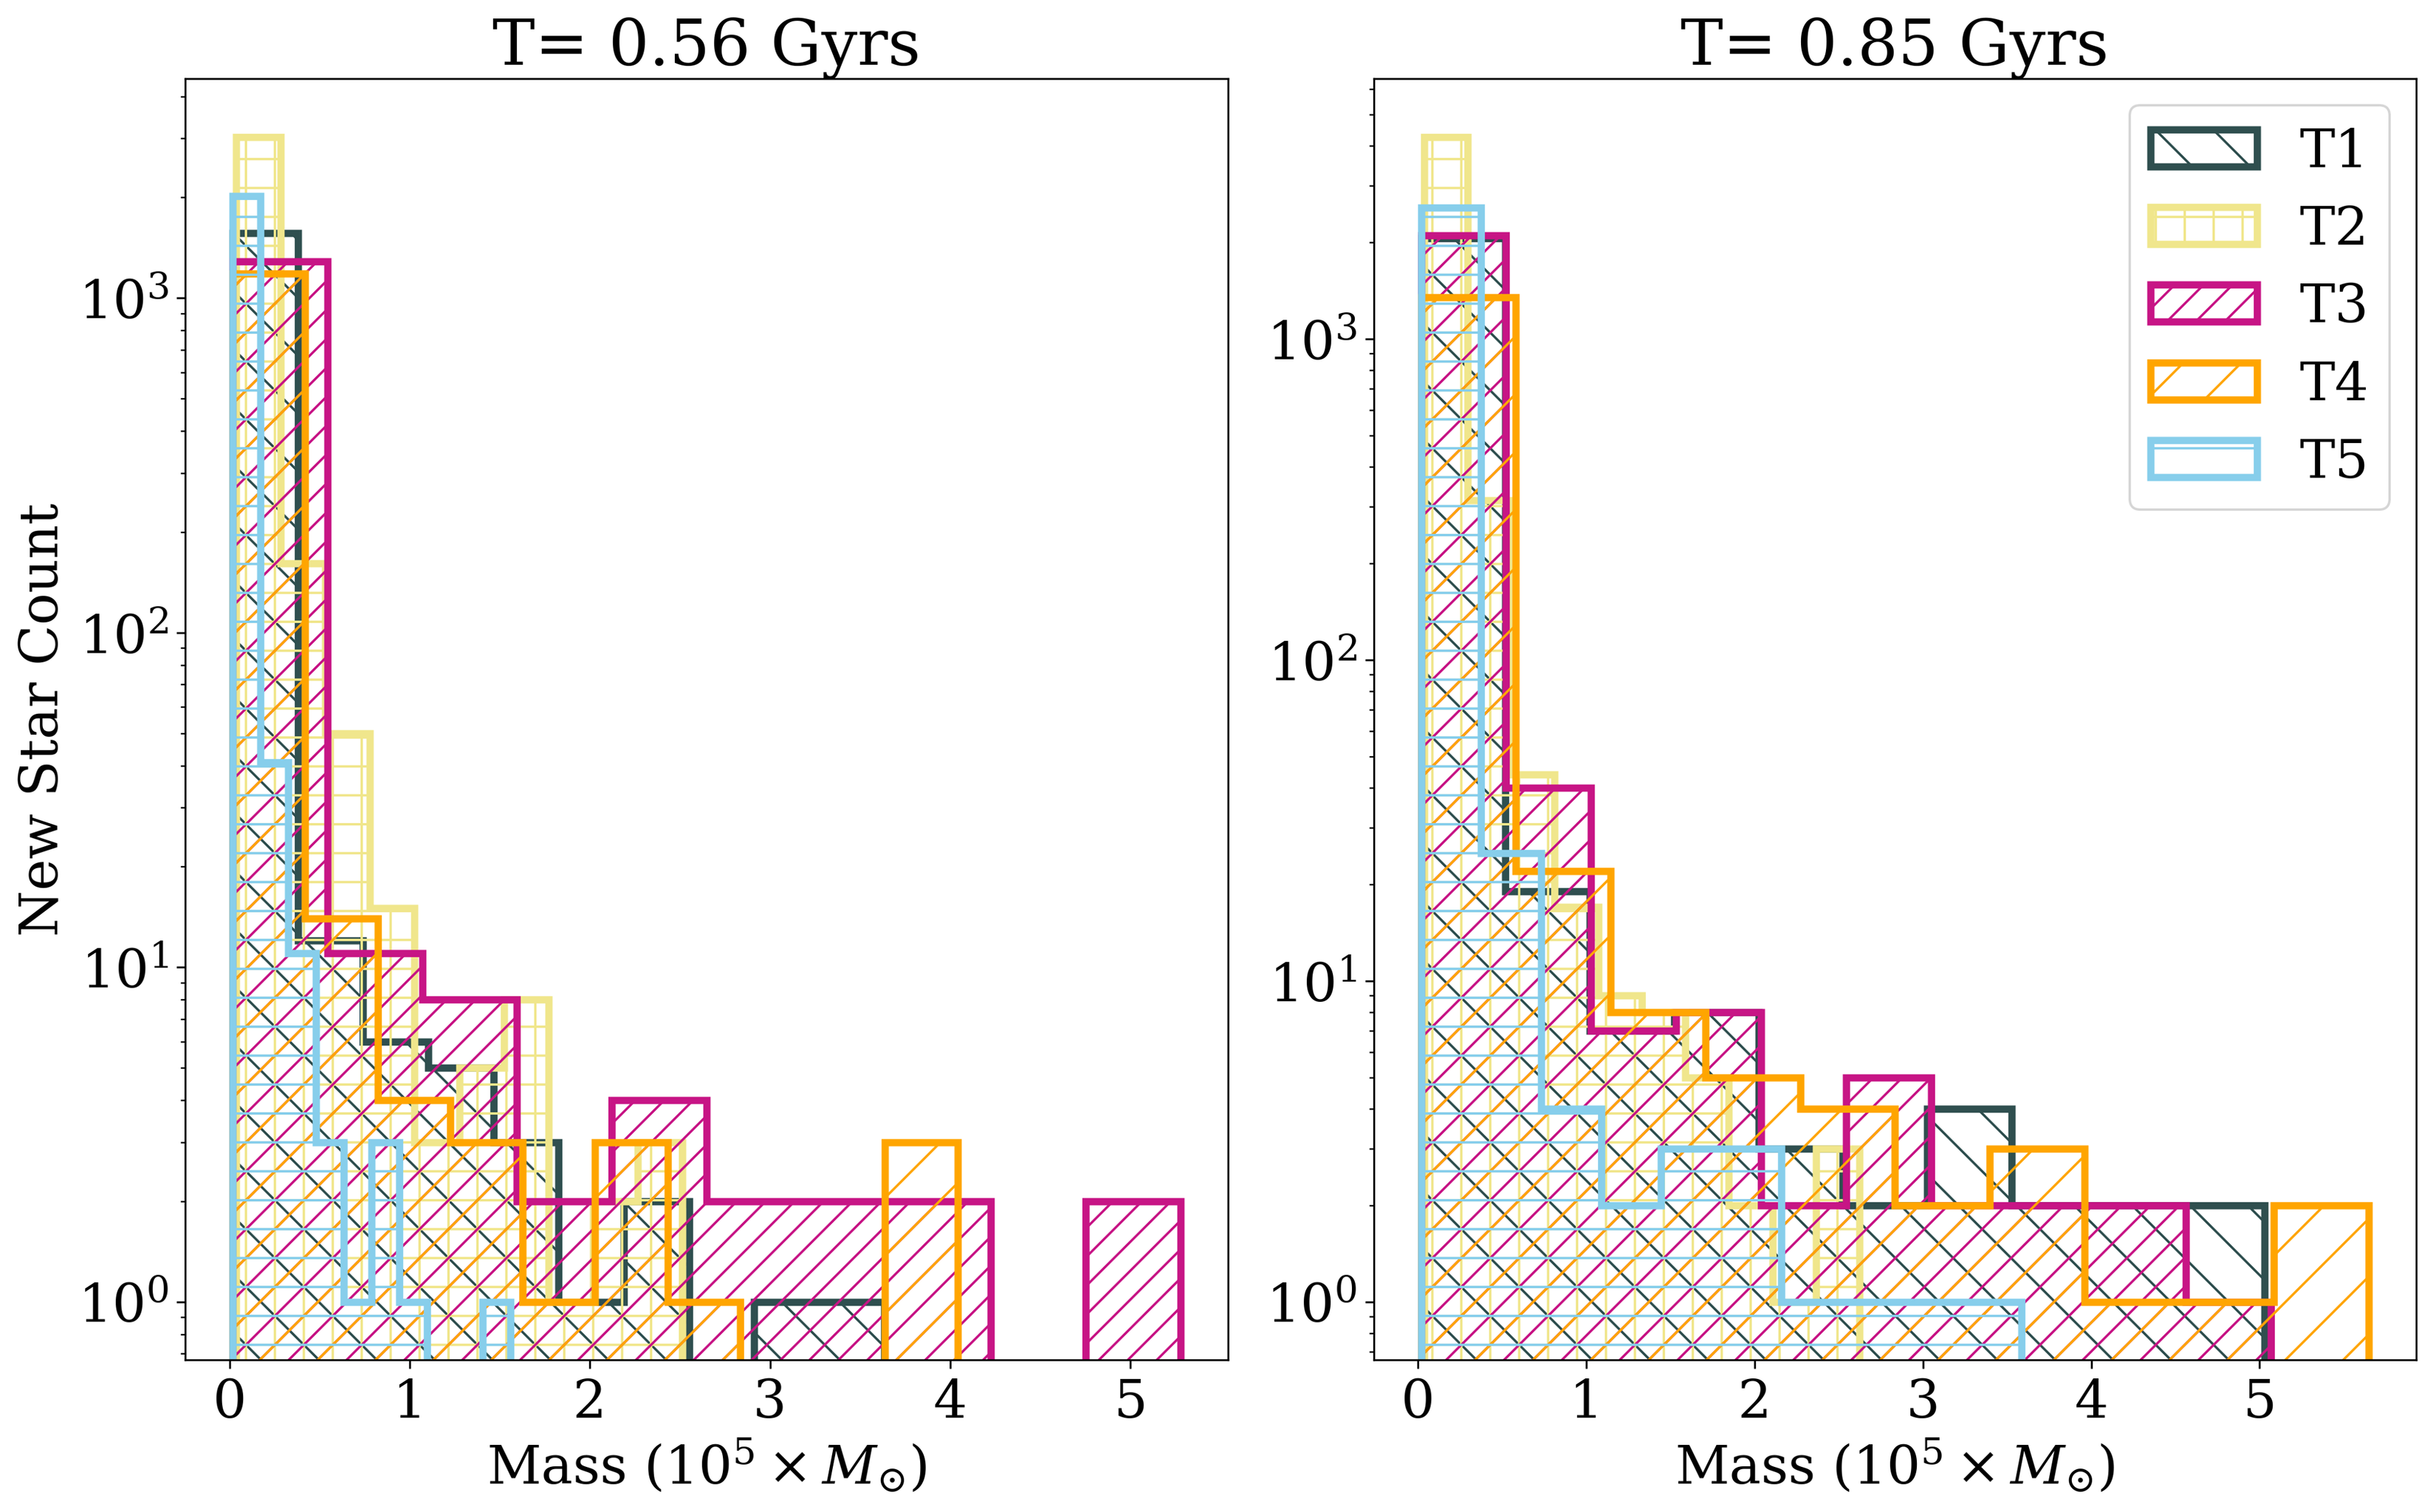
In this first step, we investigate whether or not massive stellar clumps can be formed during, and after the intense LMC-SMC interaction about 2 Gyr ago. In the adopted star formation model, one gas particle is converted into one new stellar particle. Therefore, one stellar clump can consist of only new stellar particles, which is far smaller than the typical number for massive SCs (): this first analysis does not enable us to discuss the formation processes of SCs. In order to identify such massive clumps we adopt a similar method as used in McKenzie & Bekki (2021b). We divide the SMC disk with 3 kpc radius into meshes and thereby investigate the total mass of new stars at each mesh point (Fig. 3). Next, we investigate the mass function of these clumps in order to discuss whether or not it can be influenced by the LMC-SMC tidal interaction. Furthermore, we investigate the number of massive clumps with masses more than that can be regarded as massive SC candidates. We compare these mass functions between the interaction model (T1) and the isolated one (I1) in which no LMC is included. We also investigate different SMC and LMC properties to see the effect on GMCs and new star formation. These parameter changes are outlined in Table 2.
| Model | LMC | SMC | Velocity | Pericentric | Tidal |
|---|---|---|---|---|---|
| ID | mass | mass | Vy | distance | radius |
| (M⊙) | (M⊙) | (km s-1) | (kpc) | (kpc) | |
| I1 | |||||
| T1 | |||||
| T2 | |||||
| T3 | |||||
| T4 | |||||
| T5 |
2.5.2 Second step: SC formation processes
In this second step, we investigate the mean densities of molecular hydrogen for all SPH particles at each time-step, and find a "high-density GMC" which has more than a threshold total mass () within 15pc for SC formation. The threshold mass is a parameter to find a SC-forming GMC with a particular total mass range. Once such a high-density GMC is found, then gas particles in the GMC are converted into new stars. In this second step, one gas particle is regarded as one small gas cloud that can form many stars. Accordingly, one gas particle is converted into stars so that the GMC consisting of gas particles can form a SC with more than stars. In this second step, once one high-density GMC is found at a time-step , the other high-density GMCs formed after do not form stars in this new way, but with each gas particle being converted into one new star (as in the first step). This means to say that the simulation runs in its entirety each time, but with one high resolution cluster for analysis. We adopt this model for the formation of just one "real" SC in this second step, because we need to avoid a huge number of stellar particles () that could possibly form in many SCs, which is almost impossible and much less practical to simulate in a reasonable time scale. To avoid spurious numerical effects of having two different resolutions in the same simulation as much as possible, we allocated a much smaller gravitational softening length and time step width.
Each gas particle in the selected SC-forming GMC is assumed to be a small spherical molecular cloud with a size of , where is the smoothing length of the SPH particle. Therefore, each small cloud is converted into a small spherical cluster with a size of and a uniform spatial distribution within . The gravitational softening length is introduced for these new stars and is fixed at 0.3 pc. The maximum time-step width () of these stars is smaller than those of other particles by a factor of 64 to 128, so that the dynamical evolution of the stars can be investigated. For most models, is set to be yr for these new stars in small clusters, which is much smaller than one dynamical timescale for massive SCs. Thus, this second step simulation allows us to investigate (i) whether a bound SC can be really formed in the SMC, and (ii) what shapes, structures, and kinematics the SCs have.
We consider that the star formation efficiency within a small molecular cloud depends on various physical parameters of the cloud, such as the size, mass, density, and magnetic field strength etc. However, our simulations cannot predict , because one particle is allocated for the cloud. Therefore, we assume that is a parameter ranging from 0.3 to 1.0. Since we choose only high-density GMCs as SC-hosting gas clouds, should be quite high. Accordingly, we mainly investigate the models with . We investigated the models with and found that the results do not strongly depend on as long as is larger than 0.5. However, the models with (which is a bit too high) shows compact SCs with higher central densities. We do not discuss further about how the present results depend on this parameter in this study.
3 Results
3.1 Star cluster formation sites
3.1.1 Fiducial model
| Cluster ID | Mass () | Half Mass Radius (pc) |
|---|---|---|
| SC1 (fiducial) | 1.27 | |
| SC2 | 1.59 | |
| SC3 | 2.05 | |
| SC4 | 1.41 | |
| SC5 | 3.35 | |
| SC6 | 3.09 | |
| SC7 | 2.48 | |
| SC8 | 1.10 | |
| SC9 | 2.54 |
We investigate the influence of tidal interactions with an LMC-like potential on our SMC models, with Table 2 describing five different models we tested during our study. We present the results to our fiducial model, T1, in the remainder of this section.
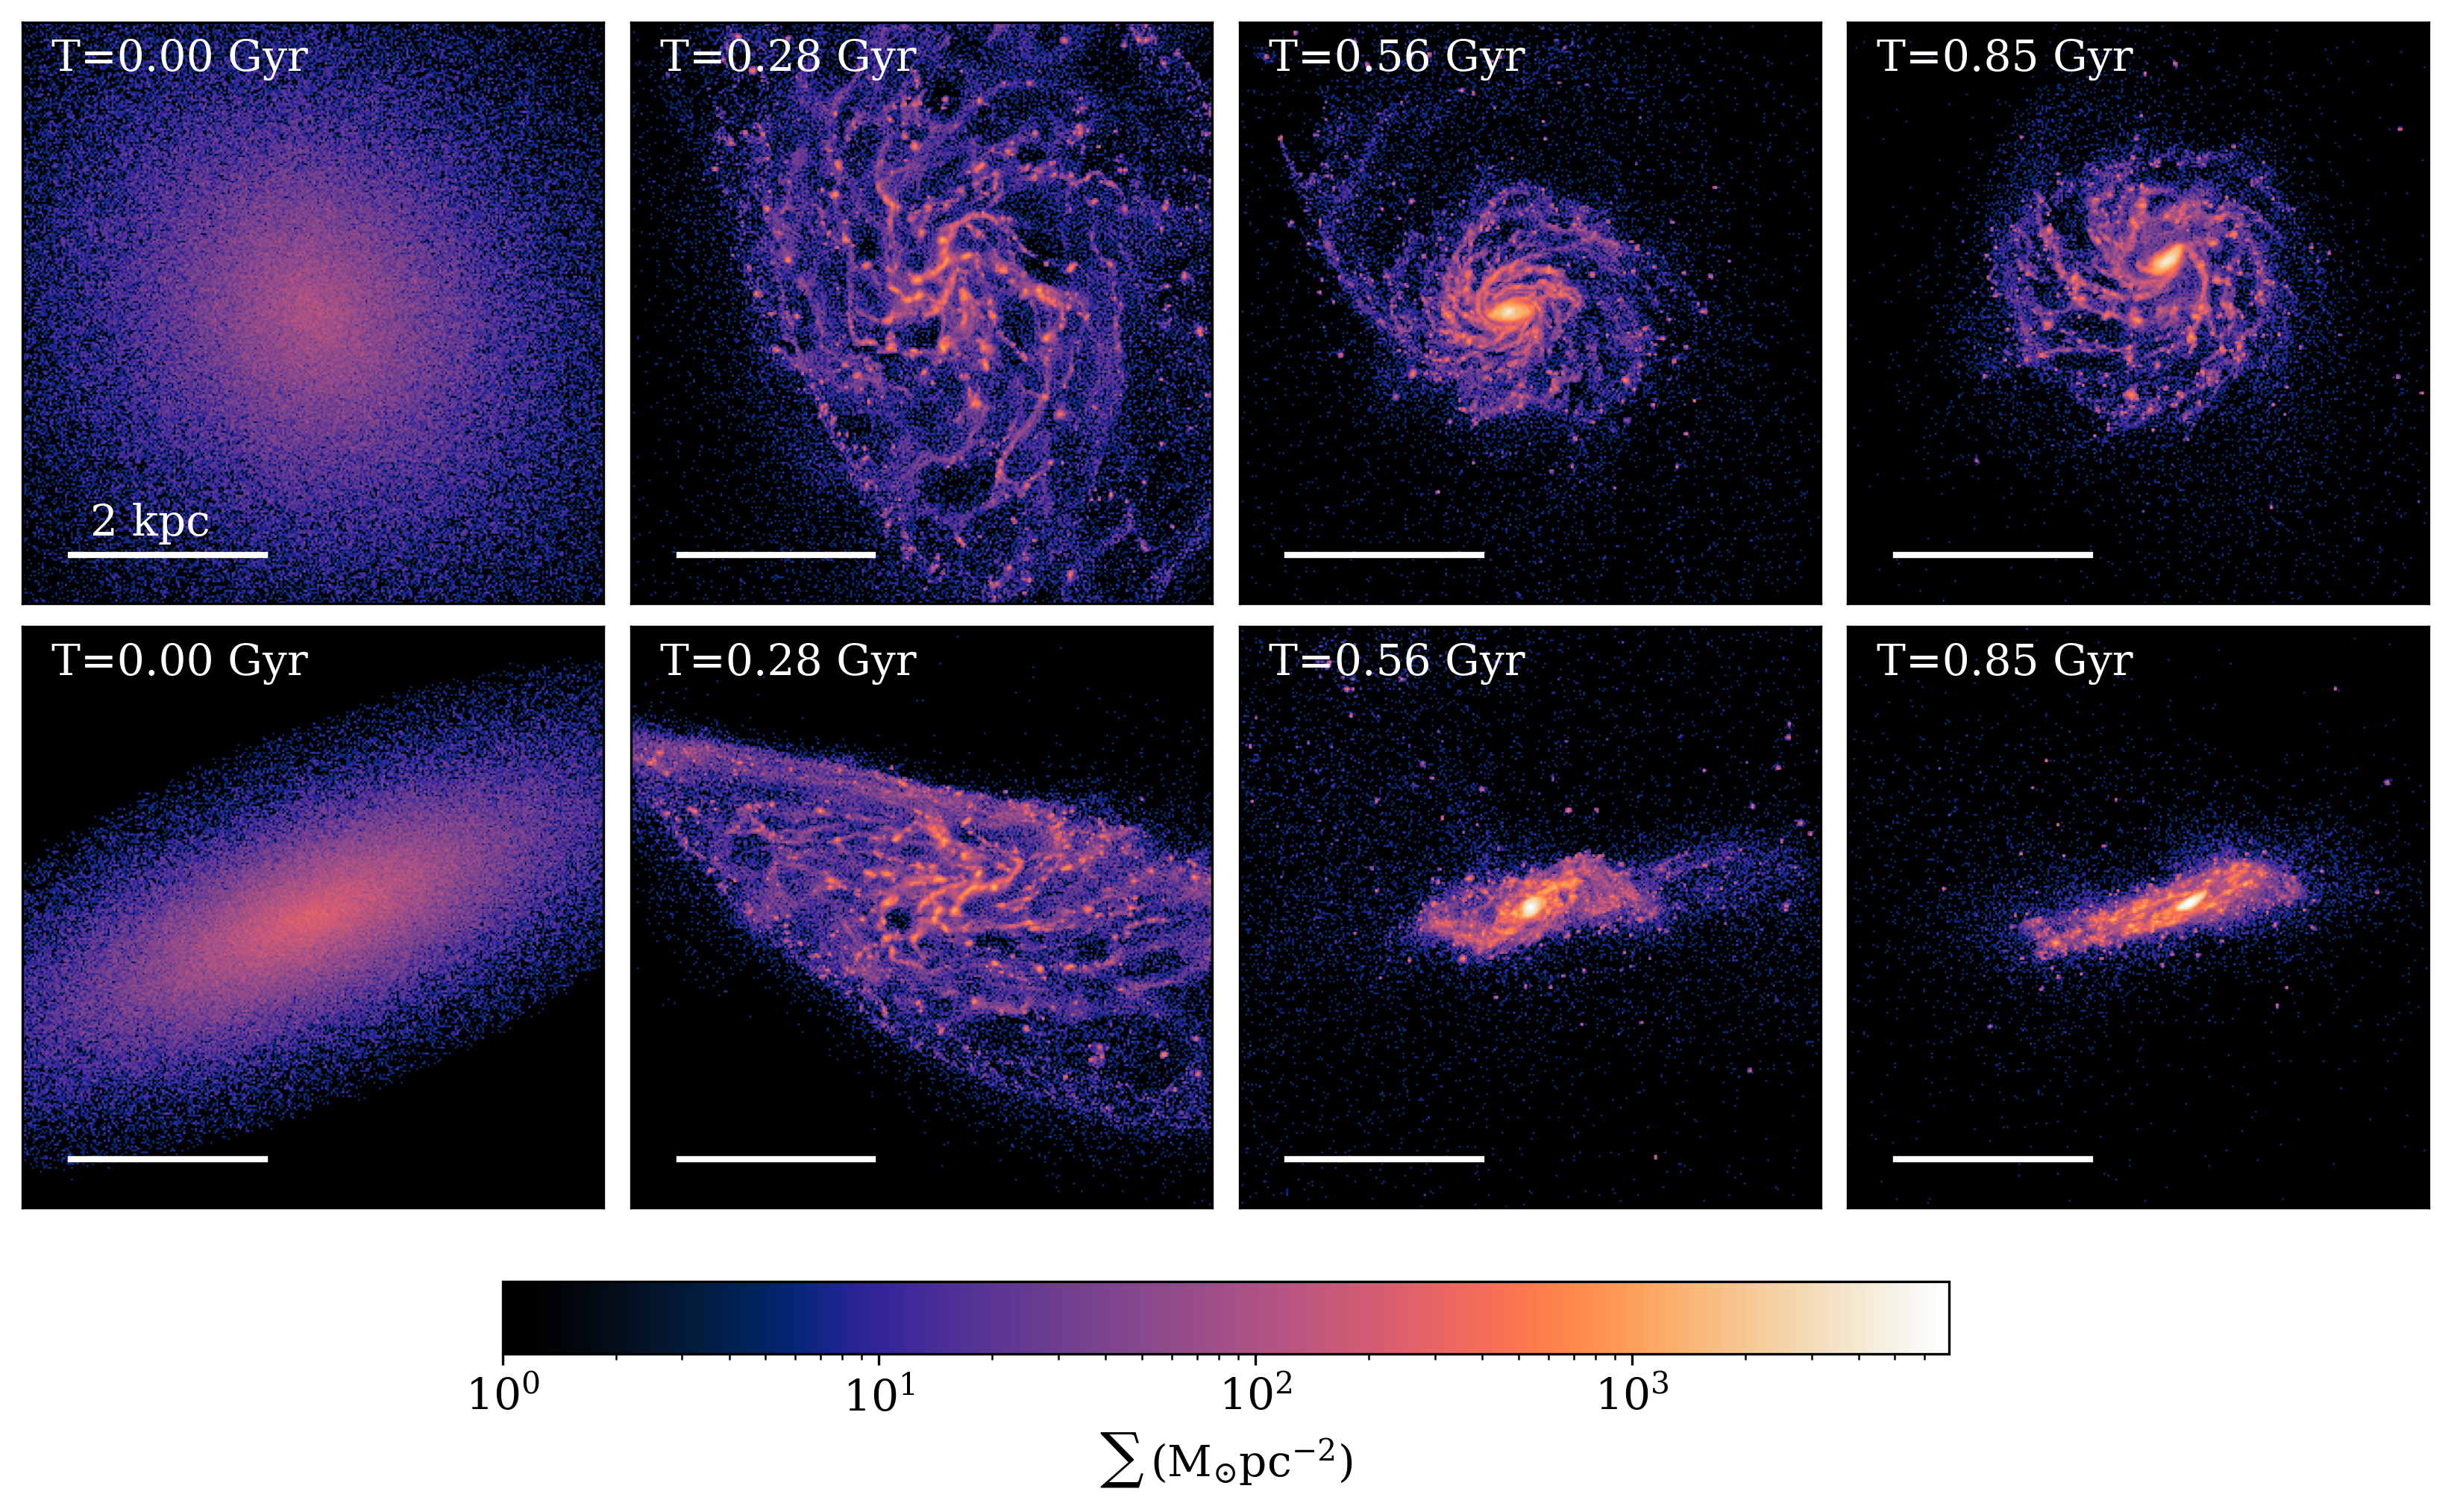
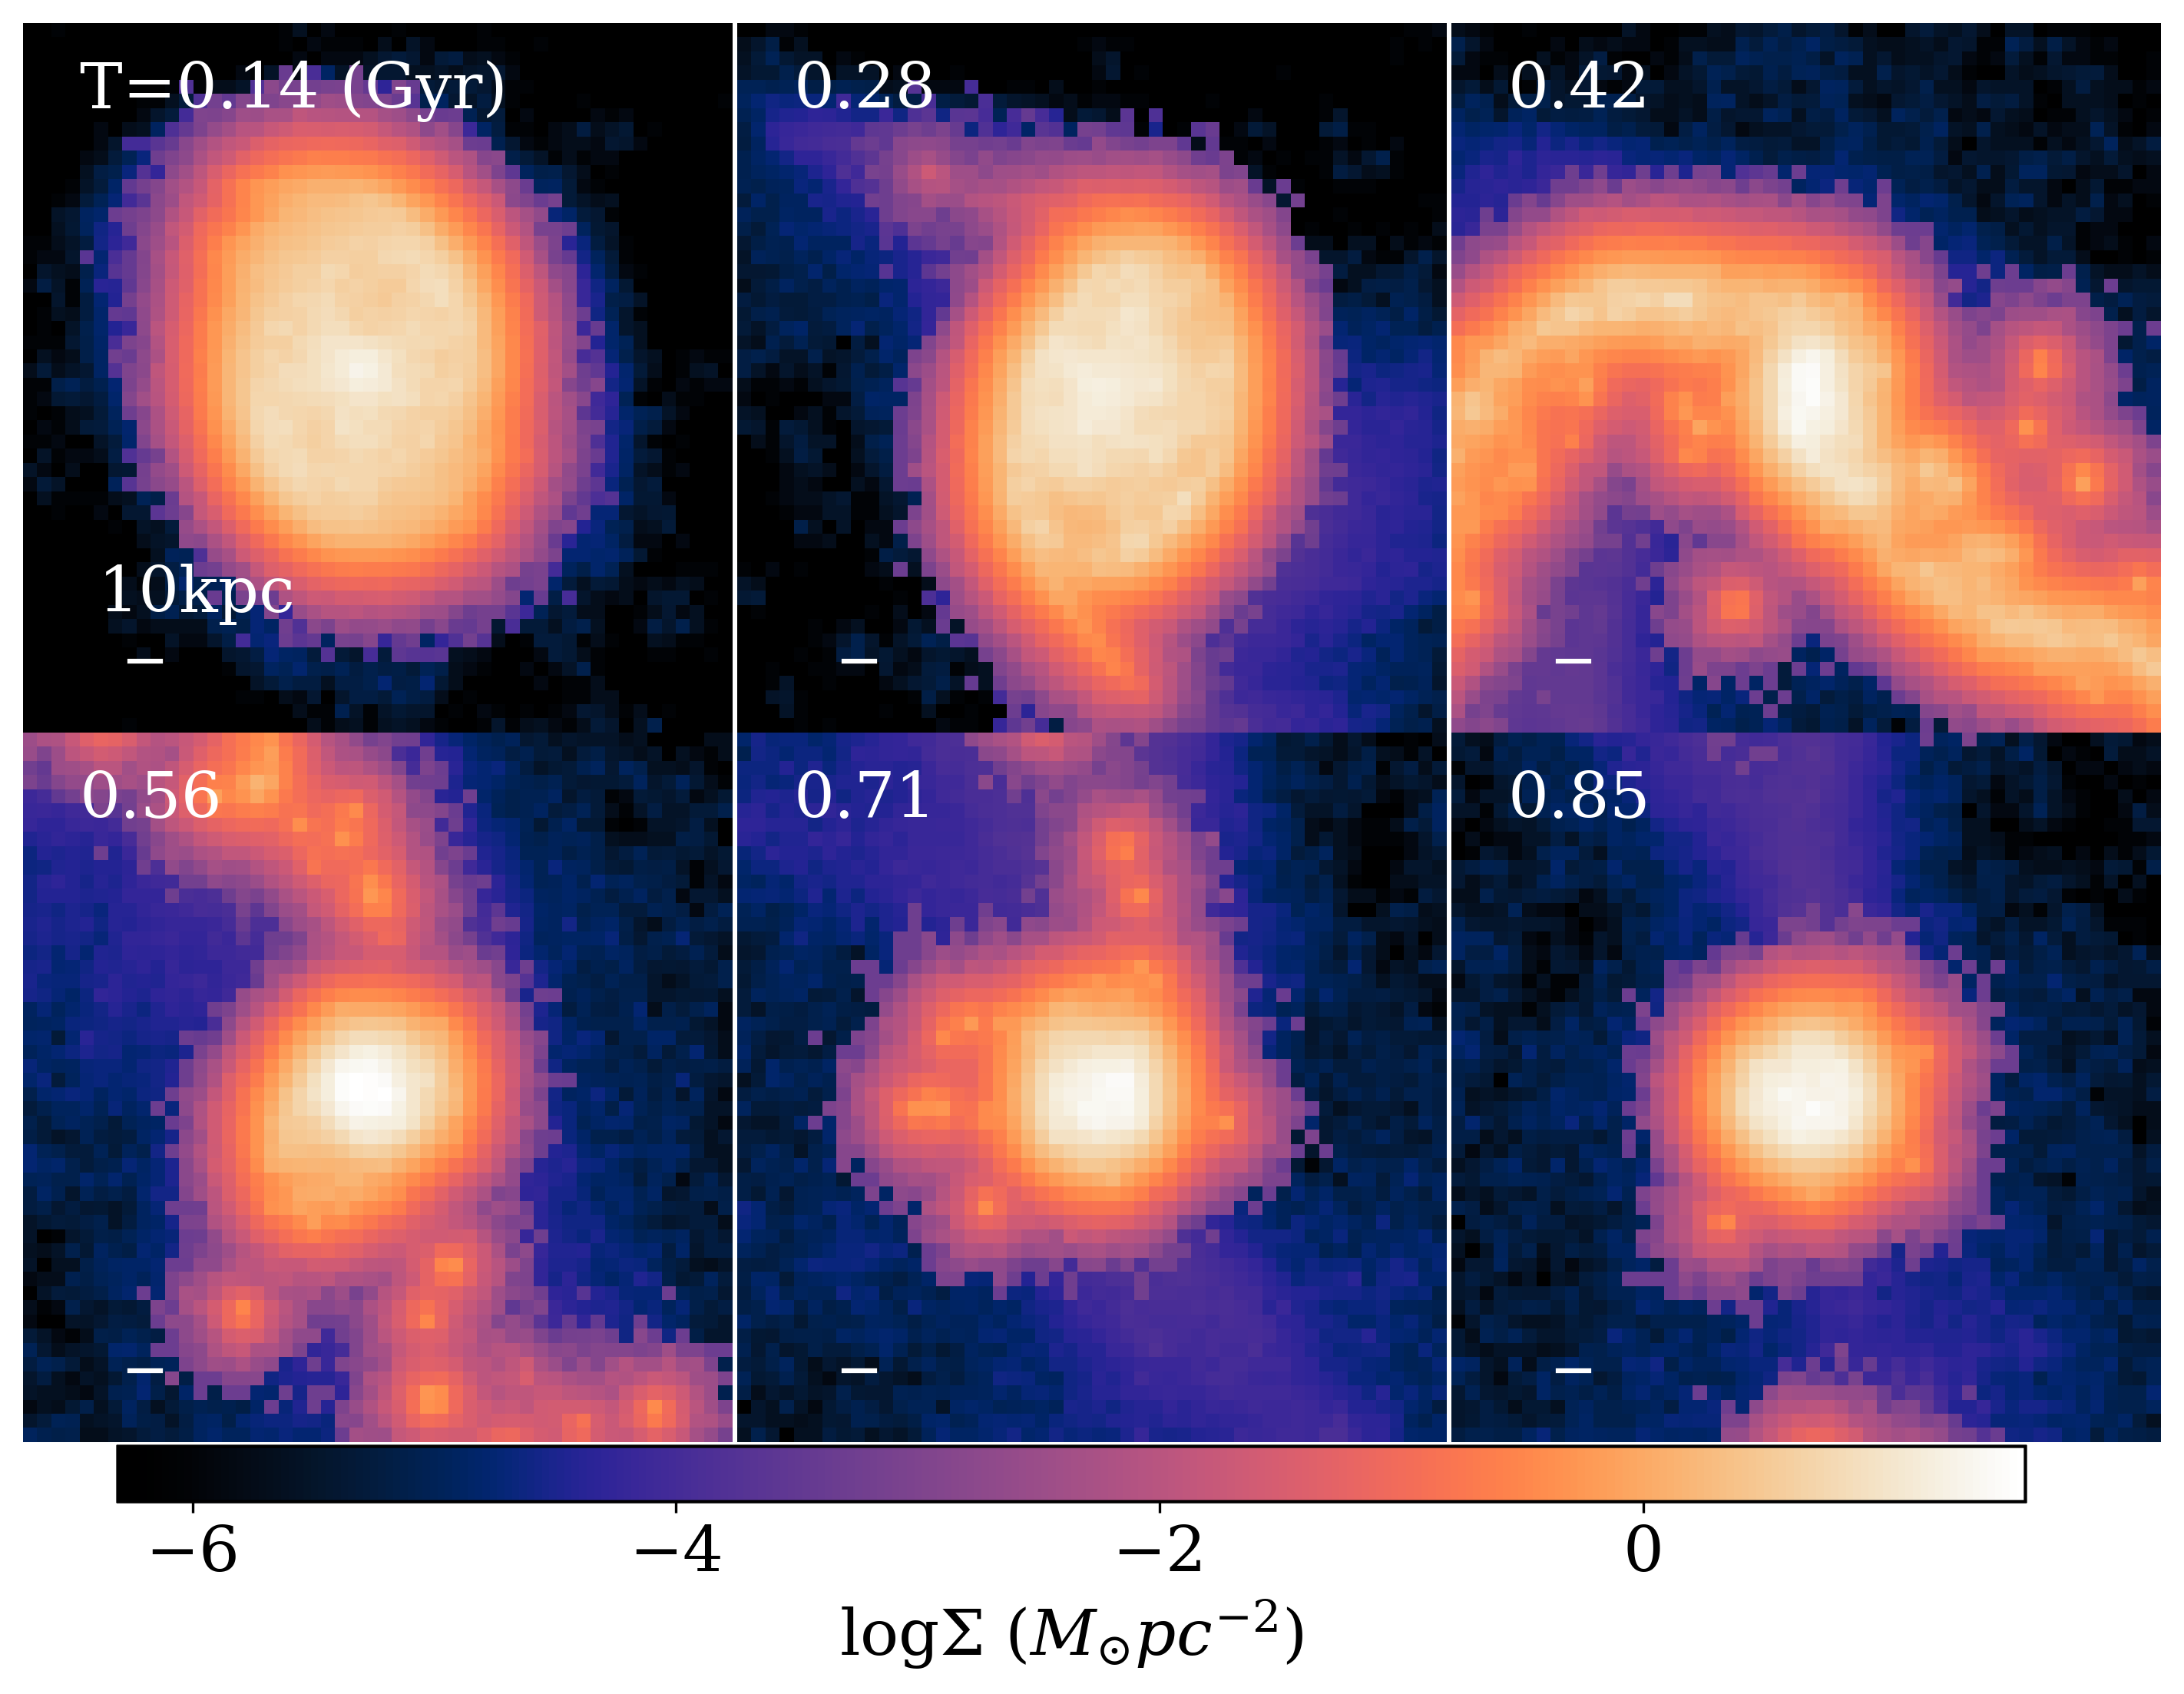
Firstly, we investigate how the gas disk of the SMC evolves with time during its violent tidal interaction with the LMC. Fig. 1 shows the time evolution of the surface mass density of the gas disk in the SMC for the fiducial tidal interaction model T1. In this model, the initial exponential disk is inclined on a 30∘ with respect to the x-y plane. From the initial conditions outlined in the previous section, the dwarf galaxy undergoes an interaction with our LMC-like potential between the second and third time frame, causing it to become a rotating disk with a barred centre. Analysing the distance between the SMC and the centre of the LMC in the simulation, the interaction has been caused by a close encounter between the LMC and the SMC at Gyr. This explains the change in the simulation after this time-step.
There is also a notable high-density region forming in the centre of this model in the final two time frames. To investigate this, we look at the star formation rate (SFR) over the whole simulation, as SFR is proportional to local gas density.
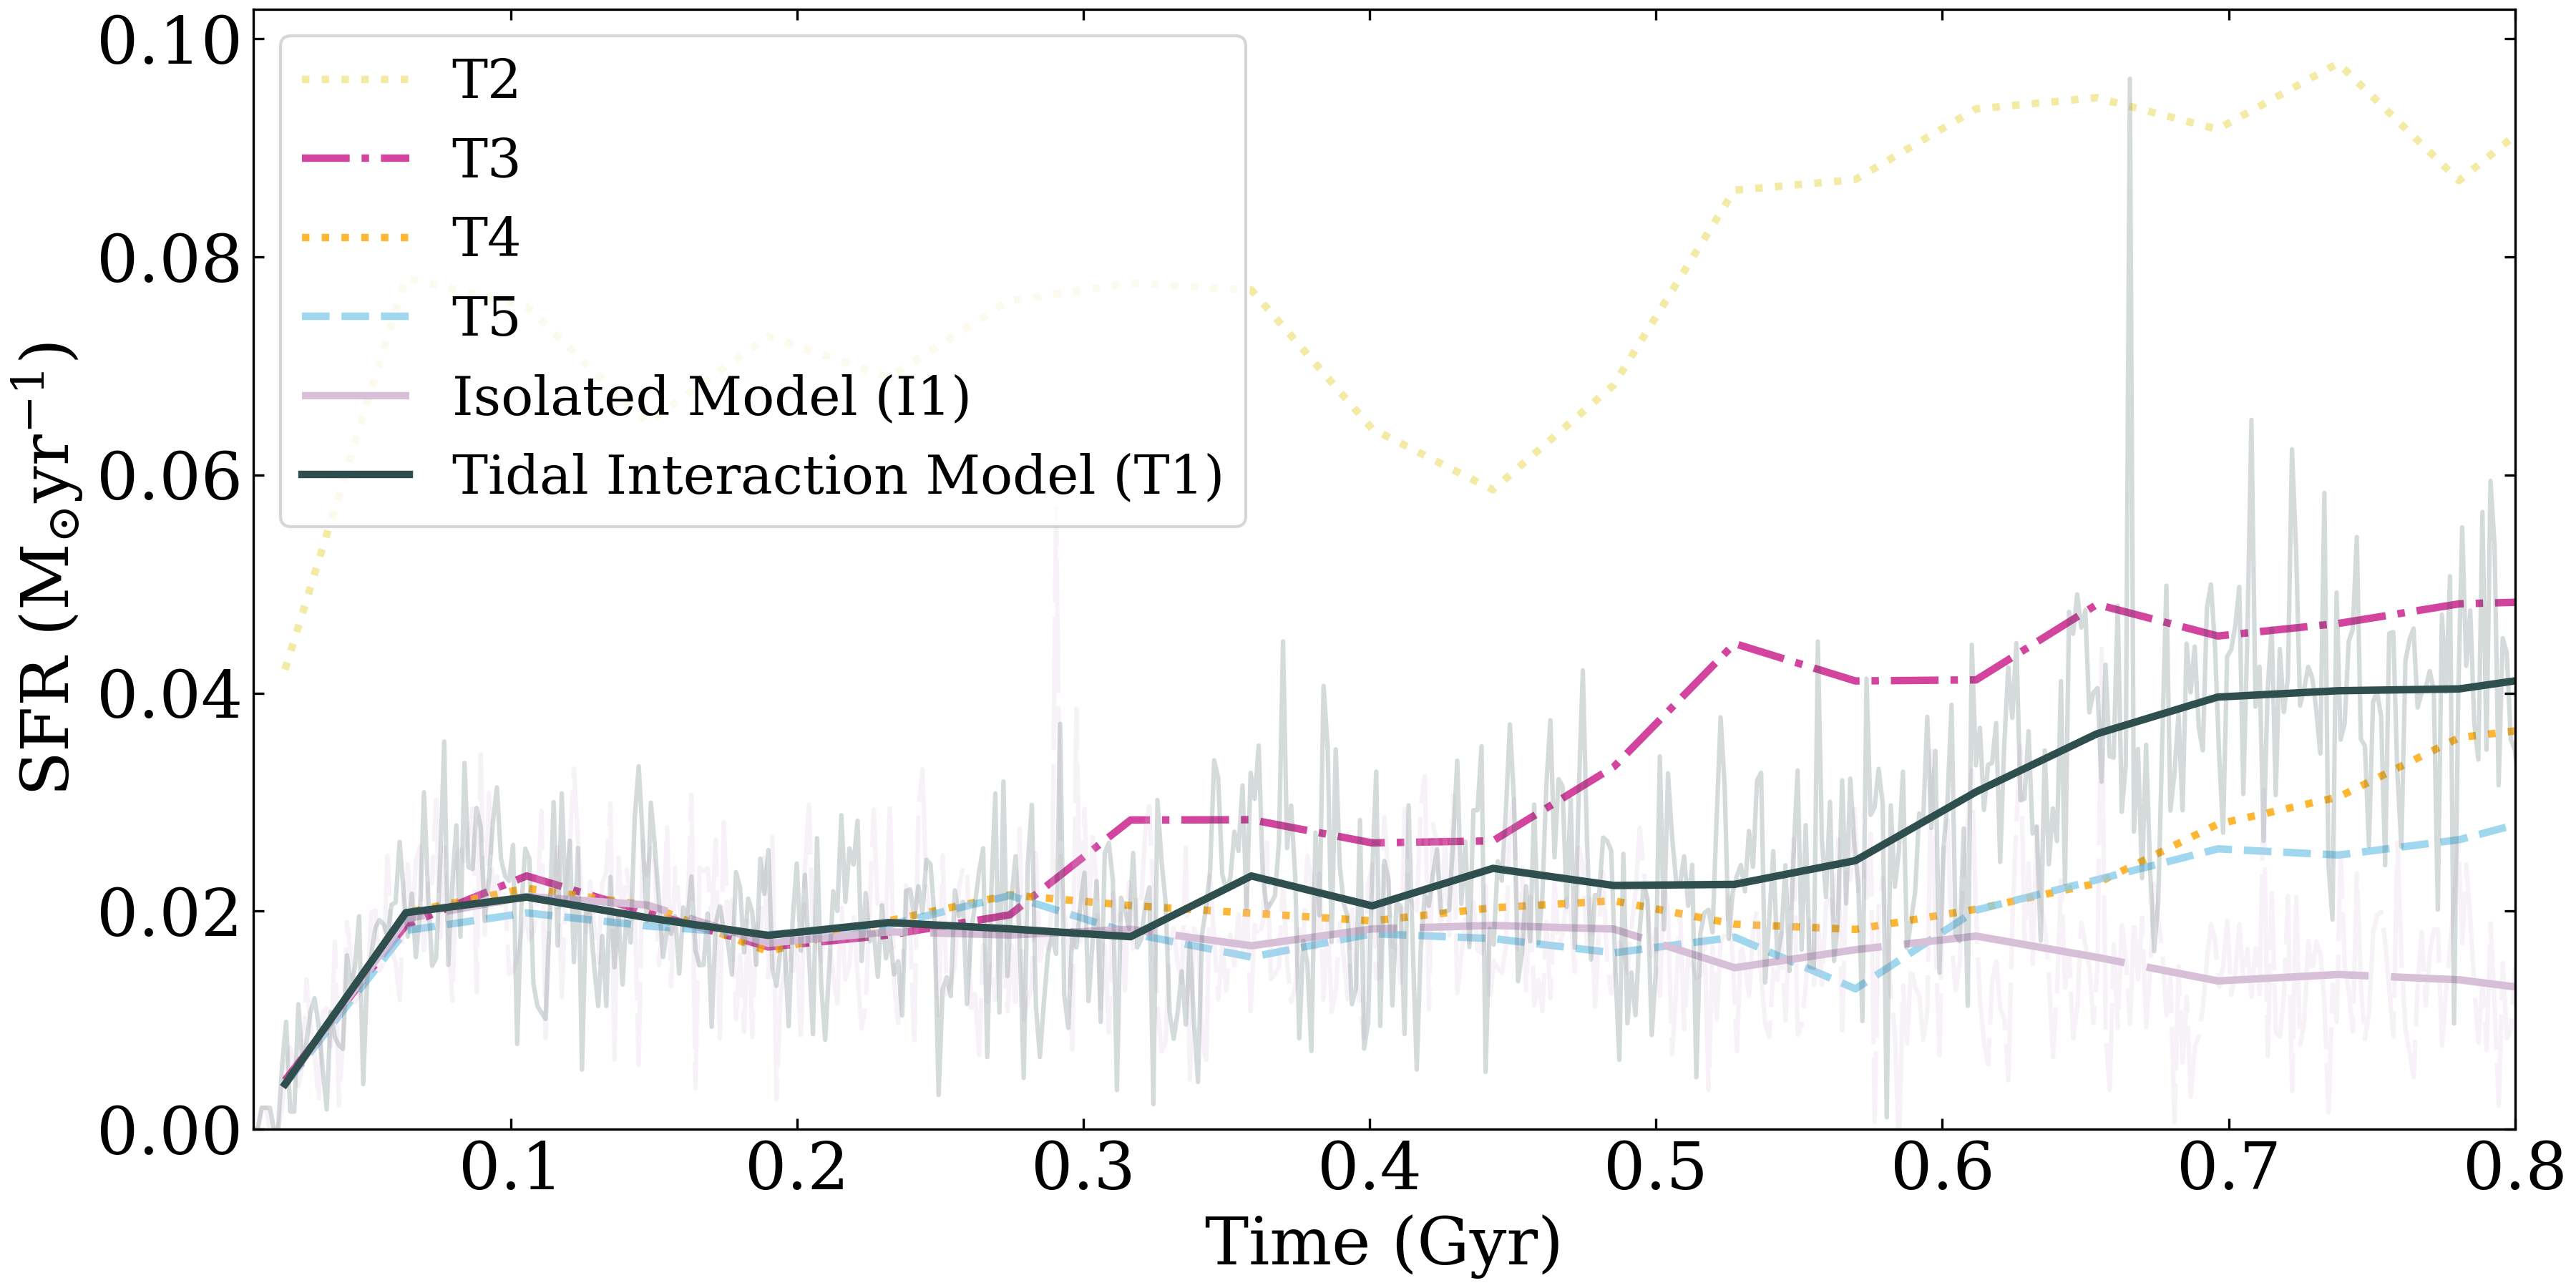
Fig. 2 shows the SFR over 0.8 Gyr of the simulation, where both models start with a SFR of , however, after Gyr in the simulation, the SFR of T1 increases by a factor of in comparison to I1.
In I1, there is no increase in SFR, and hence showing the increase in local gas density due to the tidal interactions. This enhancement factor aligns with Bergvall et al. (2003), where an enhancement factor of 2-3 was also noted.
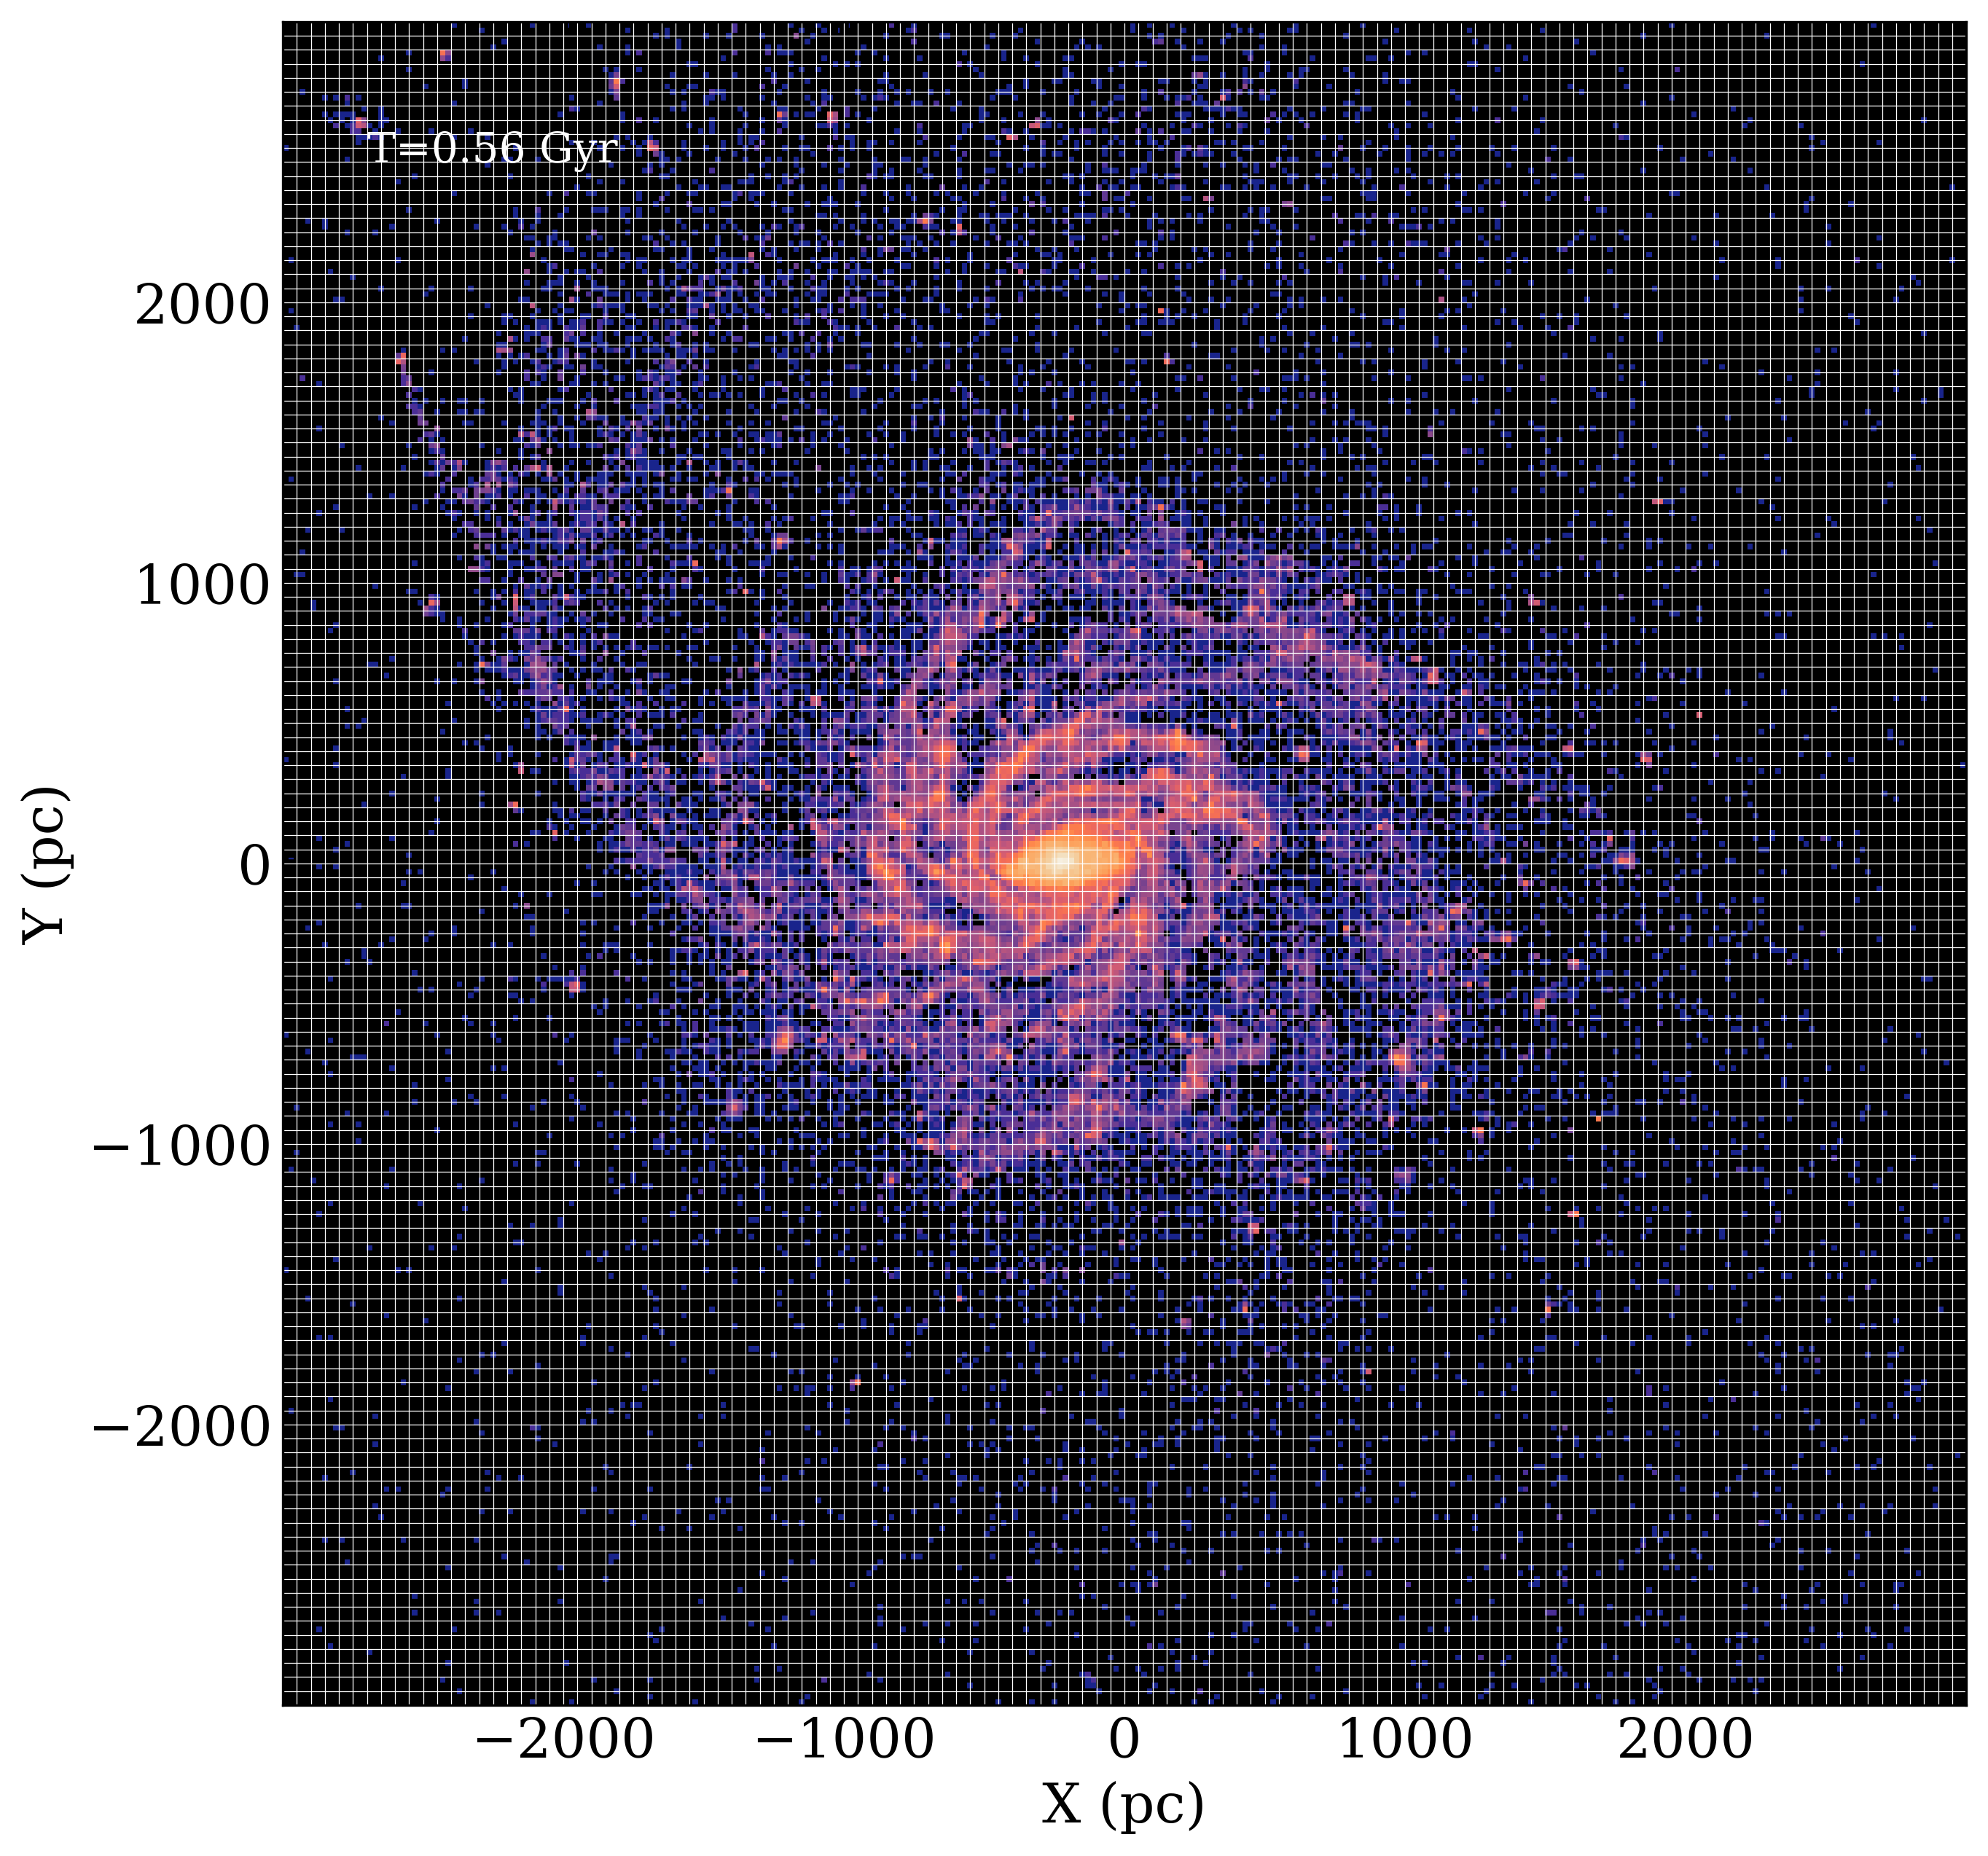
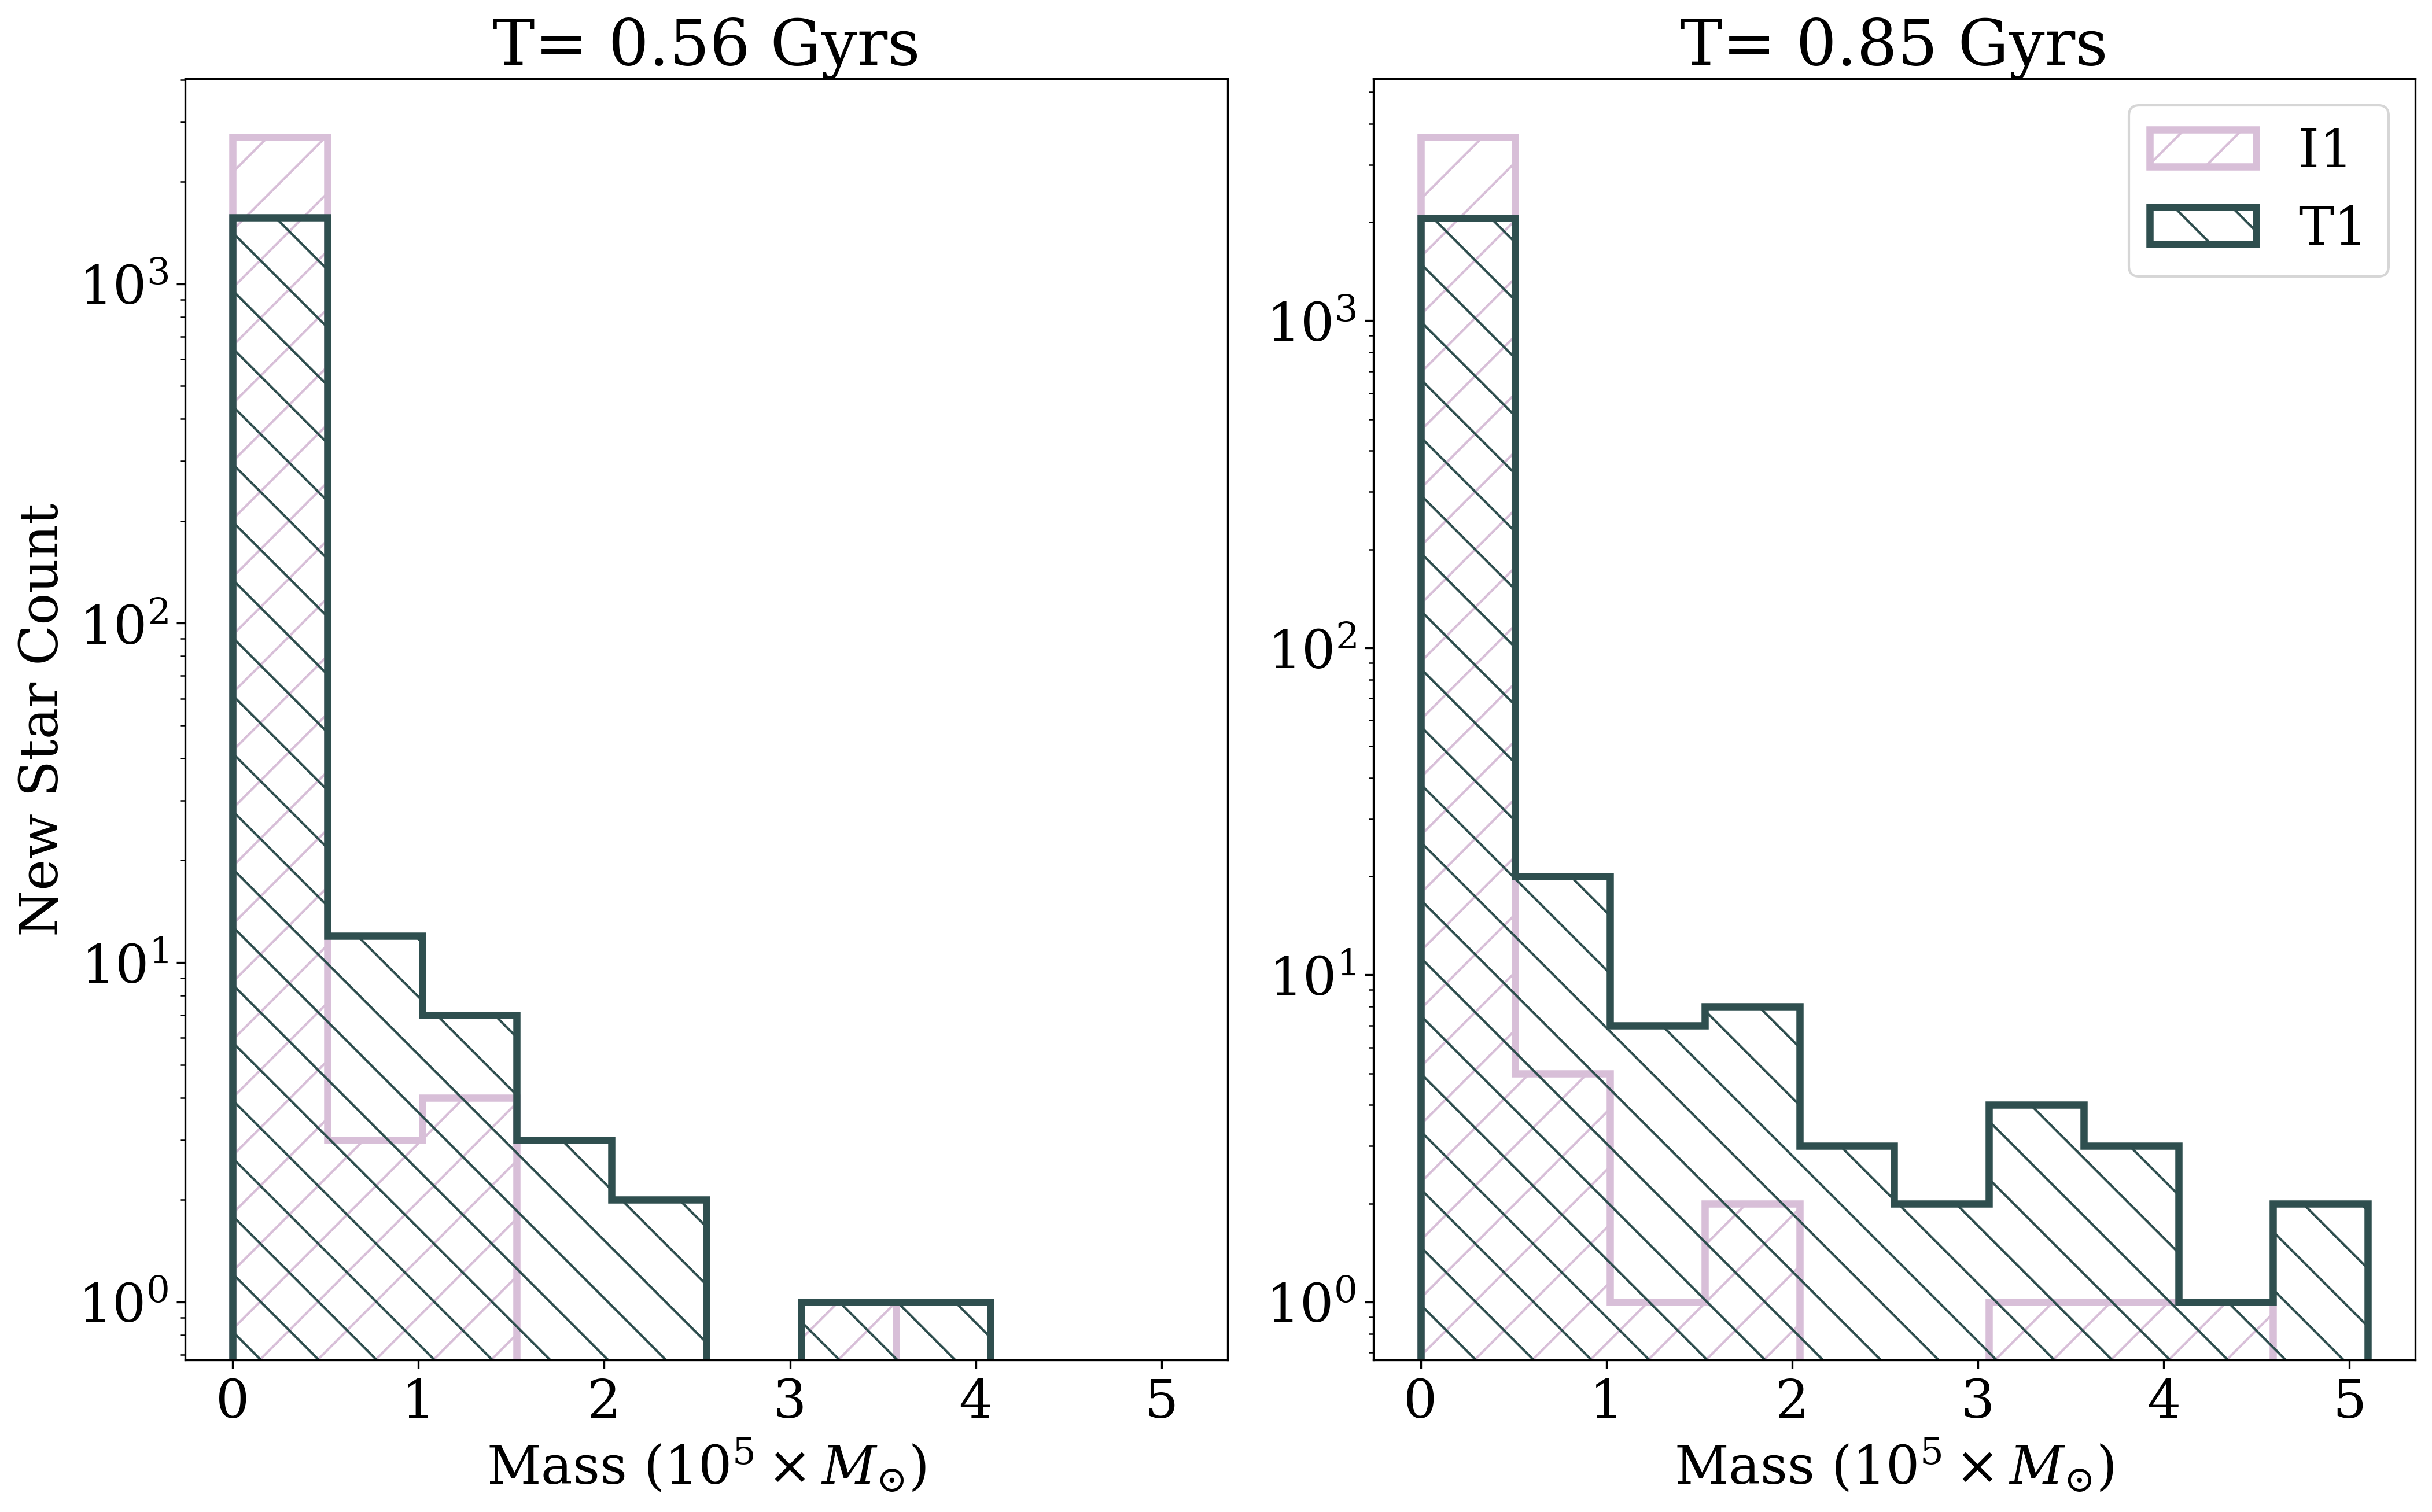
Further analysis was done to extrapolate potential cluster regions. We expected the clusters to have a radius between 5-15 pc (Boutloukos & Lamers 2003; Bitsakis et al. 2018), so a mesh with squares size pc was calculated for each time frame, and the total mass of new stars was calculated for each mesh. Fig. 3 gives an example of this process, which shows this 120120 mesh projected onto the T = 0.56 Gyr time-step. For this research, the mesh was applied in the x-y plane. We did investigate taking the mesh in the SMC’s inclined plane, however this produced the same enhancement factor, and given that the clusters would be re-simulated spherically in the second stage, the choice between these orientations didn’t effect our results. The distribution of masses in each bin is then presented in Fig. 4 for both T1 and I1. As a result of the increased SFR, T1 has more massive stellar clumps (with over ) than I1 in both the T = 0.56 Gyr and 0.85 Gyr time-steps, further demonstrating the enhancement of potential star cluster regions.
3.1.2 Parameter dependence
There were four other models investigated, all with varying parameter dependence (Table 2). T2 has a noticeably higher SFR, as expected from the larger SMC model mass. Despite T3, T4 and T5 following the trends shown by T1, T2 shows no predominate SFR increase after the tidal interaction (Fig. 2). This is also seen in the mass function (Fig. 5), where T2 has no regions with density greater than . T5 shows an increase in SFR, however this occurs a lot later than T1, and, when looking at density regions, T5 has less high-density regions than I1. This could be explained by the circular orbit creating less high-density regions. T3 and T4 have very similar shapes to T1, however both form more high-density regions at earlier times than T1, with T4 reaching the highest density at Gyrs of over .
Despite there being recent works suggesting the LMC mass is greater than M⊙ (Peñarrubia et al. 2016; Erkal
et al. 2019; Erkal &
Belokurov 2020), we only investigated LMC masses up to M⊙. For higher masses, we would expect a smaller tidal radius, which would imply the LMC has a larger influence on the SMC.
3.2 SC formation
Here we select 9 SCs from the tidal interaction model T1 which were formed from GMC’s with initial mass over M⊙, and thereby describe the physical properties of the SCs. These SCs are selected, mainly because each of them have quite interesting and unique characteristics in the internal structures and kinematics. We first describe the radial density profiles, the 2D density maps for SC1, followed by a further 8 SCs. Then we describe the 2D kinematics maps of line-of-sight velocities and velocity dispersion in detail.
3.2.1 SC1 properties
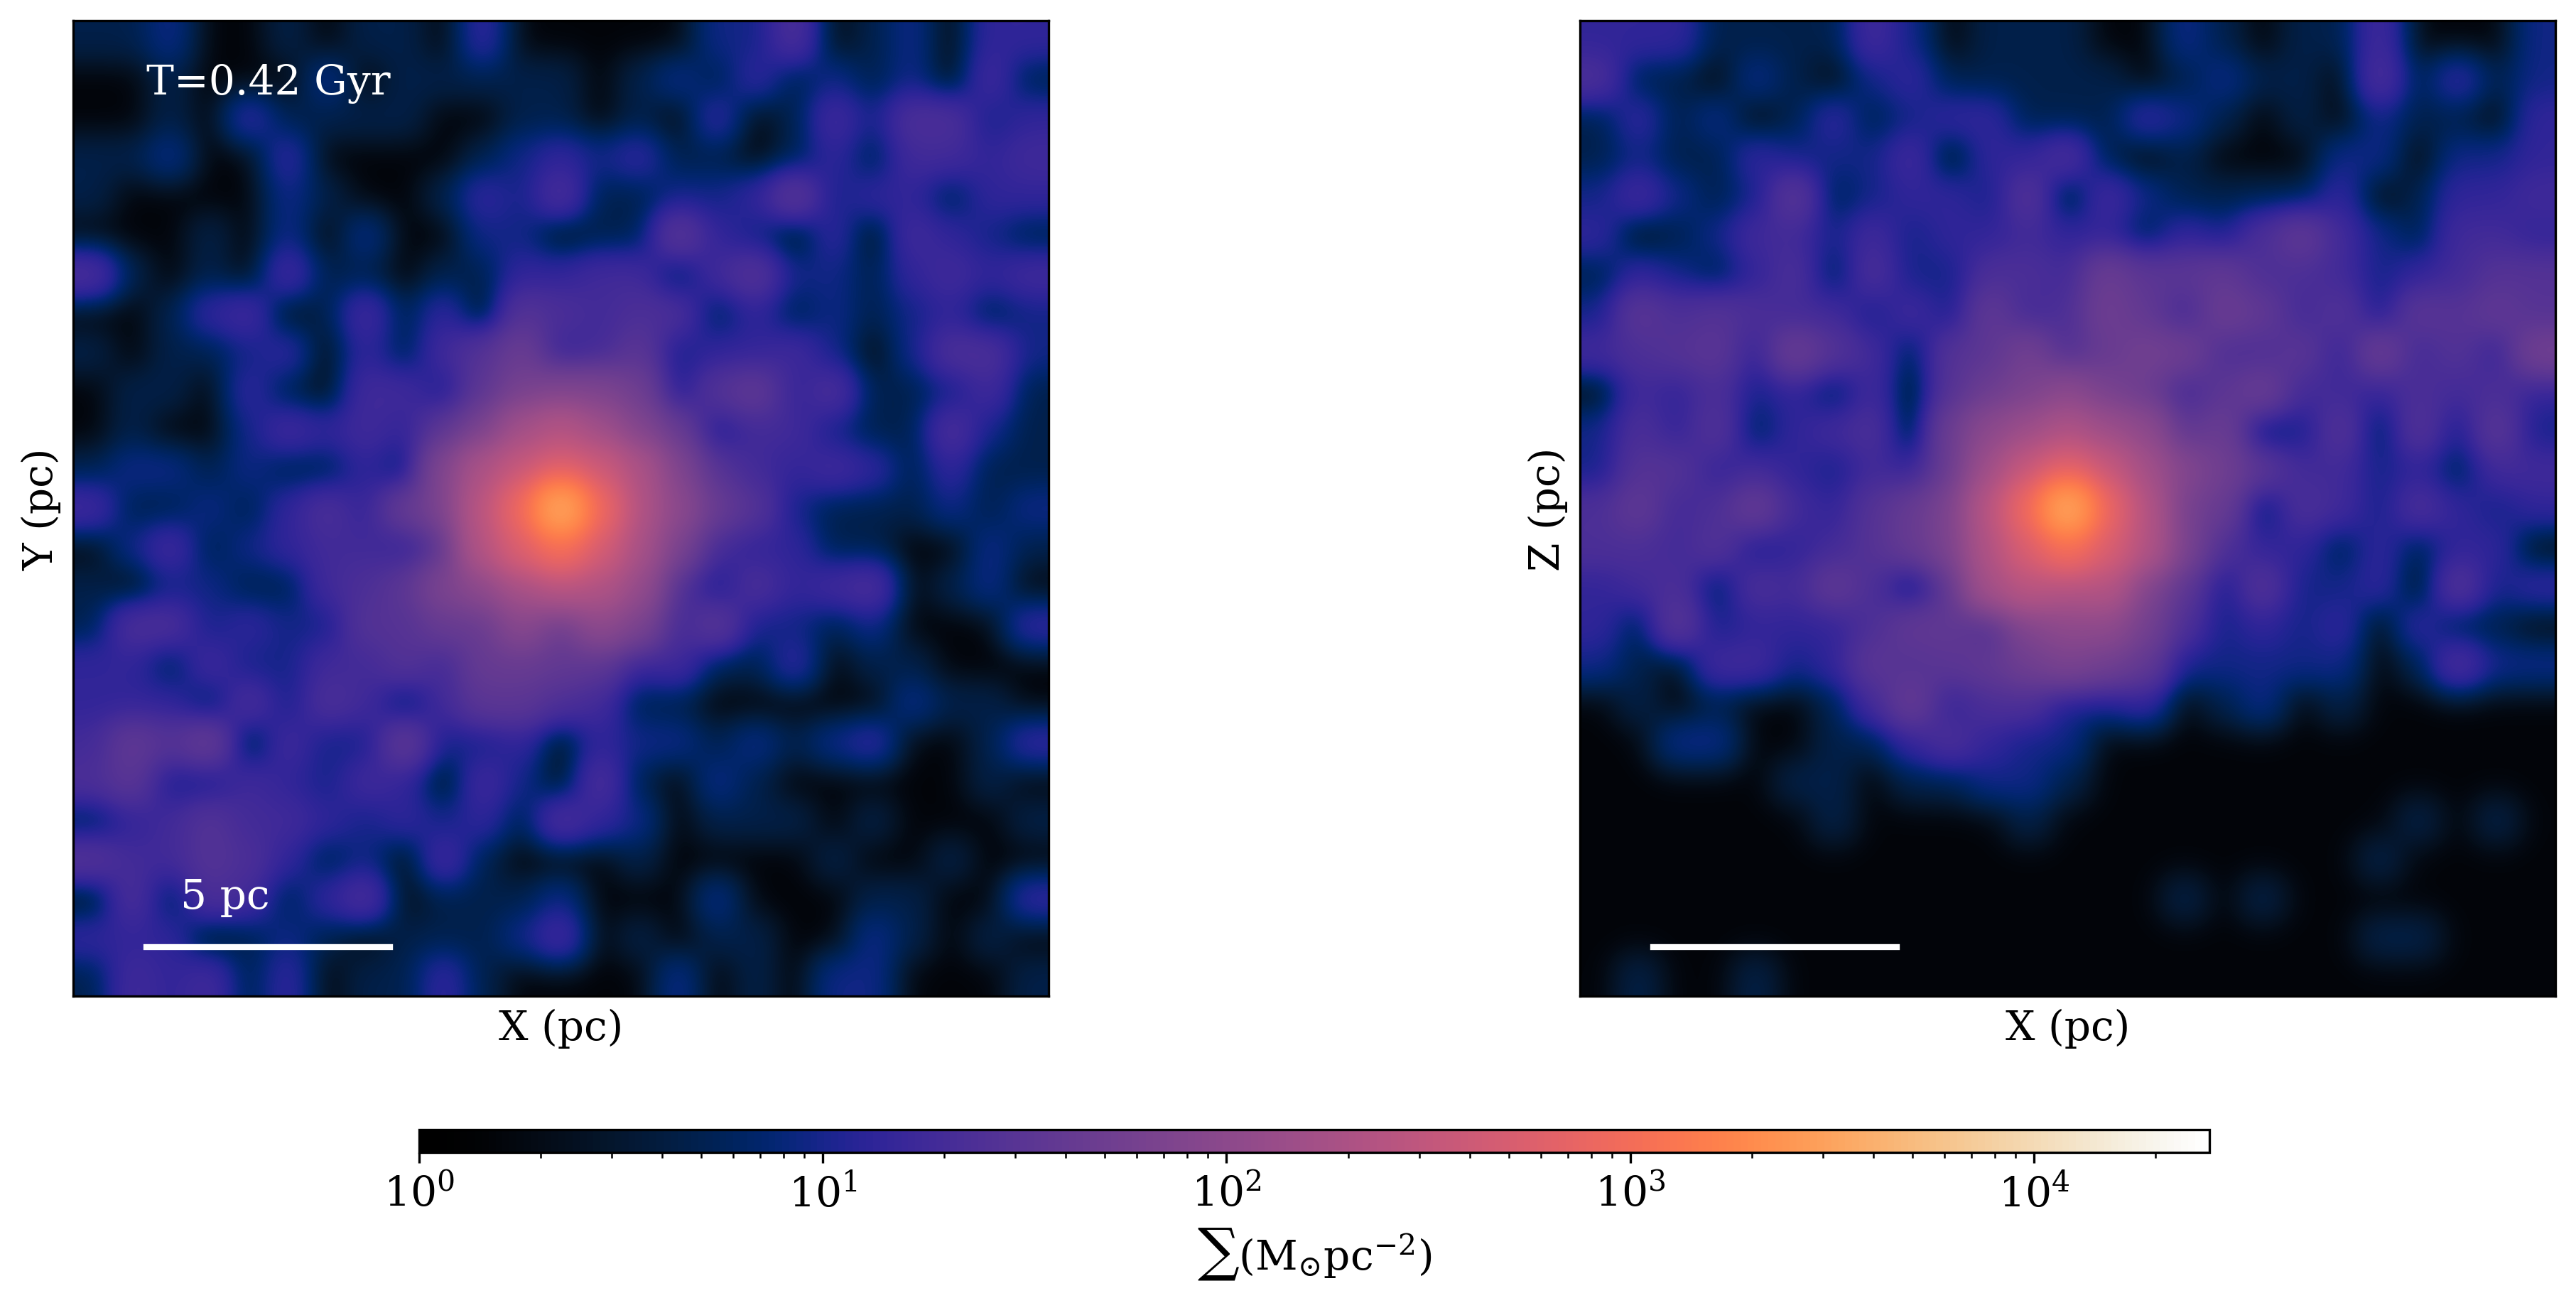
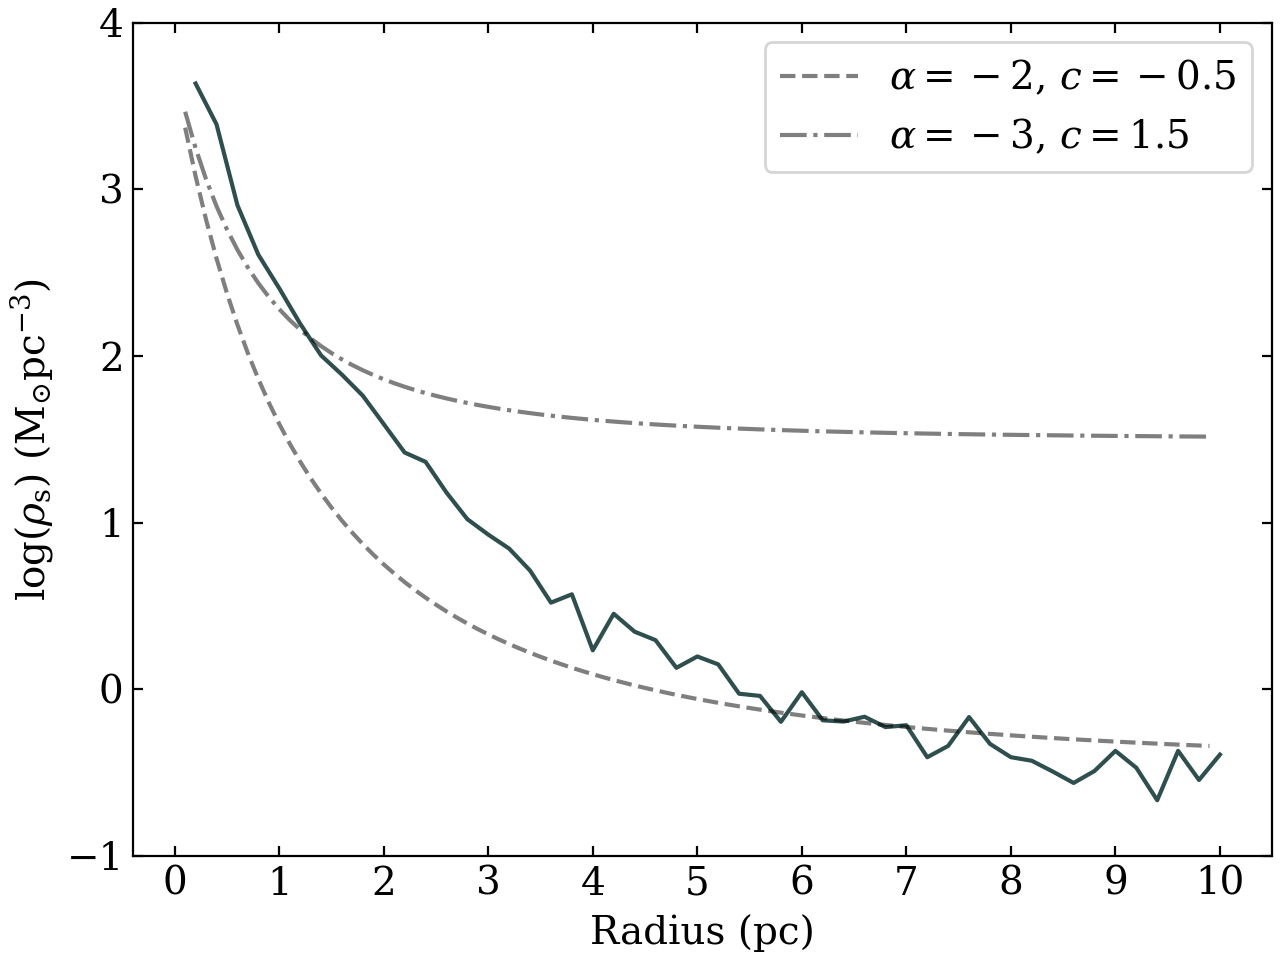
SC1 can be identified as a cluster due to the distinct spherical shape as seen in Fig. 6. The irregular and clumpy structure in the cluster’s outer stellar envelope is a result of the outer part of SC1 not being fully dynamically relaxed yet. The radial density profile (Fig. 7) has a flat outer profile, which indicates a potential stellar envelope past 5 pc. It can also modelled by the following (3D) radial density profile:
| (4) |
where and . Elson et al. (1987) shows that the outer 2D projected density profiles have the power law with the slope of ranging from -2.2 to -3.2, so our results align. SC1 has a mass of within a pc radius, and pc half mass radius (mass taken within pc). As the SCs originally have GMC larger than M⊙ within 15 pc, most new stars exist outside the half-mass radius. SMC GC’s have a mass of within pc, meaning the mass and size of SC1 is too small to be considered a GC (Hill & Zaritsky 2006), however the mass is much greater than within pc that open clusters (OCs) have. Hence we identify the cluster as a massive star cluster.
3.2.2 SC1 kinematics
Although the 2D maps of line-of-sight velocities and velocity dispersion’s of this SC are investigated for the three x-y, x-z, and y-z projections, no/little rotation is found in this SC. Also, it was found that this cluster did not show a flattened 2D velocity dispersion map, that is indicative anisotropy in velocity dispersion’s. These results of stellar kinematics are consistent with the spherical shapes of this SC shown in Fig. 6. This SC shows a large range of the projected velocities (e.g., -15.9 to 13.4 km s-1 for the x-y projection), which would make it harder for this study to detect a small amplitude of rotation. It is, however, confirmed that this SC does not show any clear rotation in the three projections, even if the velocity range is limited to -5 km/s to 5 km/s. This point is discussed in Appendix A in detail, because careful analysis is required for the detection of internal rotation of SCs in the present study.
3.2.3 SC2-9 properties
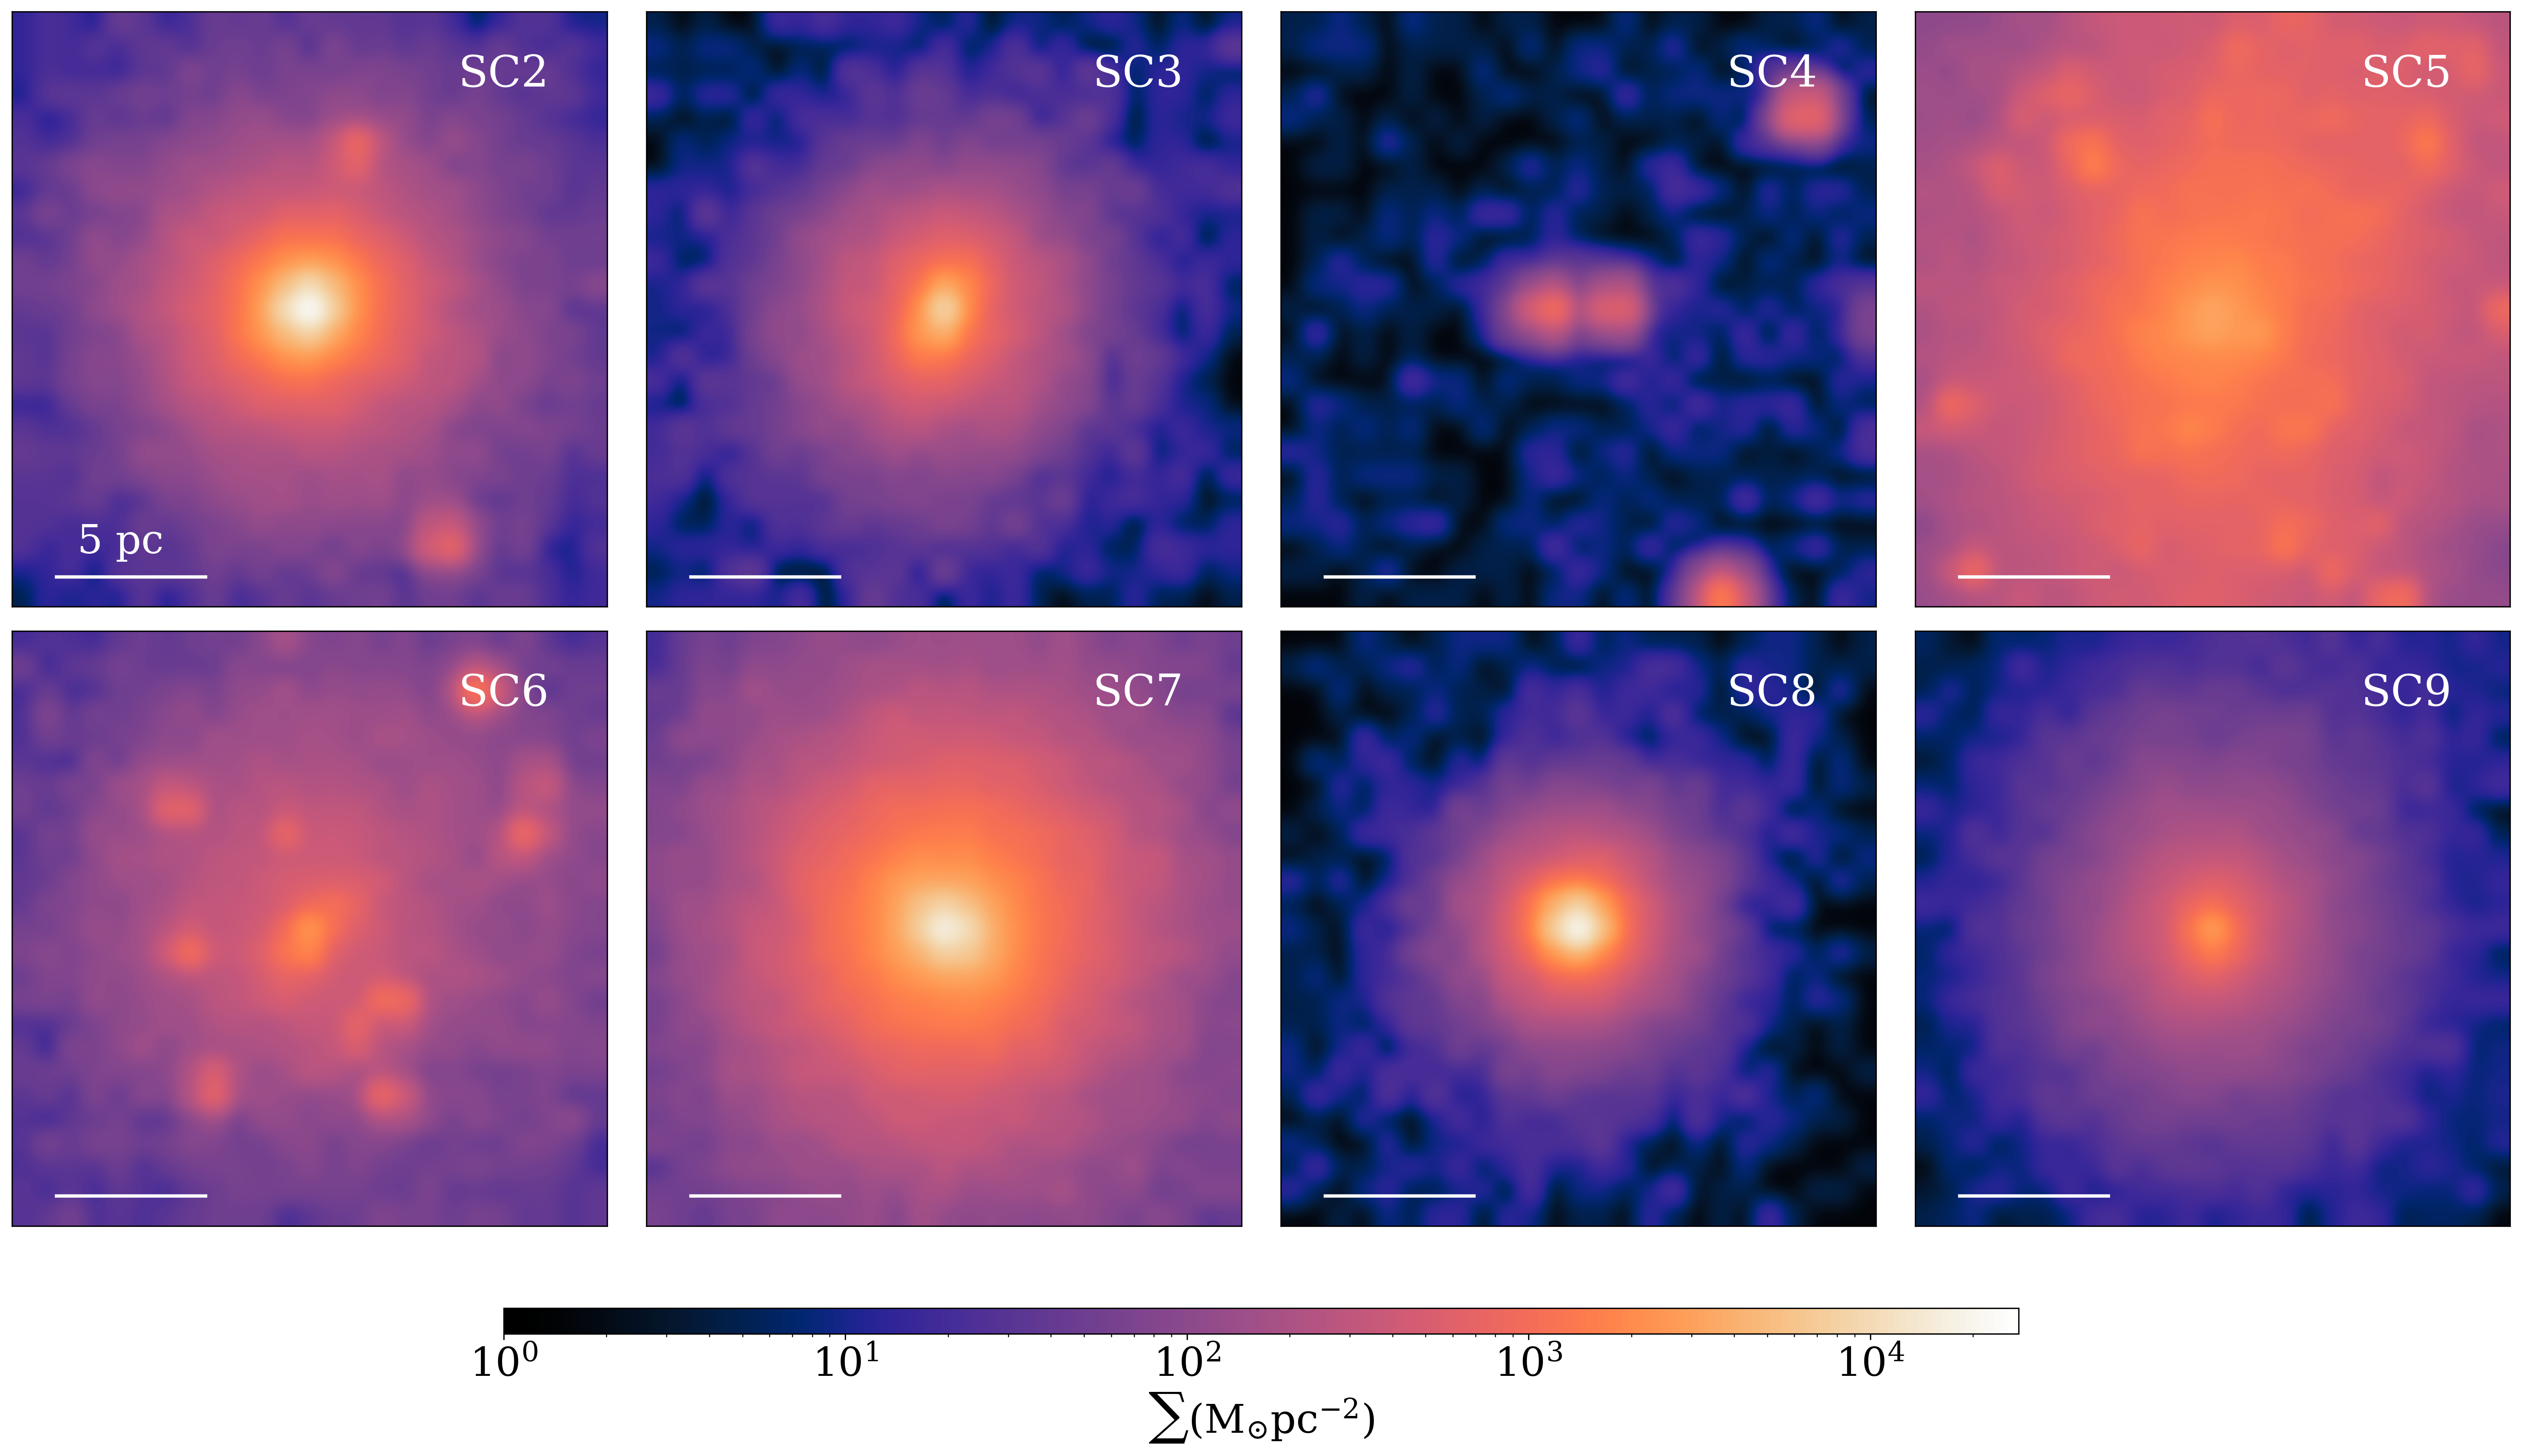
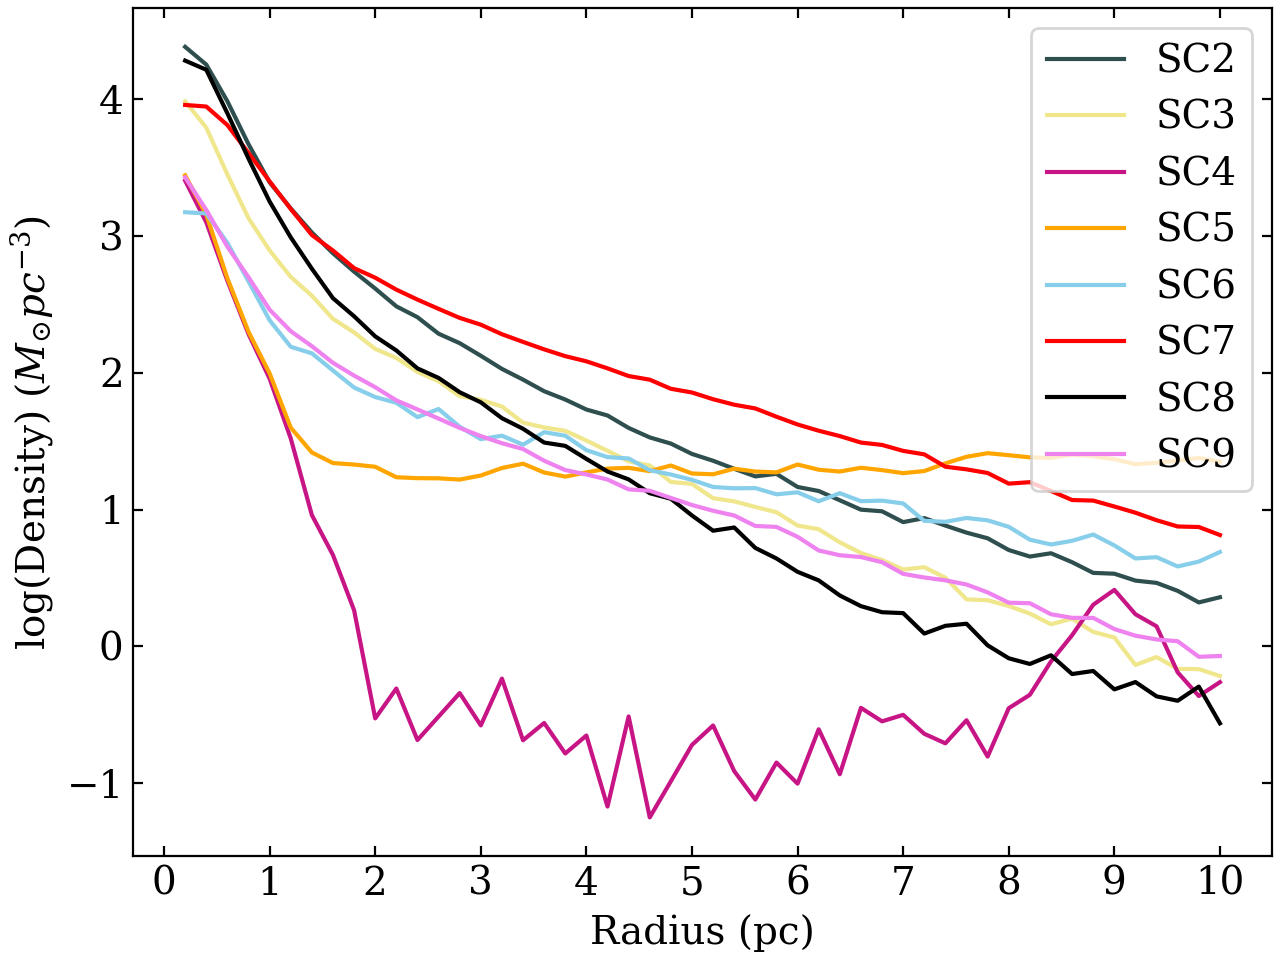
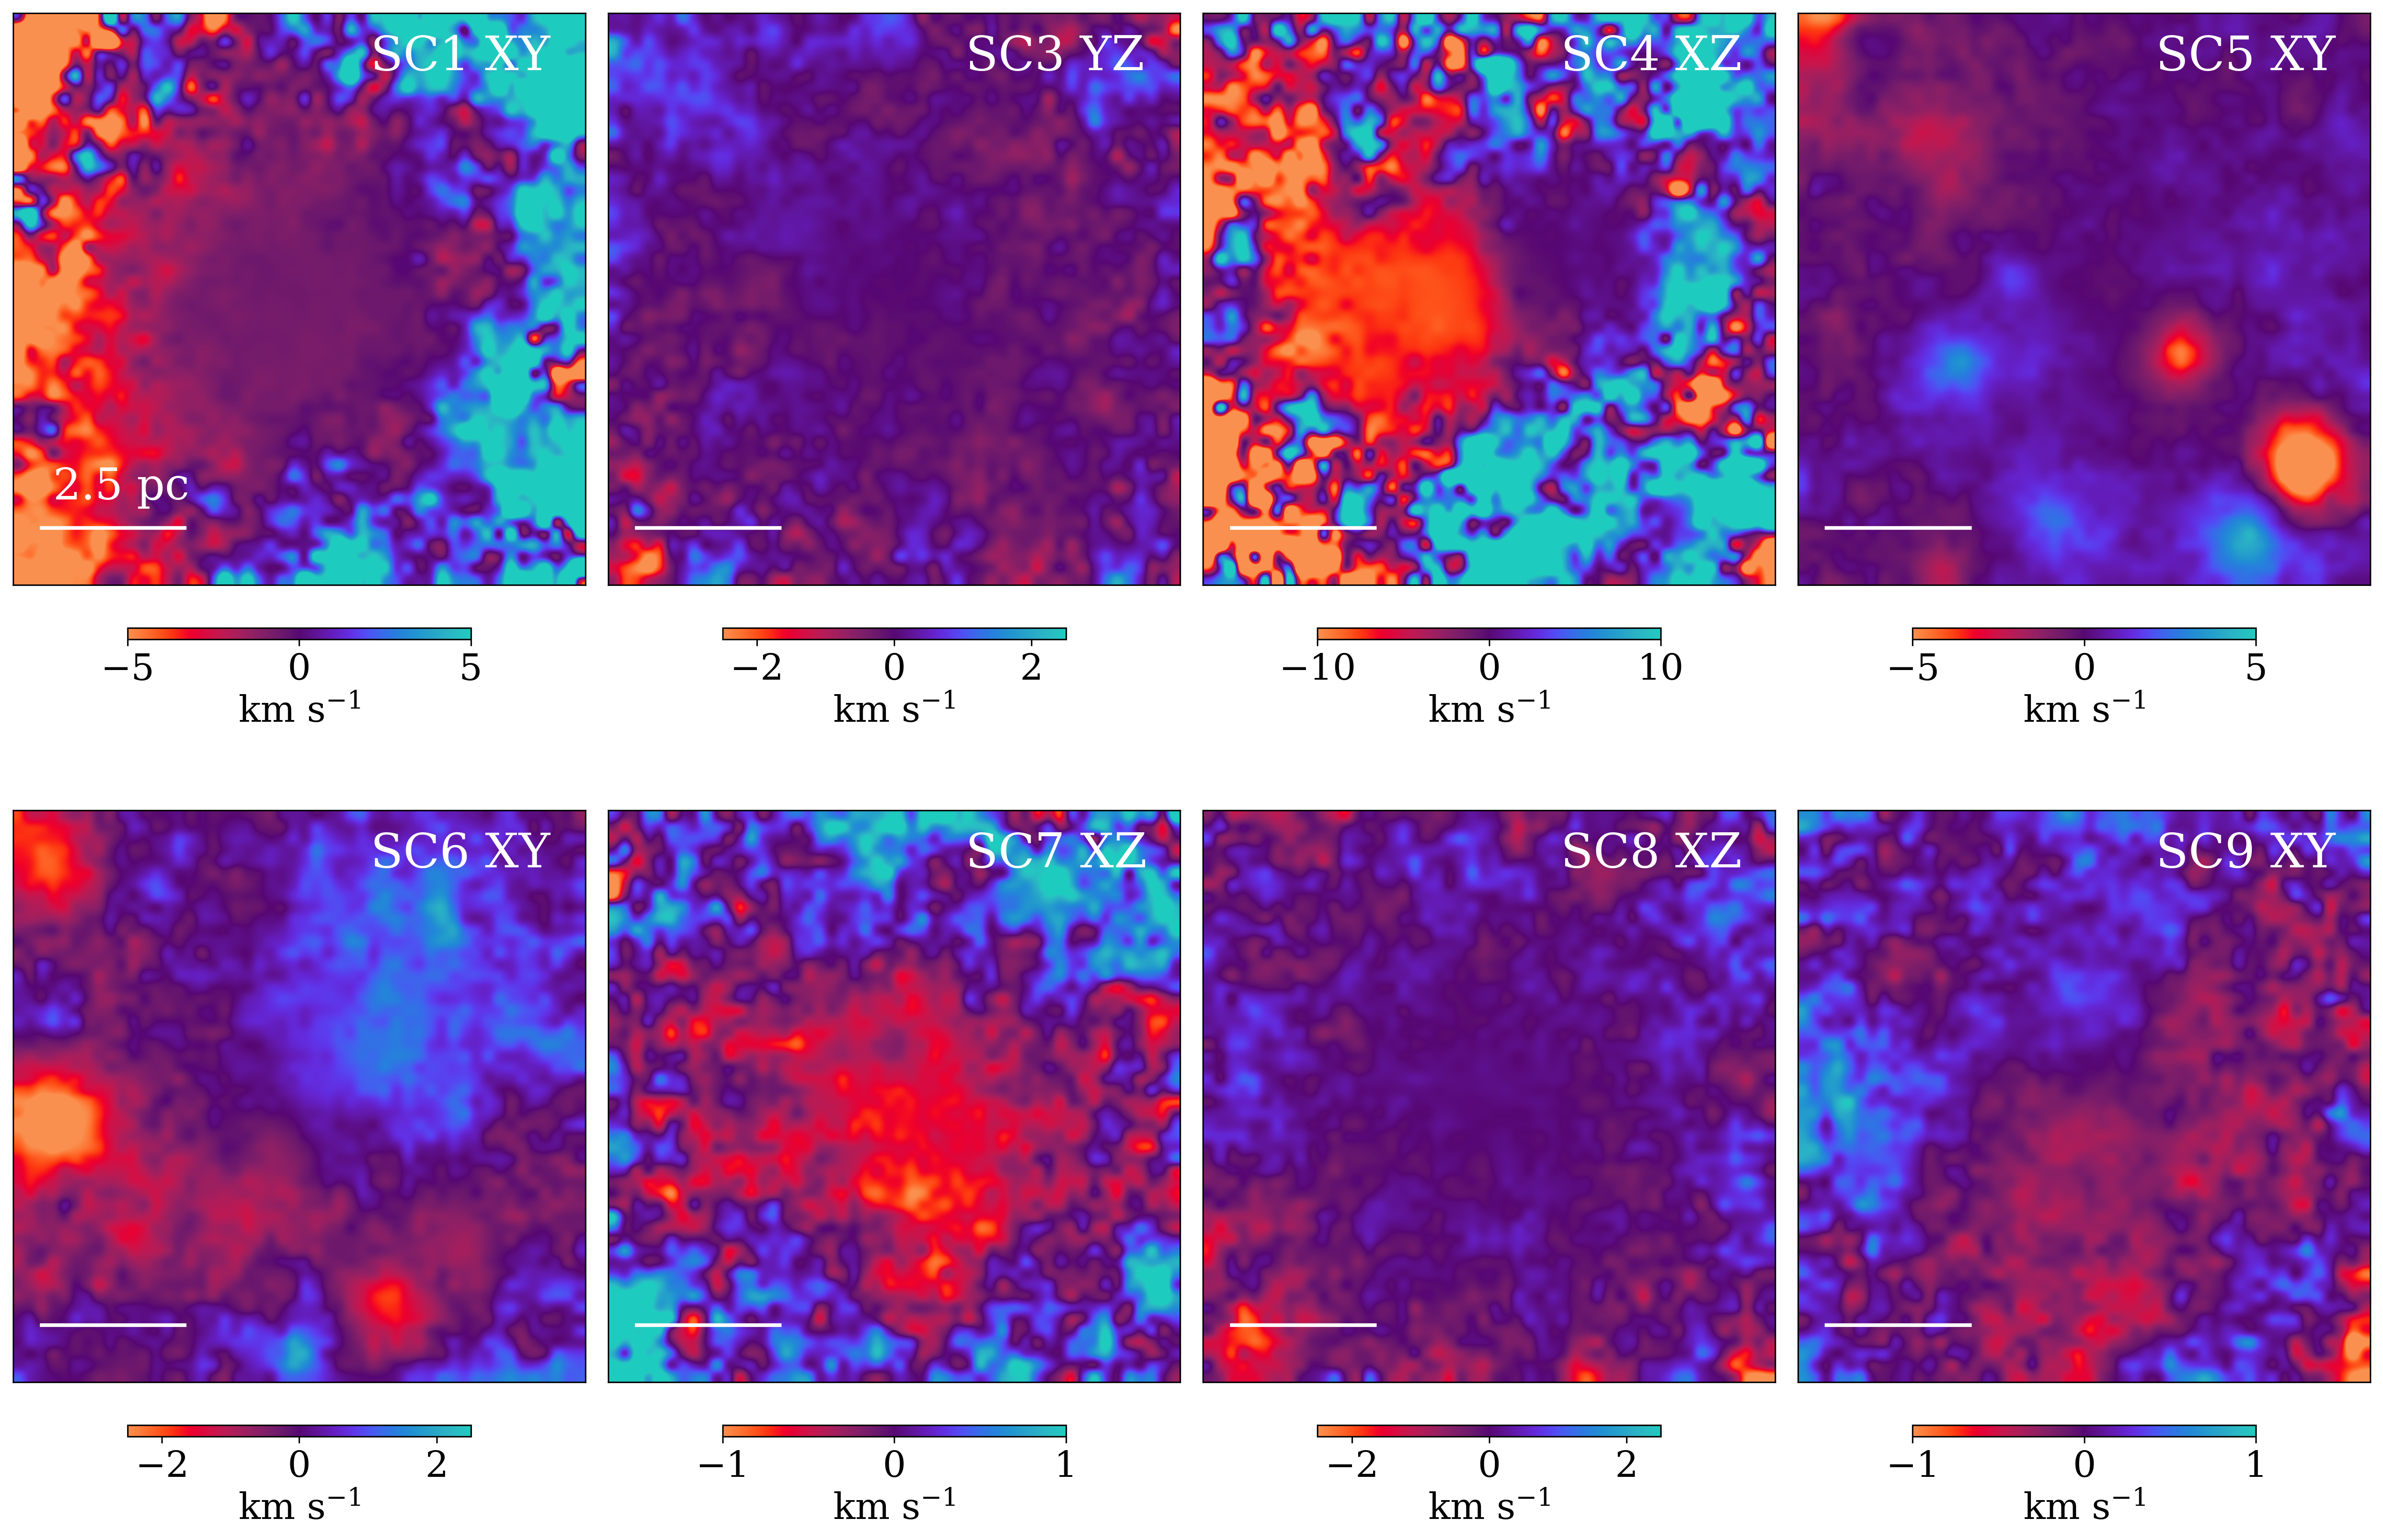
It was found that SCs with diverse internal structures and kinematics can be formed from GMCs with different masses and kinematics in the tidal interaction model T1. Fig. 8 summarizes the projected 2D mass distribution of new stars in the other eight SCs (SC2-9) formed in T1. SC3 shows a binary SC, and SC5 and SC6 show multiple SCs, however these observations are based of the projected distributions, as we did not investigate the mutual motions of these sub clusters. The clumpy nature of these clusters are due to the violent hierarchical merging of sub-clusters formed in their natal GMCs. Some sub-clusters cannot be totally destroyed during such merging events and can still stay in the outer parts of the central regions. These survived sub-cluster populations can form the clumpy distribution of stars around these SCs. Fig. 9 shows that the radial density profiles are significantly different between these 8 SCs, which can reflect the diverse formation histories and physical properties of their original GMCs. For example, the central density of the SCs range from 17.3 M⊙pc-3 to 650 M⊙pc-3. The flat outer profile is most common, as seen in SC2, SC3, SC6, SC7, SC8 and SC9. This shape is like that of SC1, implying a stellar envelope surrounding these clusters; a feature which has been observed around some galactic GCs (Kuzma et al. 2018), and some very young SCs in the LMC (Elson et al. 1987). Such diffuse stellar halos have not been so far observed in the older SCs in the LMC and the SMC, which implies that the outer halo has been lost by some physical processes such as tidal stripping by the two galaxies. Observationally, cluster memberships of these outer halos regions could be confirmed with high precision astrometry of these clusters’ outer regions using satellites such as Gaia (e.g. Gaia Collaboration et al. 2021). SC4 and SC5 may have most of these surrounding stars unbound, however this cannot be inferred from the profiles.
3.2.4 SC2-9 Kinematics
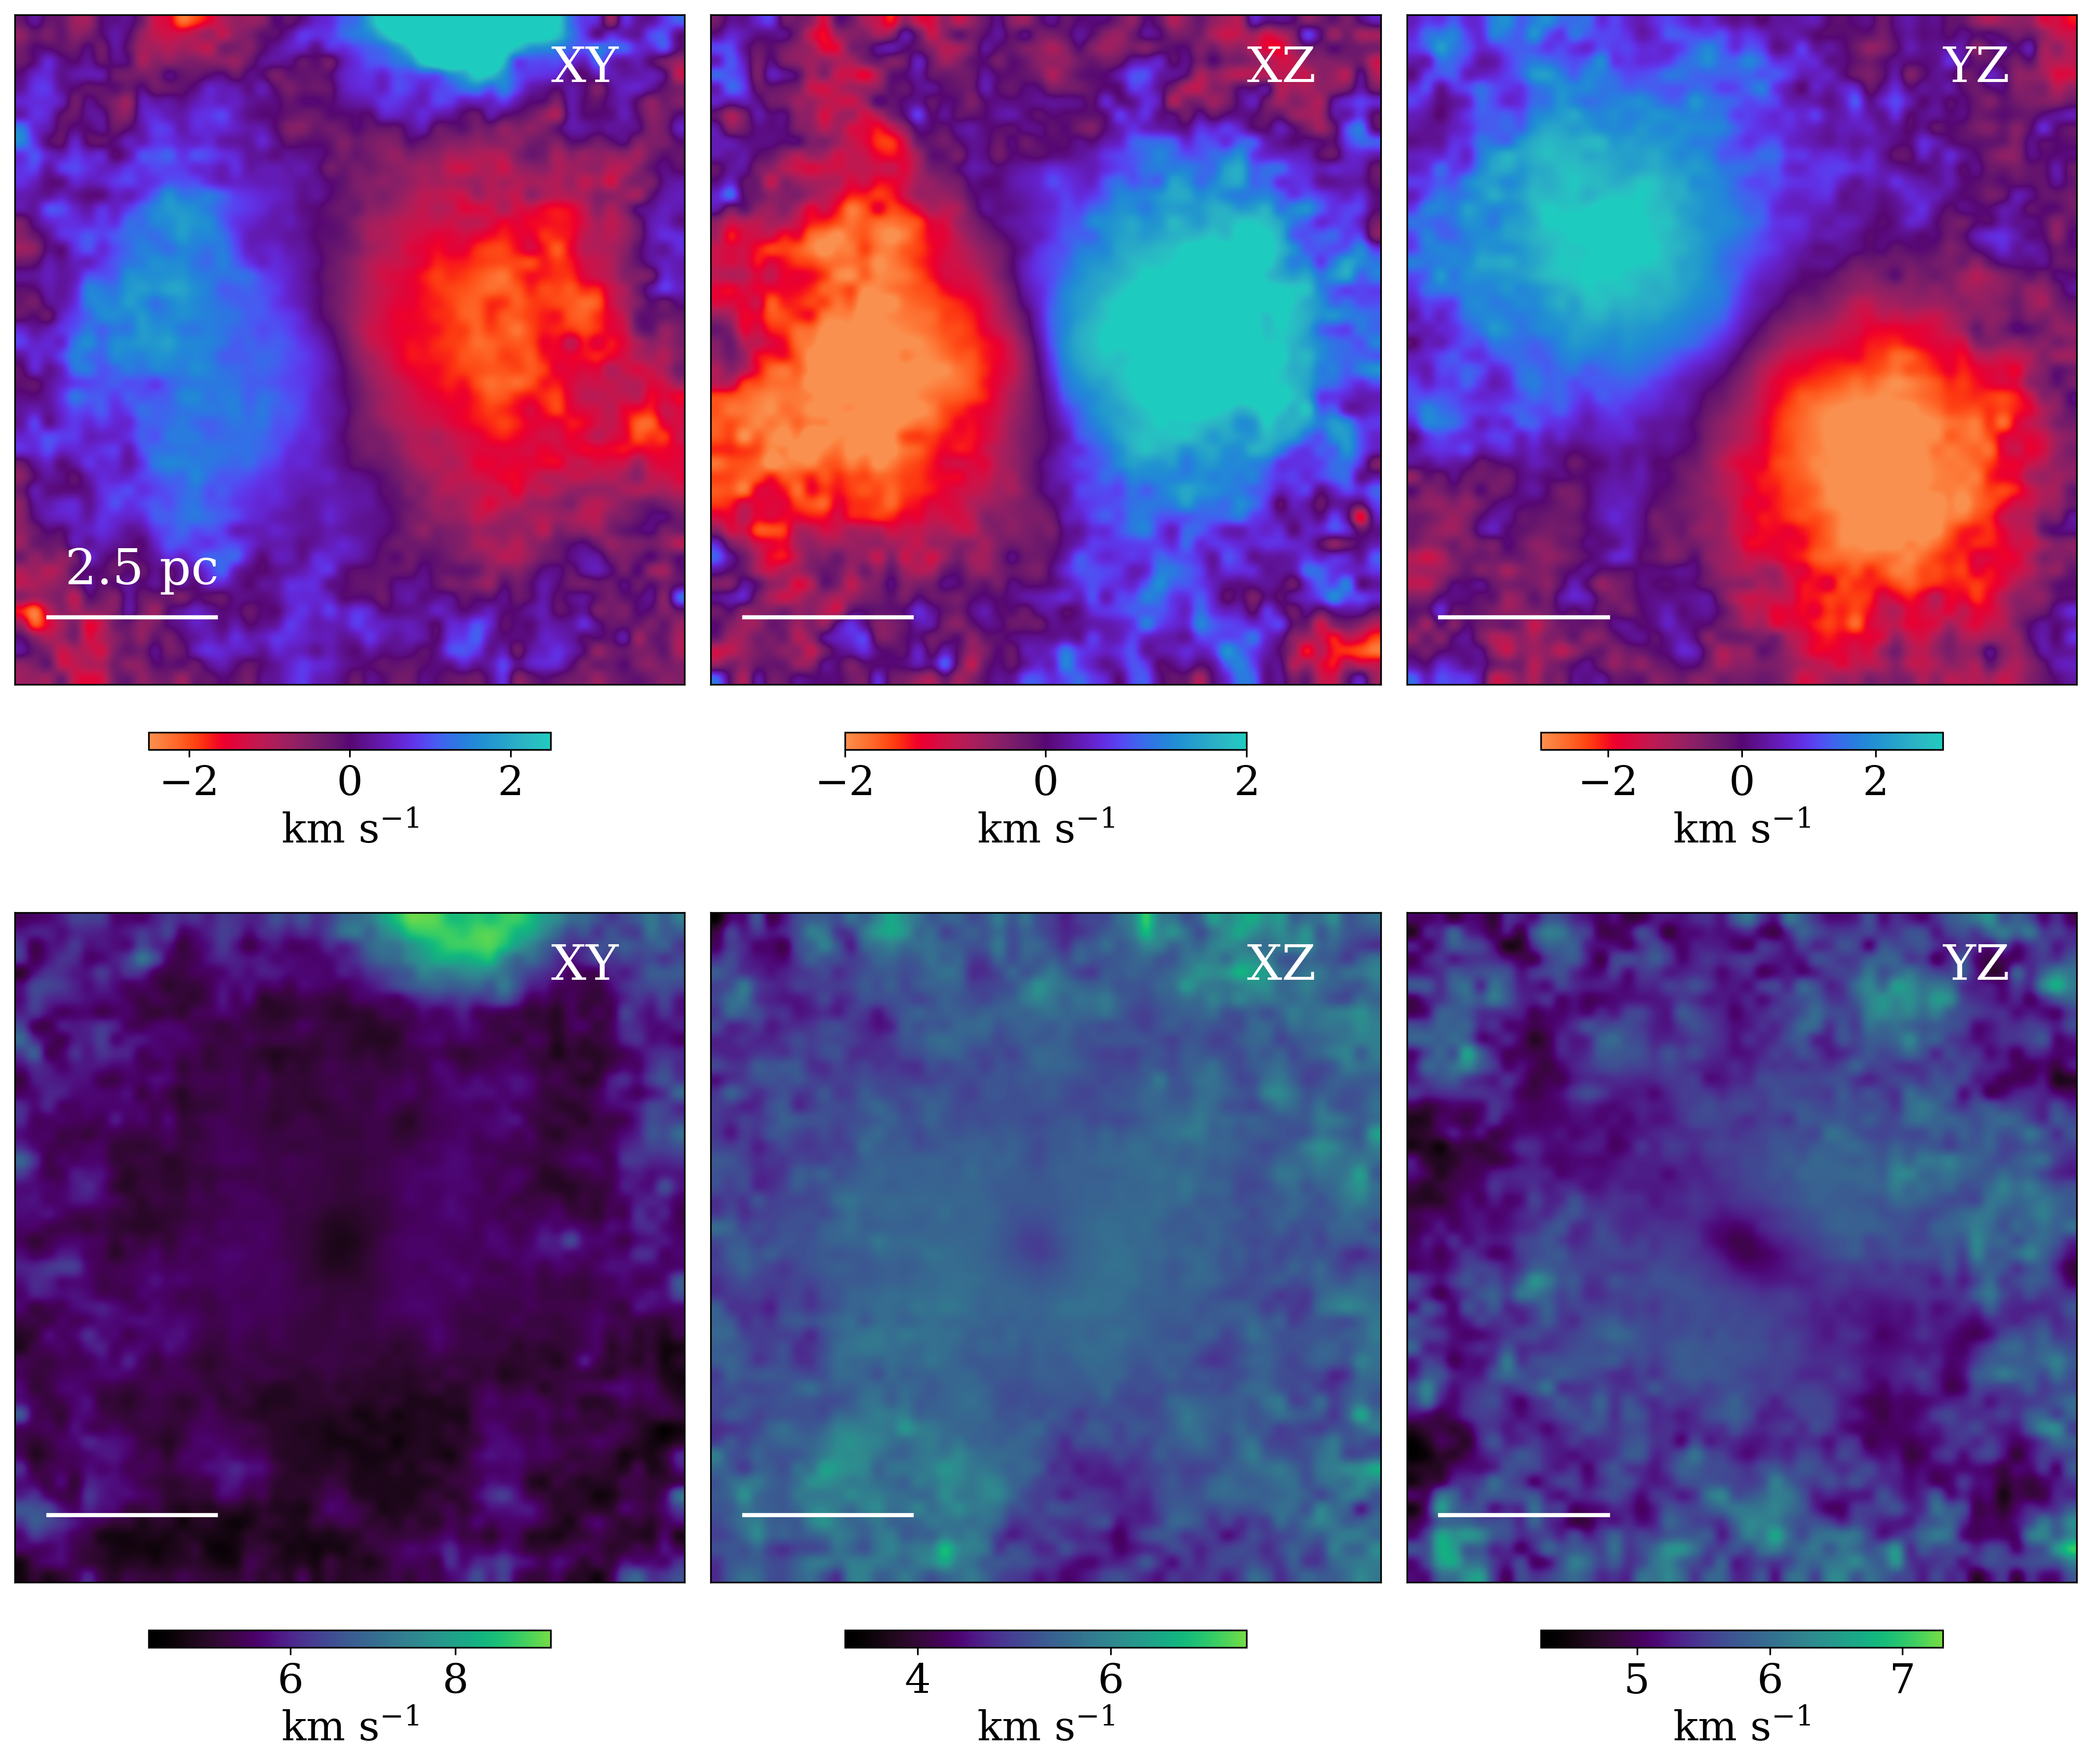
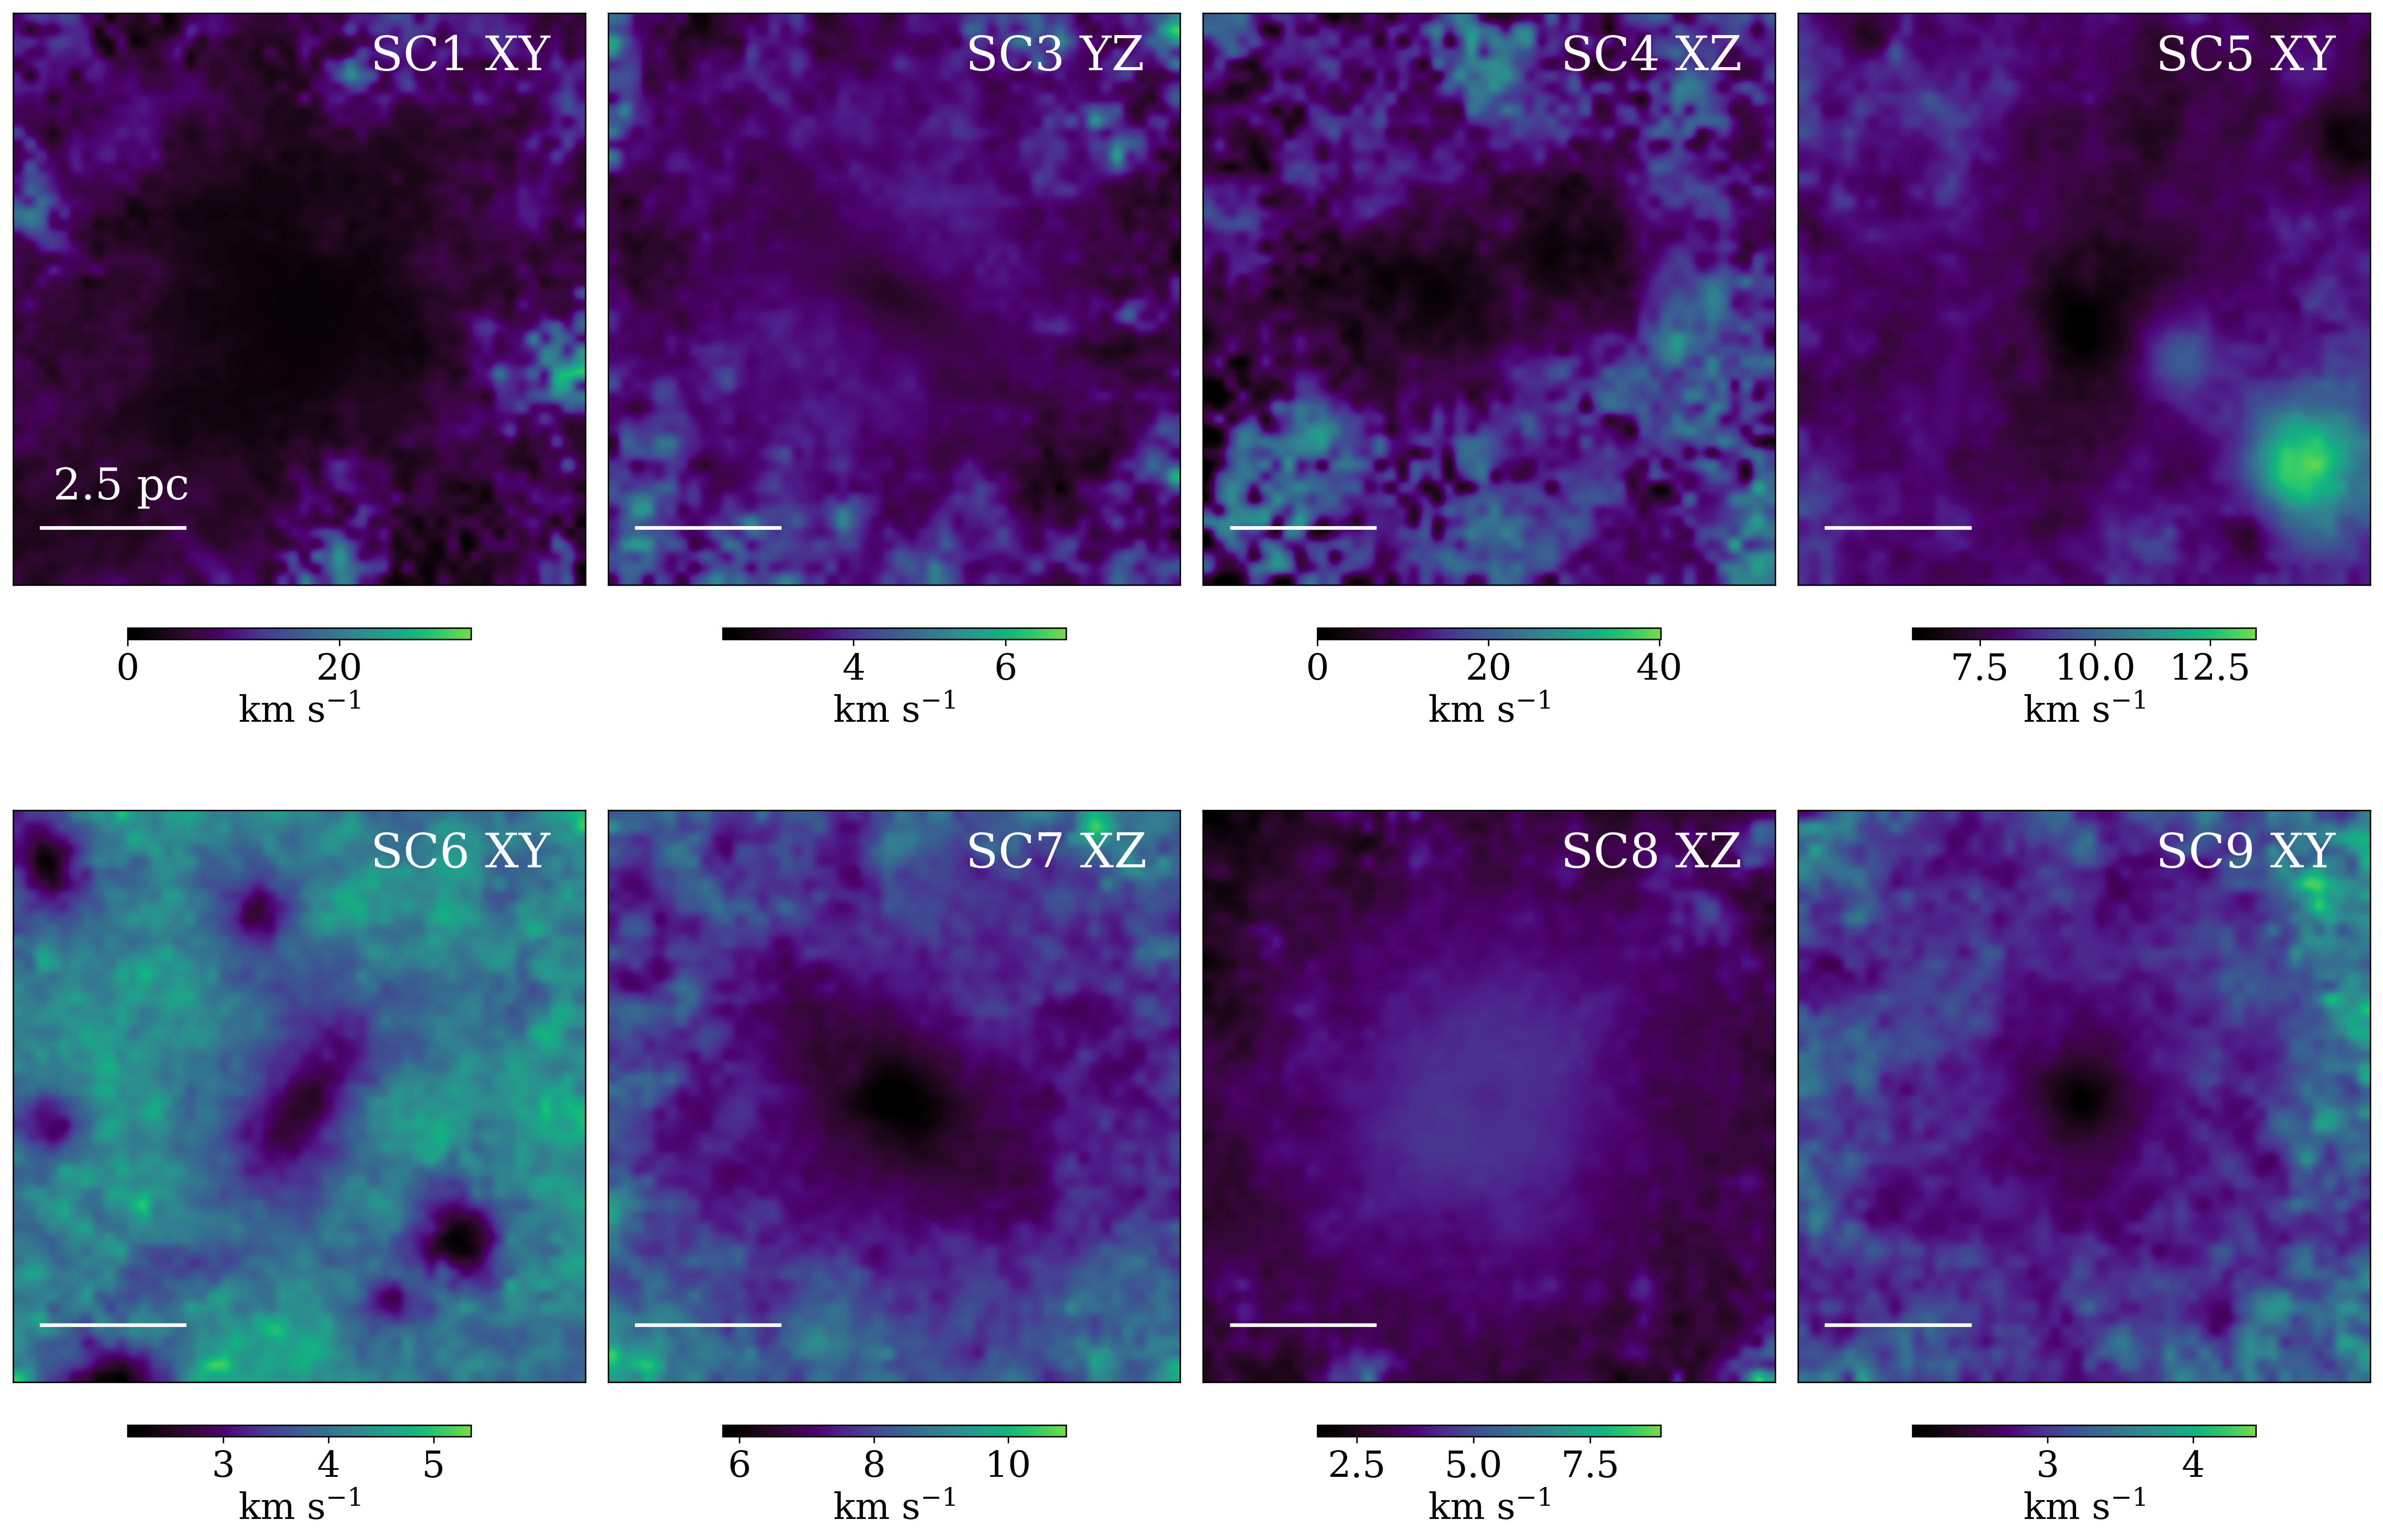
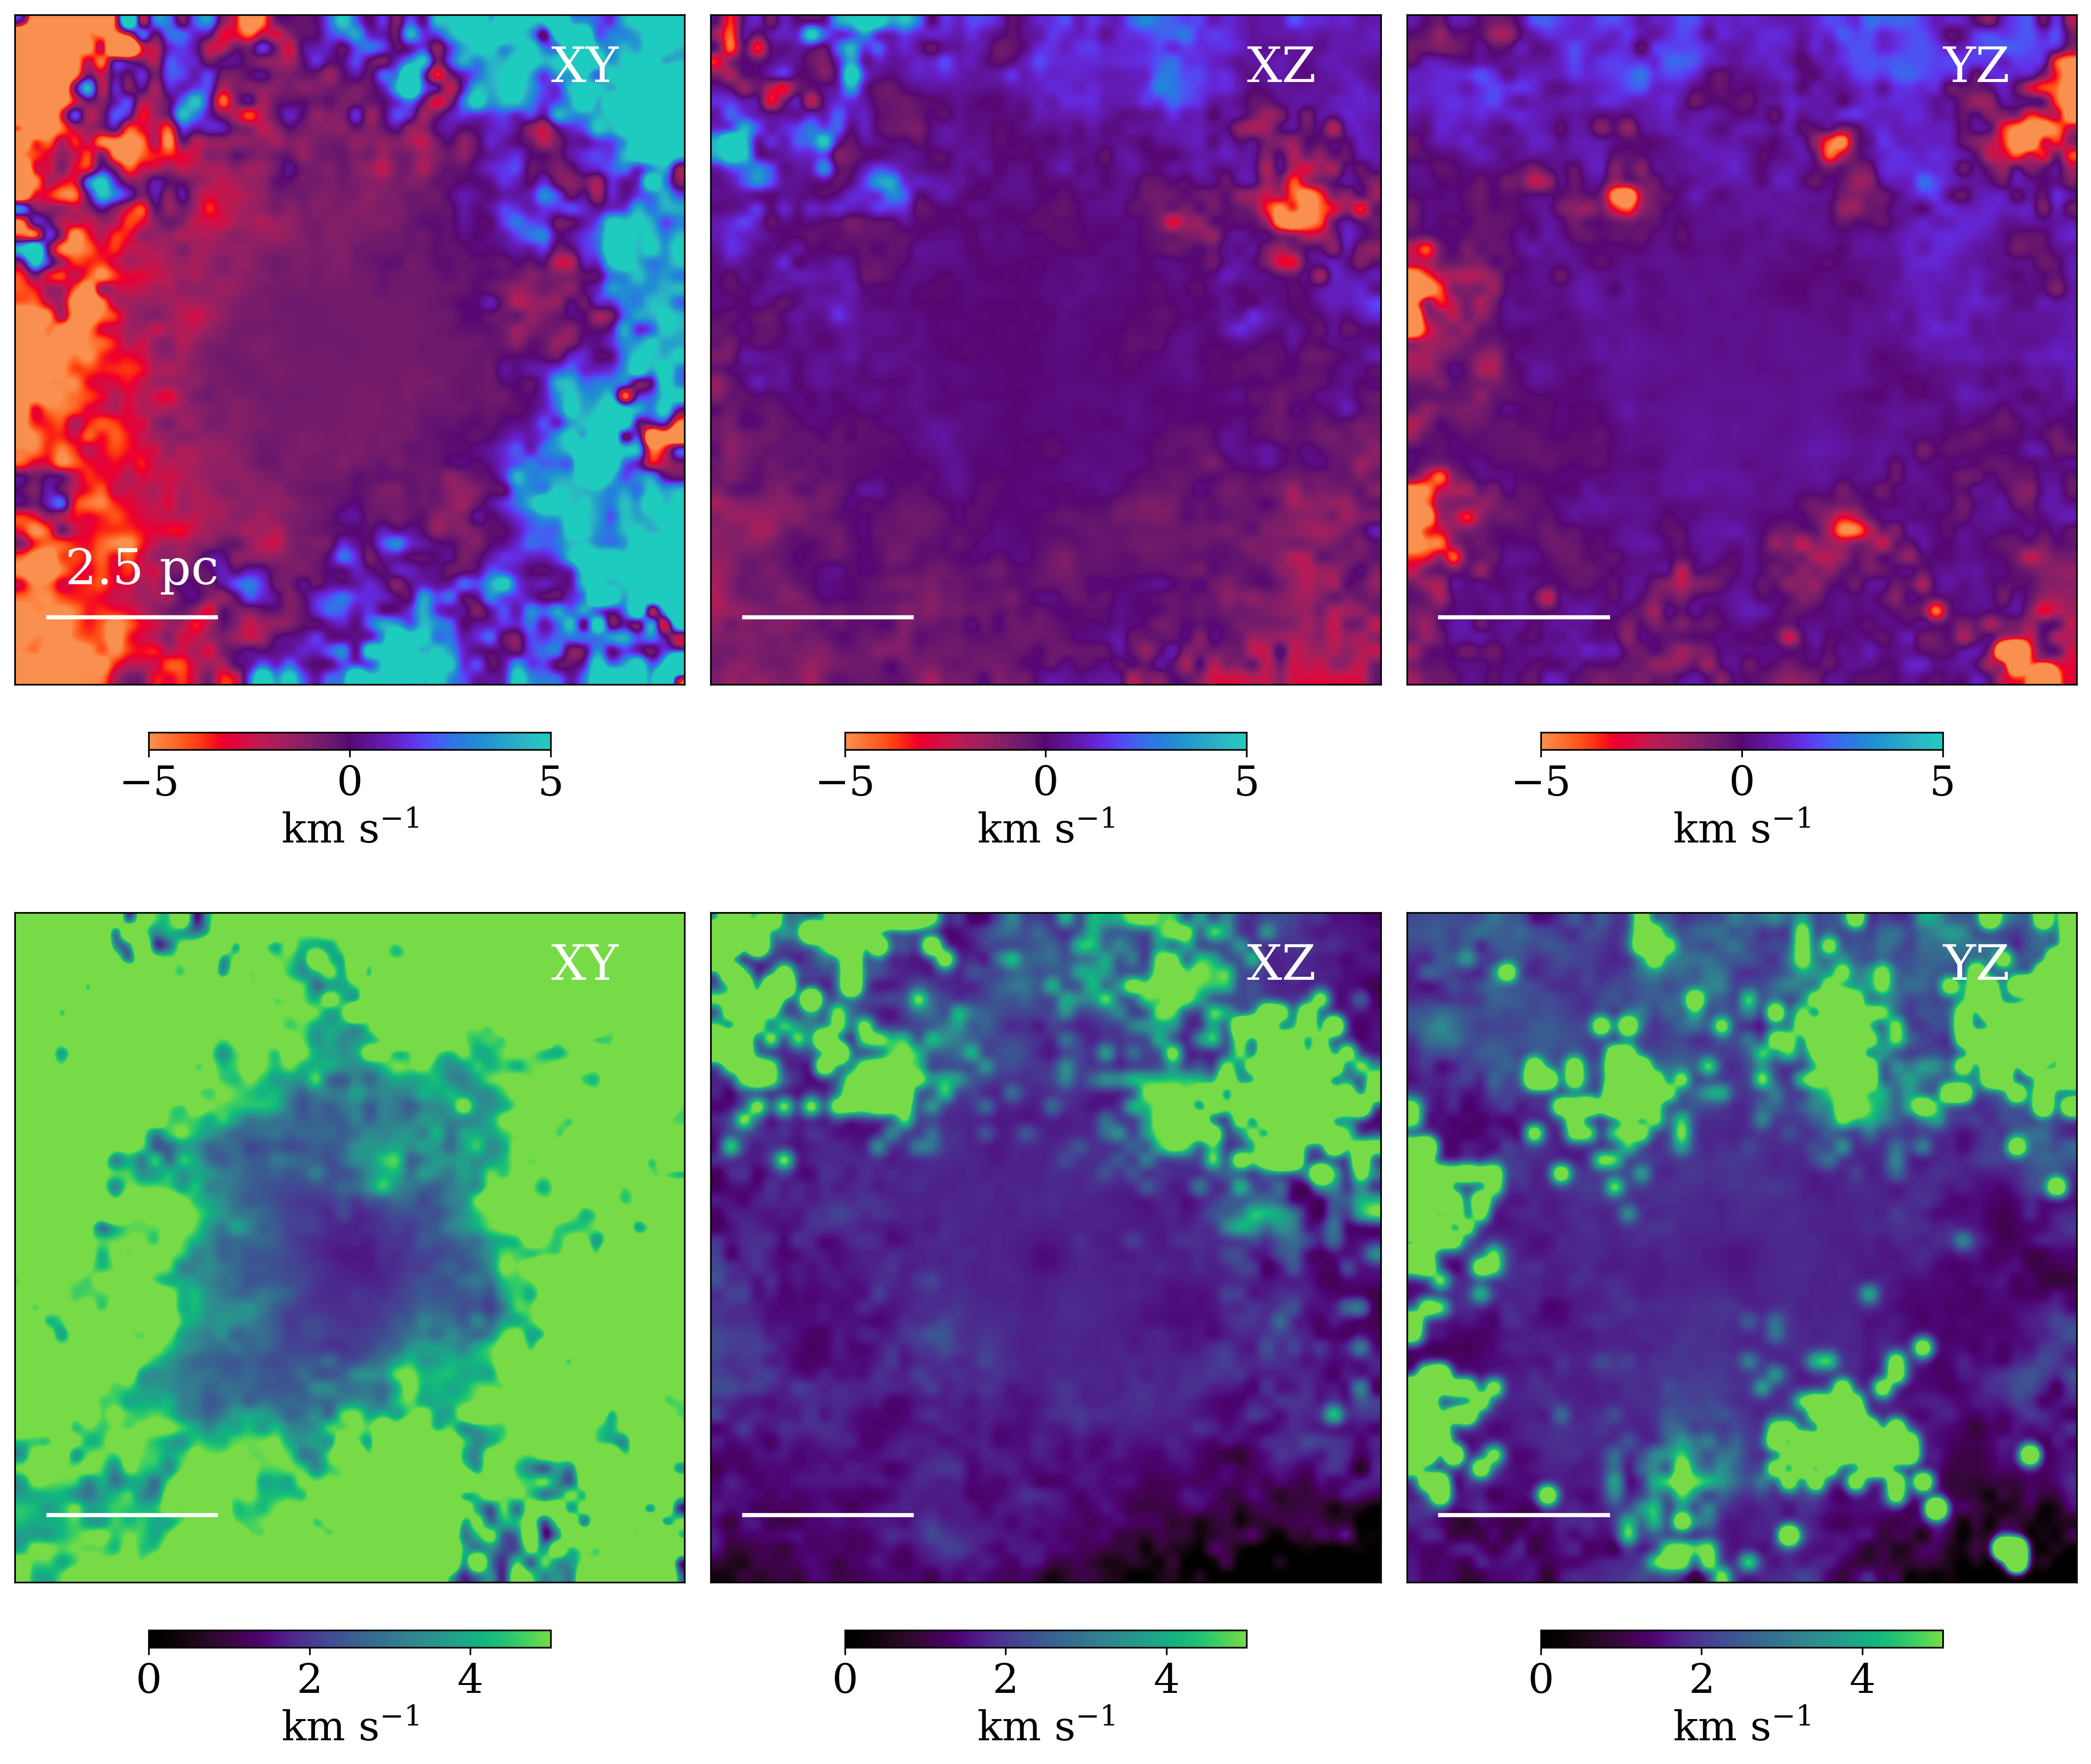
Two main properties of the clusters were investigated; their internal rotation and velocity dispersion. We first focus exclusively on the results of SC2, because it shows the most intriguing behaviour in stellar kinematics. SC2 shows very clearly global rotation in the 2D line-of-sight velocity maps projected onto the x-z and y-z planes (Fig. 10). The rotation amplitude can be as large as 9.2 kms-1, with rotation visible over -5 < < 5 pc, and the cluster looks like a flattened spheroid or a bar. These results suggest that this cluster is dynamically supported largely by rotation. This high amplitude of global rotation in this cluster would be due to the larger angular momentum of its parent GMC. During the hierarchical merging of sub clusters in the early formation phase of this cluster, the orbital angular momentum of these sub clusters (i.e., rotating around the mass centre of the GMC) is converted into the intrinsic angular momentum of the cluster. The 2D velocity dispersion map shows the central dip, which indicates that there is a dynamically cold stellar disk in the SC. This inner disk is formed during gas accretion onto the SC from the GMC. The lower velocity dispersion confirms that the SC is supported by rotation rather than random motion of stars. It should be stressed here that global internal rotation of stars can be readily identified in this SC owing to the strong rotation. However, it is difficult for the present study to clearly identify such global rotation in some SCs from their 2D maps of velocities, because the rotation amplitudes are significantly smaller compared to the velocity ranges of the 2D maps. This point is discussed in Appendix A, using the results of stellar kinematics derived for SC1.
In contrast SC3 does not show any clear rotation, which suggests that this SC has no or little global rotation within the central 5 pc. The total stellar mass of SC3 is by a factor of 3 times smaller than that of SC2, which implies a relation between SC masses and the amplitudes of global rotation. The velocity dispersion map for SC3 shows a cold flattened region (as shown in Fig. 12) that is formed from later gas accretion within the SC and the subsequent star formation in a disk-like central region. It is beyond the scope of this paper how the flattened velocity dispersion map evolves with time due to long-term effects of two-body relaxation.
SC4 is a binary SC, and each of the two smaller SCs does not show any internal rotational stellar kinematics, only their rotation around each other (Fig. 11). SC5 has no noticeable features, besides its formation being later in the simulation, as evident by the range in line-of-sight velocity dispersion from 6.0 km s-1 to 23.1 km s-1. This shows the regions where gas particles are formed into many new stars. SC6 and SC9 show internal rotation with a small amplitude in the x-y plane, though the SC6 2D velocity map appears to quite irregular and clumpy. The 2D velocity dispersion map of SC6 also shows a flattened shape in its central region, which is due to efficient star formation in the central cold gas disk later formed in the forming GC. SC7 and SC8 have no internal rotation, however SC7 and SC9 do have a central region with very low dispersion velocity, showing a cold central region. These structures are in agreement with observations, noted in Bekki & Chiba (2009), suggesting SMC clusters could be barred and have central rotation.
4 Discussion
4.1 Is LMC-SMC interaction the best mechanism for the enhanced SC formation ?
As observed by Rafelski & Zaritsky (2005), there is more than one peak of SC formation. The peak from Gyr onward (e.g., Grebel et al. 1999, Glatt et al. 2010, Bitsakis et al. 2018) is furthermore consistent with an interaction between the MCs (e.g., Bekki & Chiba 2009). However whether this was a tidal interaction or a collision is not agreed upon. Bitsakis et al. (2018) investigated the age distributions of 1319 SCs in the SMC and suggested that a direct collision Myr ago would create the desired peak in SCs. They also proposed that such a recent LMC-SMC collision can explain the observed kinematics of the LMC stars that were suggested to be from the SMC (Olsen et al. 2011). This would also explain the higher enhancement factor, as Knapen & Querejeta (2015) mentions mergers increase SFR the most. However, tidal interactions would enhance SC formation even without a collision (Bekki et al. 2004), hence making our research relevant and potentially applicable regardless. In addition, there are also more papers suggesting this interaction would solely be a close encounter creating tidal interactions (e.g., Grebel et al. 1999; Glatt et al. 2010; Nayak et al. 2018), suggesting that this epoch of enhanced SC formation could also be from a tidal interaction, though this must be further investigated.
Another peak worth investigating from Rafelski & Zaritsky (2005) is the peak at Gyr ago for Z in Fig. 5 of their paper. This is approximately the same size as the Gyr peak, suggesting this could also be due to tidal interactions. Observationally, it might be very difficult to clearly distinguish between 2 Gyr and 2.5 Gyr stellar populations of SCs from color-magnitude diagram alone, despite them suggesting both a 2 Gyr and 2.5 Gyr peak. It would be possible that these two are indeed from a same burst population. Furthermore, two LMC-SMC interactions within 0.5 Gyr requires a strongly bound LMC-SMC orbit, which is not predicted by previous simulations of the LMC-SMC-MW interaction (Gardiner & Noguchi 1996, Besla et al. 2012). We therefore consider that the two peak populations are likely to originate from a same starburst about 2 Gyr ago.
4.2 Internal rotation of young SCs in the SMC
We have shown, for the first time, that the young SMC SCs can have internal rotation just after their formation from their natal GMCs. Although this is one key prediction from the present simulation, almost all recent studies of SCs have investigated the internal kinematics of stars in the old Galactic GCs (e.g., Barth et al. 2020; Kamann et al. 2020; Szigeti et al. 2021). Accordingly, it is not possible for the present study to discuss the physical origin of the simulated rotational kinematics of some SCs based on the latest observations of SCs in the SMC. Mackey et al. (2013) investigated the radial velocities of 21 stars in the LMC SC NGC 1846 and found a clear systematic rotation comparable to the velocity dispersion in this SC. Given the observed young age of this SC, it is likely that this SC initially had such clear rotation at its birth. Although this is not a result for the SMC SCs, this observation implies that other young SCs in the LMC and the SMC might have such global rotation within their stars.
Previous numerical simulations of SC formation on galaxy-scale and GMC-scale showed that SCs can have rotational kinematics just after their formation (e.g., Bekki 2010; Bekki 2019; Mapelli 2017). Although the long-term evolution of SCs with such rotational kinematics driven by two-body dynamical relaxation have been investigated by recent N-body simulations (e.g., Mastrobuono-Battisti & Perets 2016; Vesperini et al. 2021), it is not fully understood how the rotational amplitudes of SCs can decrease due to dynamical evolution of compact stellar systems. The tidal field of the SMC and the tidal interaction of SCs with massive GMCs in the SMC can possibly influence the dynamical evolution of rotating stellar systems: it is possible that the 2 Gyr old SMC SCs do not clearly show large amplitudes of rotation even if they had at their birth, because the later long-term dynamical effects can dramatically decrease the original rotation of SCs. It is thus our future study to investigate the time evolution of stellar kinematics of SCs with initial rotation using an appropriate simulation code that implements both two-body stellar interactions and the (galaxy-scale) tidal effects by the SMC and its GMCs.
4.3 Origin of sizes and masses of the SMC SCs
Bitsakis et al. (2018) calculates the mean SC half-mass radius in the SMC as pc using the measured distance modulus, with a minimum of pc and a maximum of pc. In comparison, the SCs discussed by Boutloukos & Lamers (2003) from visual inspection of photographic plates have a mean half-mass radius of pc, with a range from to pc. The SCs we simulated have a half-mass radii range of pc from visual inspection. These values fall below both the range from Boutloukos & Lamers (2003) and Bitsakis et al. (2018). However further improvements must be made to our model to comment on the star formation fully, such as including more realistic feedback effects from massive stars with different masses (including supernovae), the statistical properties of SCs and the distribution of SCs within the SMC.
Observed SCs in the SMC have shown a correlation between their age and mass (e.g., Piatti 2021). Piatti (2021) also notes that smaller and younger clusters are found in the centre of the SMC. This aligns with our clusters being smaller than observed GCs with masses of (Hill & Zaritsky 2006).
The SMC hosts one old, Galactic-like GC; NGC121. This cluster shows evidence of multiple stellar populations (Dalessandro et al. 2016) and has a mass of (Mackey & Gilmore 2003). However, due to its old age of 11 Gyr (Glatt et al. 2008), we expect that it must have experienced some mass loss during its evolution and therefore, its initial mass must have been much higher. As our initial SC masses are smaller than the current mass of NGC121 (i.e. see Table 3) and we do not evolve our system long enough to test for cluster stripping and mass loss, we do not believe our SCs are large enough to be GCs.
Alternatively, our clusters cannot be classified as OCs, as OCs have a mass of , while our clusters are much larger than this. Hence, we can classify our clusters as massive star clusters. These clusters have been observed in Piatti (2021), as having ages around yr old, and masses of .
4.4 Formation of a molecular gas ring in the SMC
Since our chemodynamical models include the formation of molecular hydrogen on dust grains, we can investigate the time evolution of the spatial distribution of molecular hydrogen in the SMC in the present study. Fig. 13 shows that the intense LMC-SMC tidal interaction can form a ring-like distribution of molecular hydrogen between T=0.14 and 0.28 Gyr. Furthermore, a number of high-density small clumps, which corresponds to GMCs, can be seen in the ring: it is highly likely that star formation can proceed efficiently in the clumps. Such high-density clumps can be seen in the two tidal tails formed during the LMC-SMC interaction at T=0.42 and 0.56 Gyr too. Such an inhomogeneous
and clumpy distribution of molecular hydrogen disappears after the tidal interaction at T=0.85 Gyr, however, the SMC can finally have compact
molecular gas distribution with higher average gas density. This compact distribution is responsible for the constantly higher SFR in the SMC after the LMC-SMC tidal interaction.
The simulated ring-like distribution can be discussed in the context of the observed ring-like distribution of stellar populations with ages ranging from 1.6 Gyr to 2.5 Gyr (Harris &
Zaritsky 2004, HZ04)
as follows. The simulated high-density molecular ring should be the place where star formation is very efficient, because SFR
is proportional to molecular gas density. Therefore, it is highly likely that the molecular ring ends up with the ring consisting of new stars only. If the ring-like distribution of new stars cannot be destroyed by the later LMC-SMC collision ( Gyr) that formed the Magellanic Bridge (Diaz &
Bekki 2012), then the ring-like structure should be able to be observed in the present SMC.
In the present study, we have only modelled the LMC-SMC interaction about 2 Gyr ago (not 0.2 Gyr ago), hence it is unclear whether or not the possible ring with 2 Gyr old stellar populations could survive during the violent dynamical heating of the SMC disk by the last LMC-SMC collision (0.2 Gyr). It is hence planned that future studies will investigate this issue using hydrodynamical simulations for the long term (more than 3 Gyr) dynamical evolution of the LMC-SMC system.
4.5 Future works: from SC formation to long-term evolution
We have found, for the first time, that some of the simulated SCs have diffuse stellar envelopes surrounding the main bodies, flattened inner structures, global rotation, and sub-structures in the halos at their birth. These structures can evolve significantly with time due to two body dynamical relaxation effects. However, we have not investigated the long term evolution of SCs (>1 Gyr) after their formation in the SMC. This means that we cannot discuss a number of key issues related to the origin of SCs in the present study.
For example, it is not possible for the present study to investigate how the binary status of the simulated SCs can evolve over the next 2 Gyr (to the present time); will they merge to form a single SC, or not. We also cannot comment on how the simulated rotation can be less remarkable due to the two-body dynamical relaxation effects, and whether or not ISM can be accreted onto the new SCs to form new SCs, as discussed in recent papers (e.g., McKenzie & Bekki 2021a). We need to improve our modeling in star formation within GMCs, including more realistic feedback effects from massive stars with different masses (including supernovae). Furthermore, we need to address other issues on SC formation in the SMC, which we do not discuss at all in this paper, such as the statistical properties of SCs (e.g., mass function) and the distribution of SCs within the SMC.
5 Conclusions
The observed burst of SC formation in the SMC 2 Gyr ago is one of the major problems in SC evolution in the SMC and LMC. In order to understand the physical origin of this, we have investigated the effects of tidal interactions between the SMC and LMC on SC formation Gyr ago using our new numerical simulations with formation of GMCs and a two-stage SC formation model. We have also investigated, for the first time, the details of the internal structures and kinematics of the simulated SCs, such as 2D maps of velocities and velocity dispersions, in the SMC. Our findings were as follows:
-
(1)
Tidal compression of cold molecular hydrogen induced by LMC-SMC interaction about 2 Gyr ago is the main physical reason for the formation of massive gas clouds (GMCs). The tidal LMC-SMC interaction significantly impacts the mass function of GMCs when compared to the isolated model. There is a three times enhancement of meshes with mass over M⊙ in the final time step of the tidal model compared to the isolated model.
-
(2)
Such GMCs can be formed in a number of LMC-SMC tidal interaction models, though the mass function of GMCs depends on the model parameters for the SMC orbits with respect to the LMC. The simulated massive and compact GMCs can be the major formation sites of SCs due to their high gas densities. These SC-hosting GMCs are mostly formed in the central region of the SMC in the present tidal interaction models.
-
(3)
SCs have lower mass densities, with the average of all investigated SCs being 78 M⊙pc-3, which is comparable to those of the SMC or LMC SCs, but too low compared to those of the Galactic old GCs.
-
(4)
The structures of SCs are quite diverse, ranging from single SCs, to binary SCs, to multiple systems. The dynamically young SCs have stellar envelopes and sub structures around them in all models, which are not very similar to the fully developed older SCs in the SMC. The radial density profiles show the outer flatter component (corresponding to the stellar envelopes), which are similar to the observational results by Elson et al. (1987), which shows the projected density profiles with flatter outer parts compared to the truncated King model. These results imply that long-term dynamical evolution can shape up the dynamically young SCs.
-
(5)
The 2D maps of line-of-sight velocities and velocity dispersion in the simulated SCs are also diverse, which provide important implications about the SC formation (for future observations of SC kinematics). One of the simulated SCs has a colder inner disk and barred centre with clear rotation, with the rotation maximum and minimum velocities as 9.2 km s-1 and -5.4 km s-1 respectively. Other SCs do not show clear internal rotation (having rotational amplitudes of less than 2 km s-1). Binary SCs can be formed from a single GMC in some models. Dynamically cold central regions (indicated by lower central velocity dispersion) can be formed from later gas accretion of gas in forming SCs. Flattened shapes in 2D velocity dispersions, which are due to anisotropy of velocity dispersions, can be found in some models.
-
(6)
These characteristic internal structures and kinematics such as stellar halos, global rotation, and flattened velocity dispersion maps in the simulated young massive star clusters can evolve with time owing to the dynamical evolution of SCs through two-body stellar encounters within a few Gyr. However, this important long-term dynamical evolution of SCs is yet to be investigated in the present study, because the adopted simulation code does not allow us to investigate the two-body relaxation effects. It is thus our future study to investigate how such long-term dynamical evolution can change the internal structures and kinematics of young SCs in the SMC over a few Gyr.
Acknowledgements
We would like to thank the anonymous referee for their kind feedback. This study would not have been possible without the ICRAR Summer Studentship program in 2020-2021. This study made use of the PYTHON packages NUMPY (Van Der Walt et al., 2011), SCIPY (Virtanen et al., 2020) and MATPLOTLIB (Hunter, 2007). Our numerical simulations were run on the OzSTAR GPU supercomputer kindly made available to us at the Centre for Astrophysics and Supercomputing at the Swinburne University of Technology.
Data Availability
The data underlying this article will be shared on reasonable request to the corresponding author.
References
- Armstrong et al. (2018) Armstrong B., For B. Q., Bekki K., 2018, MNRAS, 481, 3651
- Barth et al. (2020) Barth N. A., Gerber J. M., Boberg O. M., Friel E. D., Vesperini E., 2020, MNRAS, 494, 4548
- Baumgardt et al. (2013) Baumgardt H., Parmentier G., Anders P., Grebel E. K., 2013, MNRAS, 430, 676
- Bekki (2010) Bekki K., 2010, ApJ, 724, L99
- Bekki (2013) Bekki K., 2013, Monthly Notices of the Royal Astronomical Society, 432, 2298–2323
- Bekki (2015) Bekki K., 2015, Monthly Notices of the Royal Astronomical Society, 449, 1625–1649
- Bekki (2019) Bekki K., 2019, A&A, 622, A53
- Bekki & Chiba (2005) Bekki K., Chiba M., 2005, MNRAS, 356, 680
- Bekki & Chiba (2007a) Bekki K., Chiba M., 2007a, Publ. Astron. Soc. Australia, 24, 21
- Bekki & Chiba (2007b) Bekki K., Chiba M., 2007b, MNRAS, 381, L16
- Bekki & Chiba (2008) Bekki K., Chiba M., 2008, The Astrophysical Journal, 679, L89–L92
- Bekki & Chiba (2009) Bekki K., Chiba M., 2009, Publ. Astron. Soc. Australia, 26, 48
- Bekki & Mackey (2009) Bekki K., Mackey A. D., 2009, MNRAS, 394, 124
- Bekki & Stanimirović (2009) Bekki K., Stanimirović S., 2009, Monthly Notices of the Royal Astronomical Society, 395, 342
- Bekki et al. (2004) Bekki K., Beasley M. A., Forbes D. A., Couch W. J., 2004, ApJ, 602, 730
- Bergvall et al. (2003) Bergvall N., Laurikainen E., Aalto S., 2003, A&A, 405, 31
- Besla et al. (2012) Besla G., Kallivayalil N., Hernquist L., van der Marel R. P., Cox T. J., Kereš D., 2012, MNRAS, 421, 2109
- Bianchini et al. (2018) Bianchini P., van der Marel R. P., del Pino A., Watkins L. L., Bellini A., Fardal M. A., Libralato M., Sills A., 2018, Monthly Notices of the Royal Astronomical Society, 481, 2125–2139
- Bica et al. (2020) Bica E., Westera P., Kerber L. d. O., Dias B., Maia F., Santos João F. C. J., Barbuy B., Oliveira R. A. P., 2020, AJ, 159, 82
- Bitsakis et al. (2018) Bitsakis T., González-Lópezlira R. A., Bonfini P., Bruzual G., Maravelias G., Zaritsky D., Charlot S., Ramírez-Siordia V. H., 2018, The Astrophysical Journal, 853
- Boutloukos & Lamers (2003) Boutloukos S. G., Lamers H. J. G. L. M., 2003, MNRAS, 338, 717
- Chiosi et al. (2006) Chiosi E., Vallenari A., Held E. V., Rizzi L., Moretti A., 2006, A&A, 452, 179
- Choudhury et al. (2018) Choudhury S., Subramaniam A., Cole A. A., Sohn Y. J., 2018, MNRAS, 475, 4279
- Cullinane et al. (2021) Cullinane L. R., Mackey A. D., Da Costa G. S., Erkal D., Koposov S. E., Belokurov V., 2021, arXiv e-prints, p. arXiv:2106.03274
- D’Onghia & Fox (2016) D’Onghia E., Fox A. J., 2016, ARA&A, 54, 363
- Da Costa (1991) Da Costa G. S., 1991, in Haynes R., Milne D., eds, Vol. 148, The Magellanic Clouds. p. 183
- Da Costa (2002) Da Costa G. S., 2002, in Geisler D. P., Grebel E. K., Minniti D., eds, Vol. 207, Extragalactic Star Clusters. p. 83 (arXiv:astro-ph/0106122)
- Dalessandro et al. (2016) Dalessandro E., Lapenna E., Mucciarelli A., Origlia L., Ferraro F. R., Lanzoni B., 2016, ApJ, 829, 77
- Dias et al. (2016) Dias B., Kerber L., Barbuy B., Bica E., Ortolani S., 2016, A&A, 591, A11
- Diaz & Bekki (2012) Diaz J. D., Bekki K., 2012, The Astrophysical Journal, 750, 36
- Elson et al. (1987) Elson R. A. W., Fall S. M., Freeman K. C., 1987, ApJ, 323, 54
- Erkal & Belokurov (2020) Erkal D., Belokurov V. A., 2020, MNRAS, 495, 2554
- Erkal et al. (2019) Erkal D., et al., 2019, MNRAS, 487, 2685
- Gaia Collaboration et al. (2021) Gaia Collaboration et al., 2021, A&A, 649, A7
- Gardiner & Noguchi (1996) Gardiner L. T., Noguchi M., 1996, MNRAS, 278, 191
- Glatt et al. (2008) Glatt K., et al., 2008, AJ, 135, 1106
- Glatt et al. (2010) Glatt K., Grebel E. K., Koch A., 2010, A&A, 517, A50
- Grebel et al. (1999) Grebel E. K., Zaritsky D., Harris J., Thompson I., 1999, in Chu Y. H., Suntzeff N., Hesser J., Bohlender D., eds, Vol. 190, New Views of the Magellanic Clouds. p. 405
- Harris & Zaritsky (2004) Harris J., Zaritsky D., 2004, The Astronomical Journal, 127, 1531–1544
- Hill & Zaritsky (2006) Hill A., Zaritsky D., 2006, AJ, 131, 414
- Hunter (2007) Hunter J. D., 2007, Computing in Science & Engineering, 9, 90
- Kamann et al. (2020) Kamann S., et al., 2020, MNRAS, 492, 966
- Keller et al. (2011) Keller S. C., Mackey A. D., Da Costa G. S., 2011, ApJ, 731, 22
- Kennicutt (1998) Kennicutt Robert C. J., 1998, ApJ, 498, 541
- Knapen & Querejeta (2015) Knapen J., Querejeta M., 2015, Galaxies, 3, 220
- Kumai et al. (1993) Kumai Y., Basu B., Fujimoto M., 1993, ApJ, 404, 144
- Kuzma et al. (2018) Kuzma P. B., Da Costa G. S., Mackey A. D., 2018, MNRAS, 473, 2881
- Lamers et al. (2005) Lamers H. J. G. L. M., Gieles M., Portegies Zwart S. F., 2005, A&A, 429, 173
- Mackey & Gilmore (2003) Mackey A. D., Gilmore G. F., 2003, MNRAS, 338, 120
- Mackey et al. (2013) Mackey A. D., Da Costa G. S., Ferguson A. M. N., Yong D., 2013, ApJ, 762, 65
- Maji et al. (2017) Maji M., Zhu Q., Li Y., Charlton J., Hernquist L., Knebe A., 2017, The Astrophysical Journal, 844, 108
- Mapelli (2017) Mapelli M., 2017, MNRAS, 467, 3255
- Mastrobuono-Battisti & Perets (2016) Mastrobuono-Battisti A., Perets H. B., 2016, ApJ, 823, 61
- Mastropietro et al. (2009) Mastropietro C., Burkert A., Moore B., 2009, MNRAS, 399, 2004
- McKenzie & Bekki (2018) McKenzie M., Bekki K., 2018, MNRAS, 479, 3126
- McKenzie & Bekki (2021a) McKenzie M., Bekki K., 2021a, MNRAS, 500, 4578
- McKenzie & Bekki (2021b) McKenzie M., Bekki K., 2021b, MNRAS, 507, 834
- Miyamoto & Nagai (1975) Miyamoto M., Nagai R., 1975, PASJ, 27, 533
- Murai & Fujimoto (1980) Murai T., Fujimoto M., 1980, PASJ, 32, 581
- Navarro et al. (1996) Navarro J. F., Frenk C. S., White S. D. M., 1996, ApJ, 462, 563
- Nayak et al. (2018) Nayak P. K., Subramaniam A., Choudhury S., Sagar R., 2018, A&A, 616, A187
- Olsen et al. (2011) Olsen K. A. G., Zaritsky D., Blum R. D., Boyer M. L., Gordon K. D., 2011, ApJ, 737, 29
- Osman et al. (2020) Osman O., Bekki K., Cortese L., 2020, Monthly Notices of the Royal Astronomical Society, 497, 2002–2017
- Pardy et al. (2018) Pardy S. A., D’Onghia E., Fox A. J., 2018, ApJ, 857, 101
- Parisi et al. (2015) Parisi M. C., et al., 2015, in Points S., Kunder A., eds, Astronomical Society of the Pacific Conference Series Vol. 491, Fifty Years of Wide Field Studies in the Southern Hemisphere: Resolved Stellar Populations of the Galactic Bulge and Magellanic Clouds. p. 241
- Parmentier et al. (2003) Parmentier G., de Grijs R., Gilmore G., 2003, MNRAS, 342, 208
- Patel et al. (2020) Patel E., et al., 2020, ApJ, 893, 121
- Peñarrubia et al. (2016) Peñarrubia J., Gómez F. A., Besla G., Erkal D., Ma Y.-Z., 2016, MNRAS, 456, L54
- Perren et al. (2017) Perren G. I., Piatti A. E., Vázquez R. A., 2017, A&A, 602, A89
- Piatti (2020) Piatti A. E., 2020, arXiv e-prints, p. arXiv:2012.12628
- Piatti (2021) Piatti A. E., 2021, arXiv e-prints, p. arXiv:2101.03157
- Piatti et al. (2008) Piatti A. E., Geisler D., Sarajedini A., Gallart C., Wischnjewsky M., 2008, MNRAS, 389, 429
- Rafelski & Zaritsky (2005) Rafelski M., Zaritsky D., 2005, AJ, 129, 2701
- Santos et al. (2020) Santos João F. C. J., et al., 2020, MNRAS, 498, 205
- Sawa et al. (1999) Sawa T., Fujimoto M., Kumai Y., 1999, in Chu Y. H., Suntzeff N., Hesser J., Bohlender D., eds, Vol. 190, New Views of the Magellanic Clouds. p. 499
- Szigeti et al. (2021) Szigeti L., Mészáros S., Szabó G. M., Fernández-Trincado J. G., Lane R. R., Cohen R. E., 2021, MNRAS, 504, 1144
- Tsuge et al. (2019) Tsuge K., et al., 2019, ApJ, 871, 44
- Tsujimoto et al. (1995) Tsujimoto T., Nomoto K., Yoshii Y., Hashimoto M., Yanagida S., Thielemann F. K., 1995, MNRAS, 277, 945
- Van Der Walt et al. (2011) Van Der Walt S., Colbert S. C., Varoquaux G., 2011, Computing in Science & Engineering, 13, 22
- Vesperini et al. (2021) Vesperini E., Hong J., Giersz M., Hypki A., 2021, MNRAS, 502, 4290
- Virtanen et al. (2020) Virtanen P., et al., 2020, Nature Methods, 17, 261
- Weinberg (2000) Weinberg M. D., 2000, ApJ, 532, 922
- Westerlund (1997) Westerlund B. E., 1997, The Magellanic Clouds
- Yoshizawa & Noguchi (2003) Yoshizawa A. M., Noguchi M., 2003, MNRAS, 339, 1135
- Zivick et al. (2019) Zivick P., et al., 2019, ApJ, 874, 78
- van den Hoek & Groenewegen (1997) van den Hoek L. B., Groenewegen M. A. T., 1997, A&AS, 123, 305
Appendix A SC1 Rotation
If all stars around a SC are used to derive the 2D maps of velocities for a projection, then the velocity range can be significantly large owing to the steam motions of stars along the line of sight. This large velocity range can make it more difficult to detect possible internal rotation of stars in the SC, in particular, when the SC has a small amount of rotation. The SC1 does not appear to show global rotation in the velocity range of -15.9 to 32.4 km s-1, but, it could be possible that it has a small amplitude of rotation. In order to investigate, we limit the velocity range to -5 to 5 km s-1 and plot the 2D map in Fig 14. For clarity, the meshes with V>5 km s-1 (V<-5 km s-1) are plotted by color for V=5 km s-1 (-5 km s-1) within a 5 pc radius. Clearly, SC1 has no internal rotation in the three projections, which is consistent with the spherical shape.