BoxScore - A real-time beam-diagnosis program for CAEN digitizer x730 series
Abstract
BoxScore is a real-time beam diagnosis and monitoring program for the CAEN x730 series digitizer that was developed for the ATLAS in-flight system at Argonne National Laboratory. The CAEN x730 series digitizer, with built-in Digital Pulse Processing for the Pulse-Height-Analysis, can analyze the input signal in real-time using a trapezoidal filter. BoxScorereads the digitizer’s buffer directly, builds and saves events to local files, plots filled histograms for particle identification, and outputs the rates of selected isotopes every second. Implementation of BoxScorehas shortened the time needed for in-flight beam-tuning and has potential applications for other nuclear physics experiments.
keywords:
[inst1]organization=Physics Division, Argonne National Laboratory, addressline=9700 S Cass Ave, city=Lemont, postcode=60439, state=Illinois, country=USA
1 Introduction
The CAEN x730 series digitizers are powerful data acquisition devices for many nuclear physics applications. In particular, the DT5730 8-channel digitizer [1] using USB connection (30 MB/s) and the V1730 16-channel digitizer [2] using optical fiber connection (80 MB/s) are used at Argonne National Laboratory. The built-in Digital Pulse Processing for the Pulse Height Analysis (DPP-PHA) function provides a real-time trapezoid filter [3] for pulse height and pile-up detection. The digitizer gives the essential information (pulse height and timestamp) that can be used widely in nuclear physics applications such as gamma-ray spectroscopy, radiation imaging, and particle identification (PID).
The Argonne Tandem Linear Accelerator Systems (ATLAS) User Facility has been involved in the production of radioactive ion beams via the in-flight technique for a number of years [4]. In 2019, the ATLAS in-flight system was upgraded through a number of hardware improvements including a dedicated magnetic separator, the Argonne in-flight radioactive ion-beam separator (RAISOR) [5]. As a consequence of the increased complexity involved with the new installations, traditional beam optimization techniques were limited and time consuming. Hence, a need arose for a real-time beam diagnostic and monitoring system. BoxScore [6] is a program that was built to remedy this situation through the use of a single CAEN x730 series digitizer in conjunction with a series of silicon-based charged particle (sensor) detector systems. The program is written in C++, and based upon the following readily available software libraries: CAENDigitizer 2.12+, CAENComm 1.4+, CAENVMELib 2.5+, CAEN A3818 Driver 1.6.4 (for PCI optical link), and CERN ROOT 6+ [7]. The program has been developed from an example that comes with the CAENDigitizer library.
The primary goal for BoxScore is beam diagnosis via charged particle identification (PID) and the corresponding isotope rate determinations using a telescope comprised of silicon detectors [8]. A perpendicular beam profile (or x-y plane image) is also possible with a spatially sensitive detector. There are two modes of operation for the x730 digitizer under the DPP-PHA firmware: 1) the “list” mode provides the pulse height and timestamp of the triggered signal. 2) the “mixed” mode outputs the waveform, pulse height, and timestamp. BoxScore can be a multi-channel oscilloscope in the “mixed” mode. The program builds events from raw data based on a given time window, displays the events in histograms, and saves the data and histograms into a CERN ROOT file. Isotope selections can be done online and graphically using the TCutG Class by CERN ROOT for picking various isotopes in the PID plot. The rates (counts per second) of the selected isotopes can be outputted to a local or remote database. An open-source database InfluxDB [9] was used to store the rates for recording, sharing, and monitoring.
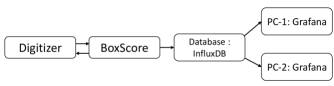
Fig. 1 shows the overview of the data acquisition system. The digitizer is placed close to the detector system. A beam diagnosis station with BoxScore installed is placed near the digitizer. The database can be hosted locally at the beam diagnosis station or remotely in other computers. Grafana [10] can access and display the database on a dashboard. Any computers can view the dashboard via network connection.
Here, we will first describe the architecture of BoxScore, explaining the core components of the program. Next, its implementation at the ATLAS in-flight system is presented. Finally, the capability and performance of BoxScore is discussed.
2 Architecture of BoxScore
The backbone of BoxScore consists of the Digitizer, the GenericPlane, and the FileIO classes. The role of each class is explained in the following.
The Digitizer class is for communication with a digitizer. It controls the digitizer by writing the registers in the digitizer, including parameters related to channel trigger threshold, input dynamic range, acquisition mode, the settings of the trapezoid filter, etc. The Digitizer::ReadData() method reads out data (pulse height and timestamp for each triggering signal) from the digitizer’s buffer and saves the data into the computer’s memory as raw data. In the “mixed” mode, waveforms are also read and saved in addition to the pulse height and timestamp. The Digitizer::BuildEvent() method builds events from the raw data.
The GenericPlane class is a canvas class that defines the canvas (using the TCanvas class in CERN ROOT) and plots histograms and graphs. The raw data, waveforms, or events can be analyzed and filled into histograms using the GenericPlane::Fill() virtual method. The GenericPlane::Draw() virtual method plots the histograms that depends on the division of the canvas. The virtual methods are used so that other canvas classes can be inherited with minimum programming when other data processing algorithms or canvases are needed.
The FileIO class provides methods to save information into a CERN ROOT file. The digitizer settings are saved in TMarco. The events are saved in TTree. The raw data and waveforms are also saved in TTree when needed. The histograms (for example, PID plot) are saved in TH1 or TH2. The graphs of the rates of selected isotopes are saved in TGraph.
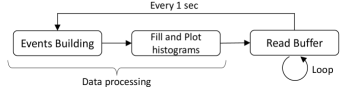
Fig. 2 shows the flowchart of BoxScore when the data acquisition is started. In order to realize real-time beam diagnosis, in each second, building events [Digitizer::BuildEvent()] is followed by filling [GenericPlane::Fill()] and plotting [GenericPlane::Draw()] histograms. The data processing (processes that do not read the digitizer’s buffer) usually does not take a full second. After that, the data in the buffer (raw data) will be read and cleared from the digitizer, saved in the computer memory [Digitizer::ReadData()] repeatedly and constantly for the rest of the second to avoid the buffer being full and data lost. The memory for each channel is 5.12 MSample for both DT5730 and V17300 digitizers. If a signal consists of 4096 samples or 8192 ns, 1250 signals can be stored in a channel. Each signal (or raw data) contains the pulse height (14 bits) and the timestamp (47 bits, 2 ns). As the raw data is accumulated, it forms a 2-D array. The pile-up signals, which have a timestamp but no pulse height, will be discarded.
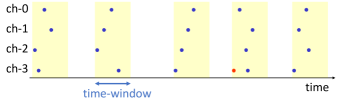
In the event-building (Fig. 3), the raw data array is first sorted in ascending order according to the timestamp using the TMath::BubbleLow() method from CERN ROOT. Next, the timestamp-sorted raw data will be grouped with the time window to form an event. For example, the sorted timestamp is denoted as , where is the data index in the time-sorted raw data array. The first event starts from the -th data with a timestamp . When the -th () data with a timestamp is the last data within the time window , i.e. , data with timestamps will be grouped and form the first event. The second event starts from the -th data with a timestamp , when the -th () data with a timestamp is the last data within the time window, i.e. , then, data with timestamp will be grouped as the second event. This process will continue until the last of the data. When the event-building has finished, the raw data array will be cleared except for the last group of the raw data. The last group of raw data will be left to the next raw data array, to avoid incomplete data collecting from the digitizer during the data processing stage. If there are multiple raw data from a single channel (which is called multi-hit) within the time window, only the last raw data from that channel will be saved.
The time required for event-building is proportional with the number of data in the raw data array. In order to avoid the event-building taking longer than a second, a size limit of 100 thousand was set for the raw data array. This corresponds to a sum of 100 kHz triggers from all channels theoretically.
The waveform is also stored in the Digitizer class when the data acquisition mode is set to “mixed”. When the Digitizer::ReadData() is called, waveforms from all channels are being read in this mode. In each channel, many waveforms could be taken from the digitizer’s buffer. However, only the earliest waveform is saved and stored, later waveforms are discarded. When using BoxScore as an oscilloscope, the waveforms are displayed after Digitizer::ReadData() is called, and the Digitizer::BuildEvent() will not be called.
3 Implementation in ATLAS in-flight system and RAISOR
BoxScore was implemented as an essential part of the ATLAS in-flight system for isotope identification and beam transport optimization (beam tuning) in real-time. There are many beam diagnostic planes (or locations, stations) along the beamline from the ATLAS in-flight system to the target destination, HELIOS [11], the beam line used in this study. For example, in this case there were diagnostic planes at the RAISOR focal plane, at the entrance of HELIOS, at the HELIOS target position, and at the exit of HELIOS. At each plane, various silicon detectors were used and various canvas classes were derived from the GenericPlane class to display the required histograms and plots.
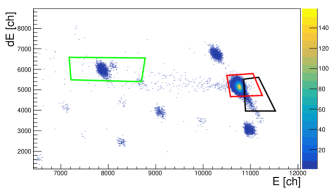
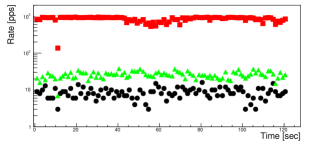
A typical histogram is a plot used for PID. Fig. 4 shows the PID of a 16N beam produced by the ATLAS in-flight system using the 15N(,)16N reaction in inverse kinematics. Graphical selection can be created online (the colored polygons in Fig. 4). Once selections are created, the rates of the selections will be shown in a rate graph (Fig. 5), and the selections will be saved in the output CERN ROOT file.
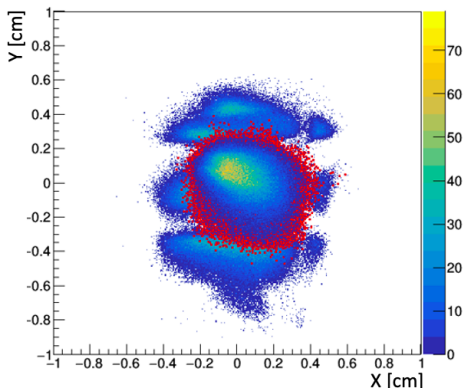
A double-sided position sensitive silicon detector [12] could also be installed to measure the beam profile and PID at the same time. Fig. 6 shows an example of a beam profile that is perpendicular (x-y plane) to the beam direction (z-axis). It shows many beam spots corresponding to various isotopes. The red shaded region highlighted an isotope that was selected in a PID plot (not shown). The position sensitive detector had five outputs, so that building an event from 5-channels and calculation of the position are required. Building events from other channels and others complicated calculations can be achieved by creating a new canvas class inherited from the GenericPlane class. For example, a 4-channel event-building and trace-analysis algorithm was tested to construct a beam profile from a microchannel plate detector [13].
4 Performance
BoxScore v2.0, released on Oct 29th, 2021, has been used in the testing described below [6]. Execution of BoxScore requires less than 200 MB of RAM. The performance of BoxScore was tested using a Ubuntu 18 machine with Intel® Core™ i5-8250U CPU and 4 GB RAM, connected to a DT5730 digitizer via USB cable. Input signals were generated by a CAEN DT5810 Fast Digital Detector Emulator. The signal has a rise time of 20 ns and a decay time of 50 s with a fixed amplitude of 1 V that is sufficient to trigger the digitizer. The sample size for the digitizer was set to be 4096 Samples or 8912 ns, so that the buffer can store 1250 signals for each channels. The coincident time window was 400 ns. The trapezoid settings for the digitizer are 100 ns for the rise-time, 200 ns for the flat-top, 50 s for the pole-zero, 150 ns for the peaking time, and 100 ns for the peak-hold off. Under this trapezoid setting, the theoretical maximum pile-up free trigger rate is 2 MHz. In addition, the database output was disabled (Fig. 1) and also no network connection to a remote database host for a reason that will be explained later. The maximum rate (that the rates from the signal emulator is the same to the measured trigger rate from the digitizer) in the “list” and “mixed” modes for single channel, 2 channels, and 4 channels are listed in Table 1.
| 1-channel | 2-channel | 4-channel | |
|---|---|---|---|
| Event-building time | ms | ms | ms |
| Max. rate (“list”) | 5.5 kHz | 4.7 kHz | 3.8 kHz |
| Max. rate (“mixed”) | 15 Hz | 15 Hz | 15Hz |
The time for the data processing mainly depends on the rate of input signal and number of input channels (Fig. 2). The time duration for the data saving and plotting histograms is about 70 ms and 90 ms, respectively, disregarding the number of channels. But the event-building time increases from 30 ms for 1 channel at 5.5 kHz, to 60 ms for 2 channels at 4.7 kHz, to 140 ms for 4 channels at 3.8 kHz. The database output to a remote host via network depends on the network environment and would be very time consuming. If any of the above processes take a lot of time so that the buffer could have been filled before the Digitizer::ReadData() method is called, the maximum rate will reduce. For example, if the total time for data processing is 250 ms, the buffer of 1250 signals will be full for a 5 kHz signal. Since the number of signals that can be stored in the buffer can be adjusted by the sample size, the maximum rate could be increased by reducing the sample size. The maximum rate for waveform (or in “mixed”) mode is limited by the algorithm that only the earliest waveform will be stored in the Digitizer::ReadData() method (Fig. 2).
5 Summary and outlook
BoxScore was developed to meet the demands of real-time beam diagnosis and monitoring. The program is an essential component for developing in-flight beams using the ATLAS in-flight system now. It builds events from multiple channels every second, provides the PID, and is able to output the count rates for selected isotopes. BoxScore contains 3 key classes: Digitizer, GenericPlane, and FileIO. The program was tested with a single CAEN DT5730 digitizer via USB connection and it should be compatible with all x730 series digitizers with DPP-PHA firmware. It is a lightweight, portable program that could be expanded to handle many nuclear physics applications that required real-time event-building. There are many things that could be developed in BoxScore, for example, supporting the Pulse Shape Discrimination firmware, supporting and synchronizing multiple digitizers, increasing the maximum rate by algorithm optimization, and integrate into NSCLDAQ [14], etc. BoxScore is open-source and constantly evolving [6].
6 Acknowledgement
The author would like to acknowledge the support and operations staff at ATLAS and fruitful discussions with C. R. Hoffman and G. L. Wilson. This research used resources of Argonne National Laboratory’s ATLAS facility, which is a Department of Energy Office of Science User Facility. This material is based upon work supported by the U.S. Department of Energy, Office of Science, Office of Nuclear Physics, under Contract No. DE-AC02-06CH11357.
References
- [1] Webpage of DT5730 digitizer, https://www.caen.it/products/dt5730/.
- [2] Webpage of V1730 digitizer, https://www.caen.it/products/V1730/.
- [3] Valentin T.Jordanov, and Glenn F.Knoll, Nucl. Instrum. Methods Phys. Res., Sect. A 345, 337 (1994).
- [4] B. Harss et al., Rev. Sci. Inst. 71, 380 (2000).
- [5] Webpage of Argonne In-Flight Radioactive Ion Separator, https://www.anl.gov/phy/argonne-inflight-radioactive-ion-separator-raisor.
- [6] BoxScore release v2.0, https://doi.org/10.5281/zenodo.5613251.
- [7] Rene Brun and Fons Rademakers, Nucl. Inst. & Meth. in Phys. Res. A 389, 81-86 (1997).
- [8] J. S. Lilley, Nuclear Physics (Principles and Applications), John Wiley & Sons, Ltd, West Sussex, England (2001).
- [9] Webpage of InfluxDB, https://www.influxdata.com/.
- [10] Webpage of Grafana, https://grafana.com/.
- [11] J. C. Lighthall et al., Nucl. Instrum. Methods Phys. Res., Sect. A 622, 97 (2010).
- [12] Webpage of Micron MSPSD double-sided position sensitive silicon detector, http://www.micronsemiconductor.co.uk/product/mspsd-dl-04/.
- [13] Webpage of microchannel plate detectors, http://www.quantar.com/pages/QTI/ofs.htm.
- [14] Webpage of NSCLDAQ, http://docs.nscl.msu.edu/daq/newsite/index.php.