Quantitative study of enantiomer-specific state transfer
Abstract
We here report on a quantitative study of Enantiomer-Specific State Transfer (ESST), performed in a pulsed, supersonic molecular beam. The chiral molecule 1-indanol is cooled to low rotational temperatures (1-2 K) and a selected rotational level in the electronic and vibrational ground state of the most abundant conformer is depleted via optical pumping on the transition. Further downstream, three consecutive microwave pulses with mutually perpendicular polarizations and with a well-defined duration and phase are applied. The population in the originally depleted rotational level is subsequently monitored via laser induced fluorescence (LIF) detection. This scheme enables a quantitative comparison of experiment and theory for the transfer efficiency in what is the simplest ESST triangle for any chiral molecule, that is, the one involving the absolute ground state level, . Moreover, this scheme improves the enantiomer enrichment by over an order of magnitude compared to previous works. Starting with a racemic mixture, a straightforward extension of this scheme allows to create a molecular beam with an enantiomer-pure rotational level, holding great prospects for future spectroscopic and scattering studies.
The two non-superimposable mirror images of a chiral molecule are referred to as enantiomers. Their structures cannot be transformed into each other by pure translation or rotation. Almost all physical properties of enantiomers are identical – which makes them intrinsically challenging to separate. The enantiomeric molecular pairs have identical energy levels except for a theoretically predicted tiny energy difference induced by parity violating weak interactions [1, 2, 3]. Yet, their interactions with other chiral objects – chiral molecules and chiral light – are dramatically different. Therefore, special care must be taken when addressing molecular chirality in biological environments since the functionality of biomolecules is dominated by the handedness of surrounding molecules [4].
Since Pasteur first described optical activity, various techniques such as optical rotation, circular dichroism, vibrational circular dichroism, and Raman optical activity [5, 6, 7, 8] have been developed to determine enantiomeric excess (EE) and absolute configurations of chiral molecules. Those techniques require high-density samples, but still give rise to weak signals because they rely on the inherently weak interaction of the molecules with the magnetic field of the radiation. Over the past decade, instrumental developments led to new methods which rely solely on electric dipole-allowed transitions, including Coulomb explosion [9], photoelectron circular dichroism [10, 11], and microwave three-wave mixing [12, 13]. All these techniques can be applied in the gas phase and enable exploration of chiral molecules without interference from any surrounding physical medium.
Beyond chiral analysis, chiral separation is a fundamental goal of chiral studies. In the past two decades, several optical schemes to achieve quantum-controlled chiral separation and purification have been suggested [14, 15, 16]. The chiral sensitivity of these methods is due to the fact that a chiral molecule necessarily has three non-zero electric dipole moment components whose scalar triple products are opposite in sign for the two members of the enantiomeric pair [12, 13]. Therefore, it is possible to gain insight into the chirality of a sample regardless of the initial orientation of the molecules. These methods employ cyclic transitions in a three-level system where the interference between two different paths can be used to control the transfer of population in an enantiomer-specific fashion.
Recently, quantum-controlled chiral separation was experimentally demonstrated using a method called enantiomer-specific state transfer (ESST) [17, 18, 19]. ESST utilizes three rotational states and three mutually orthogonally polarized microwave (MW) pulses which address all the transitions between the states [20]. By using three resonant pulses with controlled phases, it is possible to create interfering pathways to a given target state. The model of a 3-level cyclic transition gives a qualitative understanding of ESST. However, to complete this model, degeneracy has to be taken into account. While the spatial degeneracy in ESST has been considered theoretically [21, 22], quantitative comparison between experiment and theory is still lacking. For the quantitative analysis of ESST, optimal control of the pulse sequence and pulse length of the microwave excitations is necessary. So far, ESST has been experimentally studied with sequences of partially overlapping MW pulses which hampers characterizing the effects of individual MW pulses on the interrogated molecules. In addition, poor enantiomeric enrichment makes the quantitative analysis practically difficult. The two main factors that limit the size of the population transfer are the thermal population of the three rotational energy levels participating in ESST and the degeneracy of the involved rotational states [21, 22].
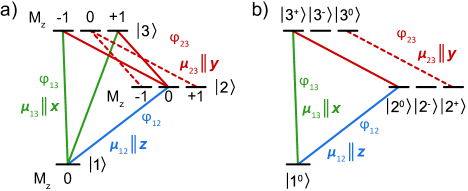
The most rigorous comparison between theory and experiment can be attained by studying the simplest triad which consists of the ground state and two rotational levels with [23]. Therefore, the simplest triad consists of either one of the following combinations: (, , ), (, , ) or (, , ) in the notation. The excitation scheme used for ESST in this case is shown in Fig. 1(a) where we refer to the levels as , and . The wavefunctions associated with these levels, , and , are characterized by the projection of the total angular momentum on the -axis. In this triad, three resonant MW pulses are applied in the following order: . These three MW fields are linearly polarized and mutually orthogonal to each other. Here, the pulse creates a 50:50 superposition between two levels whereas the pulse inverts the population of two states. Polarization directions and non-zero dipole moment components of the MW fields are indicated next to each of the transitions in Fig. 1(a). The polarization of the first pulse defines the quantization axis (-direction), and it allows transitions (blue solid line). The subsequent and pulses are polarized along - and -axes and thus the selection rules are given by . Therefore, the possible transitions driven by the second MW pulse are (green solid lines). The third MW pulse connects two states with where four transitions are involved. Two of the transitions (red solid lines) participate in ESST, while the other two (red dashed lines) do not.

One can change the basis set and redefine the wavefunctions as follows:
| (1a) | |||||
| (1b) | |||||
with , or for Eq.(1a) and or for Eq.(1b). The redefined scheme is shown in Fig. 1(b) where levels can be described as for , or and for or . It can be seen that: (i) the triangle , and participates in the ESST process; (ii) levels and constitute a closed two level system that only interacts with the last pulse; (iii) levels and are dark states and do not interact with the applied field.
If relaxation processes are neglected, we can treat the ESST process as a series of two level transitions [24]. The wavefunction of the two level system formed by and , for instance, can be described as , where and are the time-dependent probability amplitudes. The Bloch equations for resonant excitation are [24]:
| (2a) | |||||
| (2b) | |||||
where and are the Rabi frequency and phase of the electric field driving the transition, respectively. Here, is the transition dipole moment and is the electric field amplitude. The general solution after time , for constant and is
| (3a) | |||||
| (3b) | |||||
where . In the simplest case where the two upper levels and are empty and only the ground level is populated, taken as , the solution for the Bloch equations after the first pulse are:
| (4a) | |||||
| (4b) | |||||
After the pulse, population inversion occurs:
| (5a) | |||||
| (5b) | |||||
Finally, after the last pulse, the solutions are:
| (6a) | |||||
| (6b) | |||||
where the alternating signs for the interference term have to be used for either of the enantiomers. As a result, ESST will be achieved both in levels and whose populations will be given by for .
When there is thermal population in level , the closed two level transition transfers part of the population from level to level with the last pulse. The thermal population in level can be expressed as times the population in level , where is the rotational temperature. The total population in level relative to the original population in level at the end of the ESST process is then given by:
| (7) |
where has to be used for either enantiomer. The closed two level transition is thus seen to produce a phase-independent background.
Here we perform a quantitative study of ESST using 1-indanol. The molecules are cooled in a supersonic expansion using Ar as carrier gas . We choose the , , and rotational states as target triad (Fig. 2(c)). The thermal populations of all the components of these three levels are almost equal because their energy differences are small . To increase the transfer efficiency of ESST, we developed a new spectroscopic scheme consisting out of three essential Steps (I-III) as illustrated in Fig. 2(a) and outlined below.
In Step I, a continuous-wave UV laser with an output power up to and a bandwidth of , is used to selectively deplete the population of the target rotational level using the R-branch line of the origin band of the electronic transition [25]. After UV excitation, the molecules predominantly radiate back to higher vibrational levels and to other rotational levels in the state [26]. In this way, we optically pump and deplete all three components of the level. We reached up to depletion in our experiment; for details, see the Supplemental Material.
Step II of the experiment consists of sequentially exciting three electric dipole-allowed rotational transitions (-type, -type, and -type) with mutually orthogonal polarizations in the following manner: . To determine the optimal pulse duration of each MW radiation field, the relevant Rabi oscillation curves are measured prior to the ESST measurement (see the Supplemental Material). Typically, pulse lengths required for a pulse of each MW field are around and the ESST process is completed in less than . During this short time interval, decoherence will not take place.
In Step III, laser induced fluorescence (LIF) detection is employed to probe the population in the target rotational level . A small fraction of the power () of the narrow–band UV laser is used to selectively excite the same UV transition , probing all three levels in the target state.

We perform separate measurements using enantiopure commercial samples of (R)- and (S)-1-indanol with a stated purity. In order to map enantiomer selectivity on the ESST signal, relative phases of the applied MW fields have to be varied as expressed in Eq.(7). For this, we keep the phases of the first two MW fields, and , fixed and change the phase in steps of 20 degrees from 0 to 720 degrees in our measurement. In Fig. 3, normalized ESST results are shown for the (R)-enantiomer in black and the (S)-enantiomer in red (details on the measurement of the normalized ESST signal are given in the Supplemental Material). As expected, the phase of the two curves differs by 180 degrees. From the best sine fits, the experimental amplitudes and offsets are determined to be 0.135(6) and 0.343(4) for the (R)-enantiomer (black solid line) and 0.128(9) and 0.340(6) for the (S)-enantiomer (red solid line), respectively. These parameters are commonly used to determine the maximum enantiomer enrichment () as . According to this definition, we achieved 39 and 38 enantiomer enrichment for the (R)- and the (S)-enantiomers, respectively. The same ESST measurement for the (R)-enantiomer is also performed without depletion as depicted in gray in Fig. 3. The comparison of both measurements on the same -scale shows the significant improvement due to the depletion process.
The dashed lines in Fig. 3 show calculated normalized ESST curves for each case. We remove the population only from the level , whereas the level retains its Boltzmann population. As discussed before, the = 0 level of introduces background signal due to the last /2 pulse that connects the and via a -type transition. In this case, the population of the target state is given by Eq.(7). Note that, in Eq.(7), the population is normalized to the original population in the level, whereas the simulation shown here is normalized to the population in the level, assuming a Boltzmann distribution with . The predicted amplitude of the depleted ESST signal is 0.175 with an offset of 0.336. Comparison of the experiment with simulation shows that, for both enantiomers, the amplitude of the experimental value is smaller than expected while the offset agrees very well. The discrepancies between experiment and simulation are most likely caused by the imperfect orthogonality between the three microwave fields. The distance of the horn antennae to the molecular beam axis is about 10 cm, which is on the same order as the wavelength of the MW radiation. We are therefore in the near field limit, probably causing the imperfect orthogonality of the polarizations of the three MW fields. Moreover, reflections of the MW radiation in the vacuum chamber cannot be completely avoided, also contributing to polarization imperfections. In addition to these effects, the stated impurity in our sample will contribute to the observed difference.
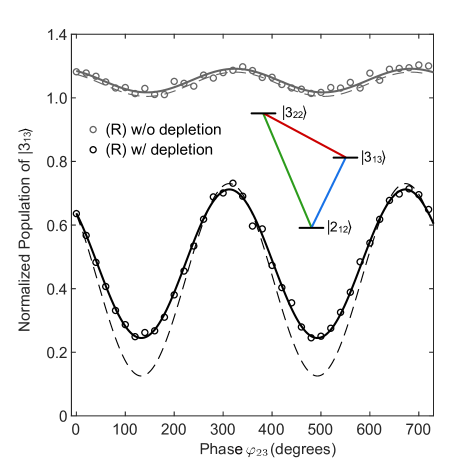
Another triad of transitions involving the rotational energy levels, , , and (Fig. 2(d)), is chosen for the ESST measurement. This triad involves higher degeneracy and higher MW frequencies due to the higher levels. Three resonant MW pulses are applied in the following way: . For this triad, the optimum pulse durations are determined from the first maximum in the Rabi oscillation curves, providing ”effective” and pulse durations (see Supplemental Material). We measure the ESST signal by varying in steps of 20 degrees from 0 to 720 degrees while the other two phases are kept fixed. In Fig. 4, normalized ESST results are shown for the (R)-enantiomer with and without depleting the target state in black and gray, respectively. The simulated results are shown with dashed lines for each case. We achieved for the measurement with depletion, where the simulations predict (amplitude: 0.302; offset: 0.428). The ESST curves in this triad show an increased contrast relative to Fig. 3 because the energy separation between the -levels is larger and because a larger fraction of all the involved levels can participate in the ESST process.
In summary, we quantitatively studied the ESST method by targeting the simplest triad of rotational transitions that is available for any chiral molecule. We observed lower amplitude of the ESST signal than theoretically expected which we attribute to the imperfect orthogonality of the polarizations of the MW fields. Depleting a target rotational state prior to the ESST process enables significant enhancement in enantiomer enrichment. The enantiomeric enrichment achieved in our measurement is which is more than an order of magnitude larger than the largest value achieved to date, which, according to the definition used here, was [18]. When removing thermal populations of the two upper levels in the simplest triad, perfect ESST efficiency can be achieved, and experiments are underway to demonstrate this. Starting with a racemic mixture, this scheme allows to create a molecular beam with an enantiomer-pure rotational level, holding great prospects for future spectroscopic and scattering studies.
Acknowledgements.
We thank Marco De Pas, Henrik Haak, Uwe Hoppe, Sebastian Kray, Johannes Seifert and Stefan Truppe as well as the teams of the mechanical and electronics workshop of the Fritz-Haber-Institut for excellent technical and laser support.References
- Letokhov [1975] V. Letokhov, On difference of energy levels of left and right molecules due to weak interactions, Phys. Rev. A 53, 275 (1975).
- Quack et al. [2008] M. Quack, J. Stohner, and M. Willeke, High-resolution spectroscopic studies and theory of parity violation in chiral molecules, Annu. Rev. Phys. Chem. 59, 741 (2008).
- Darquié et al. [2010] B. Darquié, C. Stoeffler, A. Shelkovnikov, C. Daussy, A. Amy-Klein, C. Chardonnet, S. Zrig, L. Guy, J. Crassous, P. Soulard, P. Asselin, T. R. Huet, P. Schwerdtfeger, R. Bast, and T. Saue, Progress toward the first observation of parity violation in chiral molecules by high-resolution laser spectroscopy, Chirality 22, 870 (2010).
- Polavarapu [2018] P. L. Polavarapu, Chiral analysis: advances in spectroscopy, chromatography and emerging methods (Elsevier, 2018).
- Muller et al. [2007] F. C. Muller, G. Muller, and J. P. Riehl, Emission detected circular dichroism from long-lived excited states: Application to chiral Eu(III) systems, Chirality 19, 826 (2007).
- He et al. [2011] Y. He, W. Bo, R. K. Dukor, and L. A. Nafie, Determination of absolute configuration of chiral molecules using vibrational optical activity: a review, Appl. Spectrosc. 65, 699 (2011).
- Nafie et al. [1976] L. A. Nafie, T. A. Keiderling, and P. J. Stephens, Vibrational circular dichroism, J. Am. Chem. Soc. 98, 2715 (1976).
- Stephens [1985] P. J. Stephens, Theory of vibrational circular dichroism, J. Phys. Chem. 89, 748 (1985).
- Pitzer et al. [2013] M. Pitzer, M. Kunitski, A. S. Johnson, T. Jahnke, H. Sann, F. Sturm, L. P. H. Schmidt, H. Schmidt-Böcking, R. Dörner, J. Stohner, J. Kiedrowski, M. Reggelin, S. Marquardt, A. Schiesser, R. Berger, and M. S. Schöffler, Direct determination of absolute molecular stereochemistry in gas phase by coulomb explosion imaging, Science 341, 1096 (2013).
- Powis [2000] I. Powis, Photoelectron spectroscopy and circular dichroism in chiral biomolecules: L-alanine, J. Phys. Chem. A 104, 878 (2000).
- Nahon et al. [2006] L. Nahon, G. A. Garcia, C. J. Harding, E. Mikajlo, and I. Powis, Determination of chiral asymmetries in the valence photoionization of camphor enantiomers by photoelectron imaging using tunable circularly polarized light, J. Chem. Phys. 125, 114309 (2006).
- Patterson and Doyle [2013] D. Patterson and J. M. Doyle, Sensitive chiral analysis via microwave three-wave mixing, Phys. Rev. Lett. 111, 023008 (2013).
- Patterson et al. [2013] D. Patterson, M. Schnell, and J. M. Doyle, Enantiomer-specific detection of chiral molecules via microwave spectroscopy, Nature 497, 475 (2013).
- Král and Shapiro [2001] P. Král and M. Shapiro, Cyclic population transfer in quantum systems with broken symmetry, Phys. Rev. Lett. 87, 183002 (2001).
- Král et al. [2003] P. Král, I. Thanopulos, M. Shapiro, and D. Cohen, Two-step enantio-selective optical switch, Phys. Rev. Lett. 90, 033001 (2003).
- Li and Bruder [2008] Y. Li and C. Bruder, Dynamic method to distinguish between left-and right-handed chiral molecules, Phys. Rev. A 77, 015403 (2008).
- Eibenberger et al. [2017] S. Eibenberger, J. Doyle, and D. Patterson, Enantiomer-specific state transfer of chiral molecules, Phys. Rev. Lett. 118, 123002 (2017).
- Pérez et al. [2017] C. Pérez, A. L. Steber, S. R. Domingos, A. Krin, D. Schmitz, and M. Schnell, Coherent enantiomer-selective population enrichment using tailored microwave fields, Angew. Chem. 56, 12512 (2017).
- Pérez et al. [2018] C. Pérez, A. L. Steber, A. Krin, and M. Schnell, State-specific enrichment of chiral conformers with microwave spectroscopy, J. Phys. Chem. Lett. 9, 4539 (2018).
- Leibscher et al. [2019] M. Leibscher, T. F. Giesen, and C. P. Koch, Principles of enantio-selective excitation in three-wave mixing spectroscopy of chiral molecules, J. Chem. Phys. 151, 014302 (2019).
- Lehmann [2018] K. K. Lehmann, Influence of spatial degeneracy on rotational spectroscopy: Three-wave mixing and enantiomeric state separation of chiral molecules, J. Chem. Phys. 149, 094201 (2018).
- Leibscher et al. [2020] M. Leibscher, E. Pozzoli, C. Pérez, M. Schnell, M. Sigalotti, U. Boscain, and C. P. Koch, Complete controllability despite degeneracy: Quantum control of enantiomer-specific state transfer in chiral molecules, arXiv:2010.09296 (2020).
- Ye et al. [2018] C. Ye, Q. Zhang, and Y. Li, Real single-loop cyclic three-level configuration of chiral molecules, Phys. Rev. A 98, 063401 (2018).
- Varshalovich et al. [1988] D. A. Varshalovich, A. N. Moskalev, and V. K. Khersonskii, Quantum theory of angular momentum (World Scientific, 1988).
- Hernandez-Castillo et al. [2021] A. O. Hernandez-Castillo, J. Bischoff, J. H. Lee, J. Langenhan, M. Karra, G. Meijer, and S. Eibenberger-Arias, High-resolution UV spectroscopy of 1-indanol, Phys. Chem. Chem. Phys. 23, 7048 (2021).
- Barbu-Debus et al. [2006] K. L. Barbu-Debus, F. Lahmani, A. Zehnacker-Rentien, N. Guchhait, S. S. Panja, and T. Chakraborty, Fluorescence spectroscopy of jet-cooled chiral ()-indan-1-ol and its cluster with ()-methyl- and ethyl-lactate, J. Chem. Phys. 125, 174305 (2006).