The impact of aging on human brain network target controllability
Giulia Bassignana1,2, Giordano Lacidogna3, Paolo Bartolomeo1 Olivier Colliot1,2, Fabrizio De Vico Fallani1,2,*
1 Sorbonne Universites, Paris Brain Institute (ICM), Inserm, CNRS, APHP, Hopital Pitie Salpetriere, Paris, France
2 Inria Paris, Aramis Project Team, Paris, France
3 Hospital, Tor Vergata Unviersity, Rome, Italy
* corresponding author: fabrizio.de-vico-fallani@inria.fr
Abstract
Understanding how few distributed areas can steer large-scale brain activity is a fundamental question that has practical implications, which range from inducing specific patterns of behavior to counteracting disease.
Recent endeavors based on network controllability provided fresh insights into the potential ability of single regions to influence whole brain dynamics through the underlying structural connectome. However, controlling the entire brain activity is often unfeasible and might not always be necessary. The question whether single areas can control specific target subsystems remains crucial, albeit still poorly explored. Furthermore, the structure of the brain network exhibits progressive changes across the lifespan, but little is known about the possible consequences in the controllability properties.
To address these questions, we adopted a novel target controllability approach that quantifies the centrality of brain nodes in controlling specific target anatomo-functional systems. We then studied such target control centrality in human connectomes obtained from healthy individuals aged from to . Main results showed that the sensorimotor system has a high influencing capacity, but it is difficult for other areas to influence it. Furthermore, we reported that target control centrality varies with age and that temporal-parietal regions, whose cortical thinning is crucial in dementia-related diseases, exhibit lower values in older people. By simulating targeted attacks, such as those occurring in focal stroke, we showed that the ipsilesional hemisphere is the most affected one regardless of the damaged area. Notably, such degradation in target control centrality was more evident in younger people, thus supporting early-vulnerability hypotheses after stroke.
1 Introduction
Brain controllability refers to the possibility to induce specific functional states, or configurations, by means of internal or external control. In neuroscience, this capability is associated with cognitive control [1], which can be qualitatively assessed by measuring dynamic cooperation and competition between different neural systems during goal-directed tasks [2].
Recently, the adoption of a control theoretic perspective has started to provide quantitative insights on how functional brain states can be predicted by the underlying brain network structure[3]. In particular, network controllability - i.e., the theoretical ability to guide a system’s state by operating on few driver nodes - has received a growing interest in several biological applications [4, 5, 6, 7]. Controllability of brain networks has been specifically explored to understand how the brain is able to endogenously modify its dynamics and if it is possible to steer it from exogenus stimuli [8, 9]. Hence, a crucial step in network controllability is to determine the nodes that are the best-suited to drive the system’s state. To this end, centrality measures based on controllability were developed and applied to brain networks for identifying potential driver nodes and measuring the size of the network that they can control [3, 10]. These studies can have practical implications because they can inform possible intervention strategies to favor specific patterns of behavior or treat brain diseases, by means of brain stimulation technology [11, 12, 8].
While promising, controllability of the brain is still an underexplored research field due to the different ways in which controllability can be implemented [13]. In practice, controlling the whole system from a single node could not be feasible due to algorithmic imprecision even in relatively small networks of hundreds of nodes. Furthermore, the magnitude of the control signal might be too high to be generated physically or destructive for the network functioning itself [14, 15]. A possible solution would be to focus on specific parts of the network so as to reduce the overall computational complexity [4, 16, 17]. Determining how single nodes can affect parts of the network still remains poorly understood in the human brain. Furthermore, current results have neglected the fact that brain controllability could vary with aging, which induces progressive changes in the underlying network structure or with focal brain damages [18, 19].
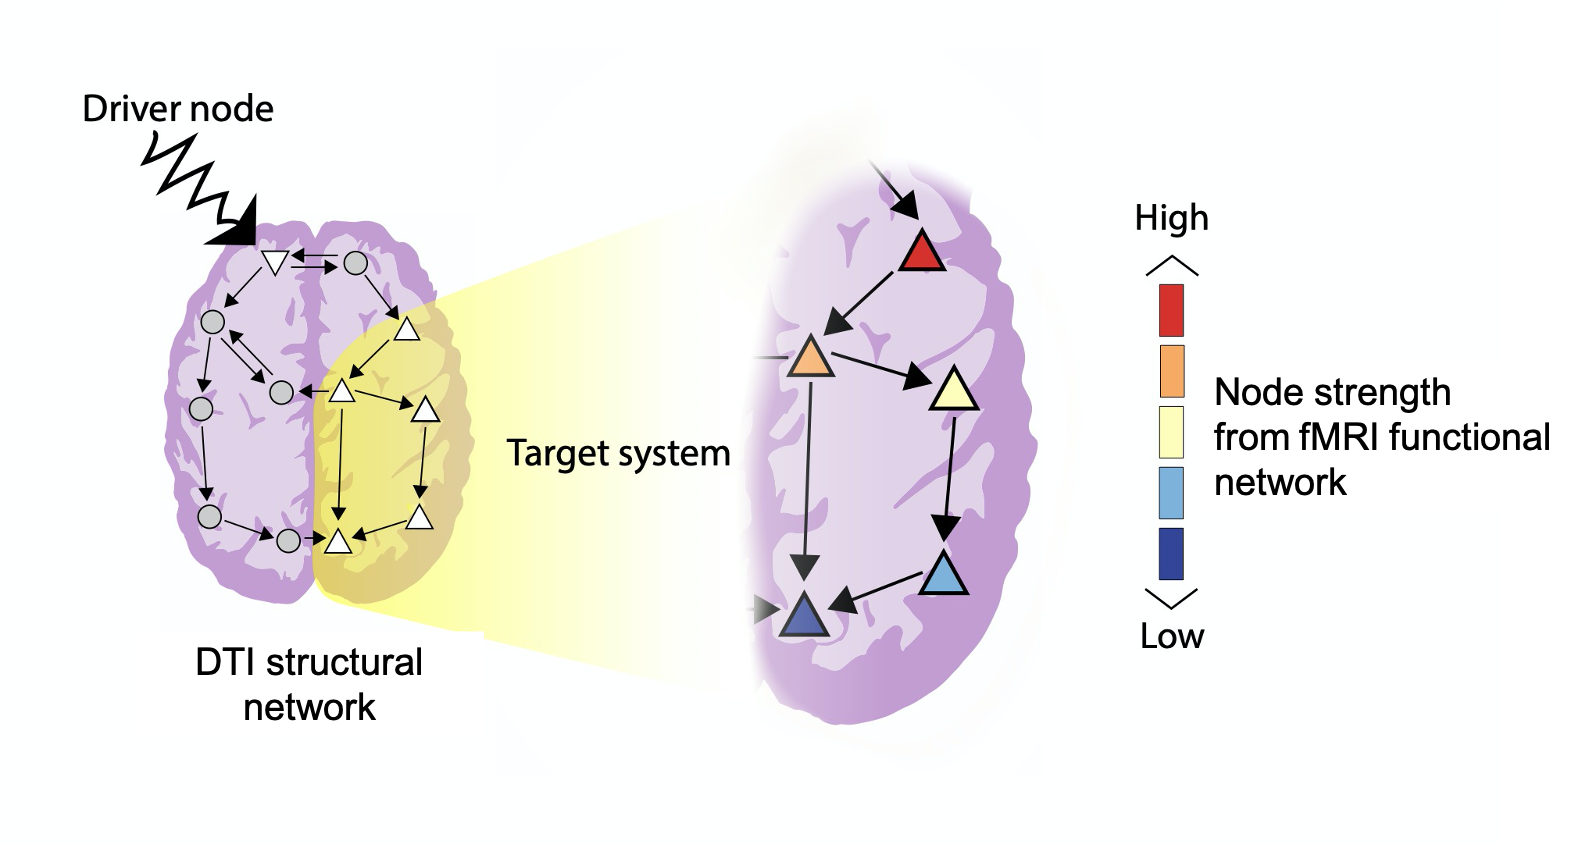
To address these questions, we used cross-sectional anatomical and functional MRI (fMRI) data from healthy individuals aged between and [20]. Then, we evaluated the ability of single brain nodes to control specific target subsystems, i.e., frontal, limbic, temporal, sensorimotor, parietal, and occipital systems (Fig. S1). To do so, we adopted an exact network controllability approach [21], which gives for each tested driver the number of nodes in a predetermined target that it can control (Fig. 1).
We then studied how control centrality is distributed in the brain and which are the most controllable target systems. We assessed how control centrality is altered by age and whether there are specific regions that better explain the aging process. Finally, we tested how control centrality changes in presence of simulated targeted attacks and how the overall damage depends on the participant’s age.
2 Results
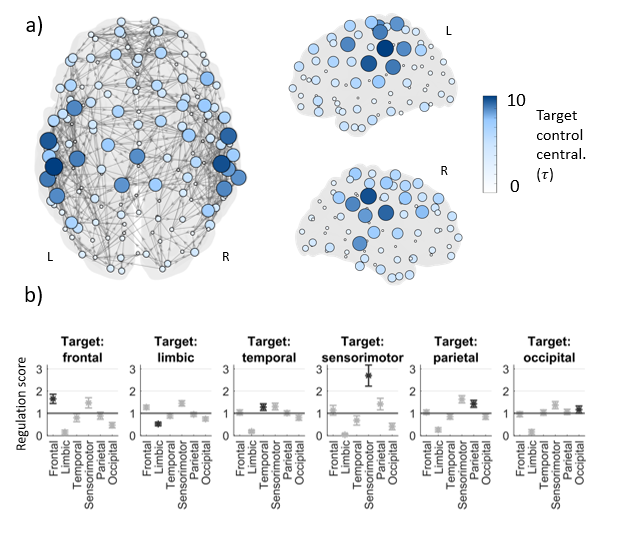
2.1 Sensorimotor areas have high control centrality
We first studied how target control centrality is distributed across different functional systems of the human brain (Fig. 2, Methods). Namely, we analyzed the ability of a single node in controlling different cortical systems by computing the target control centrality , the number of target nodes that this driver can control (Methods). The group-averaged results showed that values significantly vary across regions (one-way ANOVA, ) as well as depending on the targeted system. In particular, the sensorimotor regions had a high tendency to control the nodes in other systems, but they were also difficult to control from other areas (Fig S2). By pooling the results obtained with all different target systems, it became clearer that the sensorimotor nodes have on average the largest centrality values, while the limbic nodes have the lowest ones (Fig. 2a).
Next, we evaluated the tendency of single brain areas to control the system they belong to as compared to other systems. To this end, we calculated the self-regulation score of a node as the ratio of when targeting its own system and the average obtained when it targets all the other systems (Methods). Results showed that on average brain regions tend to have a high self-regulation so that they control more nodes in their own system than those in other systems (one-way ANOVA, ). That was particularly true for the sensorimotor system which consistently presented the highest values of the self-regulation score. On the contrary, the nodes in the limbic system exhibited a very low self-regulation (Fig. 2b).
2.2 Control centrality decreases with age
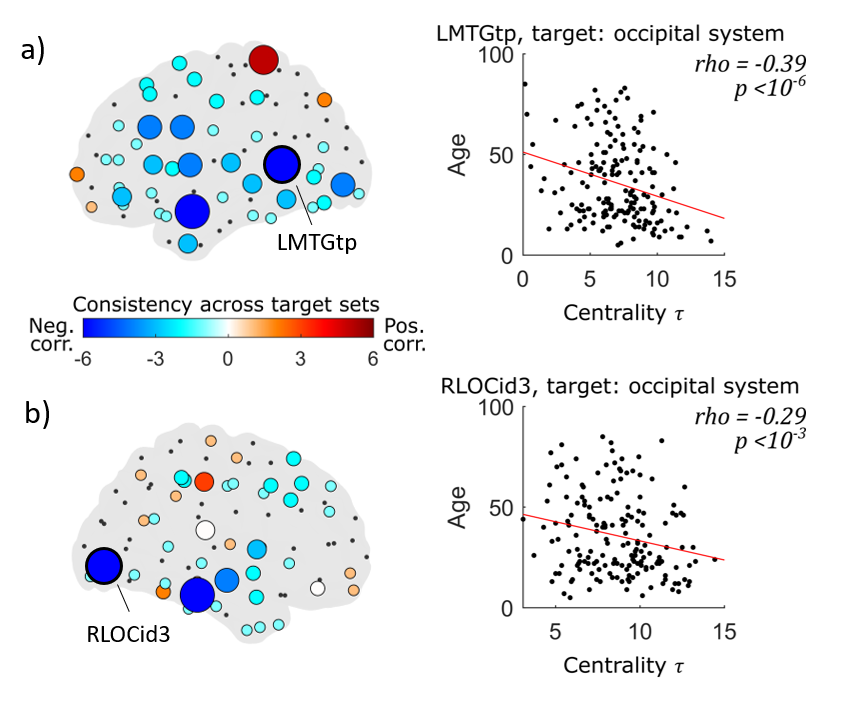
By exploiting the high variability in the age of the participants (mean years, std years), we asked whether and how target control centrality varied with age. To this end, we computed the Spearman partial correlation between the values and age of the participants, correcting for the outdegree of the nodes. This correction was needed to exclude the existence of significant associations merely due to the presence of nodes with a high number of outgoing links. Results show a general tendency of the brain areas to be negatively correlated (,, FDR-corrected for multiple comparisons) with age regardless of the targeted system (Fig. S3). The presence of positive correlations is instead less consistent and weakly concentrated in the frontal and central areas of the brain.
By focusing on the ROIs that presented a significant association with the same sign across all targets, four regions emerged with a consistent negative correlation with age (Fig. 3). Among those, the right lateral occipital inferior area (RLOCid3) in the occipital system is known to be associated with attentional processes and related to the dorsal attention network (Fig. 3b)[22]. The other regions were in the temporal system and three of them (left middle temporal anterior gyrus (LMTGad), left middle temporal temporo-occipital gyrus (LMTGtp), right middle temporal posterior gyrus (RMTGpd) belonged to the default mode network (DMN) [23, 24]. The left middle temporal temporo-occipital gyrus (LMTGtp) had the strongest negative correlation, possibly related to hippocampal degeneration with age [25](Fig. 3a). Taken together, these results suggested that most brain regions, and in particular those located in the temporal system, tend to decline with age.
2.3 Targeted attacks lead to greater control centrality loss in younger brains
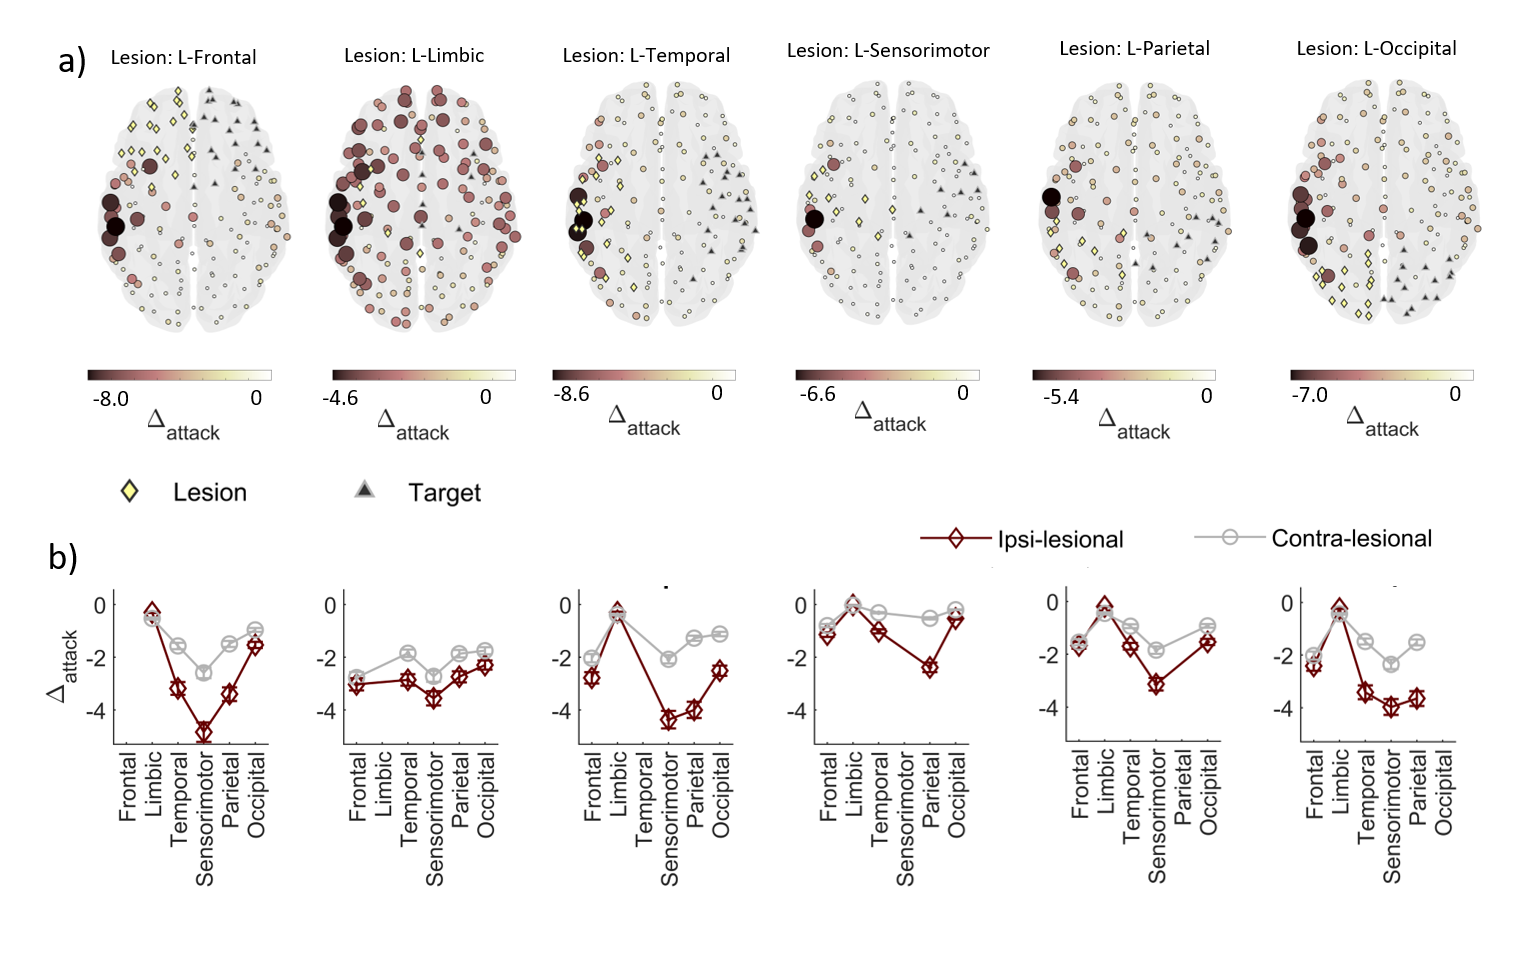
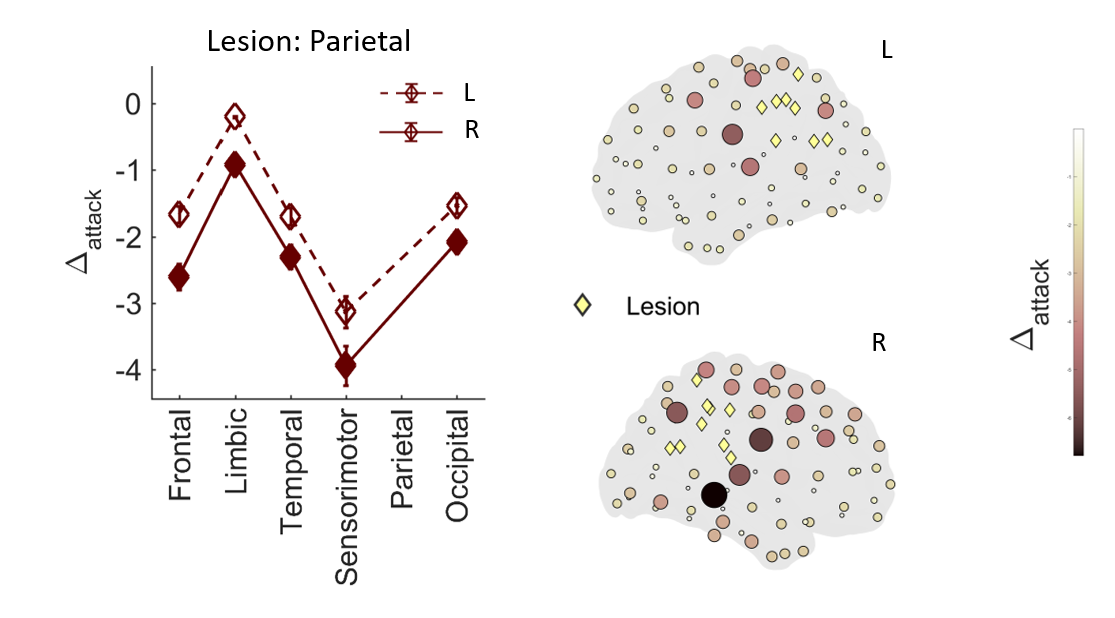
Finally, we asked to what extent the target control centrality was impacted by attacks to specific brain systems, like those occuring after stroke, traumatic brain injury or tumor resection [26, 27]. To answer this question, we simulated lesions to different target systems by removing the nodes and the links from only one hemisphere. Then we evaluated the ability of all the other nodes to control the contralesional part of the target in the intact hemisphere, and we computed the difference with the original values () to quantify the impact of the damage.
As expected, network attacks led to decreases of control centrality, with greater losses in the ipsilesional hemisphere as compared to the unaffected one (two-ways ANOVA, , Fig. 4 , Fig. S4). In particular, results showed that control centrality losses were globally small when the sensorimotor system was lesioned. Instead, when other systems were damaged, the sensorimotor system exhibited larger decrements. Conversely, the limbic system was relatively mildly impacted by any attack. In terms of difference between hemispheres we did not report a clear pattern across damaged systems. However, we consistently observed a greater ipsilesional centrality loss when the parietal system was attacked on the right hemisphere (two-ways ANOVA, , Fig. 5), which would reflect the the ability of the right parietal lobe to be involved in several high order cognitive processes [28, 29, 30] and interacting more with the other hemisphere as compared to the left one [31, 32].
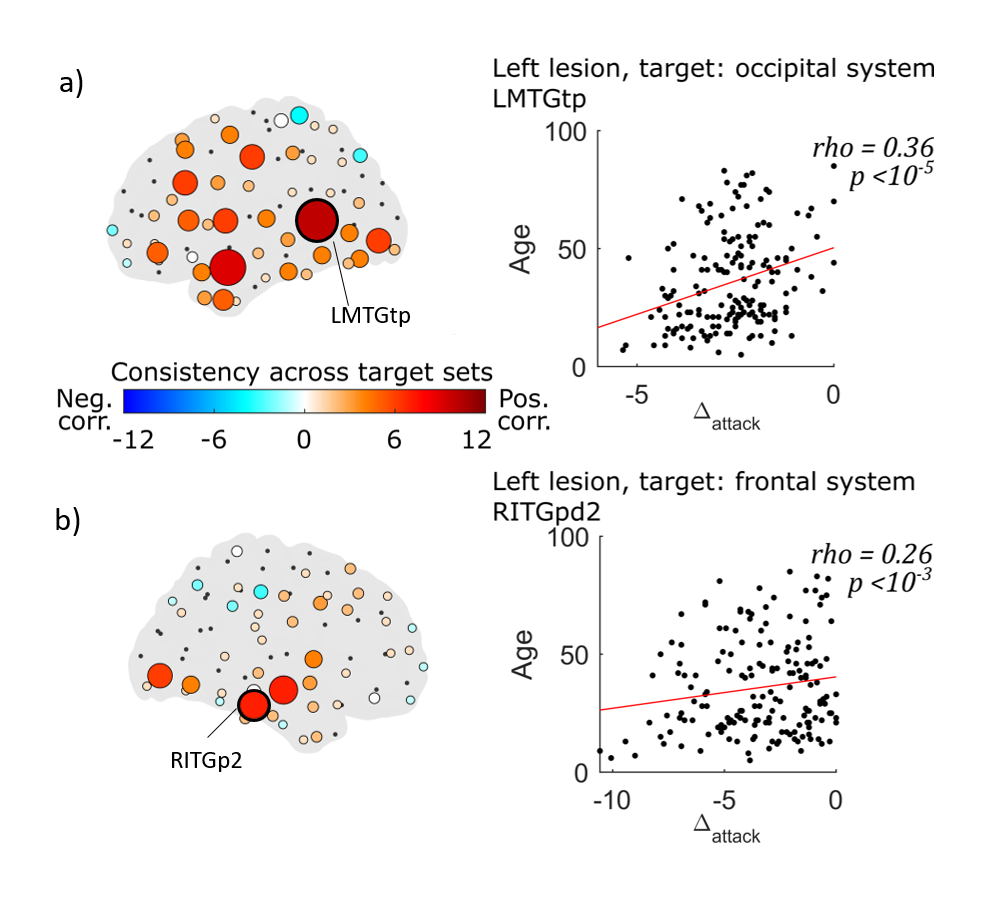
Finally, we evaluated whether the age of the participants had an impact on the observed node control centrality loss after the simulated network attacks. Results showed a global positive correlation between values and age (Spearman correlation, , , FDR-corrected for multiple comparisons), Fig. 6, Fig. S5), suggesting a more important effect in younger participants compared to adults. Notably, these associations were consistently reported in the same temporal DMN areas, for which we also observed a significant positive correlation between control centrality values and age (Fig. 3).
3 Discussion
3.1 Driver nodes in the human brain
Thanks to its ability to establish theoretical relationship between structure and dynamics, control network theory has been increasingly adopted to study human brain functioning. Control centrality, measuring how important a network node is in influencing other nodes’ states, has been shown to provide useful markers of brain dynamics during resting states [3] and executive functioning [33], as well as to predict responses to brain stimulation in practice [34] and in theory [9]. These findings establish an intuitive link between the brain regions identified as potential control drivers and the current knowledge in cognitive neuroscience. Notably, large-scale brain activity has been found deeply dependent on nodal controllability within specific systems, such as default mode, fronto-parietal, cingulo-opercular, and attention [35].
While these results provide mechanistic insights on how single areas can steer whole-brain activity, they do not inform on how different specialized brain systems can influence each other. Is there a dominant subnetwork prone to control all the other ones? Is there a subsystem that is instead more controllable than others? These fundamental questions become particularly pressing considering that one-to-whole control might be difficult to achieve both from a theoretical and practical angle [14, 15]. To answer those questions, we used the step-wise target control centrality, i.e. an optimized Kalman-based heuristics that measures the ability of nodes to control predetermined target parts of the network [21].
Our results showed that in general node control centrality varies depending on the targeted system. Despite such variability, the sensorimotor areas always exhibited the highest influencing capacity while being very hard to control. Conversely, the limbic regions always had a scarce driving power and they were on average easily controllable by all other nodes (Fig. 2). This tendency was also confirmed when looking at the ability of those systems to control, or self-regulate, themselves.
The sensorimotor system is known to be more densely connected, with many anatomical long-distance interhemispheric connections, as compared to other secondary motor-related systems [36]. Such hyperconnectivity, would constitute therefore a structural prerequisite to reach and orchestrate different areas during cognitive and motor functions [37, 38, 39, 40, 41]. From a functional perspective the high control centrality of the sensorimotor system has been previously associated with its ability to process information not only for motor control but also for a broad range of recognition processes [42, 43, 44]. This is in line with the existence of gradients of cortical organization through which the sensorimotor system could boost neural activity of other association areas required for higher order functions such as cognitive control, guided attention and motivation [45]. In line with such a cortical organization gradient, we could have expected that the visual system -another highly connected primary system- would have exhibited high control centrality, too. However the control centrality of the nodes in the occipital lobe, where main hubs of the visual system are localized, were rather low. Future works will be crucial to assess whether the high control centrality of the sensorimotor system is mainly due to its high connection density and/or specific local synaptic properties and gradients of gene expression in the excitation–inhibition balance of related interneurons [45].
While limbic areas constitute an important structural bridge for the information transfer between cortical and subcortical regions [46, 47], their control centrality was remarkably low regardless of the targeted cortical system. This could be in part explained by the heterogenous nature the lymbic system, which includes different anatomical and cytoarchitectonic components [47, 48, 49]. However, it is also true that many important subcortical areas, such as amygdala, caudate nucleus, and hypothalamus [46], were not available in the dataset we used (see Methodological considerations for more details). Future research will be crucial to elucidate the role of lymbic areas in terms of target control centrality using more comprehensive and accurate subcortical-cortical systems.
3.2 Aging and control centrality
Brain aging is a highly heterogeneous and dynamic process that involves structural and functional changes both at individual and group level. Among structural changes, cortical thinning and regional atrophy [50], white matter loss of integrity [51], neuronal loss and degeneration [52] and neurotransmitters depletion have been detected at varying degrees among older subjects [52]. Functional alterations refers to maladaptive, age-related brain activity, detected in neuroimaging studies, including decreased specificity of ventral-visual and motor areas [53, 54], decreased memory-related recruitment of medial temporal lobe regions [55] and dysregulation of the default mode network [56].
Network approaches investigating brain reorganization across the lifespan have constantly reported whole-brain intrinsic connectivity changes by using standard centrality metrics such as node degree [57], strength [58] and betwenness [59]. Compared to young adults, older ones exhibit reduced local-efficiency and modularity as well as connectivity changes within and between specific subnetworks [60, 61, 62, 63]. Only few studies have attempted to study how network controllability evolves with age. In a recent study, authors showed that regional controllability increases with development [64], but no information is available on how it evolves across the lifespan. To address this question, we combined information from both structural (DTI) and functional (fMRI) neuroimaging data, and we analyzed the effect of aging on a new measure of centrality based on network controllability.
Main results showed that control centrality was negatively correlated with age indicating a global trend of node controllability reduction in older brains. The presence of sporadic positive correlations in the frontal and central areas should be further investigated for possible compensatory mechanisms occuring in later age as well as in mild cognitive impairment and Alzheimer’s disease [65, 66, 67]. Instead, brain regions in the middle temporal gyrus (MTG) were significantly impacted by aging, in terms of relative loss of control centrality (Fig. 3). Those areas were previously found to be less activated in elderly people, reflecting a lower semantic retrieval control process [24, 68]. Such a decrement could be associated with the the more general age-dependent DMN functional rearrangement [69, 70].
According to the “network dedifferentiation” hypothesis [71], DMN regions in older adults progressively present a reduction in the communication with other systems, such as the dorsal attention network (DAN) or the frontoparietal network[63, 72]. Thus, age-related reduced control centrality could be a possible reorganizational mechanism subserving the failure to deactivate neural systems that are unrelated to the task [73] and leading to abnormal increased brain activation [74, 75] and negative correlation with task performance [76, 77].
Our results showed that while there is a common distribution between the age-centrality correlations in the left and right hemisphere, there are also few notable differences. The specific asymmetric involvement of the right lateral occipital inferior cortex (RLOCid3) could be intriguingly related to a progressive inability to mediate the interaction between the right ventral attention system, involved in saliency analysis, and the bilateral dorsal attention system, mostly involved in attention shifting [78, 79, 30]. The interaction between the two attentional systems finally influences the processing of attended visual stimuli in the primary visual cortex [80, 72]. While asymmetry patterns could be interpreted in the light of age dependent loss of lateralization in specific cognitive processes, such as semantic control [73, 81], more investigation is needed to better disentangle this aspect.
Finally, recent studies suggest that long-range connections may be more vulnerable to aging effects than short-range connections in both DMN and DAN [82]. A future perspective would be to check to what extent the observed controllability changes depend on the relative spatial distance between the driver and target nodes.
3.3 Control centrality markers of brain lesions
Network control theory not only informs on the basic brain functioning but it can also offer new analytical ways for quantifying dysfunctions in neurological diseases [84]. After a focal damage, such as in stroke, traumatic injuries and tumors, the brain typically loses the functions associated with the lesioned area and with those connected to it. Quantifying the effects of such local destruction on the rest of the network is therefore crucial to predict the extent to which the brain will recover its functions through a reorganizational process, i.e. plasticity [85, 86].
Here, we studied how control centrality changed when simulating unilateral attacks to the target systems. Results showed that the nodes in the ipsilesional hemisphere globally underwent larger losses in control centrality. That was particularly true for the sensorimotor regions regardless of the system attacked. From a mechanistic perspective, the ability of the nodes in the damaged hemisphere to control the unaffected side of the target, would be compromised by the removal of the interhemispheric homotopic connections, i.e. the links bridging the homologous regions in the two hemispheres [87, 88]. The interruption of such homotopic bridge, which is typically stronger compared to heterotopic connectivity, eventually made the nodes in the intact target less reachable from the nodes in the lesioned hemisphere. The extent to which this also affects possible compensatory actions from the contralesional “intact” hemisphere, remains a question to be elucidated with more clinical and longitudinal data [89, 90, 91, 92, 93].
While the controllability power of ipsilesional sensorimotor regions was particularly impacted when damaging the targets, the other regions appeared to be less affected when the sensorimotor target was attacked. This weak effect was in part due to the relatively low values of control centrality of those regions, which limited the possible range of change after the damage. More generally, this might be related to a putative high reachability of the sensorimotor system given its high connection density [94, 36, 95] and the presence of alternative pathways between frontal, parietal and limbic areas [96, 97].
We observed a progressive decrease of control centrality with age, mostly localized in the temporal lobes (Fig. 6). We then asked whether the control centrality losses induced by the lesions, regardless of the targeted system, could also depend on the age of individuals. Results confirmed that the damage-related control centrality reductions in the temporal lobes were larger in younger brains, which have in general higher baseline values of controllability.
From a biological perspective, it’s well established that changes in neuroplasticity occur lifelong through many age-specific processes [98], ultimately affecting cerebral network maturation [99, 100] and controllability [64]. Likewise, brain lesions could impact brain organizational properties in an age-dependent manner. In this direction, two seemingly contradictory explanations have emerged: first, “early plasticity”, arguing for the greater flexibility of the immature brain, and associated good recovery and outcome [101, 102]; and secondly, “early vulnerability” referring to the young brain’s unique susceptibility and subsequent poor outcome [103, 104, 105].
Our results indicated that target control centrality follows an age-dependent trend that mirrors an early vulnerability condition, so that networks of younger participants are more impacted by focal lesions, possibly reflecting a reduced resiliency to damages in the early stages. Shedding a light on functional reorganization and recovery after brain injuries or stroke might enable better prediction and prevention of clinical outcome. However, the lack of clinical data for our population allows us neither to validate this result from a clinical perspective nor to assess the early-plasticity hypothesis which would require longitudinal clinical data associated with the recovery of patients.
Future research is needed to better identify possibly longitudinal changes in network controllability related to specific clinical outcome in both earlier and later stages of brain reorganizaiton after brain damages [103].
3.4 Methodological considerations
In this work, we exploited the step-wise target controllability framework [21], which relies on a linear time invariant (LTI)dynamics and is based on the Kalman rank condition. While it is known that the brain presents a nonlinear dynamics, the study of linear models has proved to be beneficial in improving our understanding [3, 106, 8]. Specifically, the controllability of a linearized model can inform on the controllability of the nonlinear model [107].
In order to study the controllability of brain networks efficiently, we gave a directionality to the connectomes. Despite the fact that it is not currently possible for neuroimaging techniques to discern the directionality of bundles of axons, it is known that each neuron propagates signals through a well-defined direction from the soma to the axon terminal. Previous efforts to direct a connectome relied on the hypothesis that, given a set of brain networks, edges present for all participants are the oldest, and any new edge would be directed from the new node to the existing cluster [108]. However, a limitation of this method is that it is strictly dependent on the initial set of networks, and the procedure would not be easily scalable. Other methods based on local navigation and communicability were devised to infer the directionality of neural signaling, but since they operate best for nodes connected by longer paths, they are not well-suited to perform inference for structurally connected nodes [109]. Our approach was instead inspired by the diffusion processes taking place in the connectome [110, 111, 112, 113, 114] and preserves the hierarchical and modular properties of the anatomical pathways.
Finally, it is important to mention that the obtained results refers to the specific way we have selected the target systems and and ranked the nodes therein contained, and should not be generalized to other possible choices. By adopting an “anatomical proximity” criterion, some regions that could be functionally associated to the frontal lobe, e.g. the anterior cingulate cortex ACC, have been instead assigned to the lymbic system. The original dataset did not contain subcortical areas, such such as amygdala, caudate nucleus, and hypothalamus [47], which are known to be tightly related to the lymbic system. Future research will therefore be important to validate the obtained results on different brain atlases and target system selection. Furthermore, more rigorous anatomical and circuit-level information from histological and causal experiments can better elucidate the robustness of our results obtained from noninvasive neuroimaging [115, 116].
4 Conclusions
In this study, we presented a method to quantify the ability of candidate driver nodes to drive the state of a target set in directed brain networks. The obtained results revealed that sensorimotor areas are theoretically inclined to control different target systems, while regions in the temporal lobe were negatively impacted by age and by simulated damages to the network. These results are in line with the general claim of a dominant gradient of cortical organization with sensory-motor and association regions at opposing ends [117, 118]. We hope that further developments of network controllability measures will contribute to the identification of the key nodes in biological networks to better identify targets of brain stimulation to counteract human diseases.
5 Methods
Structural and functional brain networks
We used already processed brain network data from the NKI-Rockland database [119], and selected participants, aged from to [120]. For each participant we had access to both structural (DTI) and functional (fMRI) data. Both structural and functional networks consisted of nodes corresponding to functional regions of interest (ROIs) established with a spatially constrained spectral clustering method [121]. All related information including node labels and spatial position can be accessed via the USC Multimodal Connectivity Database http://umcd.humanconnectomeproject.org/umcd/. We also provided a compacted version of this information in a dedicated supplementary file (File S1). Note that some ROIs had been split in different parts. In this case, we added a suffix number at the end of the label to specify its relative position along the longitudinal axis of the brain (i.e. higher numbers, more caudal positions).
Directing structural brain networks
We directed the structural connectomes in order to study their controllability properties in a more efficient way, and we used the information from fMRI brain networks to establish a hierarchy among the nodes in the target systems. Starting from the DTI network, first we applied a logarithmic transformation () to make the weights more homogeneous. Then, we performed a biased random walk [122] to direct each edge from the node with lower strength to the node with higher strength. The probability to go from node to node , can be computed as
| (1) |
where is the symmetric, weighted adjacency matrix of the structural network. For each pair of nodes and , we had two directed edges with weights and . We chose one direction by keeping only the highest probability (we kept both if they were equal), thus drastically reducing the presence of loops in the network.
The choice of removing some links was inspired by the works on the minimum spanning tree (MST) procedure applied to brain networks [123]. Similarly to our strategy, the MST filtering procedure eliminates any loop in the network, yet important information can be obtained on the brain network structure and function with implication in aging [124]. Despite such background, our choice still remains a modeling strategy that favors information propagation towards higher degree nodes. Note that the resulting effect is in line with the evidence that hubs in real networks tend to have less control power (mechanistically exerted by outgoing links), as they instead need to be efficiently accessed to control the rest of the network [125]. As for the reduction of loops, it is important to stress that this might lead to underestimate the number of controllable nodes, but not to introduce false positive results. This is because of the underlying k-walk theory by which a driver-target configuration is controllable if the length of the path from the driver to each target is unique [16].
Step-wise target controllability
We implemented the step-wise target controllability framework [21], that analyses the single-input target controllability problem, in which the interest is to study the role of a single driver node in controlling a target set of the system. We assumed the linear time invariant (LTI)dynamics
| (2) |
where describes the state of each node at time , is the adjacency matrix of the network, specifies the driver node that will receive an external input, is its external input (or control) signal, is the output vector, and is the output matrix identifying the target nodes.
Such a system is controllable if it can be guided from any initial state to any desired final state in finite time, with a suitable choice of input.
A necessary and sufficient condition to assess the controllability of Eq. 2, is that the controllability matrix
| (3) |
has full row rank, i.e. rank. That is the Kalman rank condition, which basically verifies the existence of linearly independent rows in [126, 127]. If so, the driver node can reach and control the dynamics of all the other nodes through independent walks of length at maximum.
If it is of interest to control only a target set of the network, specified in and consisting of nodes, then Eq. 2 can be reduced into a target controllability matrix , where filters the rows of interest corresponding to the targets. Now, the rank of gives the number of nodes in the target set that can be controlled by the driver.
To identify a driver-target configuration, we further introduce a hierarchy among the target nodes, so that we can order and relabel them from the most important one to the least, i.e. . Then we perform the following step-wise procedure for each candidate driver node.
-
•
Step 1. Initialization
-
–
Create a temporary empty target set
-
–
Set the number of controllable targets
-
–
-
•
Step 2. Repeat until termination criteria are met. For do
-
–
Add the -th target node to the target set
-
–
Build the subgraph containing the nodes on walks from the driver to the targets in
-
–
Compute the rank of the target controllability matrix
-
–
If rank() is full then else
-
–
-
–
-
•
Step 3. Output and
Eventually, the target control centrality is the number of controllable targets in , and the set contains the controllable targets with highest ranking.
Application to brain networks
In this specific application, we assumed that the states of the nodes/ROIs were influenced by the adjacency matrix corresponding to the directed structural connectome. The target sets were the structural systems (frontal, limbic, temporal, sensorimotor, parietal, occipital, Fig. S1). ROIs in the target system were ranked according to the group-averaged node strength obtained from the fMRI functional brain network (Fig. 1, File S1).
More precisely, we ranked the nodes in the target set in a descending order from the quantity , where is the node strength (i.e. the weighted sum of all the connections) of the node obtained from the fMRI functional network of the participant , and is the number of participants in the study. Node strengths quantify the tendency of brain areas to act as hubs which are crucial constituents of the overall information integration [128].
The target control centrality of each node is obtained via the stepwise procedure described above and gives the corresponding highest-ranked controllable configuration of target nodes. To obtain a more robust estimation, we derived an intergated measure of target control centrality by averaging the results from the connectomes thresholded with different connection densities [129]. Specifically, for each participant, we retained the strongest links so to have networks with mean node degree ranging from to . This upper limit corresponded to the lowest number of links found after directing the connectomes.
System regulation score
To quantify how the target control centrality of a system is globally distributed across the other target systems we introduced the so-called system regulation score . Given two brain systems and the regulation score reads as
| (4) |
where is the reference system , is the set of all nodes in the brain network, and is the target control centrality of each node in the system over the target system . When , we specifically talk about self-regulation.
Statistical analysis
All statistical analysis were performed with a statistical threshold of , adjusted via a false-discovery rate (FDR) procedure in the case of multiple tests [130].
Funding and/or Conflicts of interests/Competing interests
Authors would like to acknowledge Thibault Rolland (fr.linkedin.com/in/thibault-rolland-40b57419a) for the realization of Picture 1. The research leading to these results has received funding from the French government under management of Agence Nationale de la Recherche as part of the ”Investissements d’avenir” program, reference ANR-19-P3IA-0001 (PRAIRIE 3IA Institute) and reference ANR-10-IAIHU-06 (Agence Nationale de la Recherche-10-IA Institut Hospitalo-Universitaire-6), and from the Inria Project Lab Program (project Neuromarkers), the European Research Council (ERC) under the European Unions Horizon 2020 research and innovation programme (Grant Agreement No. 864729). The content is solely the responsibility of the authors and does not necessarily represent the official views of any of the funding agencies. Authors declare no conflict of interest.
Data availability statement
All the experimental data used in this work are fully accessible from the NKI-Rockland database [119].
References
- 1. Botvinick M, Braver T. Motivation and Cognitive Control: From Behavior to Neural Mechanism. Annual Review of Psychology. 2015;66(1):83–113. doi:10.1146/annurev-psych-010814-015044.
- 2. Cocchi L, Zalesky A, Fornito A, Mattingley JB. Dynamic Cooperation and Competition between Brain Systems during Cognitive Control. Trends in Cognitive Sciences. 2013;17(10):493–501. doi:10.1016/j.tics.2013.08.006.
- 3. Gu S, Pasqualetti F, Cieslak M, Telesford QK, Yu AB, Kahn AE, et al. Controllability of Structural Brain Networks. Nature Communications. 2015;6:8414. doi:10.1038/ncomms9414.
- 4. Yan G, Vértes PE, Towlson EK, Chew YL, Walker DS, Schafer WR, et al. Network Control Principles Predict Neuron Function in the Caenorhabditis Elegans Connectome. Nature. 2017;advance online publication. doi:10.1038/nature24056.
- 5. Ravindran V, V S, Bagler G. Identification of Critical Regulatory Genes in Cancer Signaling Network Using Controllability Analysis. Physica A: Statistical Mechanics and its Applications. 2017;474:134–143. doi:10.1016/j.physa.2017.01.059.
- 6. Ravindran V, Nacher JC, Akutsu T, Ishitsuka M, Osadcenco A, Sunitha V, et al. Network Controllability Analysis of Intracellular Signalling Reveals Viruses Are Actively Controlling Molecular Systems. Scientific Reports. 2019;9(1):2066. doi:10.1038/s41598-018-38224-9.
- 7. Vinayagam A, Gibson TE, Lee HJ, Yilmazel B, Roesel C, Hu Y, et al. Controllability Analysis of the Directed Human Protein Interaction Network Identifies Disease Genes and Drug Targets. Proceedings of the National Academy of Sciences. 2016; p. 201603992. doi:10.1073/pnas.1603992113.
- 8. Tang E, Bassett DS. Colloquium: Control of Dynamics in Brain Networks. Reviews of Modern Physics. 2018;90(3):031003. doi:10.1103/RevModPhys.90.031003.
- 9. Muldoon SF, Pasqualetti F, Gu S, Cieslak M, Grafton ST, Vettel JM, et al. Stimulation-Based Control of Dynamic Brain Networks. PLOS Computational Biology. 2016;12(9):e1005076. doi:10.1371/journal.pcbi.1005076.
- 10. Pasqualetti F, Zampieri S, Bullo F. Controllability Metrics, Limitations and Algorithms for Complex Networks. IEEE Transactions on Control of Network Systems. 2014;1(1):40–52. doi:10.1109/TCNS.2014.2310254.
- 11. Bikson M, Grossman P, Thomas C, Zannou AL, Jiang J, Adnan T, et al. Safety of Transcranial Direct Current Stimulation: Evidence Based Update 2016. Brain Stimulation. 2016 Sep-Oct;9(5):641–661. doi:10.1016/j.brs.2016.06.004.
- 12. Wilson D, Moehlis J. Clustered Desynchronization from High-Frequency Deep Brain Stimulation. PLOS Computational Biology. 2015;11(12):e1004673. doi:10.1371/journal.pcbi.1004673.
- 13. Jiang J, Lai YC. Irrelevance of Linear Controllability to Nonlinear Dynamical Networks. Nature Communications. 2019;10(1):3961. doi:10.1038/s41467-019-11822-5.
- 14. Suweis S, Tu C, Rocha RP, Zampieri S, Zorzi M, Corbetta M. Brain Controllability: Not a Slam Dunk Yet. NeuroImage. 2019;200:552–555. doi:10.1016/j.neuroimage.2019.07.012.
- 15. Tu C, Rocha RP, Corbetta M, Zampieri S, Zorzi M, Suweis S. Warnings and Caveats in Brain Controllability. NeuroImage. 2018;176:83–91. doi:10.1016/j.neuroimage.2018.04.010.
- 16. Gao J, Liu YY, D’Souza RM, Barabási AL. Target Control of Complex Networks. Nature Communications. 2014;5:5415. doi:10.1038/ncomms6415.
- 17. Chen H, Yong EH. Optimizing Target Nodes Selection for the Control Energy of Directed Complex Networks. Scientific Reports. 2020;10(1):18112. doi:10.1038/s41598-020-75101-w.
- 18. Zhao T, Cao M, Niu H, Zuo XN, Evans A, He Y, et al. Age-Related Changes in the Topological Organization of the White Matter Structural Connectome across the Human Lifespan. Human Brain Mapping. 2015;36(10):3777–3792. doi:10.1002/hbm.22877.
- 19. Gong G, Rosa-Neto P, Carbonell F, Chen ZJ, He Y, Evans AC. Age- and Gender-Related Differences in the Cortical Anatomical Network. Journal of Neuroscience. 2009;29(50):15684–15693. doi:10.1523/JNEUROSCI.2308-09.2009.
- 20. Brown JA, Van Horn JD. Connected Brains and Minds—The UMCD Repository for Brain Connectivity Matrices. NeuroImage. 2016;124:1238–1241. doi:10.1016/j.neuroimage.2015.08.043.
- 21. Bassignana G, Fransson J, Henry V, Colliot O, Zujovic V, De Vico Fallani F. Stepwise Target Controllability Identifies Dysregulations of Macrophage Networks in Multiple Sclerosis. Network Neuroscience. 2021;5(2):337–357. doi:10.1162/netna00180.
- 22. Zhang M, Savill N, Margulies DS, Smallwood J, Jefferies E. Distinct Individual Differences in Default Mode Network Connectivity Relate to Off-Task Thought and Text Memory during Reading. Scientific Reports. 2019;9(1):16220. doi:10.1038/s41598-019-52674-9.
- 23. Xu X, Yuan H, Lei X. Activation and Connectivity within the Default Mode Network Contribute Independently to Future-Oriented Thought. Scientific Reports. 2016;6(1):1–10. doi:10.1038/srep21001.
- 24. Davey J, Thompson HE, Hallam G, Karapanagiotidis T, Murphy C, De Caso I, et al. Exploring the Role of the Posterior Middle Temporal Gyrus in Semantic Cognition: Integration of Anterior Temporal Lobe with Executive Processes. NeuroImage. 2016;137:165–177. doi:10.1016/j.neuroimage.2016.05.051.
- 25. Scheltens P, Leys D, Barkhof F, Huglo D, Weinstein HC, Vermersch P, et al. Atrophy of Medial Temporal Lobes on MRI in ”Probable” Alzheimer’s Disease and Normal Ageing: Diagnostic Value and Neuropsychological Correlates. Journal of Neurology, Neurosurgery & Psychiatry. 1992;55(10):967–972. doi:10.1136/jnnp.55.10.967.
- 26. Charras P, Herbet G, Deverdun J, de Champfleur NM, Duffau H, Bartolomeo P, et al. Functional Reorganization of the Attentional Networks in Low-Grade Glioma Patients: A Longitudinal Study. Cortex. 2015;63:27–41. doi:10.1016/j.cortex.2014.08.010.
- 27. Salvalaggio A, De Filippo De Grazia M, Zorzi M, Thiebaut de Schotten M, Corbetta M. Post-Stroke Deficit Prediction from Lesion and Indirect Structural and Functional Disconnection. Brain. 2020;143(7):2173–2188. doi:10.1093/brain/awaa156.
- 28. Corbetta M, Patel G, Shulman GL. The Reorienting System of the Human Brain: From Environment to Theory of Mind. Neuron. 2008;58(3):306–324. doi:10.1016/j.neuron.2008.04.017.
- 29. Husain M, Nachev P. Space and the Parietal Cortex. Trends in Cognitive Sciences. 2007;11(1):30–36. doi:10.1016/j.tics.2006.10.011.
- 30. Bartolomeo P, Seidel Malkinson T. Hemispheric Lateralization of Attention Processes in the Human Brain. Current Opinion in Psychology. 2019;29:90–96. doi:10.1016/j.copsyc.2018.12.023.
- 31. Gotts SJ, Jo HJ, Wallace GL, Saad ZS, Cox RW, Martin A. Two Distinct Forms of Functional Lateralization in the Human Brain. Proceedings of the National Academy of Sciences. 2013;doi:10.1073/pnas.1302581110.
- 32. Koch G, Cercignani M, Bonnì S, Giacobbe V, Bucchi G, Versace V, et al. Asymmetry of Parietal Interhemispheric Connections in Humans. Journal of Neuroscience. 2011;31(24):8967–8975. doi:10.1523/JNEUROSCI.6567-10.2011.
- 33. Cui Z, Stiso J, Baum GL, Kim JZ, Roalf DR, Betzel RF, et al. Optimization of Energy State Transition Trajectory Supports the Development of Executive Function during Youth. eLife. 2020;9:e53060. doi:10.7554/eLife.53060.
- 34. Medaglia JD, Harvey DY, White N, Kelkar A, Zimmerman J, Bassett DS, et al. Network Controllability in the Inferior Frontal Gyrus Relates to Controlled Language Variability and Susceptibility to TMS. Journal of Neuroscience. 2018;38(28):6399–6410.
- 35. Honey CJ, Thivierge JP, Sporns O. Can Structure Predict Function in the Human Brain? NeuroImage. 2010;52(3):766–776. doi:10.1016/j.neuroimage.2010.01.071.
- 36. Narayanan NS, Kimchi EY, Laubach M. Redundancy and Synergy of Neuronal Ensembles in Motor Cortex. The Journal of Neuroscience. 2005;25(17):4207–4216. doi:10.1523/JNEUROSCI.4697-04.2005.
- 37. Paquola C, Wael RVD, Wagstyl K, Bethlehem RAI, Hong SJ, Seidlitz J, et al. Microstructural and Functional Gradients Are Increasingly Dissociated in Transmodal Cortices. PLOS Biology. 2019;17(5):e3000284. doi:10.1371/journal.pbio.3000284.
- 38. Shafiei G, Markello RD, Vos de Wael R, Bernhardt BC, Fulcher BD, Misic B. Topographic Gradients of Intrinsic Dynamics across Neocortex. eLife. 2020;9:e62116. doi:10.7554/eLife.62116.
- 39. Wang XJ. Macroscopic Gradients of Synaptic Excitation and Inhibition in the Neocortex. Nature Reviews Neuroscience. 2020;21(3):169–178. doi:10.1038/s41583-020-0262-x.
- 40. Vázquez-Rodríguez B, Suárez LE, Markello RD, Shafiei G, Paquola C, Hagmann P, et al. Gradients of Structure–Function Tethering across Neocortex. Proceedings of the National Academy of Sciences. 2019;116(42):21219–21227. doi:10.1073/pnas.1903403116.
- 41. Demirtaş M, Burt JB, Helmer M, Ji JL, Adkinson BD, Glasser MF, et al. Hierarchical Heterogeneity across Human Cortex Shapes Large-Scale Neural Dynamics. Neuron. 2019;101(6):1181–1194.e13. doi:10.1016/j.neuron.2019.01.017.
- 42. Sohn H, Meirhaeghe N, Rajalingham R, Jazayeri M. A Network Perspective on Sensorimotor Learning. Trends in Neurosciences. 2021;44(3):170–181. doi:10.1016/j.tins.2020.11.007.
- 43. Bassett DS, Yang M, Wymbs NF, Grafton ST. Learning-Induced Autonomy of Sensorimotor Systems. Nature Neuroscience. 2015;18(5):744–751. doi:10.1038/nn.3993.
- 44. Adolphs R, Damasio H, Tranel D, Cooper G, Damasio AR. A Role for Somatosensory Cortices in the Visual Recognition of Emotion as Revealed by Three-Dimensional Lesion Mapping. Journal of Neuroscience. 2000;20(7):2683–2690. doi:10.1523/JNEUROSCI.20-07-02683.2000.
- 45. Kong X, Kong R, Orban C, Wang P, Zhang S, Anderson K, et al. Sensory-Motor Cortices Shape Functional Connectivity Dynamics in the Human Brain. Nature Communications. 2021;12(1):6373. doi:10.1038/s41467-021-26704-y.
- 46. Rolls ET. Limbic Systems for Emotion and for Memory, but No Single Limbic System. Cortex. 2015;62:119–157. doi:10.1016/j.cortex.2013.12.005.
- 47. Catani M, Dell’acqua F, Thiebaut de Schotten M. A Revised Limbic System Model for Memory, Emotion and Behaviour. Neuroscience and Biobehavioral Reviews. 2013;37(8):1724–1737. doi:10.1016/j.neubiorev.2013.07.001.
- 48. Kaas JH. The Evolution of Isocortex. Brain, Behavior and Evolution. 1995;46(4-5):187–196. doi:10.1159/000113273.
- 49. Rasia-Filho AA, Guerra KTK, Vásquez CE, Dall’Oglio A, Reberger R, Jung CR, et al. The Subcortical-Allocortical- Neocortical Continuum for the Emergence and Morphological Heterogeneity of Pyramidal Neurons in the Human Brain. Frontiers in Synaptic Neuroscience. 2021;13:7. doi:10.3389/fnsyn.2021.616607.
- 50. Bakkour A, Morris JC, Wolk DA, Dickerson BC. The Effects of Aging and Alzheimer’s Disease on Cerebral Cortical Anatomy: Specificity and Differential Relationships with Cognition. NeuroImage. 2013;76:332–344. doi:10.1016/j.neuroimage.2013.02.059.
- 51. Damoiseaux JS, Smith SM, Witter MP, Sanz-Arigita EJ, Barkhof F, Scheltens P, et al. White Matter Tract Integrity in Aging and Alzheimer’s Disease. Human Brain Mapping. 2009;30(4):1051–1059. doi:10.1002/hbm.20563.
- 52. Allen JS, Bruss J, Brown CK, Damasio H. Normal Neuroanatomical Variation Due to Age: The Major Lobes and a Parcellation of the Temporal Region. Neurobiology of Aging. 2005;26(9):1245–1260. doi:10.1016/j.neurobiolaging.2005.05.023.
- 53. Bernard JA, Seidler RD. Evidence for Motor Cortex Dedifferentiation in Older Adults. Neurobiology of Aging. 2012;33(9):1890–1899. doi:10.1016/j.neurobiolaging.2011.06.021.
- 54. Voss MW, Erickson KI, Chaddock L, Prakash RS, Colcombe SJ, Morris KS, et al. Dedifferentiation in the visual cortex: an fMRI investigation of individual differences in older adults. Brain Res. 2008;1244:121–131. doi:10.1016/j.brainres.2008.09.051.
- 55. Cabeza R, Daselaar SM, Dolcos F, Prince SE, Budde M, Nyberg L. Task-Independent and Task-specific Age Effects on Brain Activity during Working Memory, Visual Attention and Episodic Retrieval. Cerebral Cortex. 2004;14(4):364–375. doi:10.1093/cercor/bhg133.
- 56. Park DC, Reuter-Lorenz P. The Adaptive Brain: Aging and Neurocognitive Scaffolding. Annual Review of Psychology. 2009;60(1):173–196. doi:10.1146/annurev.psych.59.103006.093656.
- 57. Hampson M, Tokoglu F, Shen X, Scheinost D, Papademetris X, Constable RT. Intrinsic Brain Connectivity Related to Age in Young and Middle Aged Adults. PLOS ONE. 2012;7(9):e44067. doi:10.1371/journal.pone.0044067.
- 58. Bagarinao E, Watanabe H, Maesawa S, Mori D, Hara K, Kawabata K, et al. Aging Impacts the Overall Connectivity Strength of Regions Critical for Information Transfer Among Brain Networks. Frontiers in Aging Neuroscience. 2020;12. doi:10.3389/fnagi.2020.592469.
- 59. Bagarinao E, Watanabe H, Maesawa S, Mori D, Hara K, Kawabata K, et al. Reorganization of Brain Networks and Its Association with General Cognitive Performance over the Adult Lifespan. Scientific Reports. 2019;9(1):11352. doi:10.1038/s41598-019-47922-x.
- 60. Geerligs L, Renken RJ, Saliasi E, Maurits NM, Lorist MM. A Brain-Wide Study of Age-Related Changes in Functional Connectivity. Cerebral Cortex. 2015;25(7):1987–1999. doi:10.1093/cercor/bhu012.
- 61. Betzel RF, Byrge L, He Y, Goñi J, Zuo XN, Sporns O. Changes in Structural and Functional Connectivity among Resting-State Networks across the Human Lifespan. NeuroImage. 2014;102:345–357. doi:10.1016/j.neuroimage.2014.07.067.
- 62. Song J, Birn RM, Boly M, Meier TB, Nair VA, Meyerand ME, et al. Age-Related Reorganizational Changes in Modularity and Functional Connectivity of Human Brain Networks. Brain Connectivity. 2014;4(9):662–676. doi:10.1089/brain.2014.0286.
- 63. Spreng RN, Stevens WD, Viviano JD, Schacter DL. Attenuated Anticorrelation between the Default and Dorsal Attention Networks with Aging: Evidence from Task and Rest. Neurobiology of Aging. 2016;45:149–160. doi:10.1016/j.neurobiolaging.2016.05.020.
- 64. Tang E, Giusti C, Baum GL, Gu S, Pollock E, Kahn AE, et al. Developmental Increases in White Matter Network Controllability Support a Growing Diversity of Brain Dynamics. Nature Communications. 2017;8(1):1252. doi:10.1038/s41467-017-01254-4.
- 65. Kubicki A, Fautrelle L, Bourrelier J, Rouaud O, Mourey F. The Early Indicators of Functional Decrease in Mild Cognitive Impairment. Frontiers in Aging Neuroscience. 2016;8.
- 66. Behfar Q, Behfar SK, von Reutern B, Richter N, Dronse J, Fassbender R, et al. Graph Theory Analysis Reveals Resting-State Compensatory Mechanisms in Healthy Aging and Prodromal Alzheimer’s Disease. Frontiers in Aging Neuroscience. 2020;12.
- 67. Guillon J, Chavez M, Battiston F, Attal Y, La Corte V, Thiebaut de Schotten M, et al. Disrupted Core-Periphery Structure of Multimodal Brain Networks in Alzheimer’s Disease. Network Neuroscience. 2019;3(2):635–652.
- 68. Hoffman P, Morcom AM. Age-Related Changes in the Neural Networks Supporting Semantic Cognition: A Meta-Analysis of 47 Functional Neuroimaging Studies. Neuroscience & Biobehavioral Reviews. 2018;84:134–150. doi:10.1016/j.neubiorev.2017.11.010.
- 69. Grady C, Sarraf S, Saverino C, Campbell K. Age Differences in the Functional Interactions among the Default, Frontoparietal Control, and Dorsal Attention Networks. Neurobiology of Aging. 2016;41:159–172. doi:10.1016/j.neurobiolaging.2016.02.020.
- 70. Li SC, Rieckmann A. Neuromodulation and Aging: Implications of Aging Neuronal Gain Control on Cognition. Current Opinion in Neurobiology. 2014;29:148–158. doi:10.1016/j.conb.2014.07.009.
- 71. Chan MY, Park DC, Savalia NK, Petersen SE, Wig GS. Decreased Segregation of Brain Systems across the Healthy Adult Lifespan. Proceedings of the National Academy of Sciences. 2014;111(46):E4997–E5006. doi:10.1073/pnas.1415122111.
- 72. de Schotten MT, Urbanski M, Duffau H, Volle E, Lévy R, Dubois B, et al. Direct Evidence for a Parietal-Frontal Pathway Subserving Spatial Awareness in Humans. Science. 2005;309(5744):2226–2228. doi:10.1126/science.1116251.
- 73. Grady C. The Cognitive Neuroscience of Ageing. Nature Reviews Neuroscience. 2012;13(7):491–505. doi:10.1038/nrn3256.
- 74. Duda BM, Owens MM, Hallowell ES, Sweet LH. Neurocompensatory Effects of the Default Network in Older Adults. Frontiers in Aging Neuroscience. 2019;11:111. doi:10.3389/fnagi.2019.00111.
- 75. Morcom AM, Johnson W. Neural Reorganization and Compensation in Aging. Journal of Cognitive Neuroscience. 2015;27(7):1275–1285.
- 76. Buckner RL, Andrews-Hanna JR, Schacter DL. The Brain’s Default Network. Annals of the New York Academy of Sciences. 2008;1124(1):1–38. doi:10.1196/annals.1440.011.
- 77. Logan JM, Sanders AL, Snyder AZ, Morris JC, Buckner RL. Under-Recruitment and Nonselective Recruitment: Dissociable Neural Mechanisms Associated with Aging. Neuron. 2002;33(5):827–840. doi:10.1016/S0896-6273(02)00612-8.
- 78. Corbetta M, Shulman GL. Control of Goal-Directed and Stimulus-Driven Attention in the Brain. Nature Reviews Neuroscience. 2002;3(3):201–215. doi:10.1038/nrn755.
- 79. Shulman GL, Pope DLW, Astafiev SV, McAvoy MP, Snyder AZ, Corbetta M. Right Hemisphere Dominance during Spatial Selective Attention and Target Detection Occurs Outside the Dorsal Frontoparietal Network. Journal of Neuroscience. 2010;30(10):3640–3651. doi:10.1523/JNEUROSCI.4085-09.2010.
- 80. Murray SO, Wojciulik E. Attention Increases Neural Selectivity in the Human Lateral Occipital Complex. Nature Neuroscience. 2004;7(1):70–74. doi:10.1038/nn1161.
- 81. Cabeza R. Hemispheric Asymmetry Reduction in Older Adults: The HAROLD Model. Psychology and Aging. 2002;17(1):85–100. doi:10.1037//0882-7974.17.1.85.
- 82. Tomasi D, Volkow ND. Aging and Functional Brain Networks. Molecular Psychiatry. 2012;17(5):549–558. doi:10.1038/mp.2011.81.
- 83. Spreng RN, Turner GR. The Shifting Architecture of Cognition and Brain Function in Older Adulthood. Perspectives on Psychological Science. 2019;14(4):523–542. doi:10.1177/1745691619827511.
- 84. Medaglia JD, Pasqualetti F, Hamilton RH, Thompson-Schill SL, Bassett DS. Brain and Cognitive Reserve: Translation via Network Control Theory. Neuroscience & Biobehavioral Reviews. 2017;75:53–64. doi:10.1016/j.neubiorev.2017.01.016.
- 85. Cheng L, Wu Z, Fu Y, Miao F, Sun J, Tong S. Reorganization of Functional Brain Networks during the Recovery of Stroke: A Functional MRI Study. In: 2012 Annual International Conference of the IEEE Engineering in Medicine and Biology Society; 2012. p. 4132–4135.
- 86. Zhu Y, Bai L, Liang P, Kang S, Gao H, Yang H. Disrupted Brain Connectivity Networks in Acute Ischemic Stroke Patients. Brain Imaging and Behavior. 2017;11(2):444–453. doi:10.1007/s11682-016-9525-6.
- 87. Mancuso L, Costa T, Nani A, Manuello J, Liloia D, Gelmini G, et al. The Homotopic Connectivity of the Functional Brain: A Meta-Analytic Approach. Scientific Reports. 2019;9(1):3346. doi:10.1038/s41598-019-40188-3.
- 88. Tang C, Zhao Z, Chen C, Zheng X, Sun F, Zhang X, et al. Decreased Functional Connectivity of Homotopic Brain Regions in Chronic Stroke Patients: A Resting State fMRI Study. PLOS ONE. 2016;11(4):e0152875. doi:10.1371/journal.pone.0152875.
- 89. Grefkes C, Fink GR. Connectivity-Based Approaches in Stroke and Recovery of Function. The Lancet Neurology. 2014;13(2):206–216. doi:10.1016/S1474-4422(13)70264-3.
- 90. Buetefisch CM. Role of the Contralesional Hemisphere in Post-Stroke Recovery of Upper Extremity Motor Function. Frontiers in Neurology. 2015;6:214. doi:10.3389/fneur.2015.00214.
- 91. Bartolomeo P, Thiebaut de Schotten M. Let Thy Left Brain Know What Thy Right Brain Doeth: Inter-hemispheric Compensation of Functional Deficits after Brain Damage. Neuropsychologia. 2016;93:407–412. doi:10.1016/j.neuropsychologia.2016.06.016.
- 92. Bartolomeo P. From Competition to Cooperation: Visual Neglect across the Hemispheres. Revue Neurologique. 2021;177(9):1104–1111. doi:10.1016/j.neurol.2021.07.015.
- 93. Kullmann DM. Editorial. Brain. 2019;142(4):833. doi:10.1093/brain/awz077.
- 94. Reich DS, Mechler F, Victor JD. Independent and Redundant Information in Nearby Cortical Neurons. Science. 2001;294(5551):2566–2568. doi:10.1126/science.1065839.
- 95. So K, Ganguly K, Jimenez J, Gastpar MC, Carmena JM. Redundant Information Encoding in Primary Motor Cortex during Natural and Prosthetic Motor Control. Journal of Computational Neuroscience. 2012;32(3):555–561. doi:10.1007/s10827-011-0369-1.
- 96. Griffis JC, Metcalf NV, Corbetta M, Shulman GL. Structural Disconnections Explain Brain Network Dysfunction after Stroke. Cell Reports. 2019;28(10):2527–2540.e9. doi:10.1016/j.celrep.2019.07.100.
- 97. Betzel RF, Gu S, Medaglia JD, Pasqualetti F, Bassett DS. Optimally Controlling the Human Connectome: The Role of Network Topology. Scientific Reports. 2016;6(1):30770. doi:10.1038/srep30770.
- 98. Dosenbach NUF, Nardos B, Cohen AL, Fair DA, Power JD, Church JA, et al. Prediction of Individual Brain Maturity Using fMRI. Science. 2010;329(5997):1358–1361. doi:10.1126/science.1194144.
- 99. Fair DA, Cohen AL, Power JD, Dosenbach NUF, Church JA, Miezin FM, et al. Functional Brain Networks Develop from a “Local to Distributed” Organization. PLOS Computational Biology. 2009;5(5):e1000381. doi:10.1371/journal.pcbi.1000381.
- 100. Supekar K, Menon V. Developmental Maturation of Dynamic Causal Control Signals in Higher-Order Cognition: A Neurocognitive Network Model. PLOS Computational Biology. 2012;8(2):e1002374. doi:10.1371/journal.pcbi.1002374.
- 101. Giza CC, Prins ML. Is Being Plastic Fantastic? Mechanisms of Altered Plasticity after Developmental Traumatic Brain Injury. Developmental Neuroscience. 2006;28(4-5):364–379. doi:10.1159/000094163.
- 102. Kornfeld S, Delgado Rodríguez JA, Everts R, Kaelin-Lang A, Wiest R, Weisstanner C, et al. Cortical Reorganisation of Cerebral Networks after Childhood Stroke: Impact on Outcome. BMC Neurology. 2015;15(1):90. doi:10.1186/s12883-015-0309-1.
- 103. Anderson V, Spencer-Smith M, Wood A. Do Children Really Recover Better? Neurobehavioural Plasticity after Early Brain Insult. Brain. 2011;134(8):2197–2221. doi:10.1093/brain/awr103.
- 104. Max JE, Bruce M, Keatley E, Delis D. Pediatric Stroke: Plasticity, Vulnerability, and Age of Lesion Onset. The Journal of Neuropsychiatry and Clinical Neurosciences. 2010;22(1):30–39. doi:10.1176/jnp.2010.22.1.30.
- 105. Dennis M, Spiegler BJ, Juranek JJ, Bigler ED, Snead OC, Fletcher JM. Age, Plasticity, and Homeostasis in Childhood Brain Disorders. Neuroscience & Biobehavioral Reviews. 2013;37(10, Part 2):2760–2773. doi:10.1016/j.neubiorev.2013.09.010.
- 106. Liu YY, Barabási AL. Control Principles of Complex Networks. Reviews of Modern Physics. 2016;88(3). doi:10.1103/RevModPhys.88.035006.
- 107. Slotine JJ, Li W. Applied Nonlinear Control. Englewood Cliffs, N.J: Pearson; 1991.
- 108. Kerepesi C, Szalkai B, Varga B, Grolmusz V. How to Direct the Edges of the Connectomes: Dynamics of the Consensus Connectomes and the Development of the Connections in the Human Brain. PLOS ONE. 2016;11(6):e0158680. doi:10.1371/journal.pone.0158680.
- 109. Seguin C, Razi A, Zalesky A. Inferring Neural Signalling Directionality from Undirected Structural Connectomes. Nature Communications. 2019;10(1):1–13. doi:10.1038/s41467-019-12201-w.
- 110. Worrell JC, Rumschlag J, Betzel RF, Sporns O, Mišić B. Optimized Connectome Architecture for Sensory-Motor Integration. Network Neuroscience. 2017;1(4):415–430.
- 111. Goñi J, Avena-Koenigsberger A, Velez de Mendizabal N, van den Heuvel MP, Betzel RF, Sporns O. Exploring the Morphospace of Communication Efficiency in Complex Networks. PLoS ONE. 2013;8(3):e58070. doi:10.1371/journal.pone.0058070.
- 112. Avena-Koenigsberger A, Misic B, Sporns O. Communication Dynamics in Complex Brain Networks. Nature Reviews Neuroscience. 2018;19(1):17–33. doi:10.1038/nrn.2017.149.
- 113. Raj A, Kuceyeski A, Weiner M. A Network Diffusion Model of Disease Progression in Dementia. Neuron. 2012;73(6):1204–1215. doi:10.1016/j.neuron.2011.12.040.
- 114. Abdelnour F, Dayan M, Devinsky O, Thesen T, Raj A. Functional Brain Connectivity Is Predictable from Anatomic Network’s Laplacian Eigen-Structure. NeuroImage. 2018;172:728–739. doi:10.1016/j.neuroimage.2018.02.016.
- 115. Dubois J, de Berker AO, Tsao DY. Single-Unit Recordings in the Macaque Face Patch System Reveal Limitations of fMRI MVPA. Journal of Neuroscience. 2015;35(6):2791–2802. doi:10.1523/JNEUROSCI.4037-14.2015.
- 116. Schilling KG, Janve V, Gao Y, Stepniewska I, Landman BA, Anderson AW. Histological Validation of Diffusion MRI Fiber Orientation Distributions and Dispersion. NeuroImage. 2018;165:200–221. doi:10.1016/j.neuroimage.2017.10.046.
- 117. Huntenburg JM, Bazin PL, Margulies DS. Large-Scale Gradients in Human Cortical Organization. Trends in Cognitive Sciences. 2018;22(1):21–31. doi:10.1016/j.tics.2017.11.002.
- 118. Malkinson TS, Bayle DJ, Bourgeois A, Lehongre K, Fernandez-Vidal S, Navarro V, et al. From Perception to Action: Intracortical Recordings Reveal Cortical Gradients of Human Exogenous Attention. biorxiv. 2021;doi:10.1101/2021.01.02.425103.
- 119. Nooner KB, Colcombe S, Tobe R, Mennes M, Benedict M, Moreno A, et al. The NKI-Rockland Sample: A Model for Accelerating the Pace of Discovery Science in Psychiatry. Frontiers in Neuroscience. 2012;6. doi:10.3389/fnins.2012.00152.
- 120. Brown J, Rudie J, Bandrowski A, Van Horn J, Bookheimer S. The UCLA Multimodal Connectivity Database: A Web-Based Platform for Brain Connectivity Matrix Sharing and Analysis. Frontiers in Neuroinformatics. 2012;6.
- 121. Craddock RC, James GA, Holtzheimer PE, Hu XP, Mayberg HS. A Whole Brain fMRI Atlas Generated via Spatially Constrained Spectral Clustering. Human Brain Mapping. 2012;33(8):1914–1928. doi:10.1002/hbm.21333.
- 122. Gómez-Gardeñes J, Latora V. Entropy Rate of Diffusion Processes on Complex Networks. Physical Review E. 2008;78(6):065102. doi:10.1103/PhysRevE.78.065102.
- 123. Tewarie P, van Dellen E, Hillebrand A, Stam CJ. The Minimum Spanning Tree: An Unbiased Method for Brain Network Analysis. NeuroImage. 2015;104:177–188. doi:10.1016/j.neuroimage.2014.10.015.
- 124. van Dellen E, Sommer IE, Bohlken MM, Tewarie P, Draaisma L, Zalesky A, et al. Minimum Spanning Tree Analysis of the Human Connectome. Human Brain Mapping. 2018;39(6):2455–2471. doi:10.1002/hbm.24014.
- 125. Liu YY, Slotine JJ, Barabási AL. Controllability of Complex Networks. Nature. 2011;473(7346):167–173. doi:10.1038/nature10011.
- 126. Kalman RE. Mathematical Description of Linear Dynamical Systems. Journal of the Society for Industrial and Applied Mathematics Series A Control. 1963;1(2):152–192. doi:10.1137/0301010.
- 127. Rugh WJ, Kailath T. Linear System Theory, 2nd Edition. 2nd ed. Upper Saddle River, NJ: Pearson; 1995.
- 128. van den Heuvel MP, Sporns O. Network Hubs in the Human Brain. Trends in Cognitive Sciences. 2013;17(12):683–696. doi:10.1016/j.tics.2013.09.012.
- 129. De Vico Fallani F, Richiardi J, Chavez M, Achard S. Graph analysis of functional brain networks: practical issues in translational neuroscience. Phil Trans R Soc B. 2014;369(1653):20130521. doi:10.1098/rstb.2013.0521.
- 130. Benjamini Y, Hochberg Y. Controlling the False Discovery Rate: A Practical and Powerful Approach to Multiple Testing. Journal of the Royal Statistical Society Series B (Methodological). 1995;57(1):289–300.