[7]G^ #1,#2_#3,#4(#5 #6— #7)
Probing ultra-light axions with the 21-cm Signal during Cosmic Dawn
Abstract
Ultra-light axions (ULAs) are a promising and intriguing set of dark-matter candidates. We study the prospects to use forthcoming measurements of 21-cm fluctuations from cosmic dawn to probe ULAs. We focus in particular on the velocity acoustic oscillations (VAOs) in the large-scale 21-cm power spectrum, features imprinted by the long-wavelength () modulation, by dark-matter–baryon relative velocities, of the small-scale () power required to produce the stars that heat the neutral hydrogen. Damping of small-scale power by ULAs reduces the star-formation rate at cosmic dawn which then leads to a reduced VAO amplitude. Accounting for different assumptions for feedback and foregrounds, experiments like HERA may be sensitive to ULAs with masses up to , two decades of mass higher than current constraints.
I Introduction
Next-generation cosmic microwave background (CMB) experiments such as the Simons Observatory (SO) (Aguirre et al., 2018; Lee et al., 2019) and CMB-S4 (Abazajian et al., 2016), galaxy surveys such as DESI (Aghamousa et al., 2016) and the Vera Rubin Observatory (VRO) (LSST Science Collaboration et al., 2009), as well as 21-cm experiments such as HERA (DeBoer et al., 2017) or SKA1-low Braun et al. (2019); Bacon et al. (2020) will soon generate a wealth of stringent new tests of the standard cosmological model and hopefully shed light on the nature of dark matter. Here, we consider ultra-light axions (ULAs), a dark-matter candidate that is compelling because of its possible connections to the strong-CP problem, galactic substructure, and string theory Arvanitaki et al. (2010); Marsh (2016).
Here we explore new probes of ULAs enabled by forthcoming measurements of fluctuations of the 21-cm line of neutral hydrogen during cosmic dawn. The galaxy-formation rate in any particular region of the Universe can be affected by the dark-matter–baryon relative velocity in that region. This thus introduces a fluctuation in galaxy-formation rate on the fairly large (Mpc-1) coherence scale of the linear-theory dark-matter–baryon relative velocity Tseliakhovich and Hirata (2010). The oscillations in the dark-matter–baryon relative-velocity power spectrum are thus imprinted in the power spectrum of 21-cm fluctuations from cosmic dawn Dalal et al. (2010); Naoz et al. (2012); Greif et al. (2011); McQuinn and O’Leary (2012); Stacy et al. (2011); Naoz et al. (2012); Fialkov et al. (2012); Yoo et al. (2011); Pritchard and Loeb (2012); Ali-Haïmoud et al. (2014); Barkana (2016); Muñoz (2019a, b); Muñoz et al. (2020); Hotinli et al. (2021).
ULAs (and other models of ultralight bosonic dark mater) differ from standard cold dark matter (CDM) due to their astrophysically large de Broglie wavelength, which leads to an effective sound speed in the ULA density perturbations, suppressing the growth of cosmic structure relative to CDM Khlopov et al. (1985); Arvanitaki et al. (2010); Marsh and Ferreira (2010).111Note that recent studies of ULAs using -body simulations suggest interference effects which can lead to effect on the matter power-spectrum on scales comparable to the de Broglie wavelength of the fluid (see e.g. Refs. (Li et al., 2019; Zhang et al., 2019; Veltmaat et al., 2020; Schwabe and Niemeyer, 2022)), which we will omit in this paper. The intereference and vorticity effects that are not captured by the fluid formulation we use here are unlikely to be significant at the power spectrum level, although a possible effect on early star formation is still an open question (Nori et al., 2019; Mocz et al., 2019). This effect, and other effects related to the ULA wavelength, can be probed by a wide variety of astrophysical and cosmological measurements Amendola and Barbieri (2006); Arvanitaki et al. (2010); Marsh (2016); Hui et al. (2017); Marsh and Hoof (2021). The CMB and galaxy surveys establish a lower bound on the ULA mass around , and probe the ULA density fraction at the percent level for lower masses Hlozek et al. (2015, 2018); Laguë et al. (2021). The lower limit can be improved by a variety of cosmological probes (e.g. Refs. Bozek et al. (2015); Schive et al. (2016); Corasaniti et al. (2017); Dentler et al. (2021)), with the strongest, , being provided by the Lyman-alpha forest flux power spectrum Rogers and Peiris (2021).
The prospects to use the 21-cm signal as probe the small-scale matter power spectrum during cosmic dawn were discussed in Ref. (Muñoz et al., 2020). Here we show that the velocity acoustic oscillations (VAOs) Muñoz (2019b) in the 21-cm power spectrum can extend the sensitivity to an ULA mass up to two orders of magnitude higher. The probe is quite robust to theoretical uncertainties as it relies on the linear-theory effects of ULAs, which are better understood than nonlinear effects. Ref. Marsh (2015) showed that if the ULA Jeans scale is larger than the baryon Jeans scale, then the modulation feature in the power spectrum caused by dark-matter–baryon relative motion is absent, thus suggesting that the VAO feature would also be absent. Ref. Marsh (2015) thus speculated that a future measurement of VAOs would be able to probe ULA particle masses around . The present work addresses this claim in more detail. We compute explicitly the 21-cm cosmic dawn VAO feature from simulations and calculate the sensitivity of its amplitude to the ULA Jeans scale following Refs. (Marsh, 2015; Dalal et al., 2010, 2010; Ali-Haïmoud et al., 2014; Muñoz et al., 2018; Muñoz, 2019a). We forecast the sensitivity of a realistic 21-cm measurement to this effect, accounting for foreground removal and baryonic feedback.
II The impact of relative velocities on the 21-cm power spectrum
II.1 The 21-cm hydrogen line
The absorption/emission of 21-cm photons by neutral hydrogen is determined by the of neutral hydrogen, which can be obtained from,
| (1) |
Here, and are the comoving number densities of the hydrogen atoms in the singlet and the triplet states, where and are their numbers of degrees of freedom, respectively. The temperature corresponding to the 21-cm hyperfine transition is K. The hydrogen emits (absorbs) photons from the CMB when the local spin temperature is higher (lower) than the CMB temperature. The distribution of these photons at the different wavelengths and at different redshifts can be used to infer the astrophysical and cosmological properties of our Universe.
Our observable is the 21-cm brightness temperature (Furlanetto et al., 2006),
where is the neutral-hydrogen fraction, is the line-of-sight gradient of the velocity, is the CMB temperature, is the baryon overdensity, and is the Hubble parameter (Barkana, 2016; Pritchard and Loeb, 2012; Furlanetto et al., 2006).
We define the cosmic-dawn era to be that when the first stars formed, starting around (Fialkov et al., 2014). After recombination, the gas kinetic temperature is dominated by adiabatic cooling and the spin temperature is coupled to the CMB temperature due to the high gas density and through collisions (Loeb and Zaldarriaga, 2004). Towards the the end of the dark ages, collisional coupling of hydrogen becomes ineffective and the 21-cm signal becomes small. The first stars produce UV photons that redshift into the Lyman- line and couple the kinetic and spin temperatures of hydrogen in the intergalactic medium (IGM) via the Wouthuysen-Field effect (Wouthuysen, 1952; Field, 1958; Hirata, 2006). Remnants of these first stars likely produce a background of -rays (Pacucci et al., 2014; Pritchard and Furlanetto, 2007) heating the IGM before reionization progresses largely after (Morales and Wyithe, 2010; Mesinger, 2017; Wise, 2019). Toward the end of reionization (), Lyman-Werner feedback reduces the effects of streaming velocities in the IGM on the 21-cm signal(Fialkov et al., 2014; Loeb and Furlanetto, 2013).
We model the 21-cm fluctuations during cosmic-dawn with semi-numerical simulations provided by 21cmvFAST222github.com/JulianBMunoz/21cmvFAST, which is built upon 21cmFAST333github.com/andreimesinger/21cmFAST. Initial conditions for peculiar velocity and density fields are set at with a Gaussian random field in Lagrangian space, before being evolved with the Zel’dovich approximation (Zel’Dovich, 1970) to match the mean collapse fraction for the conditional Sheth-Tormen halo mass function (Sheth and Tormen, 1999). The photon emission rates of the sources embedded in each halo are assumed proportional to the increase of the total collapsed halo mass. The excursion set formalism is used in each cell to estimate the mean number of sources contributing to the gas temperature from the surroundings. The kinetic temperature is calculated including adiabatic expansion, Compton scattering with the CMB (Seager et al., 2011), and the inhomogeneous heating history of the IGM (please see for details on this calculation in Refs. (Mesinger et al., 2011; Murray et al., 2020)).
For each observed frequency, we produce realizations of the 21-cm signal of coeval cubes of size 2000 Mpc on 20003 grids. Each coeval cube is simulated at the respective redshift from an initial density field given by appropriate transfer functions for relative velocities and matter. The power spectrum of 21-cm fluctuations satisfy
| (3) |
where is the Fourier transform of , the zero-mean fluctuations of the 21-cm brightness temperature at redshift .
II.2 The impact of relative velocities
The modulation induced by the dark-matter–baryon relative velocities on the 21-cm power spectrum can be captured from the statistics of the collapsed baryonic density to a good approximation. Briefly, the effect of bulk relative velocities is analogous to that of the gas pressure, which suppresses the accretion of baryons. The bulk kinetic energy of the gas gets converted into thermal energy as it falls into the dark matter (DM) halo, resulting in a change in the effective sound speed , hence in the baryon collapsed fraction (Dalal et al., 2010; Naoz et al., 2012; Tseliakhovich et al., 2011; Greif et al., 2011; McQuinn and O’Leary, 2012; Stacy et al., 2011; Naoz et al., 2012; Fialkov et al., 2012; Yoo et al., 2011; Pritchard and Loeb, 2012; Barkana, 2016; Muñoz, 2019a). The effect of the relative velocities on the 21-cm brightness temperature power spectrum amplitude can then be parameterised as (Muñoz, 2019b)
| (4) |
where is some redshift-dependent amplitude of fluctuations. The window function depends on the various contributors to the 21-cm power spectrum such as Lyman- coupling and -ray heating. Here, we defined as the power spectrum of the quantity
| (5) |
which accurately captures the shape of the effect of relative velocities on the observables for the scales where the ‘streaming’ bulk relative velocity can be approximated with a root-mean-squared value at recombination (Tseliakhovich and Hirata, 2010). As the VAOs are statistically independent from the density fluctuations at first order, the amplitude of the 21-cm power spectrum can be written as
| (6) |
where is the component excluding VAOs. Throughout this paper we use a fourth-order polynomial to parametrise the smooth contribution to the spectra following Ref. Muñoz (2019a),
| (7) |
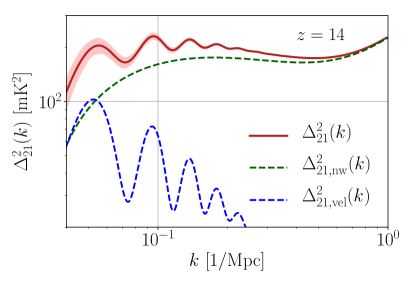
where are coefficients we fit for using simulations we discussed above. The fitted smooth spectra serve as our phenomenological model that captures the dependence of the 21-cm power spectra to the cosmological parameters. In what follows we marginalise over these coefficients in our forecasts. We model the power spectrum of the velocity as in Ref. (Muñoz, 2019b) using the form we defined in Eq. (4). We use 21cmvFAST to calculate the window function and the amplitude for a given feedback model, and calculate for a given cosmology. We calculate the relative-velocity transfer function at the end of recombination using CLASS Boltzmann solver (Blas et al., 2011), which we use as an initial condition for our simulations. We show the effect of relative velocities on the 21-cm power spectrum at redshift in Fig. 1 for the medium baryonic feedback scenario defined in 21cmFAST.
III ULAs and their effects on observables
III.1 ULA equations of motion and the density power-spectra
A coherently oscillating scalar field in a quadratic potential has an energy density that scales as and thus can behave in cosmology as DM Turner (1983). The Klein-Gordon equation is
| (8) |
where is the D’Alembertian for the cosmological spacetime, and is the axion mass. At zeroth order in cosmological perturbation theory, the solution of this equation for the field initially displaced a fixed amount from the vacuum leads to production of the ULA DM relic density via realignment Abbott and Sikivie (1983); Dine and Fischler (1983); Preskill et al. (1983); Turner (1983). At higher orders in perturbation theory, the ULA field is coupled to the gravitational potential, and undergoes structure formation. The difference between ULAs and CDM arises due to the gradient terms in , which in linear perturbation theory lead to a sound speed in the effective ULA fluid equations Khlopov et al. (1985); Hu (1998); Hu et al. (2000); Hwang and Noh (2009).
In the moving background of the DM-baryon relative velocity the ULA and baryon fluid equations are Marsh (2015)
| (9) | |||||
| (11) | |||||
| (13) |
where , is the ULA density, is the baryon density, is the ULA-baryon relative velocity, is the baryon sound-speed, and is the ULA sound-speed, is Compton interaction rate, is the CMB temperature, is the gas temperature and we include the effect of temperature fluctuations . On sub-horizon scales, the ULA sound speed is approximated as
| (14) |
We solve these equations given the initial conditions for a CDM Universe at matter-radiation equality that we compute using CLASS (Blas et al., 2011). The ULA sound speed leads to a suppression of power relative CDM (which has ). Using CDM initial conditions is not exactly accurate for ULAs, since there is already some departure from CDM at high redshift in the transfer function (see e.g. Refs. Hu et al. (2000); Hlozek et al. (2015)), however the dynamical suppression of structure for caused by the sound speed gives an accurate model at low (such an approach was taken in Refs. Schive et al. (2014); Veltmaat and Niemeyer (2016)).
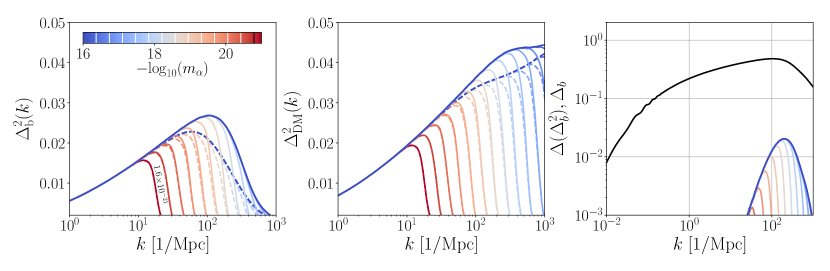
We demonstrate this suppression in clustering statistics with the power-spectra of the baryon and matter fluctuations in Fig. 2. In these figures we also show the suppression in clustering due to DM-baryon relative-velocity which increases the baryon pressure experienced by halos. While on large scales () the fluctuations of the 21-cm temperature are enhanced due to the additional VAO term (as discussed in Sec. II.2), small-scale fluctuations of density are somewhat suppressed by the relative velocities.
III.2 VAO amplitude
The amplitude of the VAO signature depends non-linearly on the small-scale brightness temperature, which is sensitive to the baryonic feedback processes and non-linear clustering on smaller scales. Similar to Ref. (Muñoz, 2019a), we can calculate the amplitude of the VAOs by defining a 21-cm relative-velocity bias in the form
| (15) |
such that the relative-velocity contribution to the 21-cm power-spectra can then be written as
| (16) |
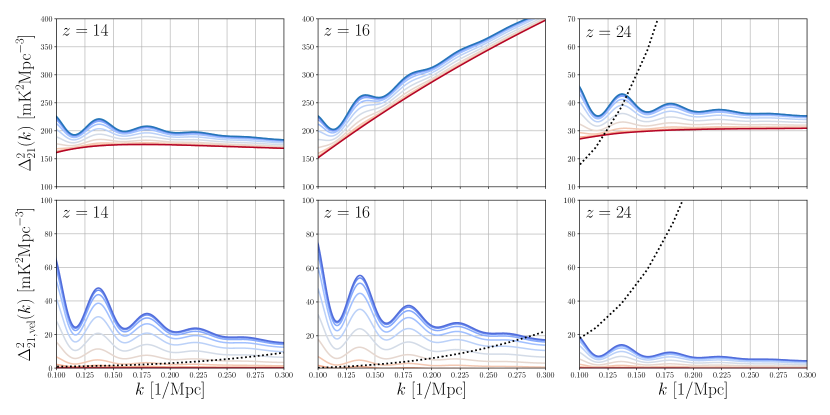
and the relative-velocity bias has the fiducial value of . In what follows, we calculate the derivative of the bias term with respect to the axion mass that appears in our forecasts using the analytical approximations up to quadratic order in density fluctuations as described in (Dalal et al., 2010; Ali-Haïmoud et al., 2014; Muñoz et al., 2018). We set the fiducial value to , which we calculate from fitting Eqs. (4) and (7) to our simulations using 21cmvFAST with no ULAs (equivalent to ). We demonstrate the effect of ULAs on the 21-cm power-spectra in Fig. 3 which lead a suppression of the quadratic contribution to the VAO amplitude. As shown in Ref. (Ali-Haïmoud et al., 2014), because the VAO signature in the 21-cm temperature fluctuations is inherently quadratic, the VAO signature in the 21-cm temperature power-spectrum amplitude , at wavenumber , ends up being sensitive to smaller scales than . This allows the VAO signature to be sensitive to small scales where ULAs suppressed the density fluctuations. ULAs cut-off the power spectrum on small scales, and remove the (higher order) modulating effect of the DM-baryon relative velocity on the small scale matter power spectrum. Thus, a cut-off in the power spectrum on smaller than the baryon smoothing scale drastically reduces the quadratic contribution to the VAO amplitude, as anticipated in Ref. Marsh (2015). This is the primary physical effect demonstrated explicitly for the first time in the present work (Fig. 3), and drives the forecasted constraints that follow.
Note that the 21-cm temperature-brightness signal at redshift 16 corresponds to the halfway point throughout the heating transition marked by large fluctuations compared to the later times (14) where -rays heat up the IGM, making the power-spectrum (and the VAO signature) smaller and less pronounced, as well as earlier times where Lyman- becomes comparable to the -ray, as demonstrated by the redshift evolution of the signal visible in Fig. 3.
In a nut-shell, the VAO feature on large scales (the velocity coherence scale) are induced by the second order modulation of the power spectrum by relative velocity on small scales (near the baryon Jeans scale). The amplitude and shape of the VAO decouple, and the amplitude can be estimated by computing the velocity bias, , in moving background perturbation theory. ULAs damp the power on scales below the axion Jeans scale. Thus, if the axion Jeans scale is larger than the baryon Jeans scale, relative velocities induce no power spectrum modulation in moving background pertrubation theory Marsh (2015), the velocity bias vanishes, and thus too do the large scale VAO.
The analytic approximation to has been shown to match the qualitative features of the relative-velocity contribution to the power-spectra while also predicting to be an lower compared to more robust calculations using 21cmvFAST simulations (Muñoz, 2019a), which capture the baryonic feedback processes and the effect of non-linear structure formation more accurately. In what follows, we marginalize over the baryonic feedback strength using our simulations to account for the former, and leave evaluating the effect of non-linear structure formation on the partial derivative to future works. Note nevertheless that our fiducial values for are robust as they are calculated from simulations.
IV Forecasts
IV.1 Experimental specifications
We take four redshift bins of size , centred at redshifts , and one redshift of size , centred at to match Ref. (Muñoz, 2019a). These choices are made to get sufficiently high SNR per redshift bin in order to detect the VAO features using experimental specifications matching HERA survey (DeBoer et al., 2017).
Foreground mitigation for the cosmological 21-cm signal is performed either via wedge suppression or avoidance444Please see Liu et al. (2014a, b) for detailed description of the EoR window and foreground wedge.. 21cmSense (Pober et al., 2013, 2014; Pober, 2016) is a python module designed to estimate the noise power spectra when a given telescope array observe the 21-cm signal via foreground avoidance. We use 21cmSense for the HERA experiment, which we describe below.
In every bin555The plane is the Fourier transform of the sky brightness distribution in a plane perpendicular to the direction of observation. Radio interferometers cannot produce an image of the sky directly, instead they make observations in the plane. the noise is calculated as,
| (17) |
where is a scalar conversion from an observed solid angle (or effective beam, ) to a comoving distance Parsons et al. (2014), is the system temperature, is the total observation time and is the three-dimensional Fourier wavenumber.
Assuming Gaussian errors on cosmic variance, we express the total uncertainty with an inversely-weighted sum across all the modes as
| (18) |
where the index, , represents multiple measurements of the same frequency from redundant baselines within the array. This is therefore the total noise, including both sample variance and thermal noise.
The foreground wedge is defined as
| (19) |
where and are the Fourier modes projected on the line-of-side and the transverse plane respectively; depends on the instrument beam, bandwidth and underlying cosmology; is the buffer zone, typically chosen as () for pessimistic (optimistic) scenarios.
We apply 21cmSense to HERA Dillon and Parsons (2016); Beardsley et al. (2015), where stations are located in a filled hexagonal grid (11 along each side). Each station is 14 in diameter giving a total collecting area of 50,953 accross a total bandwidth ranging . The antennae are taken to be at . HERA is operated only in drift scan mode for 6 hours per night. Throughout the paper we assume three years of observation with HERA.
For reference, we calculate the total SNR as equal to and the VAO SNR as equal to , summed (in quadrature) over the redshift bins we consider. Here, is the sum over binned wavenumbers and is the total uncertainly of the 21-cm spectra defined in Eq. (13). We set the -bin widths to the inverse of the cosmological bandwidth corresponding to the redshift range that can be considered co-eval as in (DeBoer et al., 2017). We find the total (over all ) detection signal-to-noise ratio (SNR) of the 21-cm signal to be , and the SNR of the VAO signature to be , for our pessimistic, moderate, optimistic foreground considerations, respectively, and for regular baryonic feedback, using HERA (DeBoer et al., 2017).
IV.2 Results
We define the information matrix as
| (20) |
and model the 21-cm power-spectra with
| (21) |
at each redshift bin we consider, where with parametrises the non-wiggle part of the 21-cm power-spectra, is the ULA mass, and is a parameter representing the sensitivity of the 21-cm power-spectra to the Lyman-Werner (LW) baryonic feedback efficiency in the 21cmFAST simulations we consider, which parametrise the formation of stars as a change of mass of cooling haloes as (Fialkov et al., 2013; Visbal et al., 2014)
| (22) |
where is the mass of cooling in the absence of LW feedback, is the LW flux, and as fitted to the simulations in Refs. (Machacek et al., 2001; Wise and Abel, 2008).
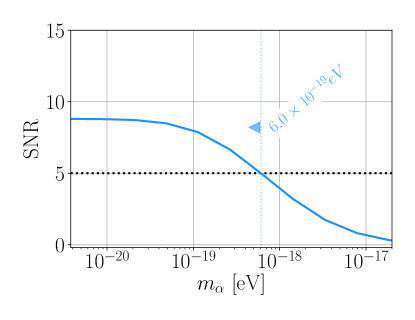
In Fig. 4, we show the total signal-to-noise (SNR) on the ULA mass from the five redshift bins defined above. The colored vertical lines indicate that ULA masses lower than will be detected with an SNR of 5 or higher. The dotted black horizontal line correspond to SNR of 5. The SNR goes to zero for high ULA mass where the effect of the ULA on the 21-cm is negligible. The SNR flattens at low masses where models with different ULA masses cannot be distinguished from each other. Here, the buffer zone is set as , corresponding to our moderate foreground scenario we describe next.
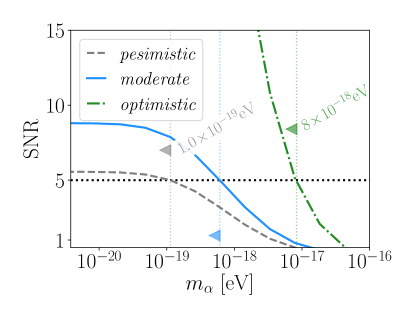
Foregrounds play an important role in determining our ability to infer cosmology from the 21-cm signal. We demonstrate how various foreground scenarios affect the constraints on the ULA mass in Fig. 5. Here, we have defined the scenario where the baselines are added incoherently, no modes are included from within the horizon wedge (and buffer zone) and as pessimistic. In the moderate scenario, the baselines are added coherently and 0.05, otherwise same as the pessimistic scenario. In the optimistic scenario, all baselines in the primary field of view (no buffer zone) are added coherently and 0.03. We find ULA masses below and will be detected to SNR of 3 or higher for the pessimistic and optimistic scenarios, respectively. The SNR exceeds 10 by in the optimistic scenario, while flattening around in the pessimistic scenario.
Another important factor when detecting the ULAs is the effect of baryonic feedback, which suppresses the VAO signature (Muñoz, 2019a). Moreover, if feedback affects the 21-cm in a similar way, we might expect the ULA mass to be somewhat degenerate with . Indeed in Fig. 6 we show that for a single redshift bin, the effect of baryonic feedback has some degeneracy with . Here, we show the contour plots from various combinations of the redshift bins. The foremost solid contour in indigo corresponds to the constraints from the redshift bin centered at . Following dashed contours corresponds to successively adding information from redshift bins centered at , with colors described in the figure caption. Innermost blue solid contour correspond to the forecasts from adding all redshift bins, matching our moderate foreground scenario. The redshift information can be seen to improve the ULA mass estimate along the degeneracy direction suggesting the degeneracy between the ULA mass and the feedback parameter at is somewhat broken.
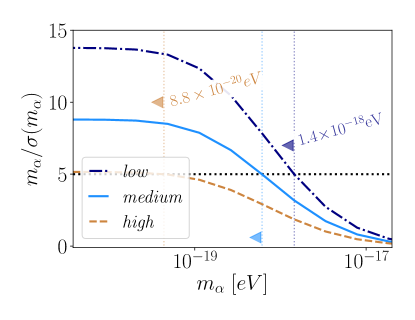
Lastly, we expect our forecasts to depend on assumptions about baryonic feedback, which affects the large-scale 21-cm spectrum by preventing smaller-mass molecular-cooling haloes to form stars, in turn the reducing the effect of relative-velocities on the 21-cm fluctuations. In Fig. 7, we show the ULA mass constraints for different feedback models defined in 21cmFAST. Indeed, lower (higher) feedback levels lead to more optimistic (pessimistic) constraints.
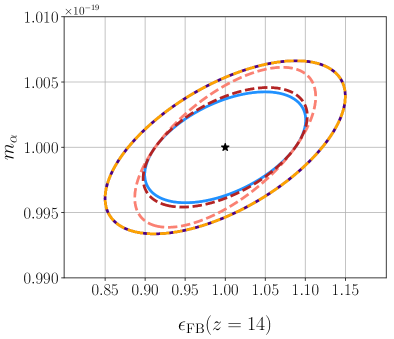
| Description of the observables | Color | |
|---|---|---|
| Indigo | ||
| Orange | ||
| Salmon | ||
| Brown | ||
| Blue | ||
V Discussion and Conclusions
Ultra-light axions (ULAs) are a well-motivated candidate to compose all or some of the dark matter and can have a wide range of particle masses. The velocity acoustic oscillation (VAO) signature in the 21-cm spectrum on large scales provides a window to test ULAs through its sensitivity to small-scale fluctuations in gas density and temperature. This signal is most pronounced during the cosmic dawn era () where the typical mass of collapsed baryonic objects falls near the critical mass below which gas pressure prevents their collapse.
We have evaluated the detection prospects of ULAs with measurements of the 21-cm fluctuations from cosmic dawn. The ongoing HERA experiment may be able to constrain ULA mass below at SNR of 5 for moderate foreground and feedback scenarios. The sensitivity weakens by a factor if the foregrounds end up more detrimental or by if the baryonic feedback strength is larger. Conversely, if the foregrounds are lower, the sensitivity can be higher by a factor of . Similarly, lower baryonic feedback can also improve the ULA sensitivity by a factor of . Improvements such as this bridge the gap between large scale existing cosmological bounds, and small-scale constraints from galaxy evolution and black-hole physics Arvanitaki and Dubovsky (2011); Marsh and Niemeyer (2019); Stott and Marsh (2018), closing the gaps in ULA parameter space Grin et al. (2019).
Much is yet unknown about the astrophysics of the cosmic dawn era. In particular, our ability to detect the VAO signature to high significance to infer cosmology depends on the baryonic feedback strength and the severity of foreground contamination. Here, we have shown how these complications affect constraints to ULAs using a simple information-matrix analysis and assuming phenomenological parameters represent the underlying cosmology and astrophysics. Going forward, we could build upon the observations made in this paper by more rigorous simulations with wider-ranging assumptions and modelling to test our predictions. Nevertheless, we foresee a bright future for the cosmological significance of the cosmic-dawn signal, and its potential role in constraining ULA mass.
VI Acknowledgements
SCH thanks T. Binnie and J. B. Muoz for useful conversations. SCH is supported by the Horizon Fellowship from Johns Hopkins University. DJEM is supported by an Ernest Rutherford Fellowship from the Science and Technologies Facilities council of the United Kingdom. This work was performed in part at Aspen Center for Physics, which is supported by National Science Foundation grant PHY-1607611, and a grant from the Simons Foundation. This work was supported at JHU in part by the Simons Foundation and by National Science Foundation grant No. 2112699.
References
- Aguirre et al. (2018) James Aguirre et al. (Simons Observatory), “The Simons Observatory: Science goals and forecasts,” (2018), arXiv:1808.07445 [astro-ph.CO] .
- Lee et al. (2019) Adrian Lee, Maximilian H. Abitbol, Shunsuke Adachi, Peter Ade, James Aguirre, Zeeshan Ahmed, Simone Aiola, Aamir Ali, David Alonso, Marcelo A. Alvarez, and et al., “The Simons Observatory,” in Bulletin of the American Astronomical Society, Vol. 51 (2019) p. 147, arXiv:1907.08284 [astro-ph.IM] .
- Abazajian et al. (2016) Kevork N. Abazajian et al. (CMB-S4), “CMB-S4 Science Book, First Edition,” (2016), arXiv:1610.02743 [astro-ph.CO] .
- Aghamousa et al. (2016) Amir Aghamousa et al. (DESI), “The DESI Experiment Part I: Science,Targeting, and Survey Design,” (2016), arXiv:1611.00036 [astro-ph.IM] .
- LSST Science Collaboration et al. (2009) LSST Science Collaboration, P. A. Abell, J. Allison, S. F. Anderson, J. R. Andrew, J. R. P. Angel, L. Armus, D. Arnett, S. J. Asztalos, T. S. Axelrod, and et al., “LSST Science Book, Version 2.0,” ArXiv e-prints (2009), arXiv:0912.0201 [astro-ph.IM] .
- DeBoer et al. (2017) David R. DeBoer et al., “Hydrogen Epoch of Reionization Array (HERA),” Publ. Astron. Soc. Pac. 129, 045001 (2017), arXiv:1606.07473 [astro-ph.IM] .
- Braun et al. (2019) Robert Braun, Anna Bonaldi, Tyler Bourke, Evan Keane, and Jeff Wagg, “Anticipated Performance of the Square Kilometre Array – Phase 1 (SKA1),” arXiv e-prints , arXiv:1912.12699 (2019), arXiv:1912.12699 [astro-ph.IM] .
- Bacon et al. (2020) David J. Bacon et al. (SKA), “Cosmology with Phase 1 of the Square Kilometre Array: Red Book 2018: Technical specifications and performance forecasts,” Publ. Astron. Soc. Austral. 37, e007 (2020), arXiv:1811.02743 [astro-ph.CO] .
- Arvanitaki et al. (2010) Asimina Arvanitaki, Savas Dimopoulos, Sergei Dubovsky, Nemanja Kaloper, and John March-Russell, “String Axiverse,” Phys. Rev. D 81, 123530 (2010), arXiv:0905.4720 [hep-th] .
- Marsh (2016) David J. E. Marsh, “Axion Cosmology,” Phys. Rept. 643, 1–79 (2016), arXiv:1510.07633 [astro-ph.CO] .
- Tseliakhovich and Hirata (2010) Dmitriy Tseliakhovich and Christopher Hirata, “Relative velocity of dark matter and baryonic fluids and the formation of the first structures,” Phys. Rev. D82, 083520 (2010), arXiv:1005.2416 [astro-ph.CO] .
- Dalal et al. (2010) Neal Dalal, Ue-Li Pen, and Uros Seljak, “Large-scale BAO signatures of the smallest galaxies,” JCAP 1011, 007 (2010), arXiv:1009.4704 [astro-ph.CO] .
- Naoz et al. (2012) Smadar Naoz, Naoki Yoshida, and Nickolay Y. Gnedin, “Simulations of Early Baryonic Structure Formation with Stream Velocity: I. Halo Abundance,” Astrophys. J. 747, 128 (2012), arXiv:1108.5176 [astro-ph.CO] .
- Greif et al. (2011) Thomas Greif, Simon White, Ralf Klessen, and Volker Springel, “The Delay of Population III Star Formation by Supersonic Streaming Velocities,” Astrophys. J. 736, 147 (2011), arXiv:1101.5493 [astro-ph.CO] .
- McQuinn and O’Leary (2012) Matthew McQuinn and Ryan M. O’Leary, “The impact of the supersonic baryon-dark matter velocity difference on the 21cm background,” Astrophys. J. 760, 3 (2012), arXiv:1204.1345 [astro-ph.CO] .
- Stacy et al. (2011) Athena Stacy, Volker Bromm, and Abraham Loeb, “Effect of Streaming Motion of Baryons Relative to Dark Matter on the Formation of the First Stars,” Astrophys. J. 730, L1 (2011), arXiv:1011.4512 [astro-ph.CO] .
- Fialkov et al. (2012) Anastasia Fialkov, Rennan Barkana, Dmitriy Tseliakhovich, and Christopher M. Hirata, “Impact of the Relative Motion between the Dark Matter and Baryons on the First Stars,” Mon. Not. Roy. Astron. Soc. 424, 1335–1345 (2012), arXiv:1110.2111 [astro-ph.CO] .
- Yoo et al. (2011) Jaiyul Yoo, Neal Dalal, and Uros Seljak, “Supersonic Relative Velocity Effect on the Baryonic Acoustic Oscillation Measurements,” JCAP 1107, 018 (2011), arXiv:1105.3732 [astro-ph.CO] .
- Pritchard and Loeb (2012) Jonathan R. Pritchard and Abraham Loeb, “21-cm cosmology,” Rept. Prog. Phys. 75, 086901 (2012), arXiv:1109.6012 [astro-ph.CO] .
- Ali-Haïmoud et al. (2014) Yacine Ali-Haïmoud, P. Daniel Meerburg, and Sihan Yuan, “New light on 21 cm intensity fluctuations from the dark ages,” Phys. Rev. D 89, 083506 (2014), arXiv:1312.4948 [astro-ph.CO] .
- Barkana (2016) Rennan Barkana, “The Rise of the First Stars: Supersonic Streaming, Radiative Feedback, and 21-cm Cosmology,” Phys. Rept. 645, 1–59 (2016), arXiv:1605.04357 [astro-ph.CO] .
- Muñoz (2019a) Julian B. Muñoz, “Robust Velocity-induced Acoustic Oscillations at Cosmic Dawn,” Phys. Rev. D100, 063538 (2019a), arXiv:1904.07881 [astro-ph.CO] .
- Muñoz (2019b) Julian B. Muñoz, “A Standard Ruler at Cosmic Dawn,” Phys. Rev. Lett. 123, 131301 (2019b), arXiv:1904.07868 [astro-ph.CO] .
- Muñoz et al. (2020) Julian B. Muñoz, Cora Dvorkin, and Francis-Yan Cyr-Racine, “Probing the Small-Scale Matter Power Spectrum with Large-Scale 21-cm Data,” Phys. Rev. D 101, 063526 (2020), arXiv:1911.11144 [astro-ph.CO] .
- Hotinli et al. (2021) Selim C. Hotinli, Thomas Binnie, Julian B. Muñoz, Bikash R. Dinda, and Marc Kamionkowski, “Probing compensated isocurvature with the 21-cm signal during cosmic dawn,” Phys. Rev. D 104, 063536 (2021), arXiv:2106.11979 [astro-ph.CO] .
- Khlopov et al. (1985) M. Khlopov, B. A. Malomed, and Ia. B. Zeldovich, “Gravitational instability of scalar fields and formation of primordial black holes,” Mon. Not. Roy. Astron. Soc. 215, 575–589 (1985).
- Marsh and Ferreira (2010) David J. E. Marsh and Pedro G. Ferreira, “Ultra-Light Scalar Fields and the Growth of Structure in the Universe,” Phys. Rev. D 82, 103528 (2010), arXiv:1009.3501 [hep-ph] .
- Li et al. (2019) Xinyu Li, Lam Hui, and Greg L. Bryan, “Numerical and Perturbative Computations of the Fuzzy Dark Matter Model,” Phys. Rev. D 99, 063509 (2019), arXiv:1810.01915 [astro-ph.CO] .
- Zhang et al. (2019) Jiajun Zhang, Hantao Liu, and Ming-Chung Chu, “Cosmological Simulation for Fuzzy Dark Matter Model,” Front. Astron. Space Sci. 5, 48 (2019), arXiv:1809.09848 [astro-ph.CO] .
- Veltmaat et al. (2020) Jan Veltmaat, Bodo Schwabe, and Jens C. Niemeyer, “Baryon-driven growth of solitonic cores in fuzzy dark matter halos,” Phys. Rev. D 101, 083518 (2020), arXiv:1911.09614 [astro-ph.CO] .
- Schwabe and Niemeyer (2022) Bodo Schwabe and Jens C. Niemeyer, “Deep Zoom-In Simulation of a Fuzzy Dark Matter Galactic Halo,” Phys. Rev. Lett. 128, 181301 (2022), arXiv:2110.09145 [astro-ph.CO] .
- Nori et al. (2019) Matteo Nori, Riccardo Murgia, Vid Iršič, Marco Baldi, and Matteo Viel, “Lyman forest and non-linear structure characterization in Fuzzy Dark Matter cosmologies,” Mon. Not. Roy. Astron. Soc. 482, 3227–3243 (2019), arXiv:1809.09619 [astro-ph.CO] .
- Mocz et al. (2019) Philip Mocz et al., “First star-forming structures in fuzzy cosmic filaments,” Phys. Rev. Lett. 123, 141301 (2019), arXiv:1910.01653 [astro-ph.GA] .
- Amendola and Barbieri (2006) Luca Amendola and Riccardo Barbieri, “Dark matter from an ultra-light pseudo-Goldsone-boson,” Phys. Lett. B 642, 192–196 (2006), arXiv:hep-ph/0509257 .
- Hui et al. (2017) Lam Hui, Jeremiah P. Ostriker, Scott Tremaine, and Edward Witten, “Ultralight scalars as cosmological dark matter,” Phys. Rev. D 95, 043541 (2017), arXiv:1610.08297 [astro-ph.CO] .
- Marsh and Hoof (2021) David J. E. Marsh and Sebastian Hoof, “Astrophysical Searches and Constraints on Ultralight Bosonic Dark Matter,” (2021), arXiv:2106.08797 [hep-ph] .
- Hlozek et al. (2015) Renée Hlozek, Daniel Grin, David J. E. Marsh, and Pedro G. Ferreira, “A search for ultralight axions using precision cosmological data,” Phys. Rev. D 91, 103512 (2015), arXiv:1410.2896 [astro-ph.CO] .
- Hlozek et al. (2018) Renée Hlozek, David J. E. Marsh, and Daniel Grin, “Using the Full Power of the Cosmic Microwave Background to Probe Axion Dark Matter,” Mon. Not. Roy. Astron. Soc. 476, 3063–3085 (2018), arXiv:1708.05681 [astro-ph.CO] .
- Laguë et al. (2021) Alex Laguë, J. Richard Bond, Renée Hložek, Keir K. Rogers, David J. E. Marsh, and Daniel Grin, “Constraining Ultralight Axions with Galaxy Surveys,” (2021), arXiv:2104.07802 [astro-ph.CO] .
- Bozek et al. (2015) Brandon Bozek, David J. E. Marsh, Joseph Silk, and Rosemary F. G. Wyse, “Galaxy UV-luminosity function and reionization constraints on axion dark matter,” Mon. Not. Roy. Astron. Soc. 450, 209–222 (2015), arXiv:1409.3544 [astro-ph.CO] .
- Schive et al. (2016) Hsi-Yu Schive, Tzihong Chiueh, Tom Broadhurst, and Kuan-Wei Huang, “Contrasting Galaxy Formation from Quantum Wave Dark Matter, DM, with CDM, using Planck and Hubble Data,” Astrophys. J. 818, 89 (2016), arXiv:1508.04621 [astro-ph.GA] .
- Corasaniti et al. (2017) P. S. Corasaniti, S. Agarwal, D. J. E. Marsh, and S. Das, “Constraints on dark matter scenarios from measurements of the galaxy luminosity function at high redshifts,” Phys. Rev. D 95, 083512 (2017), arXiv:1611.05892 [astro-ph.CO] .
- Dentler et al. (2021) Mona Dentler, David J. E. Marsh, Renée Hložek, Alex Laguë, Keir K. Rogers, and Daniel Grin, “Fuzzy Dark Matter and the Dark Energy Survey Year 1 Data,” (2021), arXiv:2111.01199 [astro-ph.CO] .
- Rogers and Peiris (2021) Keir K. Rogers and Hiranya V. Peiris, “Strong Bound on Canonical Ultralight Axion Dark Matter from the Lyman-Alpha Forest,” Phys. Rev. Lett. 126, 071302 (2021), arXiv:2007.12705 [astro-ph.CO] .
- Marsh (2015) David J. E. Marsh, “Nonlinear hydrodynamics of axion dark matter: Relative velocity effects and quantum forces,” Phys. Rev. D 91, 123520 (2015), arXiv:1504.00308 [astro-ph.CO] .
- Dalal et al. (2010) Neal Dalal, Ue-Li Pen, and Uros Seljak, “Large-scale BAO signatures of the smallest galaxies,” J. Cosm. Astropart. Phys. 2010, 007 (2010), arXiv:1009.4704 [astro-ph.CO] .
- Muñoz et al. (2018) Julian B. Muñoz, Cora Dvorkin, and Abraham Loeb, “21-cm Fluctuations from Charged Dark Matter,” Phys. Rev. Lett. 121, 121301 (2018), arXiv:1804.01092 [astro-ph.CO] .
- Furlanetto et al. (2006) Steven R. Furlanetto, S. Peng Oh, and Frank H. Briggs, “Cosmology at low frequencies: The 21 cm transition and the high-redshift Universe,” Phys. Rep. 433, 181–301 (2006), arXiv:astro-ph/0608032 [astro-ph] .
- Fialkov et al. (2014) Anastasia Fialkov, Rennan Barkana, Arazi Pinhas, and Eli Visbal, “Complete history of the observable 21 cm signal from the first stars during the pre-reionization era,” Mon. Not. R. Astron. Soc. 437, L36–L40 (2014), arXiv:1306.2354 [astro-ph.CO] .
- Loeb and Zaldarriaga (2004) Abraham Loeb and Matias Zaldarriaga, “Measuring the small - scale power spectrum of cosmic density fluctuations through 21 cm tomography prior to the epoch of structure formation,” Phys. Rev. Lett. 92, 211301 (2004), arXiv:astro-ph/0312134 .
- Wouthuysen (1952) S. A. Wouthuysen, “On the excitation mechanism of the 21-cm (radio-frequency) interstellar hydrogen emission line.” Astron. J. 57, 31–32 (1952).
- Field (1958) George B. Field, “Excitation of the Hydrogen 21-CM Line,” Proceedings of the IRE 46, 240–250 (1958).
- Hirata (2006) Christopher M. Hirata, “Wouthuysen-Field coupling strength and application to high-redshift 21 cm radiation,” Mon. Not. Roy. Astron. Soc. 367, 259–274 (2006), arXiv:astro-ph/0507102 .
- Pacucci et al. (2014) Fabio Pacucci, Andrei Mesinger, Stefano Mineo, and Andrea Ferrara, “The X-ray spectra of the first galaxies: 21 cm signatures,” Mon. Not. Roy. Astron. Soc. 443, 678–686 (2014), arXiv:1403.6125 [astro-ph.CO] .
- Pritchard and Furlanetto (2007) Jonathan R. Pritchard and Steven R. Furlanetto, “21 cm fluctuations from inhomogeneous X-ray heating before reionization,” Mon. Not. Roy. Astron. Soc. 376, 1680–1694 (2007), arXiv:astro-ph/0607234 .
- Morales and Wyithe (2010) Miguel F. Morales and J. Stuart B. Wyithe, “Reionization and Cosmology with 21 cm Fluctuations,” Ann. Rev. Astron. Astrophys. 48, 127–171 (2010), arXiv:0910.3010 [astro-ph.CO] .
- Mesinger (2017) Andrei Mesinger, “Reionization and Cosmic Dawn: theory and simulations,” IAU Symp. 333, 3–11 (2017), arXiv:1801.02649 [astro-ph.CO] .
- Wise (2019) John H. Wise, “Cosmic reionisation,” Contemp. Phys. 60, 145–163 (2019), arXiv:1907.06653 [astro-ph.CO] .
- Loeb and Furlanetto (2013) A. Loeb and S. Furlanetto, The First Galaxies in the Universe (Princeton University Press, 2013).
- Zel’Dovich (1970) Y. B. Zel’Dovich, “Gravitational instability: an approximate theory for large density perturbations.” Astron. Astrophys. 500, 13–18 (1970).
- Sheth and Tormen (1999) Ravi K. Sheth and Giuseppe Tormen, “Large-scale bias and the peak background split,” Mon. Not. R. Astron. Soc. 308, 119–126 (1999), arXiv:astro-ph/9901122 [astro-ph] .
- Seager et al. (2011) Sara Seager, Dimitar D. Sasselov, and Douglas Scott, “RECFAST: Calculate the Recombination History of the Universe,” (2011), ascl:1106.026 .
- Mesinger et al. (2011) Andrei Mesinger, Steven Furlanetto, and Renyue Cen, “21CMFAST: a fast, seminumerical simulation of the high-redshift 21-cm signal,” Mon. Not. R. Astron. Soc. 411, 955–972 (2011), arXiv:1003.3878 [astro-ph.CO] .
- Murray et al. (2020) Steven G. Murray, Bradley Greig, Andrei Mesinger, Julian B. Muñoz, Yuxiang Qin, Jaehong Park, and Catherine A. Watkinson, “21cmFAST v3: A Python-integrated C code for generating 3D realizations of the cosmic 21cm signal,” J. Open Source Softw. 5, 2582 (2020), arXiv:2010.15121 [astro-ph.IM] .
- Tseliakhovich et al. (2011) Dmitriy Tseliakhovich, Rennan Barkana, and Christopher Hirata, “Suppression and Spatial Variation of Early Galaxies and Minihalos,” Mon. Not. Roy. Astron. Soc. 418, 906 (2011), arXiv:1012.2574 [astro-ph.CO] .
- Blas et al. (2011) Diego Blas, Julien Lesgourgues, and Thomas Tram, “The Cosmic Linear Anisotropy Solving System (CLASS). Part II: Approximation schemes,” J. Cosm. Astropart. Phys. 2011, 034 (2011), arXiv:1104.2933 [astro-ph.CO] .
- Turner (1983) Michael S. Turner, “Coherent Scalar Field Oscillations in an Expanding Universe,” Phys. Rev. D 28, 1243 (1983).
- Abbott and Sikivie (1983) L. F. Abbott and P. Sikivie, “A Cosmological Bound on the Invisible Axion,” Phys. Lett. B 120, 133–136 (1983).
- Dine and Fischler (1983) Michael Dine and Willy Fischler, “The Not So Harmless Axion,” Phys. Lett. B 120, 137–141 (1983).
- Preskill et al. (1983) John Preskill, Mark B. Wise, and Frank Wilczek, “Cosmology of the Invisible Axion,” Phys. Lett. B 120, 127–132 (1983).
- Hu (1998) Wayne Hu, “Structure formation with generalized dark matter,” Astrophys. J. 506, 485–494 (1998), arXiv:astro-ph/9801234 .
- Hu et al. (2000) Wayne Hu, Rennan Barkana, and Andrei Gruzinov, “Cold and fuzzy dark matter,” Phys. Rev. Lett. 85, 1158–1161 (2000), arXiv:astro-ph/0003365 .
- Hwang and Noh (2009) Jai-chan Hwang and Hyerim Noh, “Axion as a Cold Dark Matter candidate,” Phys. Lett. B 680, 1–3 (2009), arXiv:0902.4738 [astro-ph.CO] .
- Schive et al. (2014) Hsi-Yu Schive, Tzihong Chiueh, and Tom Broadhurst, “Cosmic Structure as the Quantum Interference of a Coherent Dark Wave,” Nature Phys. 10, 496–499 (2014), arXiv:1406.6586 [astro-ph.GA] .
- Veltmaat and Niemeyer (2016) Jan Veltmaat and Jens C. Niemeyer, “Cosmological particle-in-cell simulations with ultralight axion dark matter,” Phys. Rev. D 94, 123523 (2016), arXiv:1608.00802 [astro-ph.CO] .
- Liu et al. (2014a) Adrian Liu, Aaron R. Parsons, and Cathryn M. Trott, “Epoch of reionization window. I. Mathematical formalism,” Phys. Rev. D 90, 023018 (2014a), arXiv:1404.2596 [astro-ph.CO] .
- Liu et al. (2014b) Adrian Liu, Aaron R. Parsons, and Cathryn M. Trott, “Epoch of reionization window. II. Statistical methods for foreground wedge reduction,” Phys. Rev. D 90, 023019 (2014b), arXiv:1404.4372 [astro-ph.CO] .
- Pober et al. (2013) Jonathan C. Pober, Aaron R. Parsons, David R. DeBoer, Patrick McDonald, Matthew McQuinn, et al., “The Baryon Acoustic Oscillation Broadband and Broad-beam Array: Design Overview and Sensitivity Forecasts,” Astron. J. 145, 65 (2013), arXiv:1210.2413 [astro-ph.CO] .
- Pober et al. (2014) Jonathan C. Pober et al., “What Next-Generation 21 cm Power Spectrum Measurements Can Teach Us About the Epoch of Reionization,” Astrophys. J. 782, 66 (2014), arXiv:1310.7031 [astro-ph.CO] .
- Pober (2016) Jonathan Pober, “21cmSense: Calculating the sensitivity of 21cm experiments to the EoR power spectrum,” (2016), ascl:1609.013 .
- Parsons et al. (2014) Aaron R. Parsons, Adrian Liu, et al., “New Limits on 21 cm Epoch of Reionization from PAPER-32 Consistent with an X-Ray Heated Intergalactic Medium at ,” Astrophys. J. 788, 106 (2014), arXiv:1304.4991 [astro-ph.CO] .
- Dillon and Parsons (2016) Joshua S. Dillon and Aaron R. Parsons, “Redundant Array Configurations for 21 cm Cosmology,” Astrophys. J. 826, 181 (2016), arXiv:1602.06259 [astro-ph.IM] .
- Beardsley et al. (2015) A. P. Beardsley, M. F. Morales, A. Lidz, M. Malloy, and P. M. Sutter, “Adding Context to James Webb Space Telescope Surveys with Current and Future 21 cm Radio Observations,” Astrophys. J. 800, 128 (2015), arXiv:1410.5427 [astro-ph.CO] .
- Fialkov et al. (2013) Anastasia Fialkov, Rennan Barkana, Eli Visbal, Dmitriy Tseliakhovich, and Christopher M. Hirata, “The 21-cm signature of the first stars during the Lyman-Werner feedback era,” Mon. Not. R. Astron. Soc. 432, 2909–2916 (2013), arXiv:1212.0513 [astro-ph.CO] .
- Visbal et al. (2014) Eli Visbal, Zoltán Haiman, Bryan Terrazas, Greg L. Bryan, and Rennan Barkana, “High-redshift star formation in a time-dependent Lyman–Werner background,” Mon. Not. Roy. Astron. Soc. 445, 107–114 (2014), arXiv:1402.0882 [astro-ph.CO] .
- Machacek et al. (2001) Marie E. Machacek, Greg L. Bryan, and Tom Abel, “Simulations of pregalactic structure formation with radiative feedback,” Astrophys. J. 548, 509 (2001), arXiv:astro-ph/0007198 .
- Wise and Abel (2008) John H. Wise and Tom Abel, “Resolving the Formation of Protogalaxies. 3. Feedback from the First Stars,” Astrophys. J. 685, 40 (2008), arXiv:0710.3160 [astro-ph] .
- Arvanitaki and Dubovsky (2011) Asimina Arvanitaki and Sergei Dubovsky, “Exploring the String Axiverse with Precision Black Hole Physics,” Phys. Rev. D 83, 044026 (2011), arXiv:1004.3558 [hep-th] .
- Marsh and Niemeyer (2019) David J. E. Marsh and Jens C. Niemeyer, “Strong Constraints on Fuzzy Dark Matter from Ultrafaint Dwarf Galaxy Eridanus II,” Phys. Rev. Lett. 123, 051103 (2019), arXiv:1810.08543 [astro-ph.CO] .
- Stott and Marsh (2018) Matthew J. Stott and David J. E. Marsh, “Black hole spin constraints on the mass spectrum and number of axionlike fields,” Phys. Rev. D 98, 083006 (2018), arXiv:1805.02016 [hep-ph] .
- Grin et al. (2019) Daniel Grin, Mustafa A. Amin, Vera Gluscevic, Renée Hlǒzek, David J. E. Marsh, Vivian Poulin, Chanda Prescod-Weinstein, and Tristan L. Smith, “Gravitational probes of ultra-light axions,” (2019), arXiv:1904.09003 [astro-ph.CO] .